hydraulic report - river hydraulics | william j. mullen ... pdfs/hix bridge.pdf · executive...
TRANSCRIPT


HYDRAULIC REPORT
for Massachusetts Highway Department
Bridge Replacement Project for Bridge No. W-30-2
Hix Bridge Road over the East Branch Westport River, Westport, Massachusetts
Looking downstream at Hix Bridge Road
May 1997
Prepared by:
Lamson Engineering Corporation
259 Walnut Street
Newton, Massachusetts 02160
Tel: (617) 558-0101

TABLE OF CONTENTS
A. EXECUTIVE SUMMARY
B. PROJECT DESCRIPTION
C. DATA COLLECTION
D. ENGINEERING METHODS
E. CONCLUSIONS AND RECOMMENDATIONS
F. REFERENCES
APPENDICES
Appendix 1 - Crossing Site Catchment
2 - River Cross Section Layout Plan
3 - Field Evaluation Forms
4 - Hydrologic Computations
5 - Hydraulic Computations
6 - Photographs and Index
7 - Flood Insurance Study - Town of Westport

EXECUTIVE SUMMARY
1. Purpose
This hydraulic report is part of Lamson Engineering Corporation’s submittal to the
Massachusetts Highway Department for the reconstruction of Bridge No. W-30-2. The purpose
of the report is to perform hydrologic studies, hydraulic analyses and a scour evaluation of both
the existing and the proposed bridge at the project site.
2. Project Site
Bridge No. W-30-2 is located on Hix Bridge Road over the East Branch Westport River in the
Town of Westport, Bristol County, Massachusetts. The bridge is located approximately 6.4 km
up the tidal estuary known as the East Branch Westport River (approximately halfway up the
estuary). The East Branch Westport River estuary lies entirely within the town of Westport in
Bristol County in the southwest corner of Massachusetts, adjacent to the state of Rhode Island.
Horseneck Beach, consisting of dune sand and gravel, forms the southern boundary of this
estuary. The upstream end of the East Branch is at an area known as the Head of Westport (at
Old County Road). The East Branch Westport River is shown in its entirety on the US
Geological Survey’s Westport, Mass.-R.I. quadrangle (Ref. _ ), at a scale of 1:24,000.
3. Methodology
The report and analyses are prepared in accordance with the Department’s “Guidance for
Preparation of Hydrologic/Hydraulic Studies” for the Federal-Aid Non-National Highway
System Bridge R&R Program. The report has been prepared in metric units.
4. Existing Bridge
The existing bridge carries one lane of traffic in each direction, and provides a route between
State Route 88 to the west and South Westport to the east and beyond. The bridge consists of
pavement on a concrete slab supported by 10 rows of columns (piers). Eight of the rows of
columns have five parallel columns, the other two rows have twelve columns. Width of the
columns vary from 0.6 to 1.2 meters (m). The total length of the bridge is 95.4 m from the left to
right abutments. The width of the bridge in the direction of the tidal flow is 9.1 m. The bridge
has concrete railings on both sides for its entire length as well as jersey barriers on its upstream
end in order to protect fishermen and pedestrians. The bridge is at an approximate 90 degree
angle in relation to the flow of the estuary.
The clear vertical clearance of the bridge above the water surface varies with the tide. Since the
bridge deck varies from a low chord elevation of 1.65 m NGVD at its west end to 2.41 m NGVD
on the east (right bank looking upstream), at mean high water (0.64 m NGVD), the vertical
clearance ranges from 1.01 m at its west end to 1.77 m at its east end.
5. Existing Condition Survey
The bridge piers are in varying states of condition. The riprap skirting the west and east ends of
the bridge shows no signs of erosion. A survey by the Massachusetts Division of Highways in
September of 1995 notes that the gravel bottom of the estuary upstream, under, and downstream
of the bridge is eroding.
6. Hydrologic Analyses
Although it is recognized that both the normal and the highest (peak) elevations are tidally
controlled, the flow from the freshwater drainage was estimated based upon its drainage area.
The size of the crossing site catchment is 134 square kilometers (51.7 square miles according to
Ref. ___) and the peak discharges for floods of various recurrence intervals have been
established using methodology described in ???. The estimated peak flows are:
Peak Discharge (cu. meters/sec)
10-year 25-year 50-year 100-year
The East Branch Westport River is known to be tidally controlled at the Hix Road Bridge.

7. Hydraulic Analyses
8. Scour Evaluation
9. Summary and Recommendations

B. PROJECT DESCRIPTION
B.1 Background Description
As part of the Massachusetts Highway Department’s Bridge Replacement and Rehabilitation
Program, Bridge No. W-30-2, located on Hix Bridge Road over the East Branch Westport River in
the Town of Westport, Bristol County, Massachusetts, is to be replaced.
A Hydraulic Report, included in the Consultant’s Specific Scope of Work, is required to be prepared
for this project due to the presence of the bridge over a waterway. This report was prepared to fulfill
this requirement.
B.2 Purpose
The purpose of this report is to evaluate the existing hydraulic conditions of this bridge according to
the Massachusetts Highway Department’s “Guidance for Preparation of Hydrologic/Hydraulic
Studies for Federal-Aid Non-National Highway System Bridge R&R Program”. This report is
prepared mainly in metric units.
The report includes data collection and engineering methods for hydrological, hydraulic, and scour
analyses. Hydrologic analyses are performed to determine the peak tide elevations, then hydraulic
analyses performed to determine the hydraulic characteristics at the bridge site, including estuary
water velocities. A scour susceptibility evaluation is then conducted to assess the bridge
undermining potential. Proposed countermeasures are presented if needs arise.
The results of these studies are then used to evaluate and determine the required size of the waterway
opening at the bridge’s crossing, as well as any needed scour protection measures in the vicinity of
the proposed bridge location. The data collected, the procedures of the analyses, and a discussion of
scour are presented in the subsequent sections of this report.
B.3 Scope of Work
The scope of work includes the following:
Perform site visits and field observations.
Search and review the available data.
Conduct hydrologic studies.
Perform hydraulic analyses.
Evaluate scour potential.
B.4 Project Location
Bridge No. W-30-2 is located on Hix Bridge Road over the East Branch Westport River in the Town
of Westport, Massachusetts. The bridge is located 6.4 kilometers up (approximately halfway up) the
tidal estuary known as the East Branch Westport River. The Westport River estuary (East and West
Branches) in Bristol County is located in the southeast corner of Massachusetts, and lies entirely
within the town of Westport, adjacent to the state of Rhode Island. Horseneck Beach, consisting of
dune sand and gravel, forms the southern boundary of this estuary. The upstream end of the East
Branch is at an area known as the Head of Westport (at Old County Road). The East Branch
Westport River is shown in its entirety on the US Geological Survey’s Westport, Mass.-R.I. metric
topgraphic map, at a scale of 1:25,000.
C. DATA COLLECTION
C.1 General
As part of the effort to prepare this report, existing conditions and the history of the site must be
investigated. This can be achieved by locating and reviewing available reports and data, and through
site visits.
During the course of the site visits, field observations are made, physical dimensions are measured
(in this case by the Mass. Highway Dept. and by Universal Engineering Corp.), and photos are taken.
The contributing drainage basin is also visited to assess its nature.
C.2 Available Information
1. Flood Insurance Study
The Federal Emergency Management Agency (FEMA) produced a report entitled Flood Insurance
Study (FIS), Town of Westport, MA, dated September 18, 1984. The FIS provides peak tidal
elevations for both the downstream and upstream ends of the East Branch Westport River. Hix
Bridge crosses the estuary approximately halfway between the two locations where elevations are
determined.
2. Department’s Record
The Mass. Highway Department provided field notes documenting a site visit to the Hix Bridge Road
bridge by G. Parker on September 20, 1995. Scour observations were made in the vicinity of the
bridge. Depths from the low chord of the bridge to the bed of the estuary were measured.
3. Other Studies
Army Corps of Engineers Tidal Profiles for the New England Coastline dated September 1988
provided tidal information for various recurrence intervals at Westport (open ocean) as well as high
watermarks for various hurricane events.
4. Maps
A soundings map published by the Department of Commerce, National Oceanic and Atmospheric
Administration, National Ocean Service Chart No. 13228, Westport River and Approaches, 1:20,000
scale, 10th Edition, May 11, 1996, was used to obtain below water topographic information. Above
water cross-section information was obtained from the US Geological Survey, Westport, Mass.-R.I.
1:24,000 scale topographic map, 10-foot contour interval, 1977. Additional information on how
these maps were used is provided in Section D.2.4 of this report.

C.3 Results of Field Observations and Field Survey
The results of field observations taken on the site visit are presented herein. Photographs taken
during the site visit are presented in Appendix 6 of this report.
1. Hix Bridge Road
The existing two lane road provides a route between State Route 88 to the west and South Westport
to the east.
2. Hix Bridge Road (bridge)
The existing Hix Bridge Road bridge over the East Branch Westport River, henceforth referred in
this report as Hix Bridge, carries one lane of traffic in each direction. The bridge consists of
pavement on a concrete slab supported by 10 rows of columns (piers). The number of columns in
each row varies from five to twelve. Width of the columns vary from 0.6 to 1.2 meters (m). The
length of the bridge is 95.1 m from the left to right abutments as measured by Mass. Highway
personnel. The width of the bridge in the direction of the tidal flow is 9.1 m. The bridge has
concrete railings on both sides for its entire length as well as jersey barriers, parallel to the railings,
on its upstream end in order to provide a safe walkway for fishermen and pedestrians. This bridge
was reportedly constructed in 1938 upon the washout of the previous bridge in that location during
the 1938 hurricane.
The clear vertical clearance of the bridge above the water surface varies with the tide. The bridge
deck varies from a low chord elevation of 1.65 m above the National Geodetic Vertical Datum
(NGVD, formerly known as the mean sea level datum of 1929) at its west end to 2.41 m NGVD at its
east end (right bank looking upstream). At mean high water (0.64 m NGVD), the vertical clearance
ranges from 1.01 m at its west end to 1.77 m at its east end.
The bridge’s low chord elevation is at an average of 2.03 m above NGVD, while the top chord
elevation, neglecting the concrete railing, is at an average of 3.69 m above NGVD.
3. Embankments
The embankments of this bridge are earthen fill. The embankments on both the east and west sides
of the bridge approach encroach upon the floodplain of the East Branch Westport River.
4. Abutments and Wingwalls
The abutments are sloping with concrete stubs on top of exposed bents at the top. The slopes are
protected by number 3 sized stone riprap. There are no wingwalls either on the upstream or
downstream ends of the bridge.

D. ENGINEERING METHODS
D.1 HYDROLOGIC ANALYSES
D.1.1 Purpose
The purpose of these analyses is typically to establish the peak discharge corresponding to the
selected recurrence intervals for the proposed bridge reconstruction project. However, because peak
water surfaces at Hix Bridge are controlled by ocean tides, peak tidal water surface elevations are
determined instead (of peak discharges). Peak discharges from freshwater sources are presented
below for informational purposes only.
D.1.2 Drainage Basin
The size of the crossing site catchment at Hix Bridge is 134 square kilometers (51.7 square miles,
Ref.11). Development along the East Branch Westport River and its tributaries is sparse with
scattered farms and residences located along its shores. The larger tributary streams are Bread and
Cheese Brook, Kirby Brook and Snell Creek which drain much of northern Westport. The drainage
basin boundary, plotted on the US Geological Survey’s 1:250,000 scale Providence, R.I., Mass.,
Conn., NY 100-foot contour interval topographic map (revised 1969) is shown in Appendix 1.
D.1.3 Hydrologic Methodology
The Flood Insurance Study (FIS) for Westport notes that the highest (peak) water surfaces for the
East Branch Westport River estuary, including at Hix Bridge, are tidally produced, and the
freshwater drainage has minor impact in the range of frequencies we are examining. Freshwater
flows are therefore provided for informational purposes only. Regression equations given for
Eastern Massachusetts, including the Coastal River Basins, in U.S. Geological Survey Open File
Report 80-676 (Ref. 15) were used to estimate the peak freshwater flows. The estimated peak flows
are as follows:
TABLE 1 - FRESHWATER RUNOFF PEAK DISCHARGES AT HIX BRIDGE FOR
VARIOUS RECURRENCE INTERVALS
Peak Discharge (cu. meters/sec)
10-year 25-year 50-year 100-year
27.6 35.7 42.6 50.2
The freshwater runoff peak flows presented in Table 1 are only a few percent of the tidal flows (not
elevations) determined by the hydraulic model (refer to Section D.2.4) for the range of floods
studied. For example, the 100-year freshwater peak flow is only 5.2% of the tidal flow for the 100-
year event) as determined by the hydraulic model. In addition, determining coincident frequencies of
100-year rainfall events and 100-year tidal elevations (or for other recurrence intervals) is beyond the
scope of this job. Freshwater runoff is therefore ignored in the hydraulic model. Only tidal flows are
examined.

The FIS provides peak water surface elevations for the open ocean and both the upper and lower
ends of the East Branch Westport River estuary, with peak elevations caused by storm (hurricane)
tides. The elevations at either end of the estuary are nearly identical for the recurrence intervals
presented (peak water surface elevations are actually slightly higher at the upstream end of the
estuary for the range of floods studied). As the FIS states, “coastal storm surges within the range
studied were not significantly modified within Westport Harbor or the West Branch and East Branch
Westport River estuaries The peak elevations at both the open ocean and the downstream end of the
East Branch Westport River from the FIS are as follows:

TABLE 2 - PEAK TIDAL ELEVATION FOR VARIOUS RECURRENCE INTERVALS
FOR WESTPORT (OPEN OCEAN AND AT THE DOWNSTREAM END OF THE EAST
BRANCH WESTPORT RIVER) BASED ON FIS INFORMATION
Peak Elevations (meters above
NGVD)
10-year 25-year 50-year 100-year 500-year
2.41 NA 3.32 3.75 4.69
The U.S. Army Corps of Engineers tidal profiles (Ref. 1) also provide peak tide elevations for the
open ocean portion of Westport (statute mile 152+00). These elevations are summarized as follows:
TABLE 3 - PEAK TIDAL ELEVATION FOR VARIOUS RECURRENCE INTERVALS FOR
WESTPORT (OPEN OCEAN) BASED ON CORPS OF ENGINEERS INFORMATION
Peak Elevation (meters above
NGVD)
10-year 25-year 50-year 100-year Std Proj
Hurricane*
1.95 NA 3.11 3.72 4.72
* the Standard Project Hurricane is assumed to be a 500-year event in this report
Note that there are differences between the Corps tidal elevations and those provided in the FIS,
particularly at the 10- and 50-year events. Investigation into the cause of this discrepancy indicated
that the elevations provided in FIS were based upon a shorter period of record (for the nearby New
Bedford Harbor tide gage) than that used by the Corps in its 1988 tidal profiles report which updated
January 1980 tidal profiles. The Corps information was based upon an additional 18 years of record,
with the gage analysis period of record ending in 1978, versus 1960 used in the FIS. Because the
Corps hydrology was based upon a longer period of record, the Corps data shown in Table 3 was
adopted for use in the hydraulic model developed for the Hix Bridge.
D.1.3.4 Discussion of Findings
The maximum water levels at Hix Bridge occur due to high tidal surges, not freshwater runoff
events. Tidal elevations presented in Table 3 (from Army Corps of Engineers Tidal Flood Profiles)
are adopted for use in the hydraulic model of the East Branch Westport River estuary.
D.1.4 Design Criteria
The 10-year recurrence interval tidal flood has been selected as the design flood based upon the
design storm guidelines presented in the Massachusetts Highway Department’s Hydraulic Design
Criteria Appendix B.
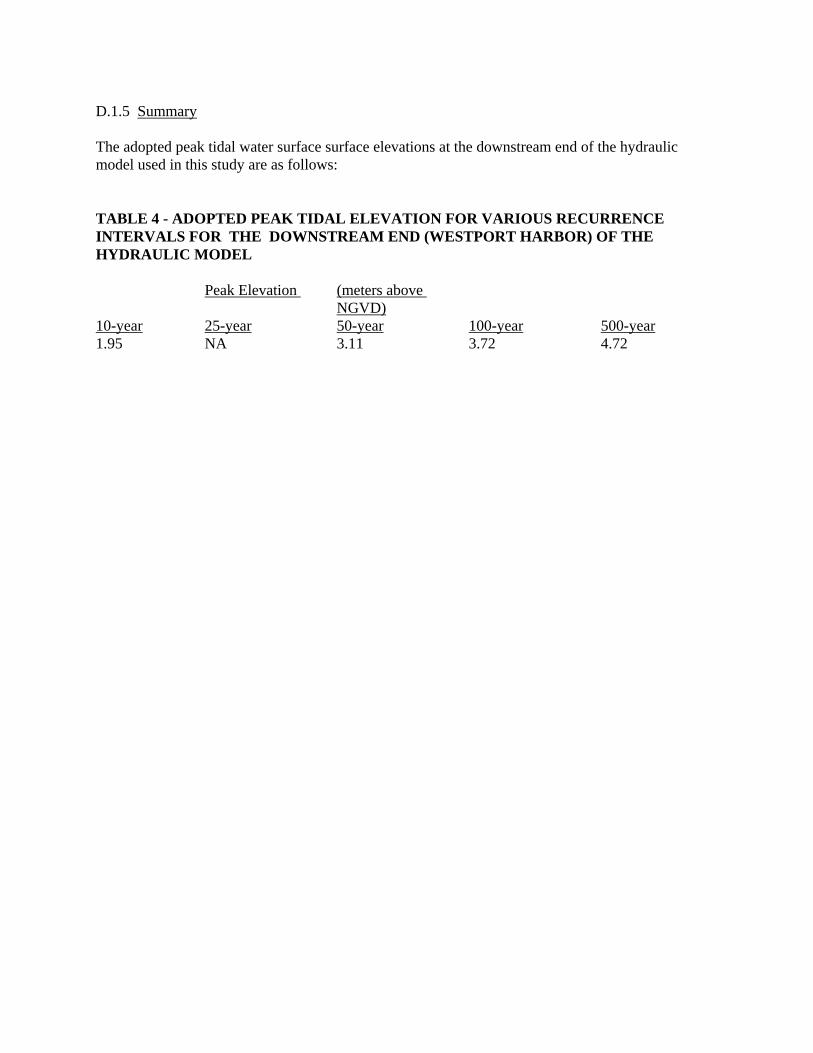
D.1.5 Summary
The adopted peak tidal water surface surface elevations at the downstream end of the hydraulic
model used in this study are as follows:
TABLE 4 - ADOPTED PEAK TIDAL ELEVATION FOR VARIOUS RECURRENCE
INTERVALS FOR THE DOWNSTREAM END (WESTPORT HARBOR) OF THE
HYDRAULIC MODEL
Peak Elevation (meters above
NGVD)
10-year 25-year 50-year 100-year 500-year
1.95 NA 3.11 3.72 4.72
D.2 HYDRAULIC ANALYSES
D.2.1 Purpose
The purpose of these analyses is to determine the hydraulic characteristics at the bridge site so that
the required bridge opening and the scour potential can be determined.
D.2.2 Calculation Method
The Massachusetts Highway Department suggested that the DOS-based DYNLET computer model
(version 2.01) be used to evaluate the hydraulic conditions at the Hix Bridge. The DYNLET model
was developed by Amein and Associates of Raleigh, North Carolina under contract to the U.S. Army
Corps of Engineers Waterways Experiment Station (WES) Coastal Engineering Research Center
(CERC). The model is capable of simulating one-dimensional (1-D) fluid flow from the ocean
through a tidal inlet, into back bay regions, and up tributaries. An important feature of the model is
the ability to represent an accurate flow distribution across any cross-section simulating the two-
dimensional flow field. This yields the required water velocity information for scour analyses. The
model is ideal for determining the impacts of changing pier and bridge deck scenarios to water
surface elevations on either side of the bridge (based upon physical parameters). The model accounts
for the bridge deck by increasing wetted perimeter, and it subtracts the submerged area of the bridge
from the flow area. The DYNLET model has been tested by the US Federal Highway
Administration.
The DYNLET model appears to be similar to the one-dimensional storm surge model used to
determine the inland propagation of the coastal storm surge up the East Branch Westport River in the
FIS for the Town of Westport.
D.2.3 Assumptions
1. Wave actions may be ignored, as they were in the Flood Insurance Study model. Inspection of
the U.S. Geological Survey topographic map for Westport indicates that Hix Bridge is protected
from receiving the brunt of wave forces and therefore is not in a V-zone, the area of the 100-year
coastal flood with wave action. This is because the fetch length over which the wind can blow
and waves be generated is quite short. (Note: this is not the case for Cadman Cove, lying 3500
feet southeast of the bridge, which may receive the full force of southerly winds).
2. Freshwater runoff does not have to be added to the peak tides.
3. Unobstructed flow at the bridge is assumed, i.e. no logs or other debris block the flow of water
under the bridge.
4. The increase in flow through the bridge when the water surface is higher than the low beam may
be neglected (the DYNLET model ignores pressure flow).
5. The impacts of the bridge’s guard rail and jersey barrier on water surface elevations can be
neglected.
D.2.4 Analyses

As stated above, the DYNLET one-dimensional flow model was used to model hydraulics in the
vicinity of Hix Bridge. Cross-sections for input into the DYNLET model for downstream and
upstream of the bridge were generated by combining information from two sources: the National
Ocean Service (NOS) hydrographic chart No. 13228 entitled “Westport River and Approaches”,
scale 1:20,000 (Ref. 3) for the below water portions and the U.S. Geological Survey’s 1:24,000 scale
Westport, Mass.-R.I. 10-foot contour interval topographic map (Ref. 12) for the above water
portions. Adjustments to the NOS elevations were made since the NOS chart datum is soundings in
feet at Mean Lower Low Water (in this area, it is only 0.03 m (0.1 foot) below Mean Low Water).
All NOS soundings were converted to elevations above NGVD for input to the model. No
conversion was needed for the data taken from the U.S. Geological Survey maps since it was already
in NGVD datum.
The bridge cross-section was obtained by merging information from two sources. Channel bottom
information was obtained from Mass. Division of Highways depth measurements (low chord of
bridge to bottom of channel) of September 1995. An adjustment was made to account for the fact
that the bridge is not perfectly level. Top of bridge information along the road centerline was
obtained from Universal Engineering Corporation’s Hix Bridge Road Repair Project plans (Ref. 9).
A plot of the existing bridge cross-section is shown in Fig. 1.
Cross-sections were located where there were significant changes in geometric properties (see
Appendix 2 for cross-section locations). Cross-sections were located the full length of the East
Branch Westport River and were oriented looking upstream, i.e. up the estuary, for input to the
model. Roughness coefficients for each point of the cross-sections were estimated based upon
inspection of the U.S. Geological Survey maps, with a minimum Manning’s roughness coefficient of
0.03 used.
The model was set up in English units rather than metric for a number of reasons. The hydraulic
modeler was more comfortable with English units, and tide data, the bridge survey (by Mass.
Highway Dept.), and the NOS and US Geological Survey maps used were in English units. Model
results were converted to metric for presentation in this report.
High water mark information for calibration was unavailable except for that indicated on the Corps
of Engineers tidal flood profiles for the September 21, 1938 hurricane, roughly a 100-year event on
the open ocean. The 1938 high water marks at Hix Bridge were roughly 1.2 m lower than that of the
open ocean. This appears to be low for a number of reasons: 1. winds were reportedly blowing
directly north, pushing water up the estuary; 2. The 1938 hurricane was responsible for the
complete washout and failure of Hix Bridge (see photo of bridge washout); 3. the FIS indicates that
peak flood elevations up and down the estuary are all roughly the same. It appears possible that the
benchmark used in surveying the high water marks was invalid. An attempt to obtain backup
information on the 1938 high watermark data was unsuccessful. The 1938 data was therefore not
used for model calibration.
Mr. Richard Earle, the Harbormaster for Westport Harbor, was unable to provide any additional high
watermark data up the estuary. Mr. Earle does not believe that the bridge or the estuary constricts
peak water surface elevations in any way, a belief supported by the field inspection findings. (Mr.
Earle also noted that the Horseneck Beach Bridge, at the entrance to the East Branch Westport River
and the only other bridge between the open ocean and Hix Bridge, does not constrict flows).
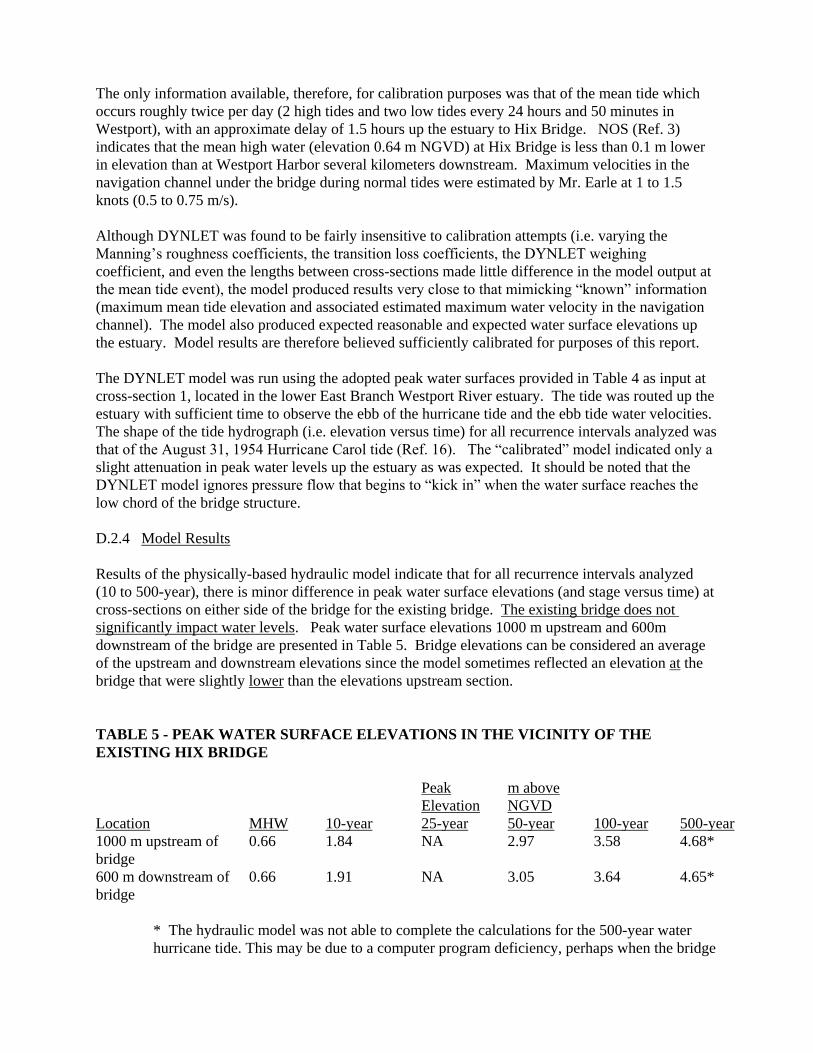
The only information available, therefore, for calibration purposes was that of the mean tide which
occurs roughly twice per day (2 high tides and two low tides every 24 hours and 50 minutes in
Westport), with an approximate delay of 1.5 hours up the estuary to Hix Bridge. NOS (Ref. 3)
indicates that the mean high water (elevation 0.64 m NGVD) at Hix Bridge is less than 0.1 m lower
in elevation than at Westport Harbor several kilometers downstream. Maximum velocities in the
navigation channel under the bridge during normal tides were estimated by Mr. Earle at 1 to 1.5
knots (0.5 to 0.75 m/s).
Although DYNLET was found to be fairly insensitive to calibration attempts (i.e. varying the
Manning’s roughness coefficients, the transition loss coefficients, the DYNLET weighing
coefficient, and even the lengths between cross-sections made little difference in the model output at
the mean tide event), the model produced results very close to that mimicking “known” information
(maximum mean tide elevation and associated estimated maximum water velocity in the navigation
channel). The model also produced expected reasonable and expected water surface elevations up
the estuary. Model results are therefore believed sufficiently calibrated for purposes of this report.
The DYNLET model was run using the adopted peak water surfaces provided in Table 4 as input at
cross-section 1, located in the lower East Branch Westport River estuary. The tide was routed up the
estuary with sufficient time to observe the ebb of the hurricane tide and the ebb tide water velocities.
The shape of the tide hydrograph (i.e. elevation versus time) for all recurrence intervals analyzed was
that of the August 31, 1954 Hurricane Carol tide (Ref. 16). The “calibrated” model indicated only a
slight attenuation in peak water levels up the estuary as was expected. It should be noted that the
DYNLET model ignores pressure flow that begins to “kick in” when the water surface reaches the
low chord of the bridge structure.
D.2.4 Model Results
Results of the physically-based hydraulic model indicate that for all recurrence intervals analyzed
(10 to 500-year), there is minor difference in peak water surface elevations (and stage versus time) at
cross-sections on either side of the bridge for the existing bridge. The existing bridge does not
significantly impact water levels. Peak water surface elevations 1000 m upstream and 600m
downstream of the bridge are presented in Table 5. Bridge elevations can be considered an average
of the upstream and downstream elevations since the model sometimes reflected an elevation at the
bridge that were slightly lower than the elevations upstream section.
TABLE 5 - PEAK WATER SURFACE ELEVATIONS IN THE VICINITY OF THE
EXISTING HIX BRIDGE
Peak
Elevation
m above
NGVD
Location MHW 10-year 25-year 50-year 100-year 500-year
1000 m upstream of
bridge
0.66 1.84 NA 2.97 3.58 4.68*
600 m downstream of
bridge
0.66 1.91 NA 3.05 3.64 4.65*
* The hydraulic model was not able to complete the calculations for the 500-year water
hurricane tide. This may be due to a computer program deficiency, perhaps when the bridge

is completely submerged. Elevations for the 500-year recurrence interval presented are
based upon a model run with no bridge in place. Due to the bridge’s apparent very minor
impact on peak water surface elevations at other recurrence intervals, this appears
reasonable.
Results may be compared to a number of key bridge elevations. The bridge’s low deck elevation
averages 2.03 m above NGVD, and the top chord elevation, neglecting the concrete railing, averages
3.69 m above NGVD (the bridge has a slight tilt). In actuality, the low chord is at elevation 1.65 m
above NGVD on the bridge’s western end, sloping up to elevation 2.41 m NGVD at the bridge’s
eastern end. The bridge’s western end has a top chord elevation of 3.32 m NGVD sloping up to 4.08
m NGVD at its eastern end. About 50 m west of the bridge’s western abutment, there is a 50 foot-
long low spot of elevation 1.89 m above NGVD that would act as a relief valve to water higher than
this elevation.
Note that the peak water surface elevation at the bridge (1.88 m NGVD) is below the average low
chord elevation of the bridge at the 10-year recurrence interval, but touches the low chord on the
western end of the bridge. The 50-year peak water surface elevation at the bridge (3.01 m NGVD)
does not overtop the bridge, but is well over the low chord elevation and there is hydraulic relief
over the western overbank. The 100-year peak water surface elevation at the bridge (3.61 m NGVD)
would would be just below the bridge’s average top chord elevation and would be well over the
bridge’s western bank relief. The 500-year peak water surface elevation at the bridge (4.66 m
NGVD) would completely submerge the top chord.
For informational purposes only, the percentage of the flow area blocked by the existing bridge’s
piers and deck was determined by running the model with the bridge in place and then with the
bridge “removed”. Results are as follows:
TABLE 6 - PERCENTAGE OF FLOW AREA BLOCKED BY THE EXISTING HIX
BRIDGE
Percentage
blocked
Mean High Water 10-year 25-year 50-year 100-year
9 9 NA 34 47
The maximum velocities through the bridge averaged (for the entire bridge cross-section) 0.53 m/s,
1.26 m/s, 1.84 m/s and 2.72 m/s for the mean tide, 10-year tide, 50-year tide, and 100-year tide,
respectively. Velocities at various points of the bridge cross-section are presented in Section D.3.3.
D.2.5 Summary
The Hix Bridge is found to have very minor impact on peak water surface elevations.

D.3 SCOUR ANALYSES
D.3.1 Purpose
The scour investigation was undertaken to assess the vulnerability of the existing bridge due to
floods and to determine if measures are necessary to counter the scour.
D.3.2 Calculation Method
Scour potential is evaluated using the method outlined in the Federal Highway Administration’s
Hydraulic Engineering Circular No. 18 (HEC-18), entitled “Evaluating Scour at Bridges”.
D.3.3 Analyses
Peak velocities were determined at three locations under the existing bridge using the DYNLET
computer program. The three locations where water velocities were determined were:
1. At bridge station 11 (172 m from the arbitrary cross-section starting point), located where the
riprap is currently placed along the western abutment.
2. At bridge station 50 (236.5 m from the arbitrary cross-section starting point), located next to one
of the piers along the current dredged navigation channel.
3. At bridge station 60, (254 m from the arbitrary cross-section starting point), located where the
riprap is currently placed along the western abutment.
TABLE 7 - PEAK WATER VELOCITIES AT VARIOUS BRIDGE LOCATIONS
(EXISTING BRIDGE)
Bridge Station Peak velocity m/sec
Mn High Water 10-year 25-year 50-year 100-year
11 0.28 0.84 NA 1.37 1.63
50 0.64 1.49 NA 2.14 2.30
60 0.05 0.16 NA 0.27 0.32
Under the bridge is gravel with no. 2 size stone mixed in (per Mass. Div. Highways). The slopes (at
bridge stations 11 and 50) are protected by no. 3 size riprap. The no. 3 stone size is evidently
sufficient since there are no signs of stone washout.
No scour at the piers was noted. Scour was noted, however, in the channel at cross-sections
upstream and downstream of the bridge.
D.3.4 Proposed bridge:
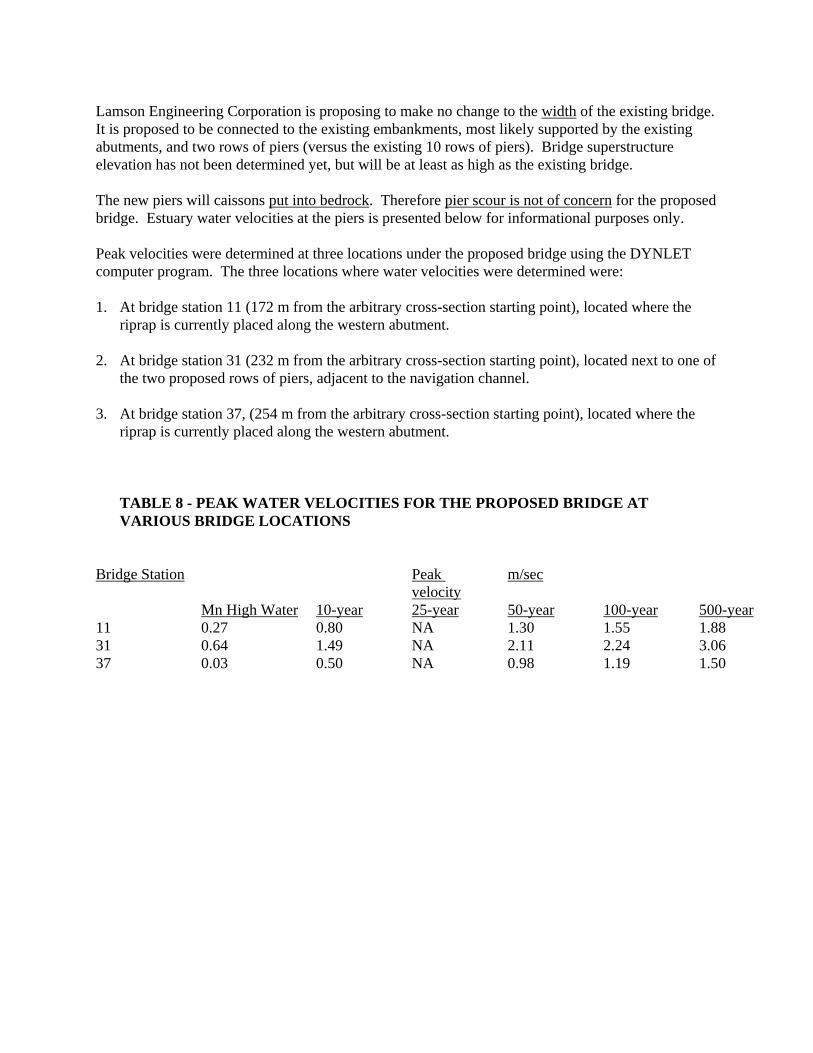
Lamson Engineering Corporation is proposing to make no change to the width of the existing bridge.
It is proposed to be connected to the existing embankments, most likely supported by the existing
abutments, and two rows of piers (versus the existing 10 rows of piers). Bridge superstructure
elevation has not been determined yet, but will be at least as high as the existing bridge.
The new piers will caissons put into bedrock. Therefore pier scour is not of concern for the proposed
bridge. Estuary water velocities at the piers is presented below for informational purposes only.
Peak velocities were determined at three locations under the proposed bridge using the DYNLET
computer program. The three locations where water velocities were determined were:
1. At bridge station 11 (172 m from the arbitrary cross-section starting point), located where the
riprap is currently placed along the western abutment.
2. At bridge station 31 (232 m from the arbitrary cross-section starting point), located next to one of
the two proposed rows of piers, adjacent to the navigation channel.
3. At bridge station 37, (254 m from the arbitrary cross-section starting point), located where the
riprap is currently placed along the western abutment.
TABLE 8 - PEAK WATER VELOCITIES FOR THE PROPOSED BRIDGE AT
VARIOUS BRIDGE LOCATIONS
Bridge Station Peak
velocity
m/sec
Mn High Water 10-year 25-year 50-year 100-year 500-year
11 0.27 0.80 NA 1.30 1.55 1.88
31 0.64 1.49 NA 2.11 2.24 3.06
37 0.03 0.50 NA 0.98 1.19 1.50

E. Conclusions and Recommendations
E.1 Evaluation
Based on the results of our site visit, the hydrologic studies, the hydraulic analyses ….
E.2
Based upon the observations described above, we make the following recommendations:
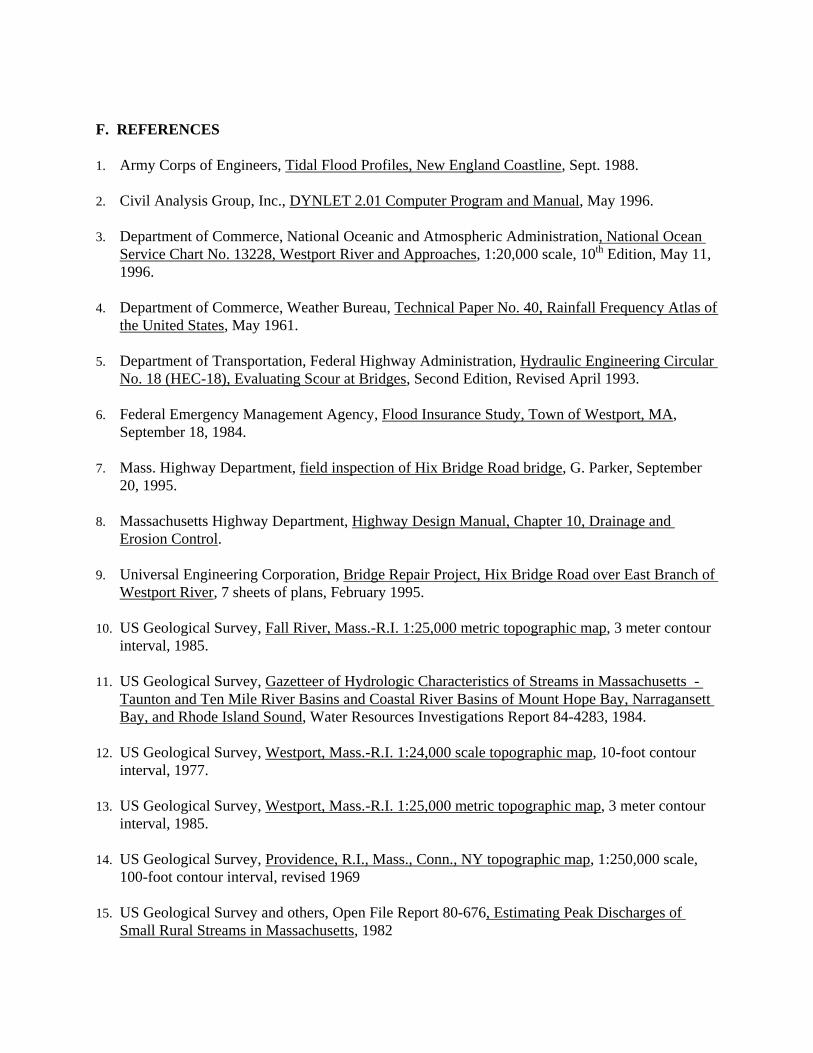
F. REFERENCES
1. Army Corps of Engineers, Tidal Flood Profiles, New England Coastline, Sept. 1988.
2. Civil Analysis Group, Inc., DYNLET 2.01 Computer Program and Manual, May 1996.
3. Department of Commerce, National Oceanic and Atmospheric Administration, National Ocean
Service Chart No. 13228, Westport River and Approaches, 1:20,000 scale, 10th Edition, May 11,
1996.
4. Department of Commerce, Weather Bureau, Technical Paper No. 40, Rainfall Frequency Atlas of
the United States, May 1961.
5. Department of Transportation, Federal Highway Administration, Hydraulic Engineering Circular
No. 18 (HEC-18), Evaluating Scour at Bridges, Second Edition, Revised April 1993.
6. Federal Emergency Management Agency, Flood Insurance Study, Town of Westport, MA,
September 18, 1984.
7. Mass. Highway Department, field inspection of Hix Bridge Road bridge, G. Parker, September
20, 1995.
8. Massachusetts Highway Department, Highway Design Manual, Chapter 10, Drainage and
Erosion Control.
9. Universal Engineering Corporation, Bridge Repair Project, Hix Bridge Road over East Branch of
Westport River, 7 sheets of plans, February 1995.
10. US Geological Survey, Fall River, Mass.-R.I. 1:25,000 metric topographic map, 3 meter contour
interval, 1985.
11. US Geological Survey, Gazetteer of Hydrologic Characteristics of Streams in Massachusetts -
Taunton and Ten Mile River Basins and Coastal River Basins of Mount Hope Bay, Narragansett
Bay, and Rhode Island Sound, Water Resources Investigations Report 84-4283, 1984.
12. US Geological Survey, Westport, Mass.-R.I. 1:24,000 scale topographic map, 10-foot contour
interval, 1977.
13. US Geological Survey, Westport, Mass.-R.I. 1:25,000 metric topographic map, 3 meter contour
interval, 1985.
14. US Geological Survey, Providence, R.I., Mass., Conn., NY topographic map, 1:250,000 scale,
100-foot contour interval, revised 1969
15. US Geological Survey and others, Open File Report 80-676, Estimating Peak Discharges of
Small Rural Streams in Massachusetts, 1982

16. Army Corps of Engineers, Hurricane Survey Interim Report, Narragansett Pier, R.I., Appendices,
April 15, 1960.
17. Federal Writer’s Project of the Works Progress Administration, New England Hurricane, A
Factual, Pictorial Record, undated.
18. US Department of Commerce, Environmental Science Services Administration, Coast and
Geodetic Survey, Calculation of Sea Level Datum minus Mean Low Water at Various Locations,
August 1968.

19. APPENDIX 1 - Crossing Site Catchment
(1;25000 USGS Quad)

APPENDIX 2 - Stream Cross-Section Layout Plan

APPENDIX 3 - Field Evaluation Forms

APPENDIX 4 - Hydrologic Computations

APPENDIX 5 - Hydraulic Computations
Files submitted on a diskette in support of this report are as follows.
For the existing bridge:
For the mean tide, the input files were inletmn.out, channlmn.dat, and velomean.dat.
For the 10-year tide, the input files were: inlet10.out, channl10.dat, and velo10yr.dat.
For the 50-year tide, the input files were: inlet50.out, channl50.dat, and velo50yr.dat.
For the 100-year tide, the input files were: inlet100.out, chann100.dat, and velo100.dat
For the 500-year tide, the input files were: inlet500.out, chann500.dat, and velo500.dat
For the proposed bridge:

APPENDIX 6 - Scour and/or Scour Counter Measure Computations

APPENDIX 7 - Photographs and Index