hydraulic controls on river biota and the consequence for...
TRANSCRIPT

Hydraulic controls on river biota and the consequence for ecosystem processes.
by
Michael Peter Limm
A dissertation submitted in partial satisfaction of the
requirements for the degree of
Doctor of Philosophy
in
Integrative Biology
in the
Graduate Division
of the
University of California, Berkeley
Committee in charge:
Dr. Mary E. Power, Chair
Dr. Wayne P. Sousa
Dr. William E. Dietrich
Fall 2009

The dissertation of Michael Peter Limm is approved:
Chair ________________________________________ Date _______________
________________________________________ Date _______________
________________________________________ Date _______________
University of California, Berkeley

Hydraulic controls on river biota and the consequence for ecosystem processes.
© 2009
by Michael Peter Limm

1
ABSTRACT
Hydraulic controls on river biota and the consequence for ecosystem processes.
by
Michael Peter Limm
Doctor of Philosophy in Integrative Biology
University of California, Berkeley
Dr. Mary E. Power, Chair
Disturbance by flooding can dramatically disrupt population and community structure in stream ecosystems. My dissertation research focused on two species that are vulnerable to high flow events: the caddisfly Dicosmoecus gilvipes and the western pearlshell mussel Margaritifera falcata. I investigated their influence on energy and nutrient dynamics in a Northern California coastal river.
In Chapter 1, I examined the impact of the limnephilid caddisfly Dicosmoecus gilvipes on periphyton structure and ecosystem processes. Dicosmoecus larvae reduced periphyton accrual, chlorophyll a, gross primary productivity, and ammonium uptake in experimental channels, and their impact persisted 46 days after the larvae were removed. Given Dicosmoecus vulnerability to high flow events, any change in flood timing, frequency, and/or magnitude due to river regulation or climate conditions may significantly alter ecosystem processes in Northern California streams.
In Chapter 2, I investigated whether flood timing would have a differential impact on Dicosmoecus gilvipes populations. Specifically, I measured how critical flow thresholds and habitat use varies with larval size. Critical flow velocity and dimensionless flow threshold indices increased with larval size, as did their flow velocity preference. The results suggest early flood events will have a greater impact on Dicosmoecus populations than later flood events of a similar magnitude, and during low-flow periods the interaction between Dicosmoecus distribution, periphyton composition and productivity, and flow velocity may significantly impact ecosystem processes on smaller scales.
In Chapter 3, I investigated the functional role of cases built by Dicosmoecus gilvipes. The larvae collect thin plant material and Douglas-Fir needles and build arrow-shaped lateral extensions on their case. Larvae with lateral extensions experienced fewer revolutions and regained their footing faster in experimental trials than those without. The results suggest lateral extensions provide stability against overturning in fast flow and may improve their ability to forage efficiently in turbulent flow conditions.
In Chapter 4, I manipulated the presence and absence of the mussel

2
Margaritifera falcata in stream mesocosms. I measured their impact on organic matter accrual, microbial activity in the sediment, and the growth of larval Pacific lamprey, Lampetra tridentata. Margaritifera presence increased microbial activity in the sediment and larval lamprey growth. Organic matter accrual was not significantly affected. The results suggest that lamprey larvae benefit from native mussels, and that lamprey populations may decrease with the rapid decline of native freshwater mussels.
In summary, the presence of both Dicosmoecus gilvipes and Margaritifera falcata had significant affects on ecosystem processes. Knowledge of species impacts on energy and nutrient dynamics and the physical conditions that control species abundance and distribution is essential to predicting both small- and large-scale consequences of an altered hydrograph, whether due to river regulation or climate change.

i
I dedicate my thesis to
my family

ii
TABLE OF CONTENTS
Abstract ………………………………………………………… 1
Dedication ………………………………………………………… i
Table of Contents ………………………………………………………… ii
Acknowledgements ………………………………………………………… v
Chapter 1. The impact of a dominant grazer, the caddisfly Dicosmoecus gilvipes, on
periphyton and ecosystem processes………………………………………………… 1
ABSTRACT …………………………………………. 1
INTRODUCTION …………………………………………. 1
METHODS …………………………………………. 2
RESULTS …………………………………………. 5
DISCUSSION …………………………………………. 8
REFERENCES …………………………………………. 14
TABLES …………………………………………. 19
FIGURE LEGENDS …………………………………………. 20
FIGURES …………………………………………. 21
Chapter 2. Ontogenic shift in habitat use and critical flow threshold by the caddisfly
Dicosmoecus gilvipes ……………………………………………...……………….… 29
ABSTRACT …………………………………………. 29

iii
INTRODUCTION …………………………………………. 29
METHODS …………………………………………. 30
RESULTS …………………………………………. 35
DISCUSSION …………………………………………. 37
REFERENCES …………………………………………. 43
TABLES …………………………………………. 48
FIGURE LEGENDS …………………………………………. 50
FIGURES …………………………………………. 52
Chapter 3. The caddisfly Dicosmoecus gilvipes: making a case for a functional
role …………………………………………………………………………………… 66
ABSTRACT …………………………………………. 66
INTRODUCTION …………………………………………. 66
METHODS …………………………………………. 67
RESULTS …………………………………………. 69
DISCUSSION …………………………………………. 70
REFERENCES …………………………………………. 75
FIGURE LEGENDS …………………………………………. 78
FIGURES …………………………………………. 79
Chapter 4. The timing of drought and its alleviation by fog in the understory of a
redwood forest ecosystem ……………………………………………..…………… 84
ABSTRACT ………………………………………….. 84

iv
INTRODUCTION ………………………………………….. 84
METHODS ………………………………….………. 85
RESULTS ……………………………….…………. 88
DISCUSSION ………………………………………….. 90
REFERENCES ……………………………….…………. 94
TABLES ………………………………………….. 99
FIGURE LEGENDS ……………………………….…………. 100
FIGURES ………………………………….………. 101

v
ACKNOWLEDGEMENTS
Many people contributed to this dissertation. Some have helped intellectually, some physically, some emotionally, and some have helped out in all three areas. I am honored and grateful for the love and support over the years.
First, I would like to thank Mary Power for setting an example both professionally and personally. Mary, your enthusiasm for learning about the natural world is contagious and inspiring. Your focus and persistence is admirable, and you have taught me what it means to be a scientist. Whenever I needed help, you were there. And your laughter and kindness Mary, I will never forget.
Second, I would like to thank those who were influential in my development as a scientist. Amy Benjamin, you challenged me with projects. Nancy Erman, Don Erman, and Maureen Stanton, you challenged me with questions. Michael Marchetti, you challenged me with fieldwork (Reed Ave.). Peter Moyle and Ron Yoshiyama, you taught me it was okay to love fish. Vince Resh and Camille McNeeley, you taught me it was okay to love invertebrates. Rex Lowe, you taught me it was okay to love algae. Bill Dietrich, you taught me it was okay to love saltating rocks. Mark Stacey and Matt Reidenbach, you taught me it was okay to love turbulence. Jim Hood, Jacque Finlay, John Schade, and Jill Welter, you taught me ecosystem scientists are people too. And Miki Hondzo, you taught me engineers could be cool.
Third, the help and support of family and friends made this research possible. Mom and dad, I can’t say enough. Chris and Kelli Fair, your encouragement and support over the years made this possible. I am deeply grateful. Carol and Alan, you supported and tolerated me well beyond the call of duty. Peter Steel, thank you for your help, friendship, and patience.
Last, I acknowledge Emily Limm. In the field, in the laboratory, and next to me on the computer, you were always there. I couldn’t have done it without you. Ti amo.

1
CHAPTER 1
The impact of a dominant grazer, the caddisfly Dicosmoecus gilvipes, on periphyton and ecosystem processes.
Abstract Disturbance by flooding can dramatically disrupt population and community structure in stream ecosystems. If strongly interacting species are affected, energy and nutrient dynamics may be altered. We examined the impact of the limnephilid caddisfly Dicosmoecus gilvipes on periphyton structure and ecosystem processes. Dicosmoecus larval presence was manipulated in experimental channels for 21 days, during which periphyton structure and ecosystem processes were monitored. Larvae were then removed from the treatment channels to simulate larval diapause and grazing cessation. Periphyton structure and ecosystem processes were again measured 46 days after removal. Dicosmoecus larvae reduced periphyton accrual, chlorophyll a, gross primary productivity, and ammonium uptake in the experimental channels, and their impact persisted 46 days after the larvae were removed. Given Dicosmoecus vulnerability to high flow events, any change in flood timing, frequency, and/or magnitude due to river regulation or climate conditions may impact Dicosmoecus populations and alter ecosystem processes in Northern California streams. Introduction Grazers are important regulators of productivity and nutrient cycling in aquatic systems (Flint and Goldman 1975, Lehman 1980, Mulholland et al. 1983, Vanni 1996, Wallace and Webster 1996, Vanni 2002). In streams, grazer removal of both biotic (plant, bacteria, fungi) and abiotic (senescent material, sediment) components of periphyton can influence periphyton structure (e.g. Hill and Knight 1987), productivity (e.g. Lamberti 1989), and nutrient uptake (e.g. Mulholland et al. 1983, Mulholland et al. 1994).
These impacts can vary with grazing pressure (Cooper 1973, Porter 1976, Steinman et al. 1987, Steinman 1991, Lamberti et al. 1995). At low grazing pressure, removal of periphyton overgrowth (e.g. Lamberti et al. 1989) and sediment (e.g. Power 1990) can stimulate algal productivity and offset biomass loss. At higher grazing pressure, more rapid periphyton removal will reduce area-specific biomass, productivity and nutrient uptake, even if stimulation of biomass-specific productivity occurs (Cooper 1973, Flint and Goldman 1975, Mulholland et al. 1983, Lamberti et al. 1989, Mulholland et al. 1991). In their review of experimental studies that quantify grazer effects on algal productivity, Feminella and Hawkins (1995) report that when stocked at ambient density, grazers reduced area- and biomass-specific productivity in over 60 percent of the studies. In the present study, we examined the impact of the limnephilid caddisfly Dicosmoecus gilvipes (Hagen) on periphyton structure and ecosystem processes in a

2
Northern California stream. Distributed across western North America, Japan, and eastern Russia (Wiggins 1977), Dicosmoecus larvae grow up to 3 cm long and spend the majority of their active time grazing periphyton (Hart 1981, Li and Gregory 1989). Larval densities can reach up to 200 m-2 in California and Oregon streams (Lamberti et al. 1987, Lamberti et al. 1995). When stocked at these and lower densities, they can reduce periphyton accrual and area-specific productivity (Li and Gregory 1989). Their relatively large size and armored case reduce their vulnerability to predators (Wootton et al. 1996, Chapter 2), but their size may also increase their vulnerability to flood events (Wootton et al. 1996, Wright and Li 1998). Variation in larval density has been associated with seasonal variation in precipitation and high flow events (Power 1992, Power et al. 1996). Our study addressed the following questions. First, if critical flow conditions are reached and Dicosmoecus larvae are removed from a stream reach, what impact will that have on periphyton and energy and nutrient dynamics? Second, will their presence or absence influence potential top-down effects of a fish predator, the steelhead trout Oncorhynchus mykiss (hereafter referred to as steelhead)? And third, will any impact on periphyton accrual and ecosystem processes persist after Dicosmoecus larvae undergo diapause (resting phase prior to pupation) and are no longer grazing? To address these questions, we manipulated Dicosmoecus larvae and steelhead in channels that were placed in the South Fork of the Eel River, Mendocino County, CA. Methods Site Our study was conducted in the South Fork of the Eel River in Mendocino County, California (39°44”N 123°39”W) within the Heath and Marjorie Angelo Coast Range Reserve of the University of California Natural Reserve System. This region has a Mediterranean climate with warm, dry summers and wet, cool winters. Most rainfall occurs between October and April. The drainage area at our study site is approximately 140 km2. The river habitat consists of shallow runs, riffles, and large pools (1-7 m deep) during summer low flow periods. Vegetation in the watershed is a mixed-evergreen forest dominated primarily by old-growth Douglas fir (Pseudotsuga menziesii) and redwood (Sequoia sempervirens) trees. The major aquatic food web components consist of producers (primarily diatoms and filamentous green algae), grazing insects (midges, mayflies, caddisflies) and snails, predatory insects (stoneflies, dragonflies, aquatic beetles and hemiptera), fish (stickleback, Gasterosteus aculeatus, juvenile steelhead, Oncorhynchus mykiss, California roach, Lavinia symmetricus), and filter feeders (lamprey larvae, Lampetra tridentata, unionid mussels, Margaritifera falcata and Anodonta californiensis) as reported by Power et al. (1996). We conducted experiments in a 100 m long run that becomes a slow pool (flow velocities 0-5 cm s-1) under summer base flows. During base flow, the mean depth of the run is 0.4-0.6 m, stream width is 13 m, and mean velocity is 0.02 - 0.04 ms-1. A thin layer (< 1 m) of mixed alluvium covers the bedrock channel. The median grain size (D50) of our study site is approximately 50 mm based on pebble counts (Wolman and Union 1954). Sedges (Carex nudata) line the riverbank and stream margins.
3
Experimental channels All manipulations were conducted in experimental channels made from 55 gallon polyurethane drums. After removing the top and bottom, each drum was cut in half length-wise. Each half was then connected and sealed end to end to create a channel 1.8 m long. Both ends of the channel were covered with a permeable screen that extended 15 cm above the water level. To minimize the possible complicating effect of manipulating species other than our target species, we used the largest mesh size (6mm) that would prevent Dicosmoecus larvae from entering or leaving the channels. The mesh screen was cleared of debris approximately every 2 days. In late spring the channels were placed into the 100 m reach described above and filled with gravel. We collected 0.05 m3 of gravel adjacent to each channel and evenly distributed it within the channel. Gravel depth along the centerline of each channel was 10 cm. The channel height was adjusted to a water depth of 15 cm. Area of the channel utilized by the larvae was 0.81 m2. After channels had seasoned in the river for thirty days, we randomly assigned experimental channels to one of four treatments: control, Dicosmoecus, steelhead, and Dicosmoecus+steelhead. Prior to applying the treatments we sampled periphyton ash-free dry mass (AFDM), chlorophyll a, algal assemblage, metabolism, and ammonium and phosphorus uptake. Periphyton sampling To quantify AFDM, chlorophyll a, and algal assemblages, we randomly sampled 6 rocks in each channel. We used two perpendicular measuring tapes to establish a 2-dimensional coordinate system over each channel, and then used a random number generator to select six rocks. If the rock surface at the sampling point was less than 0.036 m x 0.024 m, we randomly selected another rock. To standardize sampling a template with a known area (0.00086 m2) was placed on the rock surface and periphyton was removed from the area with a wire brush. Scraped material was rinsed into a 50 mL jar and placed into a cooler. In the lab, two subsamples (10 mL for AFDM, 5 mL for chlorophyll a) were filtered onto a 1.2 µm pore glass fiber filter (GF/F, Whatman Ltd.). The filter and material used for chlorophyll a analysis were immediately wrapped in foil and stored at -20°C. A third subsample was placed in a glass vial and fixed with 4% formalin for analysis of algal assemblage. AFDM Each filter plus material was dried at 60°C for 48 hours and weighed. We then ashed the sample in a muffle furnace for 2 hours at 550°C and re-weighed the filter to quantify ash-free dry mass (AFDM). Chlorophyll a To quantify chlorophyll a we used a modified fluorometric technique as described in EPA Method 440.5 (http://www.epa.gov/nerlcwww/ordmeth.htm#marine). A Turner Designs 10-040R non-acidification kit was used in conjunctions with a TD-700 fluorometer (Turner Designs, Inc.). We extracted chlorophyll a by placing samples in 90% acetone and storing in the dark at 4°C for 24 hours. The TD-700 was calibrated prior

4
to running the samples using the 10-040R kit standard. Algal assemblage To quantify algal assemblage we pooled treatment replicates for each sampling period. We agitated each pooled sample thoroughly to mix contents and withdrew 1 mL using a pipette. The 1 mL subsample was placed onto a Palmer cell and analyzed with a compound microscope at 400x. A horizontal and vertical transect was made across each Palmer cell. More than 300 cells were counted for most samples. Cells were identified to genus using Wehr and Sheath (2002). Measurements of cell length and width were used to estimate biovolume (Hillebrand et al. 1999). Metabolism and nutrient uptake We measured channel metabolism by creating a water- and airtight chamber. The channel ends were sealed with a rubber gasket and an acrylic sheet. A thin (0.5 mil), clear, transparent polyethylene sheet was placed on the water surface to prevent oxygen exchange across the air-water interface. Water current was maintained in each stream with a 12 volt submerged pump (Rhule, Inc). The pump was adjusted so that the average water speed in each channel was 0.05 ms-1, similar to ambient flow velocity in the surrounding reach. To quantify periphyton respiration by both autotrophic and heterotrophic components, we prevented light from reaching the channel bed with an opaque 6 mil thick tarp. Dissolved oxygen was measured after the opaque tarp was placed over the channel, and measured again after approximately 45 minutes. We then removed the opaque tarp to expose periphyton to sunlight. After 15-20 minutes, dissolved oxygen was again recorded. Gross primary productivity was calculated as the sum of the net metabolism and respiration measurements. Short time periods were used to minimize nutrient limitation and supersaturation of oxygen (Bott et al. 1997). Temperature in each channel was recorded during the measurements. Channel temperatures were similar and did not vary more than 1.8 °C between initial and final dissolved oxygen measurement. After we quantified channel metabolism, we removed the channel ends and clear plastic cover to allow flow through the channel. After 24 hours, the channel ends were again sealed and the water pump created flow. We added a concentrated nutrient cocktail to the channels to increase ammonium (NH4-N) and phosphorus (PO4-P) concentrations to roughly 40 µgL-1. (Background concentrations in the South Fork of the Eel River are typically between 10-14 µgL-1 for both nutrients during the experimental period.) Water samples were collected from each channel after four minutes (the time required for the channels to be fully mixed based on preliminary tests using rhodamine dye) and every 15 minutes thereafter (4 water samples total from each channel). Water samples were filtered through a 0.7 µm pore glass fiber filter (GF/F, Whatman Ltd.) into a pre-rinsed 60 mL bottle. Sample bottles were placed into a cooler for transport to the laboratory. In the laboratory, ammonium and phosphorus were analyzed within 24 hours. Ammonium was analyzed using a modified OPA-fluorometric technique (Taylor et al. 2007) from Holmes et al. (1999) with a portable fluorometer (Turner Designs, Inc., Sunnyvale, California, USA). We measured soluble reactive phosphorus (SRP) in each sample by the standard molybdenum blue procedure (American Public Health Association 1994).

5
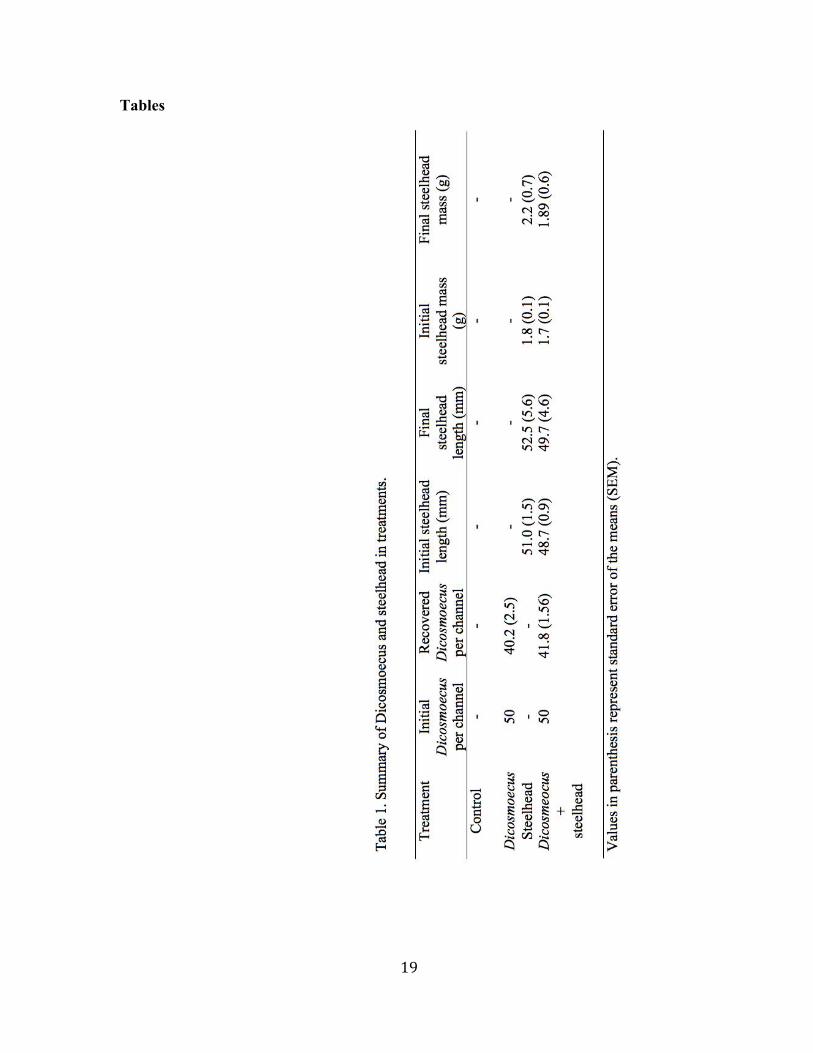
Treatments After initial sampling of periphyton AFDM, chlorophyll a, algal assemblage, metabolism, and nutrient uptake was completed, treatments were applied to each channel. Fifty Dicosmoecus larvae were added to both the Dicosmoecus and Dicosmoecus+steelhead channels. Larval density in the experimental channels was within the range of their ambient densities. Two steelhead were added to the steelhead and Dicosmoecus+steelhead channels. Steelhead were collected using a backpack electroshocker (LR-24, Smith-Root, Inc.). After lightly anesthetizing the steelhead with MS-222, we measured their length and weight and randomly assigned them to a treatment and channel. Average standard length and weight are reported in Table 1. Fourteen days after applying treatments, we sampled periphyton AFDM, chlorophyll a, algal assemblage, and loose organic and inorganic material on the channel bed. To quantify loose organic and inorganic material, we gently lifted the randomly selected rocks to be scraped and placed them in a shallow container underwater. After placing a lid on the container, we lifted the container out of the water. The water within the container was poured into a large tray and any invertebrates were removed with forceps. The rock was gently rinsed with filtered stream water over the large tray, and all contents of the tray were then transferred into 1 L bottles. The bottles were placed into a cooler and filtered in a laboratory onto 1.2 µm pore glass fiber filter (GF/F, Whatman Ltd.). Organic and inorganic content on the filter was analyzed as described above for AFDM. Twenty-one days after applying treatments we sampled periphyton AFDM, chlorophyll a, algal assemblage, metabolism, and nutrient uptake. We then removed Dicosmoecus larvae from all channels to simulate larvae undergoing diapause. Due to low conductivity and the potential disruption of other grazers by excessive electrofishing, the steelhead and Dicosmoecus+steelhead treatment channels were destructively sampled to ensure all fish were removed, and these treatments were terminated. Gravel was removed from the channels and nets were used to collect the steelhead, and the number of Dicosmoecus in each channel was recorded. Forty-six days after removing Dicosmoecus larvae from the Dicosmoecus treatment we sampled periphyton AFDM, chlorophyll a, algal assemblage, metabolism, and nutrient uptake in the control and Dicosmoecus treatment. Analysis During the period when Dicosmoecus was present (day 1 to 21) we analyzed treatment effects on periphyton accrual, chlorophyll a, GPP, and ammonium and phosphorus uptake with a repeated measures MANOVA design. When differences were significant, we used between subject contrasts to determine which treatments were different. Dicosmoecus and control treatment means 46 days after Dicosmoecus removal were compared using Student’s t-test. Deposited mineral and loose organic matter and were analyzed with an ANOVA design and post hoc pair-wise comparisons were conducted using Tukey’s (alpha= 0.05). All analysis was conducted with the statistical program JMP (7.0, SAS Institute Inc., Cary, NC). Results

6
We recovered on average 41 (SE 2.8) Dicosmoecus larvae from each experimental channel after 21 days (Table 1). Dippers were frequently observed on channel walls and predation by them may be responsible for the missing Dicosmoecus larvae. A garter snake (Thamnophis couchii) was observed in a channel during the experiment. One dead steelhead was observed in a steelhead treatment channel one week after applying treatments and replaced with a steelhead of similar size. At the end of the experiment four steelhead were recovered from three steelhead treatment channels and four steelhead were recovered from three Dicosmoecus+steelhead treatment channels (Table 1). Missing steelhead either escaped from a channel by jumping over barrier walls or were consumed by predators. Individual fish were not tagged, and therefore steelhead growth rates could not be measured. Periphyton AFDM Periphyton accrual was reduced in channels when Dicosmoecus was present (F3,16 = 38.35, p < 0.001, between subject contrasts, Figure 1). After 14 and 21 days, periphyton standing crop was less than half of the abundance in Dicosmoecus and Dicosmoecus+steelhead treatments. Accrual was similar between Dicosmoecus and Dicosmoecus+steelhead treatments and greater in the steelhead treatment than in the control (no Dicosmoecus, no steelhead) treatment. Forty-six days after larvae were removed, periphyton standing crop in both control and Dicosmoecus treatments was reduced, but standing crop in the control treatment was still over 2x higher than in the Dicosmoecus treatment (t8 = 2.49, p = 0.03). Chlorophyll a. Chlorophyll a accrual was also reduced when Dicosmoecus was present (F3,16 = 11.04, p < 0.001, between subject contrasts, Figure 2). Fourteen and 21 days after larvae were introduced chlorophyll a was over 2X higher in control and steelhead treatments. Accrual was similar between Dicosmoecus and Dicosmoecus+steelhead and similar between control and steelhead treatments. 46 days after larvae were removed chlorophyll a was still reduced in the Dicosmoecus treatment relative to control (t8 = 2.71, p = 0.03). Settled material
After 14 days the applied treatments had a significant effect on loose organic and loose mineral accrual (F3,16 = 9.14, p < 0.001, F3,16 = 13.58, p < 0.001, Figure 3a). Organic matter accrual was reduced by a factor of 3 in the Dicosmoecus and Dicosmoecus+steelhead treatments relative to the steelhead treatment (Tukey’s test, α = 0.05). Loose mineral matter (ash) accrual was reduced by a factor of 9 in the Dicosmoecus and Dicosmoecus+steelhead treatments relative to steelhead treatment (Tukey’s test, α = 0.05, Figure 3b).
Algal assemblage and biovolume Common algal taxa observed on scraped rocks during the experiment include Acanthidium sp., Cocconeis pediculus, Cocconeis placentula, Epithemia adnata, Epithemia sorex, Epithemia turgida, Fragilaria sp., Gomphenema sp., Rhoicosphenia sp., Navicula spp., Melosira sp., Rhopalodia sp., Synedra spp., Cladophora glomerata, and

7
various cyanobacteria sp (Figure 4a). Based on pooled treatment periphyton samples, algal cell density appeared similar between treatments at the beginning of the experiment. After 21 days algal cell density was much higher in the control and steelhead treatments, with the highest cell counts for most species in the steelhead treatment. The filamentous diatom Melosira made up a significant number of total cells in the control and steelhead treatments and were rare or absent in the Dicosmoecus or Dicosmoecus+steelhead treatments. Another filamentous diatom, Fragilaria sp., was also present in control and steelhead treatments but absent from Dicosmoecus treatments. Cladophora glomerata filaments were not observed in Dicosmoecus or Dicosmoecus+steelhead treatments, only in control and steelhead treatments. Forty-six days after larvae were removed algal cell density was higher for all algal species in the control treatment. Similar patterns were observed when algal cell count data was converted to algal biovolume (Figure 4b). Metabolism Area-specific GPP was affected by the treatments (F3,16 = 7.80, p = 0.002, Figure 5a). Based on between-treatment contrasts, area-specific GPP was reduced in the Dicosmoecus and Dicosmoecus +steelhead treatments relative to control and steelhead treatments. Area-specific GPP was similar between control and steelhead treatment, and similar between the Dicosmoecus and Dicosmoecus +steelhead treatments. Forty-six days after larvae were removed aerial-specific GPP in the Dicosmoecus treatment was similar to the control (t8 = 1.50, p = 0.09). Biomass-specific GPP was affected by the treatments ((F3,16 = 7.80, p = 0.002, Figure 5b). Biomass-specific GPP in the Dicosmoecus and Dicosmoecus +steelhead treatments was significantly higher than the control and steelhead treatments. Biomass-specific GPP in the control treatment was significantly higher than in the steelhead treatment. Forty-six days after larvae were removed biomass-specific GPP in the Dicosmoecus treatment was still significantly higher than in the control treatment (t8 = 4.85, p < 0.001). Nutrient uptake Ammonium Area-specific ammonium uptake rate by periphyton in the channels was affected by the treatments (F3,16 = 19.12, p < 0.001, Figure 6a). Area-specific ammonium uptake rate was significantly reduced in both the Dicosmoecus and Dicosmoecus +steelhead treatments relative to the control and steelhead treatments. Uptake rates were similar between control and steelhead treatments, and similar between the Dicosmoecus and Dicosmoecus +steelhead treatments. Area-specific ammonium uptake rate was still reduced in the Dicosmoecus treatment 46 days after larvae were removed (t8 = 3.58, p = 0.006). Biomass-specific ammonium uptake rates differed between treatments when Dicosmoecus was present (F3,16 = 5.64, p = 0.008, Figure 6b). Based on between-treatment contrasts, biomass-specific ammonium uptake rates were higher in Dicosmoecus, steelhead, and Dicosmoecus +steelhead treatments than in the control treatment. Biomass-specific ammonium uptake rate was higher in the Dicosmoecus treatment than in the control treatment 46 days after larvae were removed (t8 = 2.32, p = 0.03).

8
Phosphorus No difference in area-specific phosphorus uptake rate by periphyton was observed between treatments (F3,16 = 1.41, p = 0.28, Figure 7a). Area-specific phosphorus uptake rate was similar between control and Dicosmoecus treatments 46 days after larvae were removed (t8 = 1.16, p = 0.29). Biomass-specific phosphorus uptake rates were significantly different between treatments when Dicosmoecus was present (F3,16 = 3.52, p = 0.04, Figure 7b). Biomass-specific phosphorus uptake rates were higher in Dicosmoecus and Dicosmoecus +steelhead treatments than in the steelhead treatment, and higher in the Dicosmoecus +steelhead treatment than the control treatment, according to between subject contrasts. Biomass-specific phosphorus uptake rate was higher in the control treatment than in the Dicosmoecus treatment 46 days after larvae were removed (t8 = 2.1, p = 0.04). Ammonium:Phosphorus uptake ratio The ammonium:phosphorus uptake ratio differed between treatments (F3,16 = 7.84, p = 0.0019, Figure 8). The ammonium:phosphorus uptake ratio was higher in the control treatment than in the other three treatments. The ammonium:phosphorus uptake ratio was similar between the steelhead, Dicosmoecus and Dicosmoecus +steelhead treatments. Forty-six days after larvae were removed the ammonium:phosphorus uptake ratio was not significantly different in the control treatment than in the Dicosmoecus treatment (t8 = 0.89, p = 0.2). Discussion
The absence or removal of an important consumer can influence prey distribution (e.g. Connell 1970), species abundance (e.g. Estes and Palmisano 1974), species interactions and community structure (e.g. Brooks and Dodson 1965, Paine 1966). Our study provides further evidence that Dicosmoecus gilvipes is a strong interactor in California channels. The larvae reduced periphyton accrual, structure, productivity, and nutrient uptake, and these effects persisted 46 days after the larvae were removed from experimental channels.
Dicosmoecus on periphyton Experimental channels with Dicosmoecus had reduced periphyton accrual after 14 and 21 days and low between-channel variation relative to control channels. Reduced periphyton accrual has been observed at lower (25 m-2, Li and Gregory 1989), higher (200 m-2, Lamberti et al. 1987), and similar (65 m-2, Wootton et al. 1996) densities in California and Oregon channels. Li and Gregory (1989) stocked aquaria at 25 m-2 and observed a 50% reduction in periphyton biomass after 48 hours, and only a thin layer of periphyton remained after 72 hours. When Lamberti and others (1995) manipulated Dicosmoecus larval density in channels, they observed an inverse relationship between grazer density and periphyton biomass after 32 days. At 50 m-2, they observed 70% less periphyton and chlorophyll a accrued than when larval density was 25 m-2. When other grazers were allowed to enter channels, Wootton et al. 1996 observed an 83% reduction in periphyton biomass. We observed a 60% reduction in periphyton standing crop after

9
14 days and a 55% reduction after 21 days in Dicosmoecus treatments relative to control. The results suggest that when at or even below ambient density, periphyton removal rate by Dicosmoecus can greatly exceed periphyton regeneration rate. Grazing and activity by Dicosmoecus larvae also altered periphyton structure by reducing the loose top layer of periphyton. Similar results have been observed in previous studies on Dicosmoecus (Lamberti et al. 1987, Lamberti et al. 1995), snails (Mulholland et al. 1983, Lamberti et al. 1995), mayflies (Hill and Knight 1987, Lamberti et al. 1995) and predatory stoneflies (Zanetell and Peckarsky 1996). Relative to ungrazed channels, Lamberti and others (1995) observed over 2X more organic material exported from channels when Dicosmoecus was present. Dicosmoecus-induced resuspension and export of algae and loose organic material may have significant consequences for downstream filter and deposit feeders. Alteration of periphyton structure by Dicosmoecus and selective feeding may have influenced the different algal assemblages we observed. By modifying periphyton structure, grazers can alter the physical conditions important to specific algal species (Hill and Knight 1987). When feeding, Dicosmoecus larvae brush, claw, and scrape periphyton off the rock surface with their mandibles and tarsal claws on front and middle legs (Hart 1981, Li and Gregory 1989). This feeding action dislodges loose material on the periphyton surface. In a tributary of the South Fork of the Eel River, feeding and activity by the mayfly Ameletus validus disproportionally removed loose and highly motile diatoms found in the loose layer of periphyton (Hill and Knight 1987). The removed diatoms included Nitzschia spp., Surirella spiralis, Cymatopleura elliptica, and Navicula cyptocephala. Adnate species including Gomphonema clevei, Achnanthes minutissima, Synedra ulna, Rhoicosphenia curvata, and Epithemia spp. increased their relative abundance as grazing pressure increased (Hill and Knight 1987). In the marine intertidal, limpets selectively removed the loose filamentous diatoms Melosira spp. and Fragilaria sp. (Nicotri 1977). In our study, Dicosmoecus reduced the algal cell densities and biovolume of both loose and adnate species after 21 days. The filamentous diatoms Melosira sp. and Fragilaria sp. were observed in the control and steelhead treatments but were absent from Dicosmoecus treatment. Only the filamentous diatom Melosira was observed in the Dicosmoecus+steelhead treatment, where it occurred at a relatively low cell density (100X and 200X less than in control and steelhead treatments, respectively). The filamentous green alga Cladophora glomerata was also observed in control and steelhead treatments but absent from Dicosmoecus and Dicosmoecus+steelhead treatments. Dicosmoecus has shown a feeding preference for Cladophora filaments in previous studies (Hart 1981, Li and Gregory 1989), but whether their absence was due to selective feeding is unclear, given the reduction in all algal taxa when Dicosmoecus was present, including epiphytic diatoms on Cladophora. Dicosmoecus on ecosystem processes Dicosmoecus reduced area-specific productivity in channels. Dicosmoecus increased biomass-specific productivity, but grazing pressure at ambient density removed enough periphyton to offset the stimulatory effect. Our finding is in agreement with previous studies where Dicosmoecus was the sole grazer (Lamberti et al. 1995), where periphyton renewal rate was calculated relative to Dicosmoecus grazing rate (Big Sulphur Creek, Sonoma County, CA, Hart 1981), and of course where reduced periphyton accrual

10
occurred when Dicosmoecus was present (Lamberti et al. 1987, Lamberti et al. 1989, our study). Relative to ungrazed channels, Lamberti et al. (1995) reported a 50% reduction of area-specific productivity when Dicosmoecus was the sole grazer at 25 m-2. We observed a lower reduction in area-specific productivity (30%) at 62 m-2, but grazing pressure in our channels was not limited solely to Dicosmoecus due to channel ends permeable to grazers small enough to pass through 6mm mesh. Associated with the Dicosmoecus-induced reductions in area-specific primary productivity were lower ammonium uptake rates. Ammonium uptake rate was 400% less in Dicosmoecus and Dicosmoecus+steelhead treatments relative to the control treatment after 21 days. The disproportionate reduction in ammonium uptake relative to periphyton accrual (54% reduction) and area-specific productivity (30%) suggests the reduced periphyton standing crop and altered periphyton composition were responsible. A two-fold reduction in standing crop (total biovolume) should lower nutrient demand. The removal of senescent algal cells or deposited organic and inorganic matter, however, can affect nutrient demand by increasing the proportion of active cells and increasing light availability. This, coupled with an increased nutrient mass transfer potential to underlying cells due to overstory removal, can increase biomass-specific ammonium uptake rate and offset the effects of reduced standing crop on area-specific ammonium uptake rate. While biomass-specific productivity was higher in Dicosmoecus treatments, biomass-specific ammonium uptake rates were reduced relative to the control treatment. The results suggest standing crop removal and biovolume reduction by Dicosmoecus was the primary control of ammonium uptake rate.
Taxonomic composition may have also influenced ammonium uptake rates in the Dicosmoecus treatments. Periphyton demand for nutrients is influenced by which species are present, their abundance, and their chemical constituents. In our study, Melosira sp. dominated algal biovolume in control and steelhead treatments after 21 days, but was absent from Dicosmoecus and Dicosmoecus+steelhead treatments. Epithemia spp. (diatoms with nitrogen-fixing endosymbionts (Round et al. 1990)) made up the majority of the biovolume in Dicosmoecus and Dicosmoecus+steelhead treatments. If ammonium demand by Melosira and Epithemia differs, the different species composition may have influenced both area- and biomass-specific ammonium uptake rates. Phosphorus uptake rate was similar between treatments and was over a magnitude lower than the ammonium uptake rate. The results are consistent with predicted grazer effects in a nutrient-limited system (Newbold 1982). In the nitrogen-limited South Fork of the Eel River (Marks et al. 2000), reduced standing crop and productivity in the Dicosmoecus and Dicosmoecus+steelhead treatments reduced the total uptake of ammonium, while the lower phosphorus uptake reflected the higher phosphorus availability relative to periphyton demand. The higher ammonium:phosphorus uptake ratio in control treatments was driven primarily by the higher ammonium uptake. The ratio of available nutrients can impact bottom-up forces in both aquatic and terrestrial ecosystems (Vitousek and Howarth 1991), and the lower ammonium:phosphorus uptake ratio by periphyton where Dicosmoecus is present may have significant consequences to species downstream. We did not, however, quantify nitrate uptake. Nitrate concentration (10 µg L-1) is similar to those of ammonium (Power 1992), and may also influence total nitrogen uptake dynamics.

11
Post-grazer removal Increased accrual of periphyton has been observed after grazing caddisflies undergo diapause/pupation (e.g. Douglas 1958, Hart and Resh 1980). After we removed Dicosmoecus to simulate diapause-induced grazing cessation, however, we did not observe positive responses in periphyton accrual, metabolism, or ammonium uptake. The reduced accrual, metabolism, and ammonium uptake rate observed in the Dicosmoecus treatment after 21 days persisted 46 days later despite larval removal. Increased grazing pressure by other invertebrates may have prevented a positive response after Dicosmoecus removal, but increased grazing pressure was not observed in control treatments, where periphyton accrual remained similar. The reduced area-specific productivity after 46 days in control treatments suggests that, if anything, grazing pressure was reduced in control treatments. Power (1992) observed mobile grazer densities decline in August and September while the number of sites with Cladophora filaments present increased. If grazer pressure did not compensate for Dicosmoecus removal or increase in control treatments, the reduced area-specific productivity in both the control and Dicosmoecus treatment after 46 days (Pair-wise t-test, t4 = 7.13, p < 0.001) suggests the physical conditions for periphyton growth declined or the algal assemblage underwent senescence. Lack of periphyton recovery following larval removal suggests that Dicosmoecus impacts on periphyton and ecosystem processes may persist well into fall given certain seasonal conditions. We did observe a 5X increase in phosphorus uptake rate after 46 days. One possible explanation is greater cell density, biovolume, or activity by nitrogen fixing species (Nausch et al. 2004). Epithemia spp. cell density and biovolume increased in Dicosmoecus treatments while Rhopalodia sp. cell density and biovolume increased in control treatments. Both diatom species have endosymbiotic cyanobacteria. Their increase, and possible increases in nitrogen fixing activity, may account for the increased phosphorus uptake rate. Steelhead Adding or removing a top predator can induce a trophic cascade when strong trophic links exist (Paine 1980). Steelhead predation on invertebrate predators and grazers in the South Fork of the Eel River can alter periphyton accrual and community structure (Power 1990, Power 1992, Wootton et al. 1996). In a previous study, similarly sized steelhead at a lower density (1.6 m-2 versus 2 m-2) reduced predator abundance (-62%) and algal accrual (-54%), but had no effect on mobile grazer abundance (Wootton et al. 1996). In our study, periphyton accrual and settled organic material was greater in the steelhead treatment than in either the control, Dicosmoecus, and Dicosmoecus+steelhead treatments, suggesting steelhead suppressed grazer activity either through predation or predator cues (McIntosh et al. 2004). When Dicosmoecus was present with steelhead, periphyton accrual was similar to that in the Dicosmoecus treatment. This absence of cascading effects dues to steelhead was likely due to the high periphyton removal rates by Dicosmoecus. Large and armored Dicosmoecus are invulnerable to predation by the small steelhead (Power et al. 1996, Wootton et al. 1996), and any reductions in grazing pressure due to predation on more vulnerable grazers was likely compensated for by Dicosmoecus grazing pressure. Dicosmoecus grazing pressure

12
may have also reduced the number and type of grazers present and weakened trophic links between steelhead and periphyton. McAullife (1984) observed fewer mayflies (Ephemerella doddsi and Baetis spp.) on substrates where the caddisfly Glossosoma were abundant and periphyton abundance was reduced. From short-term manipulations he determined that resource exploitation by Glossosoma was the only mechanism driving the lower mayfly densities. Dicosmoecus have been shown to compete exploitatively in previous studies (Hart 1980, Lamberti et al. 1995) and fewer invertebrate predators and sessile grazers have been observed in the presence of Dicosmoecus (Wootton et al. 1996). Unfortunately, potential impacts of other grazers were not evaluated in the current study. The impacts of Dicosmoecus larvae on periphyton and ecosystem processes will likely vary temporally and spatially with seasonal abiotic conditions and larval ontogeny. For example, disturbance by flooding can dramatically reduce larval densities (77%, Wootton et al. 1996, 83%, Wright and Li 1998). Their ability to resist high velocity flows varies with larval size (Chapter 3), and therefore a given magnitude flood occurring earlier in the season may have a different impact on Dicosmoecus populations than a later occurring flood. The interaction of biotic (which species and how many) and abiotic (hydrologic conditions, temperature, nutrient concentrations) conditions after a flood can dramatically impact community structure later in the season (e.g. Power 1990, Power 1992, Biggs et al. 2005). This, coupled with abiotic conditions that influence periphyton growth, can ultimately influence seasonal productivity and nutrient cycling in a stream. In our study, the absence of Dicosmoecus in July (simulating a late flood occurring in spring), when productivity was the highest in all channels, resulted in higher periphyton accrual, productivity, and nutrient uptake from July and into early September.
Our results suggest that Dicosmoecus larvae increase downstream transport of nutrients and organic particles. Their grazing upstream would reduce local demand for a limiting nutrient. By reducing local deposition of organic material, larval presence will likely increase the distance that both energy (carbon) and nutrients will travel downstream (Newbold et al. 1982) before being taken up by ecosystem components. This has important implications given the number of regulated rivers in the Pacific Northwest and potential impacts of climate change on flood timing, frequency and magnitude. How changes in the hydrologic cycle influence ecosystem processes directly by altering the flux of water and materials, and indirectly via the impact on strong interactors like Dicosmoecus, has immediate value to ecosystem and resource managers. Future research on earlier larval instars, whose mobility, feeding activity and diet can differ from later instars (Hart and Resh 1980, Li and Gregory 1989), will improve our ability to quantify the total potential impact of a cohort on ecosystem processes.

13
Acknowledgements
We would like to thank Ben Steel, Keeley MacNeill, Jim Hood, Camille McNeely, and John Schade for field and laboratory assistance. We thank Paula Furey for her assistance with algal identification. We express our appreciation to Michael Parker for construction of the channels. We thank Peter Steel for logistical support, and the University of California Natural Reserve System for the protected research site. The project was funded by the National Science Foundation via grants to the National Center for Earth Surface Dynamics (EAR 0120914) and to Consumer-Resource Interactions and Stoichiometrically Explicit Spiraling (DEB 0543363).

14
References Biggs, B., V. Nikora, and T. Snelder. 2005. Linking scales of flow variability to lotic ecosystem structure and function. River Research and Applications 21:283-298. Bott, T., J. Brock, and A. Baatrup-Pedersen. 1997. An evaluation of techniques for measuring periphyton metabolism in chambers. Canadian Journal of Fisheries and Aquatic Sciences 54:715-725. Brooks, J., and S. Dodson. 1965. Predation, body size, and composition of plankton. Science 150:28-35 Cooper, D. 1973. Enhancement of net primary productivity by herbivore grazing in aquatic laboratory microcosms. Limnology and Oceanography 18:31-37. Douglas, B. 1958. The ecology of the attached diatoms and other algae in a small stony stream. The Journal of Ecology 46:295-322. Estes, J., and J.F. Palmisan. 1974. Sea otters: Their role in structuring nearshore communities. Science 185:1058-1060. Feminella, J., and C. Hawkins. 1995. Interactions between stream herbivores and periphyton: a quantitative analysis of past experiments. Journal of the North American Benthological Society 14:465-509. Flint, R., and C. Goldman. 1975. The effects of a benthic grazer on the primary productivity of the littoral zone of Lake Tahoe. Limnology and oceanography 20:935-944. Hart, D. 1981. Foraging and resource patchiness: field experiments with a grazing stream insect. Oikos 37:46-52. Hart, D., and V. Resh. 1980. Movement patterns and foraging ecology of a stream caddisfly larva. Canadian Journal of Zoology 58:1174-1185. Hill, W., and A. Knight. 1987. Experimental analysis of the grazing interaction between a mayfly and stream algae. Ecology 68:1955-1965. Hillebrand, H., C. Dürselen, D. Kirschtel, U. Pollingher, and T. Zohary. 1999. Biovolume calculation for pelagic and benthic microalgae. Journal of Phycology 35:403-424. Holmes, R., A. Aminot, R. Kérouel, and B. Hooker. 1999. A simple and precise method for measuring ammonium in marine and freshwater ecosystems. Canadian Journal of Fisheries and Aquatic Sciences 56:1801-1808.

15
Lamberti, G., L. Ashkenas, S. Gregory, and A. Steinman. 1987. Effects of three herbivores on periphyton communities in laboratory streams. Journal of the North American Benthological Society 6:92-104. Lamberti, G., S. Gregory, and L. Ashkenas. 1989. Productive capacity of periphyton as a determinant of plant-herbivore interactions in streams. Ecology 6:1840-1856. Lamberti, G., S. Gregory, L. Ashkenas, and J. Li. 1995. Influence of grazer type and abundance on plant-herbivore interactions in streams. Hydrobiologia 306:179-188. Lehman, J. 1980. Release and cycling of nutrients between planktonic algae and herbivores. Limnology and Oceanography 25:620-632. Li, J., and S. Gregory. 1989. Behavioral changes in the herbivorous caddisfly Dicosmoecus gilvipes (Limnephilidae). Journal of the North American Benthological Society 8:250-259. MacArthur, R. Strong, or weak, interactions? 1972. Transactions, The Connecticut Academy of Arts and Sciences 44:177-188. Marks, J., M. Power, and M. Parker. 2000. Flood disturbance, algal productivity, and interannual variation in food chain length. Oikos 90:20-27. McAuliffe, J. 1984. Resource depression by a stream herbivore: effects on distributions and abundances of other grazers. Oikos 42:327-333. McIntosh, A., B. Peckarsky, and B. Taylor. 2004. Predator-induced resource heterogeneity in a stream food web. Ecology 85:2279-2290. Mulholland, P., J. Newbold, and J. Elwood. 1983. The effect of grazing intensity on phosphorus spiralling in autotropic streams. Oecologia 58:358-366. Mulholland, P., A. Steinman, A., and E. Marzolf. 1994. Effect of periphyton biomass on hydraulic characteristics and nutrient cycling in streams. Oecologia 72:966-982. Mulholland, P., A. Steinman, and A. Palumbo. 1991. Role of nutrient cycling and herbivory in regulating periphyton communities in laboratory streams. Ecology 3:966-982. Nausch, M., G. Nausch, and N. Wasmund. 2004. Phosphorus dynamics during the transition from nitrogen to phosphate limitation in the central Baltic Sea. Marine Ecology Progress Series 266:15-25. Newbold, J., R. O'neill, J. Elwood, and W. Van Winkle. 1982. Nutrient spiralling in streams: implications for nutrient limitation and invertebrate activity. The American Naturalist 120:628:652.

16
Nicotri, M. 1977. Grazing effects of four marine intertidal herbivores on the microflora. Ecology 58:1020-1032. Paine, R. 1980. Food webs: linkage, interaction strength and community infrastructure. Journal of Animal Ecology 49:667-685. Porter, K. 1976. Enhancement of algal growth and productivity by grazing zooplankton. Science 192:1332-1334. Power, M.E. 1990. Effects of Fish in River Food Webs. Science 250:811-814. Power, M.E. 1992. Hydrologic and trophic controls of seasonal algal blooms in northern California rivers. Archiv fur Hydrobiologie 125:385-410. Power, M.E. 1990. Resource enhancement by indirect effects of grazers: armored catfish, algae, and sediment. Ecology 71:897-904. Power, M.E. , M. S. Parker, and J.T. Wootton. 1996. Disturbance and food chain length in rivers. In: Food Webs: Integration of Patterns and Dynamics (eds G. A. Polis & K. O. Winemiller) pp. 286–297. Chapman & Hall, New York. Rosemond, A.D., P.J. Mulholland, and J.W. Elwood. 1993. Top-down and bottom-up control of stream periphyton: effects of nutrients and herbivores. Ecology 74:1264-1280. Round, F.E., R.M. Crawford, D.G. Mann. 1990. The Diatoms- Biology and Morphology of the Genera. Cambridge University Press. Cambridge, U.K. Steinman, A. 1991. Effects of herbivore size and hunger level on periphyton communities. Journal of Phycology 27:54-59. Taylor, B., C. Keep, R. Hall Jr., and B. Koch. 2007. Improving the fluorometric ammonium method: matrix effects, background fluorescence, and standard additions. Journal of the North American Benthological Society 26:167-177. Vanni, M. 2002. Nutrient cycling by animals in freshwater ecosystems. Annual Review of Ecology and Systematics 33:341-370. Vanni, M. 1996. Nutrient transport and recycling by consumers in lake food webs: implications for algal communities. In: Food Webs: Integration of Patterns and Dynamics (eds G. A. Polis & K. O. Winemiller) pp. 81–95. Chapman & Hall, New York. Vitousek, P., and R. Howarth. 1991. Nitrogen limitation on land and in the sea: how can it occur? Biogeochemistry 13:87-115.

17
Wallace, J., and J. Webster. 1996. The role of macroinvertebrates in stream ecosystem function. Annual Review of Entomology 41:115-139. Wehr, J., and R. Sheath. . Freshwater algae of North America: ecology and classification. pp. 918. Academic Press, New York. Wiggins, G. 1977. Larvae of the North American caddisfly genera (Trichoptera). pp. 401. University of Toronto Press, Toronto and Buffalo. Wolman, M., and A. Union. 1954. A method of sampling coarse river-bed material. American Geophysical Union, Transactions 35:951-956. Wootton, J., M. Parker, and M.E. Power.1996. Effects of disturbance on river food webs. Science 273:1558-1561. Wright, K., and J. Li. 1998. Effects of recreational activities on the distribution of Dicosmoecus gilvipes in a mountain stream. Journal of the North American Benthological Society 17:535-543. Zanetell, B., and B. Peckarsky. 1996. Stoneflies as ecological engineers - hungry predators reduce fine sediments in stream beds. Freshwater Biology 36:569-577.

18
19
Tables

20
Figure Legends Figure 1. Organic matter (AFDM) accrual in the different treatments over the course of the experiment. Figure 2. Chlorophyll a accrual in the different treatments over the course of the experiment. Figure 3. Accrual of loose organic (a) and mineral (b) material after 14 days. Letters above columns represent relationship between treatments determined by Tukey’s test (α= 0.05). Treatments with a different letter are significantly different. Figure 4. Algal cell density (a) and biovolume (b) for control (white bar), steelhead (black bar), Dicosmoecus (light grey bar), and Dicosmoecus+steelhead (dark grey bar). Figure 5. Area-specific GPP (a) and biomass-specific GPP (b) in the different treatments over the course of the experiment. Figure 6. Area-specific (a) and biomass-specific (b) ammonium uptake rate in the different treatments over the course of the experiment. Figure 7. Area-specific phosphorus uptake rate (a) and biomass-specific phosphorus uptake rate (b) in the different treatments over the course of the experiment. Figure 8. Ammonium to phosphorus uptake ratio for the different treatments.

21
Figure 1

22
Figure 2

23
Figure 3
a.!
!!
!!
!!
!
b.

24
Figure 4
Day 1
Day 67
Day 21
Day 14
Day 67
Day 21
Day 14
Day 1a. b.

25
Figure 5
a.!
!!
!!
!!
!b.

26
Figure 6
a.!
!!
!!
!!
!b.

27
Figure 7
a.!
!!
!!
!!
!b.

28
Figure 8

29
CHAPTER 2
Ontogenic shift in habitat use and critical flow threshold by the caddisfly Dicosmoecus gilvipes.
Abstract A species vulnerability to disturbance can vary with organism ontogeny. We investigated whether flood timing would have a differential impact on Dicosmoecus gilvipes populations. Specifically, we measured whether critical flow thresholds and habitat use vary with Dicosmoecus larval size. Critical flow threshold increased with larval size, as did larval flow velocity preference. The results suggest early flood events will have a greater impact on Dicosmoecus populations than later flood events of a similar magnitude, and during low-flow periods the interaction between Dicosmoecus distribution, periphyton composition and productivity, and flow velocity may significantly impact ecosystem processes on smaller scales. Introduction
Disturbance by flooding can dramatically disrupt population and community structure in stream ecosystems (Seegrist and Gard 1972, Fisher et al. 1982, Hemphill and Cooper 1983, Resh et al. 1988, Scrimgeour et al. 1988). Floods can dislodge organisms on the bed surface and amongst the bed sediment if bed materials are mobilized (Power and Stewart 1987, Erman et al. 1988, Biggs 1995). When strongly interacting species are affected, both food web dynamics and ecosystem processes can be altered (Power et al. 1995, Chapter 4), and effects can persist well after the flood event (e.g. Elwood and Waters 1969).
Some benthic organisms have refuge seeking behaviors (e.g. Meffe 1984, Lytle 2002) or life histories (e.g. Lytle 2002, Gray and Fisher 1981) that protect individuals from flood events. Organisms unable to find refuge must rely on strength, swimming ability, weight, and/or contact with the bed surface to withstand the currents. At a critical flow threshold, the hydraulic forces of lift and drag overcome the organism’s ability to maintain position through swimming or resistance. Knowledge of this critical flow threshold is crucial to predicting when and where increases in flow will remove an organism. If the threshold varies with organism ontogeny, a flood event occurring early in the season, when the organism is small, may have a different impact than a flood occurring later, when the organism is larger. The critical flow threshold required to initiate motion of non-living mineral particles and how this threshold varies with particle size has been well studied by geomorphologists (e.g. Shields 1936, Fenton and Abbott 1977, Wiberg and Smith 1987, Buffington and Montgomery 1977). The critical shear stress required to initiate particle movement is a function of the particle weight, particle protrusion, particle exposure, and intergranular friction angle (e.g. Fenton and Abbot 1977, Wiberg and Smith 1987, Kirchner et al. 1990, Johnston and Andrews 1998). Protrusion and exposure influence the lift and drag forces on the particle, while weight and intergranular friction angle resist movement. Other factors controlling critical shear stress, include particle size distribution

30
(Parker et al 1982, Dietrich et al. 1989), bed surface roughness (Naot 1984), and bed slope (Lamb et al. 2008), all of which influence particle protrusion, exposure, and flow turbulence. For example, on a bed with mixed grain sizes the smaller particles can ‘hide’ amongst larger ones and reduce their protrusion and exposure to flow. Larger particles, although heavier, protrude more and are more exposed on a mixed bed, and they experience greater lift and drag forces than smaller particles These particle tradeoffs can lead to a bed condition in which all the particles begin motion at the same critical shear, typically scaled by the median grain size of the bed (Parker et al. 1982). How the critical flow threshold will vary with living organisms is less clear. Hydraulic forces should increase proportionally with organism size if morphology does not change significantly with growth. Resistance forces, however, consist of both passive (weight) and active components (e.g. muscle strength, claws, fins, tenacity). The resistance components, and how they scale relative to the hydraulic forces, will determine how the critical flow threshold varies with organism ontogeny. Organisms will likely become stronger as they grow, but how strength increases relative to hydraulic forces exerted on their larger bodies is unknown. Their tenacity vs tendency to drift might also vary due to ontogenic changes in behavior (Hart and Resh 1980). In the current study, we examine how hydraulic and resistance force influence the critical flow threshold for the caddisfly larva (Trichoptera) Dicosmoecus gilvipes (Hagen).
Dicosmoecus gilvipes is a strong interactor (sensu MacArthur 1972, Paine 1980) in northern California stream ecosystems. The larvae can control algal accrual, reduce local invertebrate densities (Hart 1981, Lamberti and Resh 1983, Wootton et al. 1996), and alter energy and nutrient flowpaths in a stream ecosystem (Power et al. 1995, Limm unpublished). The larvae are also vulnerable to high flows. Wootton et al. (1996) observed a 77% decrease in larval density after an April flood event. Greater larval densities have been observed during years when floods were absent and in rivers with regulated peak flows (Power et al. 1995, Wootton et al. 1996). By quantifying how the critical flow threshold varies for different sized Dicosmoecus larva, we can address whether disturbance severity (sensu Sousa 1984) for a flood of a given magnitude varies with flood timing. If a single critical flow threshold can characterize a population, it will simplify models used to predict flood impacts on a population. Second, variation in critical flow threshold with organism size may explain ontogenic shifts in habitat use and distribution.
In the current study, we measure the critical flow velocity required to dislodge different sized Dicosmoecus larvae from a rock surface. From the empirical data we calculate larval resistance force and two dimensionless numbers, Weber number and Shields stress, to investigate how the critical flow threshold varies with larval size and Reynolds number. In addition, we quantify habitat use by Dicosmoecus larvae in a coastal California stream to assess whether critical flow thresholds influence larval distribution. Methods Study area Experiments were conducted in Elder Creek within the Heath and Marjorie Angelo

31
Coast Range Reserve in Mendocino County, California (39°44”N 123°39”W, Figure 1). Elder Creek drains 17 km2. The bed substrate consists of a thin layer of cobble and gravel over bedrock. The study area has a Mediterranean climate with wet, cool winters and warm, dry summers. The habitat consists of shallow runs, riffles, and pools during summer low flow periods. Vegetation in the watershed is a mixed-decidous evergreen forest dominated primarily by old-growth Douglas fir (Pseudotsuga menziesii) redwood (Sequoia sempervirens) and tanoak (Lithocarpus densiflorus). The major aquatic food web components consist of producers (primarily diatoms and filamentous green algae), grazing insects (midges, mayflies, caddisflies), predatory insects (stoneflies, aquatic beetles, naucorid bugs), and predatory vertebrates (Rough skinned newt, Taricha granulosa, Pacific giant salamander, Dicamptodon ensatus, juvenile steelhead, Oncorhynchus mykiss). In Elder Creek and in the larger Eel River, Dicosmoecus gilvipes has a univoltine life cycle. Larvae emerge from eggs during February-March and build cases out of silk and organic materials that include Douglas-Fir needles (Figure 1). As they grow, the larvae increase the mineral content of their cases and by the fifth instar, the case is made entirely of silk and minerals. In April, second instar densities can reach 160 m-2. By mid-July the fifth instar larvae adhere to the underside of rocks and begin diapause. Winged adults emerge in September. Biometric measurements To quantify relationships between caddisfly case length, diameter, and frontal projected area, we collected thirty Dicosmoecus larvae from Elder creek in May, June, and July 2008. In the laboratory each larva and its case were photographed using two cameras on fixed tripods. To quantify case length and case diameter, we photographed the larva and a calibration scale with a camera was placed 0.5 m directly above. To quantify frontal projected area, we placed the camera 1.5 m in front of a larva with the lens axis directly in line with the larvae. We analyzed the images with ImageJ software (http://rsbweb.nih.gov/ij/index.html). Critical velocity We used a water jet to manipulate in situ flow velocity and quantify the critical near-bed velocity required to dislodge Dicosmoecus larvae. The water jet was generated using a 12 V water pump (Rule-Mate 750, ITT Corporation) connected to a flexible tube with a 0.019 m diameter. At the end of the flexible tube we attached a 1.2 m long x 0.019 m diameter solid tube with an adjustable valve. We calibrated the adjustable valve with a Marsh McBirney Flowmate 2000 flowmeter so that each incremental adjustment increased water velocity 0.05 m/s. The solid tube was angled 120 degrees 0.05 m prior to the nozzle. We began each trial by locating undisturbed individual larva on large cobble, boulder, or bedrock surfaces and measuring their case length with a ruler and view box. Only larvae on flat, relatively horizontal surfaces were targeted. We then placed the nozzle, with the adjustable valve closed, 0.05 m directly in front of the larva. The solid tube was set parallel to the rock surface to ensure parallel flow with respect to the
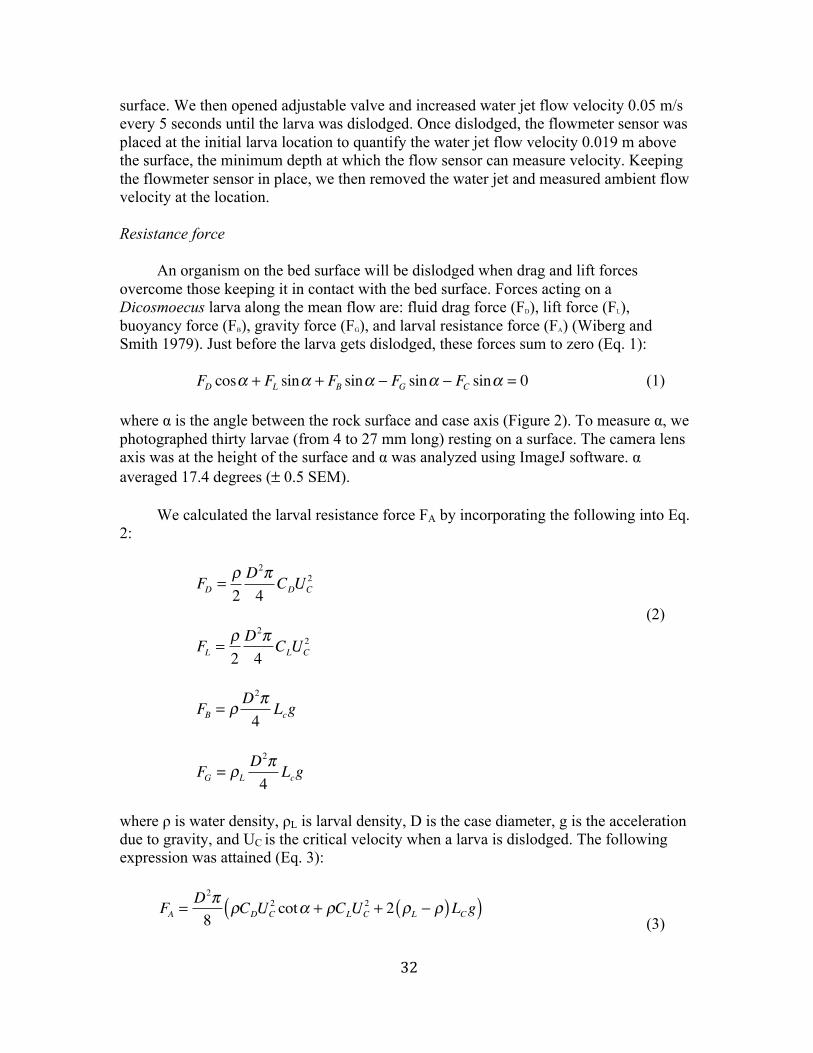
32
surface. We then opened adjustable valve and increased water jet flow velocity 0.05 m/s every 5 seconds until the larva was dislodged. Once dislodged, the flowmeter sensor was placed at the initial larva location to quantify the water jet flow velocity 0.019 m above the surface, the minimum depth at which the flow sensor can measure velocity. Keeping the flowmeter sensor in place, we then removed the water jet and measured ambient flow velocity at the location. Resistance force An organism on the bed surface will be dislodged when drag and lift forces overcome those keeping it in contact with the bed surface. Forces acting on a Dicosmoecus larva along the mean flow are: fluid drag force (FD), lift force (FL), buoyancy force (FB), gravity force (FG), and larval resistance force (FA) (Wiberg and Smith 1979). Just before the larva gets dislodged, these forces sum to zero (Eq. 1): FD cosα + FL sinα + FB sinα − FG sinα − FC sinα = 0 (1) where α is the angle between the rock surface and case axis (Figure 2). To measure α, we photographed thirty larvae (from 4 to 27 mm long) resting on a surface. The camera lens axis was at the height of the surface and α was analyzed using ImageJ software. α averaged 17.4 degrees (± 0.5 SEM). We calculated the larval resistance force FA by incorporating the following into Eq. 2:
FD =
ρ2D2π4
CDUC2
(2)
FL =
ρ2D2π4
CLUC2
FB = ρ D
2π4
Lcg
FG = ρL
D2π4
Lcg
where ρ is water density, ρL is larval density, D is the case diameter, g is the acceleration due to gravity, and UC is the critical velocity when a larva is dislodged. The following expression was attained (Eq. 3):
FA =
D2π8
ρCDUC2 cotα + ρCLUC
2 + 2 ρL − ρ( )LCg( ) (3)

33
We used 0.8 for the drag (CD) and lift (CL) coefficients, an estimate for a cylinder with the long axis parallel to the flow (Munson et al. 1998), and previously used for the caddisfly Allogamus auricollis (Waringer 1989). Dimensional analysis Dimensional analysis can provide insight into system properties across multiple spatial and temporal scales, independent of the unit of measurement used to quantify the physical variables involved. A common dimensionless number used in fluid mechanics is the Reynolds number, Re (Eq. 4):
Re = ULν
(4)
where U denotes the fluid velocity, L is a characteristic length scale, and ν is the fluid kinematic viscosity. Re describes the ratio of inertial to viscous forces on an element of fluid and is useful for characterizing the flow regime around objects of different lengths. For example, small macroinvertebrates live at lower Re than large macroinvertebrates in similar flow conditions (Statzner 1988). At lower Re the viscous forces, and therefore friction drag, play a larger role in the fluid environment experienced by the smaller organisms. We examine two dimensionless numbers for understanding critical flow conditions with respect to Dicosmoecus larvae. The Weber number (Eq. 5):
We = ρU 2Dσ A
(5)
is a ratio of the inertial force of the moving fluid to the resistance force. In our study, larvae ‘resistance’ consists of both active (FA) and passive (FG , FB) forces. The active component FA is a function of larval strength, larval claws, friction between the claws and surface, and behavior (tenacity). Since all of these may scale with larval size we can consider: FA ≈ (characteristic length, attachment coefficient) We used case diameter, D, for the characteristic length. The resistance coefficient is defined as σ A = FA / D . The critical Weber number denotes when the inertial force of the fluid reaches a critical value relative to the larval resistance force, and the larva is dislodged. By plotting Weber number versus morphometric ratio Lc/D, we can evaluate the relationship across different combinations of U, Lc, and D. From empirical data collected on inorganic particles, motion will occur when a critical shear stress (τb) is reached. In dimensionless form, τb/ρRDg (with R equal to ρlarvae − ρwater
ρwater) is termed the Shields stress (τc
*). When Shields stress is plotted against
Reynolds roughness (U∗D/ν), the resulting curve denotes the threshold for initial particle

34
motion. We calculated the Shields stress of a living Dicosmoecus larva by: 12ρ D
2π4
CDUm2 + tanα 1
2ρ D
2π4
CLUm2 = tanα(ρR D
2π4
LCg + Dσ A )
then,
ρUm2 (12D2π4
CD + tanα 12D2π4
CL ) = tanα(ρRD2π4
LCg + Dσ A ) (6)
From Wygnanski (1992), we calculated the fluid function ψ for maximum velocity Um and shear velocity U* for a water jet:
ψ =Um
U*
= 3.85ξ0.063 (7)
where ξ =XJν 2
, X equals distance from the nozzle (0.05 m), J= U2b with b equal to the
nozzle opening (0.019 m), and ν is the kinematic viscosity. For the range of velocities measured in our study ψ averaged 11.8 (±0.03 SEM). Substituting U*
2ψ 2 for Um in Eq. 6:
ρU*2ψ 2 (1
2D2π4
CD + tanα 12D2π4
CL ) = tanα(ρRD2π4
LCg + Dσ A )
Boundary shear stress τ b = ρU*
2 , and our resulting equation for the non-dimensional Shields stress is:
τC* = τ b / ρRDg =
2 tanα(CD + tanαCL )ψ
2 (LcD
+4σ A
ρRD2πg) (8)
Larval habitat use To quantify whether flow velocity influences Dicosmoecus larval distribution we set up 16 cross-stream transects 5 m apart (longitudinally) in an 80 m long reach of Elder Creek. The reach contained multiple pool-riffle-run complexes. The average wetted width was 6 m and the average depth along the thalweg was 0.36 m. The deepest pool was 0.81 m deep and average slope was 0.024. Along each transect we measured near-bed water velocity (0.019 m above the bed surface), water depth, substrate size, Dicosmoecus larval density, and larval case lengths every 0.5 m. At each sampling point along the transect, we recorded the number of Dicosmoecus larvae in a 0.031 m2 area using a view-box and measured the case length of all individual larvae using a ruler. A Marsh McBirney Flowmate 2000 flow meter was used to measure water velocity. We used Pearson product-moment correlations (JMP software) to assess correlations between the physical

35
variables in May, June, and July. To assess instar preference for a specific depth, flow velocity, or substrate size, we Jacobs Selectivity Index D (Jabob 1974): D = (r − p) / (r + p − 2rp) (9) where r is the proportion of larvae observed in a particular physical condition and p is the proportion of a particular physical condition to total available in the stream. If larvae show exclusive use a particular physical condition, D will equal +1. If larvae show complete avoidance of a particular physical condition, D will equal -1. On June 12th we sampled periphyton within the experimental reach. In order to sample along a velocity gradient we characterized the pool (depth > 0.25m), run (depth between 0.10-0.24m), and riffle (depth 0-0.09m) habitats in the reach and stratified where random points would be selected. A measuring tape was placed along the reach centerline and a random number generator was used to select six points in each habitat type. At each longitudinal point, a measuring tape was placed across the stream and perpendicular to the current. A random number generator was used to select the rock to be scraped for periphyton. Prior to removing the rock, the depth and near-bed velocity was measured and a curved barrier was placed just upstream of the rock to decrease flow velocity. The rock was then slowly lifted and lightly rinsed with water to remove loose sediment. The loose sediment was collected in a pan and any invertebrates were removed. The sediment and water was placed in a 1 L bottle and stored in a cooler. A template of known area was placed on the rock and periphyton was removed with a wire brush. The periphyton was rinsed into a 50 mL jar. In the lab, both the sediment and periphyton scraping were filtered onto a glass-fiber filter (GFF, Whatman Co.). Each filter was dried at 50°C for 48 hours, weighed, ashed in a muffle furnace for 2 hours at 550°C, and re-weighed to quantify ash-free dry mass (AFDM). Streambed availability To assess the total area of the streambed at specific velocities, we imported the transect data in a GIS system (ESRI ArcGIS) as non-georeferenced point locations. Y values started at 0 upstream and incremented + 5 meters for each transect. X values started at stream left, facing downstream and incremented moving right at 0.5 meter intervals. To convert from point to grid, a spline method was adopted. Spline methods estimate values using a mathematical function that minimizes overall surface curvature, resulting in a smooth surface that passes exactly through the input points (Franke 1982, ESRI 2009). The spline grid of near bed velocity was organized into 27 categories from 0 to 48 cm/s at increments of 2, then 50 & 100 cm/s. For each instar, the average critical velocity from the water jet experiment and average ambient velocity from transect data were used to calculate the available streambed area available to larvae. We followed the case diameter criteria calculated by Li and Gregory (1989) to categorize instar. Results Critical velocity

36
We quantified the critical flow velocities for 162 Dicosmoecus larvae (Figure 5). Critical flow velocity increased with larval size (p< 0.001, Table 1). Average critical flow velocity across all larvae was 0.27 m/s (±0.01, SE). Variation in critical flow velocity for a specific-size instar was high (R2=0.09). Resistance force Using the biometric measurements (Figures 3 and 4) and Eq. (4), we calculated the larval resistance force. The larval resistance force increased with case diameter (p<0.0001, R2=0.27, Figure 6, Table 1). Resistance forces ranged from 0.0002 to 0.02 N. The average resistance force across all instars was 0.006 N (±0.0003, SE). Dimensional analysis Weber number The critical Weber number calculated from water jet removal experiments ranged from 0.29 to 0.52 (Figure 7) with a mean value of 0.34 (±0.003, SE). The critical Weber number increased with larval size (Table 1). Weber number values calculated from ambient flow conditions (Figure 7) were well below critical values, and averaged 0.04 (±0.003, SE). Shields stress Shields stress (τC
* ) values for Dicosmoecus larvae were significantly higher than the empirically derived Shields curve that denotes the threshold for motion of inorganic particles (Shields 1936, Parker 2003, Figure 8). Shields stress ranged between 0.17 and 5.22 (Table 1). Critical Reynolds numbers ranged between 23.5 and 220.5. When the larval resistance force was set to zero (σ A = 0 in Eq. 8), Shield stress values were nearly 100-fold smaller, and the values were clumped around the Shields curve. Larval habitat use We measured physical conditions and Dicosmoecus larvae density at 180 positions along the 80 m reach. Total streambed area available to Dicosmoecus in May was 530 m2. Since ninety-seven percent of the second instar size class was observed May we used May physical condition availability for analysis. Habitat use by third and fourth instars was compared to physical condition availability in June and July, respectively. In May, near-bed flow velocity, water depth, and substrate size were not correlated with locations where Dicosmoecus larvae were present. In June, substrate size was significantly correlated with near-bed velocity (p<0.001) and depth (p=0.001). In July, only velocity and depth values were correlated (p= 0.02). Assuming our instantaneous measurement of larval presence reflects the physical conditions utilized by the larvae, all instars preferred specific flow velocities (Figure 9, Table 2). Second instar larvae preferred velocities between 0-0.03 m/s while third, fourth, and preferred faster velocities above 0.03 m/s but below 0.19 m/s. Dicosmoecus larvae were rarely found in water deeper than 0.6 m (Figure 10). Second instar larvae preferred depths from 0 to 0.3 m. Third instar larvae preferred

37
depths from 0.1 to 0.4 m and under-utilized other depths. Fourth instar larvae showed the largest range of preferred depths, from 0.1 to 0.6 m. Fifth instar larvae preferred depths from 0 to 0.3 m. Larval preference for a specific substrate size was less clear (Figure 11). All instars under-utilized substrates smaller than 0.05 m. For larger substrate sizes, the difference between proportion utilized by larvae and proportion available was rarely greater than 10%. Fifth instar larvae did show a preference for substrates between 0.15-0.3 m. As near-bed velocity increased in the reach, periphyton AFDM decreased (Figure 12a). AFDM was nearly ten times greater in the slower velocity pools than in the fast velocity riffles. Loose organic sediment on the rocks also decreased with velocity (Figure 12b), and contributed between 0 to 13 percent of total organic material on the rocks. Streambed area Based on the average critical velocity for each instar (Table 1), 14 percent of the experimental reach is unavailable to second instar larvae. Six percent of the reach is unavailable to third and fourth instar larvae while fifth instar larve can access all but three percent. As the average ambient velocity they were observed in increased up to the fourth instar, so did the streambed area available (Table 2). For fifth instar larvae, the streambed area decreased based on the lower average ambient velocity they were observed in. Discussion Critical flow threshold
Flow has long been recognized as an important factor controlling caddisfly distribution and morphology (Rousseau 1921, Webster and Webster 1943). For Dicosmoecus gilvipes, critical flow conditions vary with larval size. As the larvae grow, their resistance force increases disproportionately more than the size-induced increase in hydraulic forces, allowing them to withstand higher flow velocities.
We can assess whether passive and/or active resistance force component(s) are responsible for the increased flow resistance with size by graphing the relationship between hydraulic force components and resistance force components (Figure 13). The active component, calculated by subtracting the passive component (larval weight) from total resistance force, increases with respect to hydraulic force at a greater rate than the passive larval weight. A similar pattern between passive and active resistance components was observed in the caddisfly Allogamus auricollis (Waringer 1989). Some aspect of the active component- larval strength, their claws, friction between claws and surface, tenacity- is responsible for the increased critical flow threshold with larval size.
The positive relationship between larval size and critical flow threshold was evident in the dimensionless plot of Weber number versus morphometric ratio. Critical Weber number, which relates critical flow conditions to organism length, diameter, and contact coefficient, increased with larvae size. Our results suggest the Weber number may be a useful tool for predicting organism removal when a contact coefficient (σA=Fc/characteristic length) can be estimated from empirical data. While the

38
relationship between Weber number and morphometric ratio could be criticized for having the same dimensioned parameter (diameter) in both dimensionless parameters, leading to spurious correlation, Parker and others (2003) argue that, “an appropriate dimensionless correlation is more likely to be in accord with the underlying physics than a correlation of parameters of differing dimensions”. When calculating the dimensionless Shields stress for different sized larvae we followed the physics-based approach Wiberg and Smith (1987) used for mineral particles. When we did not include the organism resistance component (FA), the physical model predictions agreed closely with values along the empirically derived Shields curve. Larval motion was initiated at the same Shields stress as similar sized mineral particles. When the resistance component was included, Shields stress increased roughly 100-fold, further evidence that the active component of resistance dominates their ability to withstand hydraulic forces.
The active component may also explain the variation in Shields stress we observed for a given Reynolds roughness. Individual larva may respond differently to experimental conditions due to variation in their strength, physical condition, and/or tenacity. Our experimental methods may have also influenced the variability. We measured the critical flow velocity 0.019 m above the surface using a time-averaging flow meter. Peak velocities due to periodic sweeps of high momentum fluid were not measured. These turbulent fluctuations around the time-averaged value we measured can significantly elevate shear stresses above mean values. Localized peak velocities can vary greater than 70 percent and play an important role in mobilizing mineral particles (Knighton 1998). In addition, we applied the water jet in situ, and background eddy structure may have influenced flow conditions around individual larva.
We used the same coefficient for both lift and drag. Both drag and lift influence particle entrainment and the importance of each can shift with particle size (Stautzner 1988). Drag and lift coefficients may also vary with Reynolds number (Vogel 1996, Full and Koehl 1998). Actual values for the different sized instars should be experimentally derived. Despite the observed variation, incorporating the resistance force into the Shields stress equation can be useful for forecasting where larvae will persist after a flood. The upper Shields stress threshold for the larvae can be compared to predicted values from hydraulic models. For example, using the HEC-RAS (http://www.hec.usace.army.mil/), a 1D hydraulic model that uses energy conservation to solve for steady, non-uniform flow along an arbitrary channel geometry, we can calculate bed shear stress at a given position in a river during a flood. Bed shear stress can be non-dimensionalized with respect to the caddisfly larvae and plotted with respect to river position (Figure 14). Where the non-dimensionalized Sheilds stress is lower than the larval threshold we would expect the larvae to persist. We acknowledge that using a 1D hydraulic model has limitations. The models cannot accurately reproduce turbulent eddies and other complex flow patterns found in natural streams. Typically a river is subdivided into rectangular cells for which a uniform depth and velocity are calculated. For the data presented in Figure 14, the Shields stress calculation is for a 100m reach (cell). Smaller scale bed features that influence eddy formation and peak shear stress are not included, nor are possible larval responses to increasing flows. Grain size distribution, pebble clusters, and vegetated banks can alter
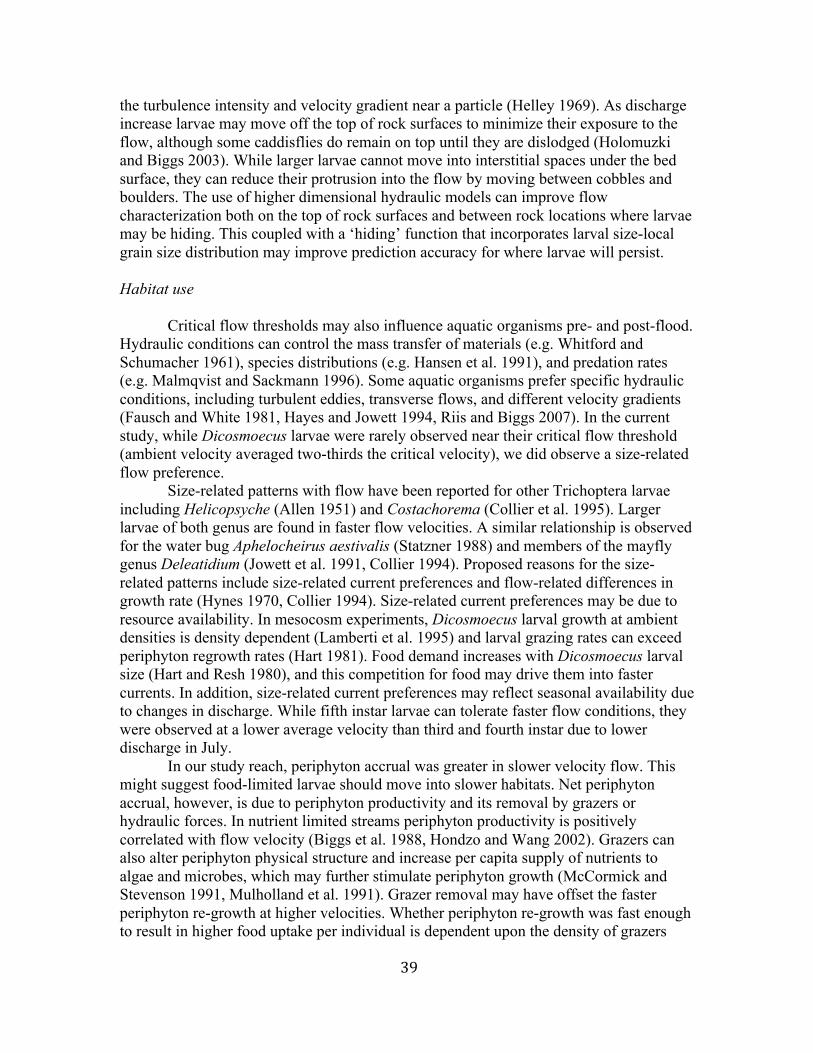
39
the turbulence intensity and velocity gradient near a particle (Helley 1969). As discharge increase larvae may move off the top of rock surfaces to minimize their exposure to the flow, although some caddisflies do remain on top until they are dislodged (Holomuzki and Biggs 2003). While larger larvae cannot move into interstitial spaces under the bed surface, they can reduce their protrusion into the flow by moving between cobbles and boulders. The use of higher dimensional hydraulic models can improve flow characterization both on the top of rock surfaces and between rock locations where larvae may be hiding. This coupled with a ‘hiding’ function that incorporates larval size-local grain size distribution may improve prediction accuracy for where larvae will persist. Habitat use
Critical flow thresholds may also influence aquatic organisms pre- and post-flood. Hydraulic conditions can control the mass transfer of materials (e.g. Whitford and Schumacher 1961), species distributions (e.g. Hansen et al. 1991), and predation rates (e.g. Malmqvist and Sackmann 1996). Some aquatic organisms prefer specific hydraulic conditions, including turbulent eddies, transverse flows, and different velocity gradients (Fausch and White 1981, Hayes and Jowett 1994, Riis and Biggs 2007). In the current study, while Dicosmoecus larvae were rarely observed near their critical flow threshold (ambient velocity averaged two-thirds the critical velocity), we did observe a size-related flow preference.
Size-related patterns with flow have been reported for other Trichoptera larvae including Helicopsyche (Allen 1951) and Costachorema (Collier et al. 1995). Larger larvae of both genus are found in faster flow velocities. A similar relationship is observed for the water bug Aphelocheirus aestivalis (Statzner 1988) and members of the mayfly genus Deleatidium (Jowett et al. 1991, Collier 1994). Proposed reasons for the size-related patterns include size-related current preferences and flow-related differences in growth rate (Hynes 1970, Collier 1994). Size-related current preferences may be due to resource availability. In mesocosm experiments, Dicosmoecus larval growth at ambient densities is density dependent (Lamberti et al. 1995) and larval grazing rates can exceed periphyton regrowth rates (Hart 1981). Food demand increases with Dicosmoecus larval size (Hart and Resh 1980), and this competition for food may drive them into faster currents. In addition, size-related current preferences may reflect seasonal availability due to changes in discharge. While fifth instar larvae can tolerate faster flow conditions, they were observed at a lower average velocity than third and fourth instar due to lower discharge in July.
In our study reach, periphyton accrual was greater in slower velocity flow. This might suggest food-limited larvae should move into slower habitats. Net periphyton accrual, however, is due to periphyton productivity and its removal by grazers or hydraulic forces. In nutrient limited streams periphyton productivity is positively correlated with flow velocity (Biggs et al. 1988, Hondzo and Wang 2002). Grazers can also alter periphyton physical structure and increase per capita supply of nutrients to algae and microbes, which may further stimulate periphyton growth (McCormick and Stevenson 1991, Mulholland et al. 1991). Grazer removal may have offset the faster periphyton re-growth at higher velocities. Whether periphyton re-growth was fast enough to result in higher food uptake per individual is dependent upon the density of grazers

40
present, their size and size-specific grazing rates, and periphyton growth rates across the range of velocities and growing conditions (light and nutrients), none of which were quantified in our study.
In addition to food quantity, food type and food quality may influence size-related patterns with flow velocity. In Big Elk Creek (Oregon Coast Range, U.S.A.) Dicosmoecus larvae shift their feeding effort from diatoms during their third instar to filamentous algae during the fourth and fifth instars (Li and Gregory 1989). Hart (1981) observed Dicosmoecus densities ten times greater on detached clumps of filamentous Cladophora. At Big Sulfur Creek, where Hart conducted the study, Cladophora is typically found in faster flow conditions inaccessible to Dicosmoecus, and the increased density on Cladophora may reflect the importance of maximizing food quantity or quality prior to pupation (Anderson and Cummins 1979, Hart and Resh 1980).
The nutritive quality of periphyton may also be affected by velocity. One reason proposed for the positive relationship between periphyton growth and velocity, as mentioned above, is a thinner diffusive boundary layer. As flow velocity increases, reduction or disruption of the diffusive boundary layer by turbulent eddies improves mass transfer of nutrients across the water-periphyton interface and can increase algal nutrient uptake (Whitford and Schumacher 1961). When inorganic N and P availability is increased in lake and streams, periphyton N and P concentrations increase (Hillebrand Kahlert 2001, Stelzer and Lamberti 2001), and therefore Dicosmoecus larvae may be tracking higher quality food in faster flow conditions.
Oxygen may also drive size-related current preferences. For organisms that depend on passive diffusion of oxygen across gills or body surface (Hynes 1970), the decrease in surface area to volume ratio with body size can make it difficult to meet oxygen demands. Moving into faster, well-mixed flows can increase the movement of well oxygenated water through their case and past their gills. Large Dicosmoecus larvae were observed in both fast and slow flow velocities in our study reach, however, and we did not observe any larvae leaving their case, a possible sign of oxygen stress, in slow flow conditions.
The possible costs influencing size-related current preferences include predation and effort. An invertebrate entrained into the water column is more vulnerable to predation by column feeders (Waters 1972). Known predators on Dicosmoecus include harlequin ducks (Histrionicus histrionicus L.) (Wright 1997), dippers (Cinclus mexicanus Swainson) (Harvey and Marti 1993), and rainbow trout (Oncorhynchus mykiss) (Tippets and Moyle 1978). Dicosmoecus larvae, which have an armored case, were not consumed by large steelhead trout in our study reach when a case was present (unpublished, Chapter 2). Some predators selectively consume larger-sized organisms (e.g. Allan 1978), and the larvae may be seeking refuge where predators are less effective.
Larval effort when foraging in faster flow conditions may outweigh any benefits. From our critical threshold results, larval resistance force decreases with larval size. As flow velocity and turbulence increase, the frequency at which smaller, weaker larvae get dislodged may negate any potential benefit. In addition, larvae may be more vulnerable when upside-down (Otto 2000), increasing predation risk in fast flow.
Understanding how the active component of larval resistance varies with organism ontogeny can improve our ability to predict the impact of large-scale events, like a flood, on individual organisms at different locations in a river network. For a

41
strongly interacting species like Dicosmoecus, knowing where it will persist after a given sized flood allows us to generate hypotheses about how food web dynamics and ecosystem processes may affected. This information will also be useful to resource and ecosystem managers when planning flow releases in managed rivers or anticipating altered flood timing or magnitude due to seasonal or long term climate change. Their active component of resistance may also influence distributional patterns during non-flood periods, and their interaction with periphyton composition and productivity in different flow velocities may significantly impact ecosystem processes on smaller scales.

42
Acknowledgements
We would like to thank Miki Hondzo, Mary Power, William Dietrich, Collin Bode, Noah Finnegan, and Mimi Koehl for help with the project. We thank Peter Steel for logistical support, and the University of California Natural Reserve System for the protected research site. The project was funded by the National Science Foundation via grants to the National Center for Earth Surface Dynamics (EAR 0120914) and to CRISES (DEB 0543363).

43
References Allan, J. 1978. Trout predation and the size composition of stream drift. Limnology and Oceanography 23:1231-1237. Allen, K. 1951. The Horokiwi stream: a study of a trout population. New Zealand Mar. Dept., Fish. Bull. No. 10, pp. 1—231 Anderson, N., and K. Cummins. 1979. Influences of diet on the life histories of aquatic insects. Journal of the Fisheries Research Board of Canada 36:335-342. Biggs, B. 1995. The contribution of flood disturbance, catchment geology and land use to the habitat template of periphyton in stream ecosystems. Freshwater Biology 33:419-438. Biggs, B., D. Goring, and V. Nikora. 1998. Subsidy and stress responses of stream periphyton to gradients in water velocity as a function of community growth form. Journal Of Phycology 34: 598-607. Buffington, J.M., and D.R. Montgomery. 1997. A systematic analysis of eight decades of incipient motion studies, with special reference to gravel-bedded rivers. Water Resources Research 33:1993-2029. Collier, K. 1994. Influence of nymphal size, sex and morphotype on microdistribution of Deleatidium (Ephemeroptera:Leptophlebiidae) in a New Zealand river. Freshwater Biology 31:35-42. Collier, K., G. Croker, C. Hickey, and J. Quinn. 1995. Effects of hydraulic conditions and larval size on the microdistribution of Hydrobiosidae (Trichoptera) in two New Zealand rivers. New Zealand Journal Of Marine And Freshwater Research 29:439-451. Dietrich, W., J. Kirchner, H. Ikeda, and F. Iseya. 1989. Sediment supply and the development of the coarse surface layer in gravel-bedded rivers. Nature 340: 215-217. Elwood, J., and T. Waters. 1969. Effects of floods on food consumption and production rates of a stream brook trout population. Transactions of the American Fisheries Society 98:253-262. Erman, D., E. Andrews, and M. Yoder-Williams. 1988. Effects of winter floods on fishes in the Sierra Nevada. Canadian Journal of Fisheries and Aquatic Sciences 45:2195-2200. Fausch, K., and R. White. 1981. Competition between brook trout (Salvelinus fontinalis) and brown trout (Salmo trutta) for positions in a Michigan Stream. Canadian Journal of Fisheries and Aquatic Sciences 38:1220-1227 Fenton, J., and J. Abbott. 1977. Initial movement of grains on a stream bed: the effect of relative protrusion. Proceedings of the Royal Society of London. Series A. 352:523-537.

44
Fisher, S., L. Gray, N. Grimm, and D. Busch. 1982. Temporal succession in a desert stream ecosystem following flash flooding. Ecological Monographs 52:93-110. Full, R., and M. Koehl. 1998. Drag and lift on running insects. Journal of Experimental Biology 176:89-101. Gray, L. J., and S. G. Fisher. 1981. Postflood recolonization pathways of macroinvertebrates in a lowland Sonoran Desert stream. American Midland Naturalist 106:249-257. Hansen, R., D. Hart, and R. Merz. 1991. Flow mediates predator-prey interactions between triclad flatworms and larval black flies. Oikos 60:187-196. Hart, D. 1981. Foraging and resource patchiness: field experiments with a grazing stream insect. Oikos 37:46-52. Hart, D., and V. Resh. 1980. Movement patterns and foraging ecology of a stream caddisfly larva. Canadian Journal of Zoology 58:1174-1185. Harvey, B., and C. Marti.1993. The impact of dipper, Cinclus mexicanus, predation on stream benthos. Oikos 68:431-436. Hayes, J., and I. Jowett. 1994. Microhabitat models of large drift-feeding brown trout in three New Zealand rivers. North American Journal of Fisheries Management 14:710-725. Helley, E. 1969. Field measurement of the initiation of large bed particle motion in Blue Creek near Klamath, California. Geological Survey professional paper. #562-G. pp 1-19. Hemphill, N., and S. Cooper. 1983. The effect of physical disturbance on the relative abundances of two filter-feeding insects in a small stream. Oecologia 58:378-382. Hillebrand, H., and M. Kahlert. 2001. Effect of grazing and nutrient supply on periphyton biomass and nutrient stoichiometry in habitats of different productivity. Limnology and Oceanography 46:1881-1898. Holomuzki, J., and B. Biggs. 2003. Sediment texture mediates high-flow effects on lotic macroinvertebrates. Journal of the North American Benthological Society 22:542-553. Hynes, H. 1970. The ecology of running waters. University of Toronto Press., Toronto. 555 pp. Jacobs, J. 1974. Quantitative measurement of food selection, a modification of the forage ratio and Ivlev’s Electivity Index. Oecologia 14:413-417.

45
Johnston, C., E. Andrews, and J. Pitlick. 1998. In situ determination of particle friction angles of fluvial gravels. Water Resources Research 34:2017-2030. Kirchner, J., W. Dietrich, F. Iseya, and H. Ikeda. 1990. The variability of critical shear stress, friction angle, and grain protrusion in water-worked sediments. Sedimentology 37:647-672. Knighton, D. 1998. Fluvial forms and processes: A new perspective. 383 pp. Oxford University Press Inc, New York. Lamb, M., W. Dietrich, and J. Venditti. 2008. Is the critical Shields stress for incipient sediment motion dependent on channel-bed slope? Journal of Geophysical Research 113:1-20. Lamberti, G., and V. Resh. 1983. Stream periphyton and insect herbivores: an experimental study of grazing by a caddisfly population. Ecology 64:1124:1135. Lamberti, G., S. Gregory, L. Ashkenas, and J. Li. 1995. Influence of grazer type and abundance on plant-herbivore interactions in streams. Hydrobiologia 306:179-188. Li, J., and S. Gregory. 1989. Behavioral changes in the herbivorous caddisfly Dicosmoecus gilvipes (Limnephilidae). Journal of the North American Benthological Society 8:250-259. Lytle, D. 2002. Flash floods and aquatic insect life-history evolution: evaluation of multiple models. Ecology 83:370-385. MacArthur, R. H. 1972. Geographical Ecology. Harper and Row, New York. Malmqvist, B., and G. Sackmann. 1996. Changing risk of predation for a filter-feeding insect along a current velocity gradient. Oecologia 108:450-458. McCormick, P., and J. Stevenson. 1991. Grazer control of nutrient availability in the periphyton. Oecologia 86:287-291. Meffe, G. 1984. Effects of abiotic disturbance on coexistence of predator-prey fish species. Ecology 5:1525-1534. Mulholland, P., A. Steinman, and A. Palumbo. 1991. Role of nutrient cycling and herbivory in regulating periphyton communities in laboratory streams. Ecology 3:966-982. Munson, B., D. Young, T. Okiishi. 1998. Fundamentals of fluid mechanics. 877 pp. John Riley and Sons, New York.

46
Naot, D. 1984. Response of channel flow to roughness heterogeneity. Journal of Hydraulic Engineering 110:1568-1587. Paine, R. T. 1980. Food webs: linkage, interaction strength and community infrastructure. Journal of Animal Ecology 49:667-685. Parker, G., P. Klingeman, and D. McLean. 1982. Bedload and size distribution in paved gravel-bed streams. Journal of the Hydraulics Division 108:544-571. Parker, G., C. Toro-Escobar, M. Ramey, and S. Beck. 2003. Effect of floodwater extraction on mountain stream morphology. Journal Of Hydraulic Engineering 129:885-895. Power, M., and A. Stewart. 1987. Disturbance and recovery of an algal assemblage following flooding in an Oklahoma stream. American Midland Naturalist 117:333-345. Power, M., Parker, M., Wootton, J., Polis, G., & Winemiller, K. 1996. Disturbance and food chain length in rivers. In: Food Webs: Integration of Patterns and Dynamics (eds G. A. Polis & K. O. Winemiller) pp. 286–297. Chapman & Hall, New York. Resh, V., A. Brown, A. Covich, and M. Gurtz. 1988. The role of disturbance in stream ecology. Journal of the North American Benthological Society 7:433-455. Riis, T., and B. Biggs. 2007. Hydrologic and hydraulic control of macrophyte establishment and performance in streams. Limnology and Oceanography 48:1488-1497. Rousseau, E. 1921. Les Larves et Nymphs Aquatiques des Insecta d'Europe. 375 pp. Bruxells. Scrimgeour, G., R. Davidson, and J. Davidson. 1988. Recovery of benthic macroinvertebrate and epilithic communities following a large flood, in an unstable, braided New Zealand river. New Zealand Journal of Marine and Freshwater Research 22:337-344. Seegrist, D., and R. Gard. 1972. Effects of floods on trout in Sagehen Creek, California. Transactions of the American Fisheries Society 101:478-482. Shields, A. 1936. Anwendung der Aehnlichkeitsmechanik und der Turbulenzforschung auf die Geschiebebewegung. Mitteilung der preussicchen Versuchsanstalt für Wasserbau und Schiffbau. Berlin Sousa, W. 1984. The role of disturbance in natural communities. Annual Review of Ecology and Systematics 15:353-391. Tippets, W., and P.B. Moyle. 1978. Epibenthic feeding by rainbow trout (Salmo gairdneri) in the McCloud River, California. The Journal of Animal Ecology 47-549-559.
47
Vogel, S. 1996. Life in moving fluids: the physical biology of flow. 467 pp. Princeton University Press, New Jersey. Waringer, J. 1989. Resistance of a cased caddis larva to accidental entry into the drift: the contribution of active and passive elements. Freshwater Biology 21:411-420. Waters, T. 1972. The drift of stream insects. Annual Review of Entomology 17:253-272. Webster, D., and P. Webster. 1943. Influence of water current on case weight in larvae of the caddisfly, Goera calcarata Banks. The Canadian Entomologist 75:105-108. Whitford, L., and G. Schumacher. 1961. Effect of current on mineral uptake and respiration by a fresh-water alga. Limnology and Oceanography 6:423-425. Wiberg, P., and J. Smith. 1987. Calculations of the critical shear stress for motion of uniform and heterogeneous sediments. Water Resources Research 23:1471-1480. Wootton, J., M. Parker, and M.E. Power. 1996. Effects of disturbance on river food webs. Science 273:1558-1561. Wright, K., H. Bruner, J. Li, R. Jarvis, and S. Dowlan. 2000. The distribution, phenology, and prey of Harlequin Ducks, Histrionicus histrionicus, in a Cascade mountain stream, Oregon. Canadian Field-Naturalist 114:187-195.

48
Tables
Tabl
e 1.
Sum
mar
y of
crit
ical
con
ditio
ns fo
r Dic
osm
oecu
s la
rvae
.!
Inst
ar
Dia
met
er (m
) U*
(m/s
) F A
(N)
We
! C
Perc
ent
stre
ambe
d ar
ea
abov
e U*
Se
cond
0.
0029
– 0
.003
8 0.
21 ±
0.0
3 0.
002
± 0
.000
7 0.
304
± 0
.004
0.
96 ±
0.0
7 0.
14
Third
0.
0039
– 0
.004
9 0.
28 ±
0.0
1 0.
005
± 0
.000
3 0.
317
± 0
.001
1.
05 ±
0.1
0 0.
06
Four
th
0.00
50 –
0.0
058
0.28
± 0
.01
0.00
6 ±
0.0
005
0.35
4 ±
0.0
05
1.20
± 0
.31
0.06
Fi
fth
0.00
59 –
0.0
063
0.32
± 0
.01
0.01
0 ±
0.0
01
0.39
4 ±
0.0
09
1.25
±0.
07
0.03

49
Tabl
e 2.
Sum
mar
y of
am
bien
t vel
ocity
con
ditio
ns fr
om tr
anse
ct d
ata.!
Inst
ar
Dia
met
er (m
) U
(m/s
) M
in U
(m/s
) M
ax U
(m/s
) Pe
rcen
t stre
ambe
d ar
ea
avai
labl
e at
U
Seco
nd
0.00
29 –
0.0
038
0.02
1 ±
0.0
03
0.00
0.
11
0.26
Th
ird
0.00
39 –
0.0
049
0.08
6 ±
0.0
06
0.01
0.
20
0.64
Fo
urth
0.
0050
– 0
.005
8 0.
097
± 0
.008
0.
01
0.20
0.
70
Fifth
0.
0059
– 0
.006
3 0.
059
± 0
.012
0.
02
0.16
0.
56

50
Figure Legends Figure 1. Drawing of Dicosmoecus gilvipes larval instars and their cases. Illustration by Aron Bothman. Figure 2. Illustration of Dicosmoecus larva (a) and a sketch (b) of the force components influencing removal. Force components keeping the larva attached are the larval resistance force FA (active) and weight component FG (passive). Force components influencing removal are the drag component FD, the lift component FL, and the buoyant force FB. Illustration by Aron Bothman. Figure 3. Relationship between Dicosmoecus larval case length and case diameter. Figure 4. The relationship between the frontal projected area and case diameter. Figure 5. Plot of critical velocities for Dicosmoecus larval instars. Figure 6. Resistance force versus case diameter for Dicosmoecus larval instars. Figure 7. Weber number versus morphometric ratio. Critical values (open symbols) were calculated from the water jet experiment. Ambient values (closed symbols) were calculated from the ambient flow velocity the larvae were in prior to removal by water jet. Figure 8. Shield stress (from Equation 8) required to initiate motion of Dicosmoecus larvae as a function of Reynolds roughness. Theoretical Shield curve was taken from Parker et al. (2003).
Figure 9. Proportion of larvae and available habitat at different velocities in the experimental reach (a) and Jabobs selectivity index (b). Values equal to +1 represent exclusive use by larvae and values equal to -1 represent complete avoidance. Figure 10. Proportion of larvae and available habitat at different depths in the experimental reach (a) and Jabobs selectivity index (b). Values equal to +1 represent exclusive use by larvae and values equal to -1 represent complete avoidance. Figure 11. Proportion of larvae and available habitat at different substrate sizes in the experimental reach (a) and Jabobs selectivity index (b). Values equal to +1 represent exclusive use by larvae and values equal to -1 represent complete avoidance. Figure 12. Ash-free dry mass (AFDM) of periphyton (a) and loose sediment (b) at different velocities in the experimental reach. Figure 13. Resistance force components versus hydraulic force components (see Figure 3). Hydraulic force components increase with flow velocity and frontal projected area. The passive resistance component is due to organism weight. Larval strength, claws,

51
friction between claws and surface, and tenacity influence the active component. The active component was calculated by subtracting the passive resistance component from the total resistance force. Figure 14. Plot of Shields stress on bed surface along the South Fork of the Eel river for a 1-year and 5-year flood. In the Hec-RAS model we used cross-sections collected from 1-m resolution LiDAR data (National Center for Airborne Laser Mapping) and two U.S.G.S. gaging stations (Branscomb and Elder). We assumed linear scaling between discharge and drainage area to calculate discharge for the flood events.

52
Figure 1.

53
Figure 2.

54
Figure 3.
y = 0.0034e342x
R2 = 0.96

55
Figure 4.
y = 0.6497x1.8
R2 = 0.92

56
Figure 5.

57
Figure 6.

58
Figure 7.

59
Figure 8.

60
Figure 9.

61
Figure 10.

62
Figure 11.

63
Figure 12.

64
Figure 13.

65
Figure 14.

66
CHAPTER 3
The caddisfly Dicosmoecus gilvipes: making a case for a functional role Abstract The majority of caddisfly larvae build cases using silk and a variety of collected materials. Multiple functions have been suggested for caddisfly cases including protection from predators, resistance to entrainment by high flows, and improved respiration. Our study investigates the functional role of cases built by Dicosmoecus gilvipes, a Limnephilid caddisfly. In Mendocino County, CA, the 1st through 4th instar larvae collect thin plant material and Douglas-Fir needles and build arrow-shaped lateral extensions on their case. To test whether the lateral extensions deter predators relative to cases lacking them we manipulated lateral extension presence and exposed the larvae to large steelhead trout. All larvae with a case survived, whether lateral extensions were present or not, while all larvae without a case were consumed. To test whether lateral extensions provide stability against overturning and entrainment we again manipulated lateral extension presence and subjected larvae to turbulent flow conditions. Once dislodged, larvae with lateral extensions experienced fewer revolutions and regained their footing faster than those without. Our results suggest lateral extensions provide stability against overturning in fast flow and may improve their ability to forage efficiently in turbulent flow conditions. Other caddisfly species build lateral extensions on their case, and the extensions may provide a similar function for these taxa. Introduction Larvae in 30 of the 45 recognized caddisfly (Trichoptera) families make portable cases out of silk and collected materials including plant fragments, colonies of algae and cyanobacteria, and mineral particles (sand to small gravel, Wiggins 2004). Case architecture varies from a straight cylindrical tube to more elaborate shapes with additional extensions. Some caddisfly species will alter both material type and architecture during ontogeny (Otto and Svensson 1980). The variation in case structure among species and over ontogeny raises interesting questions about the relationships of form to function in caddisfly cases. Protection from predators was a case function that probably evolved early in the order’s evolution (Wiggins 2004). Case shape, strength, and materials provide structural protection from predators, and some larvae will modify these characteristics in response to predation risk (Nislow and Molles 1993, Boyero et al. 2006). Some larvae camouflage themselves with case materials similar to those on the bed surface (Otto and Svensson 1980), while others use cases to appear as a non-prey item (Otto and Johansson 1995) or use lateral case extensions to protect themselves from gape-limited predators (Otto 1982). Some caddisfly species attach large mineral grains to their case sides. The grains are often referred to as ballast stones (e.g. Wiggins 1977), and as the term implies, the additional ‘ballast’ or weight of these stones may lower their risk of entrainment in fast currents. Webster and Webster (1943) examined whether ballast was important to Goera calcarata by rearing them in different flow environments. Goera larvae reared in faster

67
currents constructed heavier cases than those in slower currents. Otto and Johansson (1995), however, found ballast stones in Silo pallipes cases had a negligible effect on their current resistance (2-5%). In addition to increasing case inertia, ballast stones may improve stability by altering fluid motion around the case and/or increase the base width (Otto 2000). Caddisfly cases may enhance larval respiration (Milne 1938, Williams et al. 1987), potentially enabling caddisfly range expansion into slower, less oxygenated environments (Wiggins 1977). Dodds and Hisaw (1924) observed that “many if not all of the case bearing species maintain a constant current of water through the case by undulation of the abdominal lateral fringe, or of the abdomen itself, insuring constant change of water over the respiratory surface...”. The unidirectional flow generated may decrease boundary layer development around the gills and steepen the oxygen diffusion gradient. To quantify case effects on respiration, Williams et al. (1987) measured oxygen uptake in 22 species from a variety of habitats, both with and without a case. Their results were mixed: the case conferred a respiratory advantage in some, and had no effect or was a disadvantage to respiration in others. In addition, some lentic species leave their case under low oxygen conditions (Otto 1976), which would further suggest not all caddisfly species gain a respiratory benefit. Our study investigates the functional role of cases built by Dicosmoecus gilvipes (Hagen) larvae. The species occurs in western North America, Japan, and eastern Russia (Wiggins 1977), where they graze periphyton in cool flowing water. In the South Fork of the Eel River watershed (Mendocino, CA), early instars (1-2) construct cases using silk and mostly plant materials. Later instars use a higher proportion of minerals in their case, and during their 5th and final instar, the larvae cut off any remaining plant material at the posterior end, leaving a case made entirely of minerals. Prior to the 5th instar, Dicosmoecus larvae use silk to stick Douglas-fir needles onto the sides of their slightly curved cylindrical case (Figure 1a). The needles are arranged like feathers on the end of an arrow shaft, with the ends swept towards the rear and downwards (Figure 1b). Given the significant energetic costs of searching for needles and manufacturing silk to attach them (Otto 1974, 1975, Stevens et al 1999), we would expect that this case-building behavior confers some selective advantage. We investigated two possible functional roles of the lateral case extensions made from Douglas-fir needles. Hypothesis 1: The lateral extensions on the case provide camouflage and/or protection from a large predator. Hypothesis 2: The lateral extensions increase larval stability in turbulent flows by increasing their effective base width. Methods Site All experiments were carried out in Elder Creek within the Heath and Marjorie Angelo Coast Range Reserve in Mendocino County, California (39°44”N 123°39”W). The study area has a Mediterranean climate with wet, cool winters and warm, dry summers. The habitat consists of shallow runs, riffles, and pools during summer low flow periods. Vegetation in the watershed is a mixed-decidous evergreen forest dominated

68
primarily by old-growth Douglas fir (Pseudotsuga menziesii), redwood (Sequoia sempervirens), and tanoak (Lithocarpus densiflorus). The major aquatic food web components consist of producers (primarily diatoms and filamentous green algae), grazing insects (midges, mayflies, caddisflies), predatory insects (stoneflies, aquatic beetles, naucorid bugs), and omnivorous (California roach, Lavinia (Hesperoleucas) symmetricus) and predatory vertebrates (Rough skinned newt, Taricha granulose, Pacific giant salamander, Dicamptodon ensatus, Threespine stickleback, Gasterosteus aculeatus, juvenile steelhead, Oncorhynchus mykiss). Case information We collected 30 larvae from Elder Creek, Mendocino, CA and quantified larval dry mass, case mass, lateral extension mass, case width with lateral extensions present and removed, and organic and mineral content of the case. The center of mass was estimated by finding the longitudinal balance point. After marking the point, the lateral extensions were removed and the change in center of mass height was then measured.
Hypothesis 1. The lateral extensions on the case provide camouflage and/or protection from a large predator. We conducted feeding trials to investigate whether the lateral extensions on Dicosmoecus cases deter predation by steelhead (Oncorhynchus mykiss). The trials were conducted in a large clear pool in Elder Creek. The oval-shaped pool was 16 m long, 7 m wide, and 1.8 m deep in the middle. Based on visual observations the pool contained forty to fifty small steelhead (45-60 mm), four medium-large steelhead (90-120 mm), and one large steelhead (160+ mm). Dicosmoecus larvae were present upstream and along the bottom of the pool. Prior to the experiment we collected thirty-six Dicosmoecus larvae approximately 30 m upstream from the pool and placed them into a flow-through basket. Case length ranged from 1.8-2.5 cm (3rd and 4th instars). We randomly assigned individual Dicosmoecus larvae to one of three treatments: (i) lateral extensions present as constructed by larvae (n=12), (ii) lateral extensions removed from the case (n=12), and (iii) the entire case removed (n=12). The lateral extensions, constructed out of Douglas-fir needles, were clipped off the case sides with small scissors for treatment iii. We then released individual larvae from the three treatments into the top one-third of the pool. An observer was positioned roughly perpendicular to the point of release and remained stationary for 10 minutes prior to beginning the experiment. The person releasing the Dicosmoecus was positioned behind a rock and could not be seen by the fish. Larvae were released approximately 5 minutes apart in the order as randomly assigned. The observer recorded whether the steelhead approached, mouthed, and/or ate the larvae. The size of the steelhead doing the activity was also recorded. To test whether inspection and predation by steelhead differed between treatments we used analysis of variance (ANOVA). Hypothesis 2. The lateral extensions increase larval stability in turbulent flows by increasing their effective base width.

69
We quantified stability by subjecting thirty-five 3rd and 4th instar Dicosmoecus larvae to turbulent bursts in a rocking tank (Figure 2). The rocking tank was 1.0 m long x 0.15 m wide x 0.5 m tall and constructed out of clear 6 mm acrylic. The tank rested in a metal cradle that pivoted midway along the base. A variable speed motor rocked the tank on the middle pivot, creating sweep events along the bottom as the water rushed from one side of the tank to the other. The rocking tank completed a full cycle every 7.5 seconds. Based on video of suspended/saltating particles moving just above the bottom surface, larvae were exposed to peak velocities of 21 cm s-1. Revolutions before recovery At the start of each trial we placed a single Dicosmoecus into the middle of the tank and turned on the rocking motor. Once a larva was dislodged, we visually recorded the number of revolutions the larva underwent before recovering. We defined recovery as the point at which larvae were upright and either holding their position or walking. Ten separate dislodgement events were recorded on each larva. An average number of revolutions for each larva was calculated from the ten observations. We then removed the lateral extensions from the case, let the individual rest for five minutes in a holding tank, and then repeated the experiment. To assess the possible effect of fatigue and handling on the second trial when lateral extensions were removed, six Dicosmoecus underwent two trials where the extensions were present and six Dicosmoecus underwent two trials where extensions were removed for both trials. No significant difference (Paired t-test) was observed in the number of revolutions between the first (t5 = 0.53, p = 0.61) and second trial (t5 = 1.24, p = 0.27). To assess possible differences in revolutions before recovery between treatments we compared the mean revolutions for individual larva with and without fins using a Paired t-test. Recovery Time We quantified the recovery time for dislodged larvae by video recording an additional 15 Dicosmoecus in the rocking tank, both with and without lateral extensions. The two trials for each individual were conducted as described above. The video was recorded at 30 frames per second and analyzed with the software program Quicktime Pro (Apple Inc., Cupertino, CA). To measure the time required for recovery we counted the number of frames between the dislodgement and recovery. The difference between mean recovery times with and without lateral extensions was calculated. As in the first experiment, we defined recovery as the point when larvae were upright and either holding on or walking. To assess possible differences in recovery time between treatments we compared the mean recovery time for individual larva with and without fins using a Paired t-test. Results Case structure

70
For the 30 2nd-4th instar Dicosmoecus larvae we collected, the maximum case width increased with case length (Figure 3). On average, the lateral extensions increased total width by 410%, total length by 36%, and total dry mass (larvae + case) by 22% (Figure 4). Fifty-six percent of case mass was mineral and this proportion increased with case length (Figure 5). Predation All Dicosmoecus (n=36) released into the pool were visually inspected by at least one steelhead. No preference was seen in the number of inspections between treatments (F31,2= 0.292, p= 0.72), suggesting the needles did not provide effective camouflage to the larvae. Steelhead did not consume any Dicosmoecus with a case (n=24), while every Dicosmoecus released without a case (n=12) was consumed. Seven of the twelve Dicosmoecus with needle-covered cases were mouthed by at least one steelhead while 8 of the twelve Dicosmoecus with needle-removed cases were mouthed. Large (100+ mm) and small steelhead (45-60 mm) mouthed both the needle-covered and needle-removed cased Dicosmoecus. Stability Dicosmoecus larvae with lateral extensions on their case experienced fewer rotations after getting dislodged (t33= 14.91, p < 0.0001). On average, those with lateral extensions rotated around their longitudinal axis one-third as many times after getting dislodged as those without. The fewer rotations by larvae with lateral extensions translated into faster recovery times (t14= 7.25, p < 0.0001). Based on the thirty video-recorded trials, Dicosmoecus regained their footing over three times faster when their cases had lateral extensions. Discussion While discussing caddisfly cases Rousseau (1921) states, “in the absence of current, the cases do not in general offer such adaptations as those which we find in the larvae living in moving water. These last can resist the current, the eddies, and avoid being dragged about by them”. Results from the current study suggest the cases built by Dicosmoecus gilvipes improve their stability and assist their ‘resisting the current’. By adding lateral extensions the larvae widen their effective base and increase their resistance to overturning by cross currents. Both plants and animals can modify their structure and/or behavior to resist overturning. Trees living in weak or shallow tropical soils grow wider buttresses than those in more stable soils (Richards 1952). Where wind is persistent, the tropical trees Tachigalia versicolor and Pterocarpus officinalis will improve their anchorage (Crook et al. 1997) by growing wider buttresses on the windward side (Warren et al. 1988, Lewis 1988). Amphibious organisms like the marine rock crab Grapsus tenuicrustatus and freshwater crayfish Procambarus clarkii adopt a wider stance when walking under water than on land (Martinez et al. 1998, Grote 1981). Fluid-dynamic forces increase roughly 800-fold when moving from air to water, and the wider stance provides stability against

71
the greater forces (Martinez et al. 1998). Caddisfly larvae contend with fluid-dynamic forces in both lotic and lentic environments, and Dicosmoecus gilvipes is not the only caddisfly species that modifies its case with lateral extensions. Members in the Glossosomatidae, Thremmatidae, and Molannidae families build shield-shaped cases out of mineral particles. The ‘shield’ consists of wing-like lateral extensions that effectively double the case width. In a laboratory experiment, Christian Otto (2000) manipulated the lateral extensions on Molanna angustata cases and subjected them to simulated waves. Larvae with lateral extensions showed greater resistance to overturning than those without. From Alexander (1971), we can estimate the drag force (D) needed to overturn larval cases with and without lateral extensions present:
D = FVMASMAO
(1)
where FV is the net force directed vertically on an organism, MAS is the moment arm stabilizing the organism (the distance from the center of mass to the stabilizing point), and MAO is the moment arm overturning the organism (center of mass height above the surface). For Dicosmoecus cases, the lateral extensions increase total mass by 19% and base width (MAS) by 410% for 2nd to 4th instars. The lateral extensions also elevate the rear of the case, increasing center of mass height (MAO) 14%. From Eq. (1), the drag force required to overturn a Dicosmoecus case with lateral extensions is over four times greater than on a case without. The estimate for Dicosmoecus cases is likely conservative since we used the widest point on the cylindrical case for calculating the stabilizing point. The actual moment arm stabilizing the organism is the point where the cylindrical case contacts the surface. We can apply a similar analysis to Molanna angustata from Otto’s study (2000). Molanna cases with lateral extensions were 57% heavier and 200% wider than cases without. If we assume a negligible change in MAO (the shield curves down towards the bed surface), the drag force required to overturn a 5th instar Molanna case is again, over four times greater when lateral extensions are present. For Molanna larvae, which are more vulnerable to predation when upside-down (Otto 2000), the benefit of lateral extensions offsets the cost of additional weight and reduced mobility. Once overturned by hydrodynamic forces, Dicosmoecus larvae with lateral extensions regained their footing faster than those without. Faster recovery may improve their ability to move efficiently in turbulent conditions. Using the equation for calculating
the drag force on an object, FD =12ρCDAU
2 , the estimated four-fold increase in drag
required to overturn a case with lateral extensions translates into a critical velocity 2-fold greater than for a case without (assuming the projected area and drag coefficient do not change). From a velocity survey in a 80m reach (530 m2) in Elder creek (M. Limm, unpublished data), 1st and 2nd instar larvae inhabit low velocity areas (near-bed velocity ≤ 0.04 m/s), while 3rd, 4th, and 5th instar larvae can forage mid-channel where near-bed velocities exceed 0.2 m s-1. Based on the surveyed reach, if 1st and 2nd instar larvae with lateral extensions can withstand a critical velocity 2-fold greater, 20.3% more streambed area is available to the larvae. For 3rd, 4th, and 5th instars, streambed availability increases by 16.4%. While other factors may influence larval overturning- such as lift, larval strength, texture of rock surfaces, and flow direction- the additional stability provided by their case increases the available streambed area.

72
Access to faster flow conditions and more streambed area may reduce competition with other grazers and increase food availability. Previous studies suggest periphyton is a limiting resource to Dicosmoecus larvae (Hart 1981, Lamberti et al. 1995), and with phenological changes exploitative competition for periphyton can increase (Li and Gregory 1989). Movement through and access to more turbulent environments may alleviate competition with conspecifics and other grazers. Periphyton productivity, nutrient uptake, and accrual are known to increase with velocity (0.15-0.30 m s-1) (Whitford and Schumacher 1961, Biggs et al. 1998, Hondzo and Wang 2002). Algae growing in faster flowing environments may not only be more productive, but also of higher food quality for grazers than algae in slack water, where algae may become covered with fine deposited sediments, reducing algal growth (Van Nieuwenhuyse and LaPerriere 1986) and organic content (Cline et al. 1982). By building cases that resist overturning and improve recovery time, Dicosmoecus larvae can not only forage across more of the bed surface but also in more productive habitats that other grazers are not equipped to access. Their more extensive grazing will reduce algal accrual over a wider area and in more productive habitats. This may have significant impacts on ecosystem processes. Lateral projections may also reduce Dicosmoecus vulnerability to gape-limited predators by increasing their apparent size. Known predators on the larvae include harlequin ducks (Histrionicus histrionicus L.) (Wright 2000), dippers (Cinclus mexicanus Swainson) (Harvey and Marti 1993), and rainbow trout (Oncorhynchus mykiss) (Tippets and Moyle 1978). All of these occur at our study site. In our experiment, however, large steelhead (> 120 mm SL) consumed 3rd and 4th instar Dicosmoecus only when larvae were removed from their case. Dicosmoecus larvae were exposed to seven predator species in a previous study (Wootton et al. 1996) and no mortality occurred over 24 hours. In the McCloud River (Siskiyou and Shasta Counties, CA) Tippets and Moyle (1978) observed large adult trout selectively picking “stone-cased” 5th instar Dicosmoecus larvae off the bottom. Fifth instar Dicosmoecus larvae, which have an all-mineral case and lack lateral extensions, may be more vulnerable to predation, but our results suggest that any case, with or without lateral extensions, can deter large steelhead predation. We did not observe steelhead feeding off the benthos before or during the experiment, and 3rd and 4th instar Dicosmoecus were relatively abundant (20-30 per m2) on the pool bottom. More research concerning predation on Dicosmoecus is needed. Our study does not address whether their case enhances larval respiration. Mechanisms by which cases might influence oxygen transfer to the larvae are unclear. Other members of the Limnephilidae family did not show enhanced respiration when a case was present (Williams et al. 1987). Dicosmoecus inhabit cool, well-oxygenated streams, and while it is possible the case may confer a respiratory advantage in late summer, most Dicosmoecus undergo diapause by mid-July. While our results suggest Dicosmoecus larvae clearly benefit from building lateral extensions on their case, one possible cost to the larvae, in addition to the effort building the lateral extensions (finding and attaching Douglas-fir needles with silk) and additional weight (21% heavier), may be increased form drag. The lateral extensions do increase the projected frontal area (M. Limm, unpublished data) and therefore increase form drag. The point along the case where flow separation occurs also influences drag. If Douglas-fir needles attached to the posterior case moves the point of flow separation rearward, wake

73
region size and the subsequent drag generated may be reduced, as is the case for flow separation mediated by dorsal spines on tuna behind the dorsal fin. The lateral extensions may also influence both lift and the peak drag force. As fluid slows when flowing over an organism a velocity gradient develops. The velocity gradient generates a lift force on the organism that is directed away from the surface. By reducing effective weight (Fv in Eq. 1) lift reduces the drag required to overturn the organism. Sticks attached to the case of Anabolia nervosa Curtis reduced the flow velocity above the larvae and the resultant lift force (Statzner and Holm 1982). On Dicosmoecus cases, the Douglas-fir needles extend both laterally and vertically and elevate the rear of the case off the surface. It is possible the change in case orientation relative to a naked case may influence the lift force it experiences. Lateral extensions may also decrease peak drag forces by increasing directional sensitivity to flow, like fins on a weather vane. From observations, as Dicosmoecus larvae move from slow (0-0.05 m s-1) to higher (> 0.15 m s-1) velocity flow, their case will ‘weather-vane’ and orient into the flow. The larvae will then ‘crab walk’ perpendicular to the flow until they reach slower flow conditions. By rapidly orienting the case into the flow, for example during peak velocity fluctuation, the lateral needle extensions may reduce the peak drag force that larvae experience. Hydraulic controls on aquatic invertebrate microdistributions have long been recognized (Rousseau 1921, Hynes 1970), as have caddisfly case adaptations to flow conditions (Dodds and Hisaw 1925). Our observations that lateral extensions on Dicosmoecus cases provide stability against overturning in fast flow may not be the sole function of lateral extensions, but their presence on the cases of other caddisfly species inhabiting faster flowing water suggests that stabilization may be a function of this trait in other taxa as well.

74
Acknowledgements
We would like to thank William Rainey and James DeWolf for design and construction of the rocking tank. We thank M.A.R. Koehl for her help with the project, Peter Steel for logistical support, and the University of California Natural Reserve System for the protected research site. This project was possible due to funding from the National Center for Earth Surface Dynamics (NCED) and CRISES.

75
References Alexander, R, I. 1971. Size and shape. Edward Arnold Limited, London. Biggs, B.J.F., D.G. Goring, and V.I. Nikora. 1998. Subsidy and stress responses of stream periphyton to gradients in water velocity as a function of community growth form. Journal of Phycology 34:598-607. Boyero, L., P. Rincón, and J. Bosch. 2006. Case selection by a limnephilid caddisfly [Potamophylax latipennis (Curtis)] in response to different predators. Behavioral Ecology and Sociobiology 59:364-372. Cline, L., R. Short, and J. Ward. 1982. The influence of highway construction on the macroinvertebrates and epilithic algae of a high mountain stream. Hydrobiologia 96:149-152. Crook, M.J., A.R. Ennos, and J.R. Banks. 1997. The function of buttress roots: a comparative study of the anchorage systems of buttressed (Aglaia and Nephelium ramboutan species) and non-buttressed (Mallotus wrayi) tropical trees. Journal of Experimental Botany 48:1703-1716. Dodds, G.A., and F.L. Hisaw. 1925. Ecological studies on aquatic insects. III. Adaptations of caddisfly larvae to swift streams. Ecology 6:123-137. Dodds, G.A., and F.L. Hisaw. 1924. Ecological studies of aquatic insects: Size of respiratory organs in relation to environmental conditions. Ecology 5:262-271. Grote, J.R. 1981. The effect of load on locomotion in crayfish. Journal of Experimental Biology 92:277-288. Harvey, B.C., and C.D. Marti. 1993. The impact of dipper, Cinclus mexicanus, predation on stream benthos. Oikos 68:431-436. Hart, D.D. 1981. Foraging and resource patchiness: field experiments with a grazing stream insect. Oikos 37:46-52. Hondzo, M, and H Wang. 2002. Effects of turbulence on growth and metabolism of periphyton in a laboratory flume." Water Resources Research 38:1-9. Hynes, H.B.N. The ecology of running waters. 1970. Lamberti, G.A., S.V. Gregory, L.R. Ashkenas, J.L. Li, A.D. Steinman, and C.D. McIntire. 1995. Influence of grazer type and abundance on plant-herbivore interactions in streams. Hydrobiologia 306:179-188.

76
Lewis, A.R. 1988. Buttress arrangement in Pterocarpus officinalis (Fabaceae): effects of crown asymmetry and wind. Biotropica 20:280-285. Li, J.L, and S.V. Gregory. 1989. Behavioral changes in the herbivorous caddisfly Dicosmoecus gilvipes (Limnephilidae). Journal of the North American Benthological Society 8:250-259. Martinez, M.M., R.J. Full, and M.A.R Koehl. 1998. Underwater punting by an intertidal crab: a novel gait revealed by the kinematics of pedestrian locomotion in air versus water. Journal of Experimental Biology 201: 2609-2623. Nislow, K.H., and M.C. Molles. 1993. The influence of larval case design on vulnerability of Limnephilus frijole (Trichoptera) to predation. Freshwater Biology 29:411-417. Otto, C. 2000. Cost and benefit from shield cases in caddis larvae. Hydrobiologia 436:35-40. Otto, C. 1974. Growth and energetics in a larval population of Potamophylax cingulatus (Steph) (Trichoptera) in a South Swedish stream. Journal of Animal Ecology 43: 339-361. Otto, C. 1975. Energetic relationships of larval population of Potamophylax cingulatus (Trichoptera) in a South Swedish stream. Oikos 26: 159-169. Otto, C., and B.S. Svensson. 1980. The significance of case material selection for the survival of caddis larvae. Journal of Animal Ecology 49: 855-865. Otto, C. 1982. Habitat, size and distribution of Scandinavian limnephilid caddisflies. Oikos 38:355-360. Otto, C. A. Johansson. 1995. Why do some caddis larvae in running waters construct heavy, bulky cases? Animal Behaviour 49:473-478. Richards, P.W. 1952. The tropical rain forest. Cambridge University Press. Rousseau, E. 1921. Les Larves et Nymphs Aquatiques des Insecta d'Europe. 375 pp. Bruxelles. Statzner, B., and T.F. Holm. 1982. Morphological adaptations of benthic invertebrates to stream flow—An old question studied by means of a new technique (laser doppler anemometry). Oecologia 53:290-292. Stevens, D. 1999. Developmental trade-offs in caddis flies: increased investment in larval defence alters adult resource allocation. Proceedings of the Royal Society B: Biological Sciences 266:1049-1054.

77
Tippets, W.E., and P.B. Moyle. 1978. Epibenthic feeding by rainbow trout (Salmo gairdneri) in the McCloud River, California. The Journal of Animal Ecology 47:549-559. Vannieuwenhuyse, E.E., and J.D. Laperriere. 1986. Effects of Placer gold mining on primary production in sub-arctic atreams of Alaska. Water Resources Bulletin 22:91-99. Warren, S.D., H.L. Black, D.A. Eastmond, and W.H. Whaley. 1988. Structural function of buttresses of Tachigalia versicolor. Ecology 69:532-536. Webster, D.W, and P.C. Webster. 1943. Influence of water current on case weight in larvae of the caddisfly, Goera calcarata Banks. The Canadian Entomologist 75:105-108. Whitford, L, and G Schumacher. 1961. Effect of current on mineral uptake and respiration by a fresh-water alga. Limnology and Oceanography 6: 423-425. Wiggins, G.B. 2004. Caddisflies: the underwater architects. University of Toronto Press. 300 pp. Wiggins, G.B. 1977. Larvae of the North American caddisfly genera (Trichoptera). University of Toronto Press. 414 pp. Williams, D.D., A.F. Tavares, and E. Bryant. 1987. Respiratory device or camouflage? -a case for the caddisfly. Oikos 50: 42-52. Wright, K.K., H. Bruner, J.L. Li, R. Jarvis, and S. Dowlan. 2000. The distribution, phenology, and prey of Harlequin Ducks, Histrionicus histrionicus, in a Cascade stream. Canadian Field-Naturalist 114: 187-195.

78
FIGURE LEGENDS Figure 1. Plan (a) and side (b) view of a 3rd instar Dicosmoecus larva. Illustration by Aron Bothman. Figure 2. Experimental rocking tank used at Elder Creek. Motor was driven by a 12 volt battery. Figure 3. Relationship between Dicosmoecus case length and case width when lateral extensions are present and removed. Figure 4. Relationship between case mass and case width when lateral extensions are present and removed. Figure 5. Relationship between Dicosmoecus case length and mineral content of the case.

79
Figure 1.

80
Figure 2.

81
Figure 3.

82
Figure 4.

83
Figure 5.

84
CHAPTER 4
Effect of the Western Pearlshell Mussel (Margaritifera falcata) on Pacific Lamprey
(Lampetra tridentata) and Ecosystem Processes Abstract Suspension feeders concentrate organic material from the water column and enhance deposition to the surrounding benthos. On the South Fork of the Eel River (Mendocino, California) two suspension feeders, the freshwater mussel Margaritifera falcata and Pacific lamprey larvae Lampetra tridentata, co-occur in areas with low flow velocities and boundary sheer stresses. We investigated mussel/lamprey larvae interactions, and their impacts on nutrient and organic matter cycling, in flow-through baskets placed where lamprey larvae and mussels naturally occurred. Over the 80-day study, lamprey larvae grew faster in the presence of mussels and in food addition treatments. Our results suggest that lamprey larvae benefit from native mussels, and that lamprey populations and organic matter retention in rivers may both decrease with the rapid decline of native freshwater mussels. Introduction Bivalve suspension feeders play important roles in freshwater and marine ecosystems. They filter large volumes of water and seston, and deposit faeces and pseudofaeces locally on the benthos (Newell et al. 1982, Kryger and Rusgard 1988, Norrko et al. 2001, Howard and Cuffey 2006). Bivalves enhance the nutrients available to aquatic plants (Peterson and Heck 1999 Aquilino et al. 2009) and deposit-feeding animals (Howard and Cuffy 2006, Spooner and Vaughn 2006) by increasing the quantity (Graf and Rosenberg 1997, Spooner and Vaughn 2006) and quality (Kautsky and Evans 1987, Peterson and Heck 1999) of deposited material, nutrient cycling rates (Peterson and Heck 1999) and organic matter retention (Wotton and Malmqvist 2001). Since bivalve biomass can exceed that of all other local macroinvertebrates (Negus 1966, Dame 1996) they can dramatically alter ecosystem structure and function (Strayer et al. 1999). How bivalves affect other suspension feeders is less clear, and may depend on species composition and local physical conditions that control the supply and delivery of food particles such as flow velocity, bed topography, channel geometry, and depth. Bivalve filtration can reduce edible particles in the water column by removing material faster than it is replenished by advective and turbulent processes (Wildish and Peer 1983, Kryger and Riisgard 1988, Strayer et al. 1999). For example, since its introduction to the Hudson River, the invasive zebra mussel, Dreissena polymorpha, has reduced phytoplankton biomass by 80-90% (Caraco et al. 1997). On local scales, bivalves frequently form dense aggregations with hundreds (e.g. Mytilus californianus, Paine 1974) to thousands (e.g. Dreissena polymorpha, Hunter and Bailey 1992) per square meter. Bivalves within these aggregations may exhibit stress and starvation symptoms (Baker and Hornbach 1997) and slower growth (Bertness and Grosholz 1985, Okamura 1986, but see Hanson et al.1988). Experimental research suggests bivalve filtering

85
depletes food particles in the benthic boundary layer and leads to slower bivalve growth rates (Wildish and Kristmanson 1984). Given that bivalves can reduce food availability for local suspension feeders, observations of dense larval Pacific lamprey (Lampetra tridentata) within Western pearlshell mussel (Margaritifera falcata Gould 1850) aggregations in coastal rivers of California (Eel River, Jeanette Howard, unpublished data, and Klamath River, Ron Reed, personal communication) is intriguing. Larval lamprey, also filter feeders, and mussels are both in decline along the Pacific coast of North America due to habitat loss caused by river regulation and pollution (Williams et al. 1993, Renaud 1997, Moser and Close 2003). Both are found along stream margins and in pools where flow-induced boundary shear stresses are reduced (Hardisty 1944, Howard and Cuffey 2003, Torgerson and Close 2004). Margaritifera can live 100+ years and aggregations can exceed 80 individuals per square meter (Hastie and Toy 2007). Lampetra larvae rear in freshwater for 5-8 years before undergoing metamorphosis and migrating to salt water habitats (Beamish and Northcote 1989, Moyle 2002). Lamprey larvae burrow into sediment and actively pump water and materials into their oral hood, out through their gills, and into surrounding sediment. If larval lamprey feed on suspended material, why are they abundant in dense aggregations of mussels, whose feeding can deplete edible particle concentrations in the water column? In the summer of 2004, we studied the interaction between Margaritifera falcata and Lampetra tridentata in the South Fork of the Eel River, a coastal river in Northern California. Our study addressed three questions: 1) Are lamprey food limited? 2) Do mussels influence growth of lamprey larvae (hereafter referred to as lamprey)? 3) Do mussels and lamprey influence organic matter deposition and microbial activity? These questions were investigated with field experiments in which lamprey were reared with and without additional food, and with and without mussels present. Methods Site Our study area along the South Fork of the Eel River in Mendocino County, California (39°44”N 123°39”W, Figure 1) was within the Heath and Marjorie Angelo Coast Range Reserve of the University of California Natural Reserve System. This region has a Mediterranean climate with warm, dry summers and wet, cool winters. Most rainfall occurs between October and April. The drainage area at our study site covers approximately 140 km2. The river habitat consists of shallow runs, riffles, and large pools (1-7 m deep) during summer low flow periods. Vegetation in the watershed is a mixed-evergreen forest dominated primarily by old-growth Douglas fir (Pseudotsuga menziesii) and redwood (Sequoia sempervirens) trees. The major aquatic food web components consist of producers (primarily diatoms and filamentous green algae), grazing insects (midges, mayflies, caddisflies) and snails, predatory insects (stoneflies, dragonflies, aquatic beetles and hemiptera), fish (stickleback, Gasterosteus aculeatus, juvenile steelhead, Oncorhynchus mykiss, California roach, Lavinia symmetricus), and filter feeders (lamprey larvae, Lampetra tridentata, unionid mussels, Margaritifera falcata and Anodonta californiensis) (Power et al. 1996).
86
We conducted experiments in a 100 m long run that becomes a slow pool (flow velocities 0-5 cm s-1) under summer base flows. Margaritifera and larval Lampetra are patchily distributed within the study area. During base flow, the mean depth of the run is 0.4-0.6 m, stream width is 13 m, and mean velocity is 0.02 - 0.04 m/s. A thin layer (< 1 m) of mixed alluvium covers the bedrock channel. The median grain size (D50) of our study site is approximately 50 mm based on pebble counts (Wolman and Union 1954). Sedges (Carex nudata) line the riverbank and stream margins. Collection Lamprey We sampled lamprey from two large pools in the South Fork of the Eel River using a backpack electrofisher (Smith-Root Inc. LR-24, Vancouver, WA) in mid-July 2004. The two pools were approximately 150 m apart. We used short bursts to stimulate larvae to emerge from the bed, collected them with hand nets, and stored them in a bucket filled with aerated stream water. Mass and length of lightly anesthetized (with MS-222) larvae were measured locally, then individuals were randomly assigned to a treatment and placed into assigned flow-through enclosures. Initial lamprey wet mass and length were similar between treatments (F5,99= 0.035, p= 0.99) with a mean wet mass of 1.0 gram (SD = 0.2) and a mean length of 82 mm (SD=5). Experimental enclosures We reared lamprey in flow-through enclosures. We used 36 cm tall, 24 cm diameter mesh baskets (mesh size = 4 mm by 2 mm diamond shape, IKEA Inc. Emeryville, CA) with a solid bottom. The enclosures were filled with sediment collected from dry deposits near the study site. All sediment was passed through a 2 mm mesh sieve. We homogenized the < 2 mm fraction and used this to fill the enclosures to a depth of 0.15 m. We lowered enclosures carefully into the stream, and placed rocks around the outside of the base for stability. Depths varied within the study reach, so we arranged enclosures into 5 blocks and assigned each treatment randomly within each individual block. Mussels Mussels were haphazardly collected from nearby aggregations and pooled. We measured an individual mussel’s length and wet mass (live tissue plus shell) and randomly assigned it to a mussel treatment enclosure. Initial mussel mass and length were similar between treatments (F1, 48= 2.51, p= 0.12) with a mean wet mass of 25 g (3.9 g) and a mean length of 68.7 mm ± 3.4 mm SD (these mussels were approximately 15-20 years old, Howard and Cuffey 2006b). Experiment 1 Food addition on lamprey growth

87
To determine if lamprey are food limited, we subjected lamprey to four food treatments: three different types of food and an ambient control. Each treatment was replicated five times, with three lamprey randomly assigned to each experimental enclosure. Three lamprey per enclosure are equivalent to 58 individuals m-2, within the range (40-100 individuals m-2) we observed in open sites with fine sediments. The three food addition treatments received aquatic (Cladophora glomerata and epiphytes), terrestrial (leaves), or artificial (fish flakes, Nutrifin Inc.) foods. The algae and leaves represent two different detrital sources, while the fish flakes selected to represent a higher quality food in the form of carbon and nitrogen. Each food type was dried and ground to a fine powder prior to addition. Cladophora was visually estimated to have 10-30% of its macroalgal surface covered with epiphytes, predominantly the diatoms Gomphonema sp. and Cocconeis sp. Leaves were collected from the stream and include bay, oak, madrone, maple, and Douglas fir needles. No food was added to the control treatment. Based on the amount of organic biodeposits (faeces and pseudofaeces) generated per week by five mussels from previous research (Howard and Cuffey 2006b), we added 3 g dry mass of each food type to their respective enclosures once a week. To prevent food from getting swept out of the enclosure by water currents, we used a plastic cylinder with an 0.22 m inner diameter into the enclosure. The bottom of the plastic cylinder rested on the sediment and top was above the water line. After food was added and allowed to settle, we removed the plastic cylinder slowly from the enclosure, and observed very little loss of suspended material in the process. After 80 days we processed the lamprey as described above. Lamprey element and stable isotopes To assess whether lamprey larvae were assimilating the supplemented food, we measured the carbon and nitrogen stable isotope ratios of the three supplemented foods and larvae tissue from each experimental enclosure. After 80 days, the lamprey were removed, killed with MS-222, and placed on ice. In the laboratory, we measured larval length and mass and collected a tissue sample from the tail of individual larvae for stable isotope analysis. Food and larval tissue samples were rinsed and stored at -5 °C. In preparation for analysis, samples were freeze-dried (Freezone 12, Labconco Corporation), ground, and placed into tin capsules. We measured carbon and nitrogen content and stable isotopes using a Europa Anca-NT elemental analyzer connected to a Europa Scientific 20-20 stable isotope analyzer. The δ13C and δ15N values we report are in reference to Pee Dee Belemnite and atmospheric nitrogen standards, respectively. Experiment 2 Lamprey growth near mussels To investigate whether mussels enhance or reduce lamprey growth, we randomly assigned three lamprey to a mussel and control treatments. For the mussel treatment, five mussels were placed into an enclosure. Five mussels per enclosure (area= 520 cm2) produce a density of 96 individuals m-2, close to ambient densities observed in nearby mussel aggregations (~85 individuals m-2, Howard 2006). No mussels were added to the

88
control treatment. Each treatment was replicated five times. Organic Matter and Respiration To quantify lamprey and mussel impacts on organic matter accrual and respiration in the sediment, we sampled sediment from four treatment enclosures. The treatments were three lamprey, three lamprey with 5 mussels, 5 mussels, and an ambient control with no lamprey or mussels present. We sampled organic matter in the enclosures after 30 days and 80 days. Before sampling organic matter at 30 days, we visually inspected enclosures and counted invertebrates on the surface. We then placed a plastic cylinder within each enclosure to retain re-suspended material. We measured the water depth to calculate the volume from which we were sampling. To re-suspend surface organic matter, we rotated a plastic 20 cm diameter disk 360 degrees every second for ten seconds. A 500 mL sample was immediately collected and filtered through a 47 mm, 1.2 µm glass fiber filter (Whatman GFC) in the laboratory. We dried, weighed, ashed, and re-weighed the filter to quantify AFDM. After 80 days, we sampled sediment in the enclosures to quantify microbial respiration and AFDM. To compare organic matter and microbial activity between the surface and deeper sediments, we collected the sediment from the top 2 cm and from the bottom 8 cm. We homogenized sediment from each layer and placed a subsample of measured volume into a 500 mL plastic bottle. Each bottle was filled with stream water, sealed, and inverted to mix and dislodge any air bubbles. The bottle was then topped off with water, resealed, and inverted again. We then took the initial dissolved oxygen measurement using a DO probe (YSI meter 550, YSI Inc., Yellow Springs, Ohio, USA). The bottle was then resealed, placed into a dark chamber in the stream, and agitated every 5 minutes. After 30-40 minutes, we measured dissolved oxygen again using the DO probe. Respiration values were standardized by both sediment mass and organic matter present. In the laboratory the sediment was placed into a drying oven at 60 o C for 72 hours. The sediment was weighed and then ashed in a muffle furnace at 550 o C for 4 hours. After removal from the furnace, the sediment was dried again at 60 o C for 72 hours, and weighed. Analysis We analyzed the larval growth in Experiment 1 (when reared with and without mussels) with a mixed-model ANOVA design with treatment fixed and block random. In Experiment 2 (when reared with and without the 3 food additions) we analyzed larval lamprey growth with mixed model design with treatment fixed and block random. If treatment was significant we compared means using a Tukey’s test (alpha=0.05). We analyzed data from the 30 and 80 day measures of AFDM, the 80 day measure of respiration, and the 80 day measure of larval lamprey δ13C and δ15N with a mixed model with treatment fixed and block random. We used Tukey’s test (alpha=0.05) to compare means if treatments were significantly different. JMP (SAS Institute Inc.) software was used for all analyses. Results

89
Experiment 1 Food addition After 80 days, one lamprey in the Cladophora addition treatment and two lamprey in the leaf addition treatments were not found. The two lamprey missing in the leaf addition treatments were from different replicates. All mussels were actively filtering at the end of the experiment. In the food addition experiment, lamprey grew nearly twice as fast in the leaf and fish-flake treatments as in the control treatment (F3,12=2.66, p=0.07, Figure 3). Lamprey grew the slowest on ground Cladophora, which had a lower carbon content (22% of total) than ground fish flakes and ground leaves (49% and 44% of total, respectively). Lamprey growth was also low in the same block (block 2), but in experiment 2, the effect was not significant. Lamprey tissue δ15N in the fish flake treatment was significantly higher than in the other treatments (Table 1), as was the δ15N of the fish flakes relative to that of the leaves and Cladophora, which suggests lamprey were assimilating the nitrogen from the fish flakes. We observed no differences in %C, %N, and δ13C of lamprey mussel tissue between food addition treatments. Experiment 2 Lamprey growth near mussels Over the eighty day period, lamprey grew twice as fast (0.08 mm day-1 versus 0.037 mm day-1 ) when reared with mussels (F1,4=71.66, p < 0.001, Student’s t=2.77, Figure 2). We also observed a significant block effect with lamprey growing significantly more slowly in one block (block 2). Organic matter and Respiration Surface organic matter was similar amongst treatments after 30 days (F3,16= 2.23, p=0.12). After 80 days, organic matter was similar amongst treatments in the top 2 cm (F3,12= 0.62, p= 0.62) or the bottom 8 cm (F3,16= 2.84, p= 0.39) of sediment. A block effect was observed after 80 days in the top 2 cm of sediment (F4,12= 14.6, p< 0.001), with significantly lower organic matter in block 3 (Tukey’s, alpha= 0.05). We observed significant differences in respiration between treatments in the top 2 cm of sediment (F3,16= 3.22, p= 0.05, Figure 4). Respiration was significantly higher in the mussel+lamprey treatment than in control or lamprey treatments (Tukey’s, alpha= 0.05). Respiration was not different between treatments in the bottom 8 cm (F3,16= 1.11, p= 0.38). Due to unequal variances we log-transformed Gumaga count data. After 30 days we observed higher numbers of the caddisfly Gumaga nigricula in the mussel (mean= 14.8, SE= 2.7), mussel+lamprey (mean= 12.0, SE= 2.6), and lamprey (mean= 9.8, SE= 4.5) enclosures relative to control enclosures that lacked both mussels and lamprey (mean=

90
5.8, SE= 1.4), but the differences were not significant (F3,16= 1.70, p= 0.21). Discussion Filter-feeding bivalves concentrate and deposit organic-rich material, excrete nutrients into their surroundings, and mix and stabilize sediment. In coastal habitats, bivalves enhance leaf growth in salt marsh cordgrass Spartina alterniflora (Bertness 1984), the seagrass Thalassia testudinum (Peterson and Heck 2001) and the seaweed Porphyra perforata (Aquilino et al. 2009). In freshwater, Spooner and Vaughn (2006) observed higher periphyton abundance on the shells of two unionid mussel species relative to non-feeding sham mussels. In our study the mussel Margaritifera falcata significantly enhanced Pacific lamprey larvae growth and increased respiration in the sediment. Mussel biodeposits, by increasing the quality and/or quantity of available food, may have fueled faster lamprey growth. In both marine and freshwater systems, mussels increase bulk deposition rates and the organic and nutrient concentration of the deposited material (Kautsky and Evans 1987, Greenwood et al. 2001). In the South Fork of the Eel River, Margaritifera falcata aggregations increase both the deposition rate and the percent organic material of deposits relative to background levels (Howard and Cuffey 2006a). Lamprey larvae feed predominantly on organic detritus, which typically accounts for 96-98% of their stomach contents (the remainder includes diatoms and bacteria, Manion 1967, Moore and Beamish 1973, Moore and Potter 1976, Sutton and Bowen 1994, Mundahl et al. 2005). Of the organic detritus ingested, lamprey assimilate > 60 % (Sutton and Bowen 1994, Mundahl et al. 2005). The evidence of faster lamprey growth in both the mussel and food addition treatments suggests lamprey were food limited in the ambient control treatments. The lamprey δ13C values (ca. -23 o/oo) suggest lamprey feed on a mix of aquatic sources (e.g. riffle and pool derived algae, with relatively depleted and enriched carbon, respectively as shown by Finlay et al. 1999) and/or possibly terrestrial sources. Lamprey tissue values were similar to Margaritifera tissue δ13C and δ15N values (-22.9 o/oo, 2.6 o/oo, respectively) reported by Howard and Cuffey (2005) during the summer period in the South Fork of the Eel River. Finlay et al. (1999) report summer δ13C values in the South Fork of the Eel River of -17.9 o/oo for epilithic algae in pool habitats, -26.2 o/oo for epilithic algae in riffle habitats, and -27.5 o/oo for terrestrial detritus. Stable isotope values of control lamprey (δ13C= -23.2 o/oo, δ15N= 2.7 o/oo) reflect aquatic and terrestrial source contributions to both suspended (seston) and deposited material. The pathway by which mussel biodeposits and the added food reached lamprey is unclear. Lamprey in the mussel enclosures may have ingested mussel biodeposits settling into their burrow. Lamprey larvae are often described as suspension feeders (Moore and Potter 1976, Moore and Mallatt 1980, Malmqvist and Bronmark 1982) and food has been kept in suspension during previous lamprey growth experiments (Hardisty 1944, Moore and Mallatt 1980). In our food addition experiment, however, lamprey grew faster even though added food was deposited. Lamprey fed on ground fish flakes, which are enriched in 15N, had significantly higher δ15N isotope values than other lamprey. These results, and the presence of sand grains in lamprey stomach contents (Moore and Beamish 1973), suggest lamprey may feed directly off the bed surface and/or filter interstitial water.

91
Bioturbation in the enclosures may have influenced lamprey feeding and growth. Mussel biodeposits, coupled with animal movement and activity (e.g. water pumping, Van Duren et al. 2006), could have increased food particle re-suspension and flux over lamprey burrows. Mussels are also bioturbators (Dame 1996), and their activity can mix material both in the water column (van Duren et al. 2006) and the sediment (Vaughn and Hagenkamp 2001). In addition to increasing food particle deposition, mussel activity may have increased the food available to lamprey both in the water above their burrows and in interstitial spaces. The increase in lamprey growth but no difference in organic matter accrual is at face value, paradoxical, but bioturbation may have played a role. We did not observe organic matter accruing at higher rates near mussel aggregations, as seen in previous studies (Norkko et al. 2001, Kryger and Rusgard 1988, Graf and Rosenberg 1997, Grenz et al. 1990, Commito and Boncavage 1989, Peterson and Heck 1999, Spooner and Vaughn 2006). Animal activity can remove fine particles from interstitial spaces (Zanetell and Peckarsky 1996), and the more numerous invertebrates (Gumaga, and possibly other invertebrates we did not quantify) in the mussel enclosures may have removed mussel biodeposits by ingesting them, or resuspending and dispersing them out of the enclosures. In addition to bioturbation, rapid degredation of biodeposits may have offset the higher rate of deposition in mussel enclosures. Respiration rates in sediment from mussel and mussel+lamprey enclosures were higher than in control enclosures. Mussels and other bioturbators are known to mix organic material and oxygen into the sediment and to enhance water flux across the water-sediment boundary (Spooner and Vaughn 2006). This mixing can enhance microbial processing and degradation of organic matter (Dame 1996). Bacteria abundance and exoenzymatic activity increases rapidly after mussel biodeposits settle, and degradation can occur over short time periods (Stuart et al. 1982, Grenz et al. 1990). Stuart et al. (1982) observed a rapid increase in bacterial abundance in deposited mussel faeces and pseudofaeces relative to background levels. Maximum mineralization occurred three days after deposition and gradually declined in their study. Grenz et al. (1990) also observed similar rapid increases in bacteria production on sediments enriched with mussel biodeposits. These studies suggest biodeposits degrade within days. Lamprey, like mussels, may act as bioturbators. Lamprey increased respiration in the sediment, but only when mussels were present. Their movement and filtering activity may mix and aerate the sediment and increase microbial activity. We did not quantify lamprey movement, but we did observe new lamprey burrows in the enclosures during the experiment. Lamprey also flush the surrounding sediment with water and introduce unassimilated particles during filtering. Lamprey selectively filter and ingest particles smaller than 400 µm (Moore and Mallat 1980), while larger particles are ejected out through the gills and into the surrounding sediment. Sea lamprey and brook lamprey larvae were found to ingest 5 mg AFDM g-1 ammocoete day-1 in July (Sutton and Bowen 1994). If approximately 60% is assimilated, the remaining 40% is released into the sediment. Three lamprey in each enclosure would add approximately 6 mg of organic material to the enclosure daily and possibly increase microbial activity. In our experiment, however, this increase in organic matter or sediment respiration by lamprey larvae was not detectable when mussels were absent.

92
Interactions between mussels and lamprey larvae may vary with mussel species (Spooner and Vaughn 2006), season, and environment (substrate, flow conditions). Lamprey larval densities increase with deposited organic matter and chlorophyll a (Hardisty 1944, Malmqvist 1980, Potter et al. 1986, Beamish and Jebbink 1994, Beamish and Lowartz 1996), suggesting that they track variation in food availability. Where mussel aggregations enhance these resources, they may facilitate lampreys during their larval rearing stages. Mussel biomass once dominated the benthos of many North American freshwaters (Dame 1996), and their decline throughout the continent (Williams et al. 1993) could have negative consequences for lamprey populations.

93
Acknowledgements We thank G. Benigno and E. Limm for help in the field and P. Steel for his tireless work on site. We thank the University of California Natural Reserve System for the protected research site. The project was funded by the National Science Foundation via grants to the National Center for Earth Surface Dynamics (EAR 0120914) and to Consumer-Resource Interactions and Stoichiometrically Explicit Spiraling (DEB 0543363).We thank W. Sousa for reviewing the manuscript and providing helpful comments.

94
References Aquilino, K.M., M.E.S. Bracken, M.N. Faubel, and J.J. Stachowicz. 2009. Local-scale nutrient regeneration facilitates seaweed growth on wave-exposed rocky shores in an upwelling system. Limnology and Oceanography 54:309-317. Baker, S.M., and Hornbach, D.J. 1997. Acute physiological effects of zebra mussel (Dreissena polymorpha) infestation on two unionid mussels, Actinonaias ligamentina and Amblema plicata. Canadian Journal of Fisheries and Aquatic Sciences 54: 512-519. Beamish, F.W.H., and Jebbink, J. 1994. Abundance of lamprey larvae and physical habitat. Environmental Biology of Fishes 39:209-214. Beamish, F.W.H., and Lowartz, S. 1996. Larval habitat of American brook lamprey. Canadian Journal of Fisheries & Aquatic Sciences 53:693-700. Bertness, M.D. 1984. Ribbed mussels and Spartina alterniflora production in a New England salt-marsh. Ecology 65:1794-1807. Bertness, M.D., and Grosholz, E. 1985. Population dynamics of the ribbed mussel, Geukensia demissa: The costs and benefits of an aggregated distribution. Oecologia 67:192-204. Caraco, N.F., J.J., Cole, P.A. Raymond, D.L. Strayer, M.L. Pace, S.E.G. Findlay, and D.T. Fischer. 1997. Zebra mussel invasion in a large, turbid river: phytoplankton response to increased grazing. Ecology 78:558-602. Commito, J., and Boncavage, E. 1989. Suspension-feeders and coexisting infauna - an enhancement counterexample. Journal of Experimental Marine Biology and Ecology 125:33-42. Dame, R.F. 1996. Ecology of marine bivalves: an ecosystem approach. CRC Press, Florida. 254 pages. Graf, G., and Rosenberg, R. 1997. Bioresuspension and biodeposition: A review. Journal of Marine Systems 11:269-278. Greenwood, K., Thorp, J., Summers, R., & Guelda, D. 2001. Effects of an exotic bivalve mollusc on benthic invertebrates and food quality in the Ohio River. Hydrobiologia 462: 169-172. Grenz, C., M. Hermin, D. Baudinet, and R. Daumas. 1990. In situ biochemical and bacterial variation of sediments enriched with mussel biodeposits. Hydrobiologia 207:153-160.

95
Hanson, J.M., W.C. Mackay, and E.E. Prepas. 1988. The effects of water depth and density on the growth of a unionid clam. Freshwater Biology 19:345-355. Hardisty, M.W. 1944. The life history and growth of the brook lamprey (Lampetra planeri). Journal of Animal Ecology 13:110-122. Hastie, L.C., and K.A. Toy. 2008. Changes in density, age structure and age-specific mortality in two western pearlshell (Margaritifera falcata) populations in Washington (1995-2006). Aquatic Conservation: Marine and Freshwater Ecosystems 18:671-678. Howard, J.K., and K.M. Cuffey. 2003. Freshwater mussels in a California North Coast Range river: occurrence, distribution, and controls. Journal of the North American Benthological Society 22:63-77. Howard, J.K., and K.M. Cuffey. 2006a. The functional role of native freshwater mussels in the fluvial benthic environment. Freshwater Biology 51:460-474. Howard, J.K., and K.M. Cuffey. 2006b. Factors controlling the age structure of Margaritifera falcata in 2 northern California streams. Journal of the North American Benthological Society 25:677-690. Howard, J.K., and K.M. Cuffey, and M. Solomon. 2005. Toward using Margaritifera falcata as an indicator of base level nitrogen and carbon isotope ratios: insights from two California Coast Range rivers. Hydrobiologia 541:229-236. Hunter, R.D., and J.F. Bailey. 1992. Dreissena polymorpha (zebra mussel): Colonization of soft substrata and some effects on unionid bivalves. Nautilus 106:60-67. Kautsky, N., and S. Evans. 1987. Role of biodeposition by mytilus-edulis in the circulation of matter and nutrients in a baltic coastal ecosystem. Marine Ecology-Progress Series , 38:201-212. Kryger, J., and H.U. Riisgård. 1988. Filtration rate capacities in 6 species of European freshwater bivalves. Oecologia 77:34-38. Malmqvist, B. 1980. Habitat Selection of Larval Brook Lamprey (Lampetra planeri, Bloch) in a south Swedish stream. Oecologia 45:35-38. Malmqvist, B., and C. Bronmark. 1982. Filter Feeding in Larval Lampetra planeri- Effects of Size Temperature and Particle Concentration. Oikos 38:40-46. Manion, P.J. 1967. Diatoms as food of larval sea lampreys in a small tributary of northern Lake Michigan. Transactions of the American Fisheries Society 96:224-226.
96
Moore, J.W., and F.W.H. Beamish. 1973. Food of larval sea lamprey (Petromyzon marinus) and American brook lamprey (Lampetra lamottei). Journal of Fisheries Research Board Canada 30:7-15. Moore, J.W., and J.M. Mallatt.1980. Feeding of larval lamprey. Canadian Journal of Fisheries & Aquatic Sciences 37:1658-1664. Moore, J.W., and I.C. Potter. 1976. Aspects of feeding and lipid deposition and utilization in lampreys, Lampetra fluviatilis (l) and lampetra-planeri (Bloch). Journal of Animal Ecology 45:699-712. Moser, M.L., and D.A. Close. 2003. Assessing Pacific lamprey status in the Columbia River basin. Northwest Science 77:116-125. Moyle, P.B. 2002. Inland Fishes of California. University of California Press, Berkeley and Los Angeles, CA. Mundahl, N.D., C. Erickson, M.R. Johnston, G.A. Sayeed, and S. Taubel. 2005. Diet, feeding rate, and assimilation efficiency of American brook lamprey. Environmental Biology of Fishes 72:67-72. Negus, C. 1966. A quantitative study of growth and production of unionid mussels in the River Thames at Reading. The Journal of Animal Ecology 35:513-532. Newell, R., J. Field, and C. Griffiths. 1982. Energy-balance and significance of microorganisms in a kelp bed community. Marine Ecology Progress Series 8:103-113. Norkko, A., J.E. Hewitt, S.F. Thrush, and G.A. Funnell. 2001. Benthic-pelagic coupling and suspension-feeding bivalves: Linking site-specific sediment flux and biodeposition to benthic community structure. Limnology and Oceanography 46:2067-2072. Okamura, B. 1986. Group living and the effects of spatial position in aggregations of Mytilus edulis. Oecologia 69:341-347. Paine, R.T. 1974. Intertidal community structure. Oecologia 15:93-120. Peterson, B.J., and K.L. Heck. 1999. The potential for suspension feeding bivalves to increase seagrass productivity. Journal of Experimental Marine Biology and Ecology 240:37-52. Peterson, B.J., and K.L. Heck. 2001. Positive interactions between suspension-feeding bivalves and seagrass-a facultative mutualism. Marine Ecology Progress Series 213:143-155.
97
Potter, I.C., R.W. Hilliard, J.S. Bradle, and R.J. McKay. 1986. The influence of environmental variables on the density of larval lampreys in different seasons. Oecologia 70-433-440. Power M. E., M.S. Parker, and J.T. Wootton. 1996. Disturbance and food chain length in rivers. In: Food Webs: Integration of Patterns and Dynamics (eds G. A. Polis & K. O. Winemiller) pp. 286–297. Chapman & Hall, New York. Renaud, C.B. 1997. Conservation status of Northern Hemisphere lampreys (Petromyzontidae). Journal of Applied Ichthyology 13:143-148. Rhoads, D.C., and D.K. Young. 1970. The influence of deposit-feeding organisms on sediment stability and community trophic structure. Journal of Marine Research 28:150-178. Spooner, D.E., and C.C. Vaughn. 2006. Context-dependent effects of freshwater mussels on stream benthic communities. Freshwater Biology 51:1016-1024. Strayer, D.L., N.F. Caraco, J.J. Cole, S. Findlay, and M.L. Pace. 1999. Transformation of Freshwater Ecosystems by Bivalves- A case study of zebra mussels in the Hudson River. Bioscience 49:19-27. Stuart, V., R.C. Newell, and M.I. Lucas. 1982. Conversion of kelp debris and fecal material from the mussel Aulacomya ater by marine microorganisms. Marine Ecology-Progress Series 7:47-57. Sutton, T., and S. Bowen.1994. Significance of organic detritus in the diet of larval lampreys in the Great-Lakes Basin. Canadian Journal of Fisheries and Aquatic Sciences 51:2380-2387. Torgersen, C.E., and D.A. Close. 2004. Influence of habitat heterogeneity on the distribution of larval Pacific lamprey (Lampetra tridentata) at two spatial scales. Freshwater Biology 49:614-630. Vanduren, L.A., P.M.J. Herman, J.J. Sandee, and C.H.R. Heip. 2006. Effects of mussel filtering activity on boundary layer structure. Journal of Sea Research 55:3-14. Vaughn, C.C., and C.C. Hakenkamp. 2001. The functional role of burrowing bivalves in freshwater ecosystems. Freshwater Biology 46:1431-1446. Wildish, D.J., and D.D. Kristmanson. 1984. Importance to mussels of the benthic boundary layer. Canadian Journal of Fisheries and Aquatic Sciences 41:1618-1625. Wildish, D.J., and D. Peer. 983. Tidal current speed and production of benthic macrofauna in the lower Bay of Fundy. Canadian Journal of Fisheries and Aquatic Sciences 40:309-321.

98
Williams, J.D., M.L. Warren Jr., K.S. Cummings, J.L. Harris and R.J. Neves. 1993. Conservation status of freshwater mussels of the United States and Canada. Fisheries 18:6-22. Wolman, M.G., 1954. A method of sampling coarse river-bed material. Transactions of the American Geophysical Union 35:951-956. Wotton, R.S., and B. Malmqvist. 2001. Feces in aquatic ecosystems. Bioscience 51:537-544. Zanetell, B.A., and Peckarsky, B.L. 1996. Stoneflies as ecological engineers - hungry predators reduce fine sediments in stream beds. Freshwater Biology 36:569-577.

99
TABLES

100
FIGURE LEGENDS Figure 1. Map of the South Fork of the Eel River, Mendocino, CA. Figure 2. Larval lamprey growth after 80 days with and without mussels in the enclosures. Error bars represent 1 S.E. Figure 3. Larval lamprey growth after 80 days in control (no food added) and food addition treatments. Error bars represent 1 S.E. Figure 4. Respiration measured after 80 days in the top 2 cm and bottom 8 cm of sediment. Error bars represent 1 S.E.

101
Figure 1.

102
Figure 2.

103
Figure 3.

104
Figure 4.