hydra—the national earthquake information center’s … · seismic processing ... hydra—the...
TRANSCRIPT

U.S. Department of the Interior U.S. Geological Survey
Hydra—The National Earthquake Information Center’s 24/7 Seismic Monitoring, Analysis, Catalog Production, Quality Analysis, and Special Studies Tool Suite
By John M. Patton, Michelle R. Guy, Harley M. Benz, Raymond P. Buland, Brian K. Erickson, and David S. Kragness
Open-File Report 2016–1128

ii
U.S. Department of the Interior SALLY JEWELL, Secretary
U.S. Geological Survey Suzette M. Kimball, Director
U.S. Geological Survey, Reston, Virginia: 2016
For more information on the USGS—the Federal source for science about the Earth, its natural and living resources, natural hazards, and the environment—visit http://www.usgs.gov/ or call 1–888–ASK–USGS (1–888–275–8747).
For an overview of USGS information products, including maps, imagery, and publications, visit http://store.usgs.gov.
Any use of trade, firm, or product names is for descriptive purposes only and does not imply endorsement by the U.S. Government.
Although this information product, for the most part, is in the public domain, it also may contain copyrighted materials as noted in the text. Permission to reproduce copyrighted items must be secured from the copyright owner.
Suggested citation: Patton, J.M., Guy, M.R., Benz, H.M., Buland, R.P., Erickson, B.K., and Kragness, D.S., 2016, Hydra—The National Earthquake Information Center’s 24/7 seismic monitoring, analysis, catalog production, quality analysis, and special studies tool suite: U.S. Geological Survey Open-File Report 2016–1128, 28 p., http://dx.doi.org/10.3133/ofr20161128.
ISSN 2331-1258 (online)

iii
Contents
Abstract ......................................................................................................................................................... 1 Introduction .................................................................................................................................................... 1 Background and Motivation ........................................................................................................................... 2 Hydra’s Capabilities ....................................................................................................................................... 2 Hydra’s Design .............................................................................................................................................. 3
Event Detection .......................................................................................................................................... 3 Data Insertion ............................................................................................................................................. 8 Data Storage ............................................................................................................................................ 11 Seismic Processing .................................................................................................................................. 13
Seismic Processing History .................................................................................................................. 18 Seismic Processing Algorithms ............................................................................................................ 18 Seismic Processing Dependencies ...................................................................................................... 19
Seismic Analysis Interfaces ..................................................................................................................... 19 Data Output .............................................................................................................................................. 21 System Redundancy ................................................................................................................................ 22
Hardware ..................................................................................................................................................... 24 System Monitoring ................................................................................................................................... 25
Specialized Use Cases ................................................................................................................................ 25 Portable Array Processing Use Case ....................................................................................................... 25 Quality Assurance Use Case ................................................................................................................... 26
Additional Development ............................................................................................................................... 26 Summary ..................................................................................................................................................... 27 References .................................................................................................................................................. 27
Figures
1. Diagram showing the overall Hydra design....................................................................................... 3 2. Diagram showing the Event Detection design .................................................................................. 4 3. Diagram showing the Global Associator nucleation algorithm .......................................................... 6 4. Diagram showing the Global Associator association and nucleation algorithms ............................... 7 5. Diagram showing the Data Insertion design ..................................................................................... 8 6. Diagram showing the Pick Insertion algorithm .................................................................................. 9 7. Diagram showing the Event Insertion algorithm .............................................................................. 10 8. Diagram showing the Data Storage design .................................................................................... 11 9. Diagram showing a simplified overview of the Hydra Schema ........................................................ 12 10. Diagram showing the Hydra Seismic Processing design ................................................................ 14 11. Diagram depicting an example of a sequential processing segment .............................................. 15 12. Diagram depicting an example of a parallel processing segment ................................................... 16 13. Diagram showing the processing segment transitions .................................................................... 17 14. Diagram showing the Seismic Analysis user interface design ........................................................ 20 15. Diagram showing the Hydra catalog production workflow .............................................................. 21

iv
16. Diagram depicting the Data Output design of Hydra ....................................................................... 22 17. Diagram showing the Hydra System Redundancy design .............................................................. 23 18. Diagram showing the logical computer systems that host Hydra at the National Earthquake
Information Center .......................................................................................................................... 25 19. Diagram depicting the Portable Array Hydra use case ................................................................... 26
Abbreviations 1-D one-dimensional ANSS Advanced National Seismic System API Application Programmer Interface ComCat Comprehensive Catalog CWB Continuous Waveform Buffer EHP USGS Earthquake Hazards Program FTP file transfer protocol GLASS Global Associator GUI graphical user interface IASPEI International Association of Seismology and Physics of the Earth’s Interior JSON JavaScript Object Notation LG Surface wave at regional distances LTA long-term average M magnitude NEIC National Earthquake Information Center P wave compressional wave PA Portable Array PAGER Prompt Assessment of Global Earthquake Response PDE Preliminary Determination of Epicenters PDL Product Distribution Layer PWB Portable Array Continuous Waveform Buffer RSTT Regional Seismic Travel Time S wave shear wave SEDAS Seismic Earthquake Data Analysis System STA short-term average USGS U.S. Geological Survey XML extensible markup language

Hydra—The National Earthquake Information Center’s 24/7 Seismic Monitoring, Analysis, Catalog Production, Quality Analysis, and Special Studies Tool Suite
By John M. Patton,1 Michelle R. Guy,1 Harley M. Benz,1 Raymond P. Buland,1 Brian K. Erickson,2 and David S. Kragness3
Abstract This report provides an overview of the capabilities and design of Hydra, the global seismic
monitoring and analysis system used for earthquake response and catalog production at the U.S. Geological Survey National Earthquake Information Center (NEIC). Hydra supports the NEIC’s worldwide earthquake monitoring mission in areas such as seismic event detection, seismic data insertion and storage, seismic data processing and analysis, and seismic data output.
The Hydra system automatically identifies seismic phase arrival times and detects the occurrence of earthquakes in near-real time. The system integrates and inserts parametric and waveform seismic data into discrete events in a database for analysis. Hydra computes seismic event parameters, including locations, multiple magnitudes, moment tensors, and depth estimates. Hydra supports the NEIC’s 24/7 analyst staff with a suite of seismic analysis graphical user interfaces.
In addition to the NEIC’s monitoring needs, the system supports the processing of aftershock and temporary deployment data, and supports the NEIC’s quality assurance procedures. The Hydra system continues to be developed to expand its seismic analysis and monitoring capabilities.
Introduction Hydra is a software system that performs real-time processing, analysis, and catalog production
of seismic event data for the U.S. Geological Survey (USGS) National Earthquake Information Center (NEIC). Hydra was designed with a flexible, modular, and scalable architecture to support (1) seismic event detection, (2) integration of near-real-time and delayed earthquake data from regional and global sources, (3) a robust suite of automatic processing algorithms, (4) a modern tool suite for algorithmic analysis of seismic events, and (5) catalog production.
Hydra uses the Product Distribution Layer (PDL) infrastructure to distribute all produced earthquake data to the USGS Earthquake Hazards Program (EHP) Web site (http://earthquake.usgs.gov/), the Advanced National Seismic System (ANSS) Comprehensive Catalog (ComCat) (http://earthquake.usgs.gov/earthquakes/map/doc_aboutdata.php), and various national and international seismic research and analysis collaborating organizations.
1U.S. Geological Survey 2Synergetics Inc. 3Katylyst Integration

2
Background and Motivation Development of Hydra began in 2003. Hydra was created to replace the legacy NEIC processing
systems, Seismic Earthquake Data Analysis System (SEDAS) and its successor Chicxulub, with a more modern, more easily extended, and more maintainable system. Utilizing different data acquisition programs, SEDAS and Chicxulub performed several tasks for the NEIC, including seismic processing, data output, and data archiving on the “Preliminary Determination of Epicenters (PDE) Seismic Event Catalog.” However, the programs and algorithms used by these legacy systems had been in service since the early 1980s and could only run on antiquated hardware.
During the redesign of the NEIC processing system, four distinct systems were created to perform the necessary tasks. Moving this functionality into multiple systems increases the usability of the processing system for all earthquake data producers and consumers within the USGS, as well as for USGS collaborators and the general public. The four systems and their tasks are:
• The Edge/Continuous Waveform Buffer (CWB) handles data acquisition (Patton and others, 2015);
• Hydra performs seismic processing and catalog production; • PDL distributes seismic information; and • ANSS ComCat hosts the ANSS catalogs, including the PDE (Guy and others, 2015).
Hydra’s Capabilities The capabilities of the Hydra software system fall into four major categories: detection,
integration, processing, and analysis. Hydra detects earthquake events using seismic waveform data from thousands of seismometer stations around the world, including stations in the Global Seismographic Network, the ANSS backbone, and various other non-USGS networks (both domestic and international). The seismic waveform data are processed using an automatic, real-time phase arrival-time waveform picking algorithm and a nucleation/association back-projection algorithm. These algorithms are used together to pick and associate seismic phases at local, regional, and global distances and automatically create detections as rapidly as possible.
Hydra integrates earthquake parametric data from multiple sources, including locally detected and externally contributed events. The system performs this integration as part of a near-real-time exchange of earthquake response data and late-arriving, finalized earthquake catalogs from contributing data sources. These data are associated and merged into individual seismic events that contain all the known information about the earthquake.
Hydra has a robust suite of earthquake-processing algorithms that can relocate earthquakes and perform depth, magnitude, and moment tensor calculations. A moment tensor is a mathematical representation of the movement on a fault during an earthquake, which consists of nine generalized couples or nine sets of two vectors. A detailed audit trail and processing timeline is kept throughout the processing of each seismic event.
Additionally, Hydra provides client-side graphical user interfaces (GUIs) for analysis and user guidance of seismic processing. The GUIs allow the NEIC 24/7 analysts, event coordinators, and scientists to evaluate processed solutions, modify computational parameters, include/exclude seismic data, and override association of seismic waveform and parametric data to refine outputs. The analysts use the same GUIs as part of the production, review, and quality control processes that generate the PDE Catalog. The GUIs are also used to provide reviewed solutions to collaborators, other programmatic applications, and the general public.

3
Owing to the 24/7 mission requirements, Hydra has extensive redundancy built into its architecture because of its 24/7 mission requirements. This redundancy ensures the highest level of system availability during system maintenance, high load, equipment failure, and emergencies.
Hydra’s Design The design of the Hydra system is organized into seven areas, as shown in figure 1. These
include Event Detection, Data Insertion, Data Storage, Seismic Processing, Seismic Analysis, Data Output, and System Redundancy.
Figure 1. Diagram showing the overall Hydra design, including the Edge data acquisition servers and Product Distribution Layers (PDLs) that input data into Hydra, the seven Hydra design areas (Event Detection, Data Insertion, Data Storage, Seismic Processing, Seismic Analysis, Data Output, and System Redundancy), and the data flows between the seven areas. (N, number; indicates that Hydra can process multiple events simultaneously)
Event Detection The Event Detection component of Hydra uses various automatic algorithms to pick phase
arrival times from seismic waveform data and use those picks to generate earthquake detections. Hydra receives a real-time, continuous feed of seismic waveform data from the NEIC Edge data acquisition servers as shown in figure 2. This feed consists of waveforms from seismic stations around the world that are curated to support operations at teleseismic, regional, and local distances.

4
Figure 2. Diagram showing the Event Detection design, including the Edge/Continuous Waveform Buffer, Hydra Picker, and Global Associator (GLASS) used in Event Detection, and the data flows and relationships between those algorithms and the subsequent design area, Data Insertion. Optional regional and local picking algorithms are also shown.
A waveform arrival-time picking algorithm, the Hydra Picker, is the primary method used to generate automatic phase arrival times that are not known to be associated with any existing seismic event. These unassociated pick data are required inputs for automatic event detection. The Hydra Picker algorithm, which was developed in the mid-1980s through a cooperative agreement between the USGS and the Istituto Nationale di Geofisica, was used as the primary automatic picking algorithm for both the SEDAS and Chicxulub systems. The Hydra Picker was designed to be strictly real time. That is, each new data sample from each seismic channel is processed as it is received. The real-time design of the Hydra Picker precludes the reprocessing of portions of the waveform data based on later inferences.
The basic Hydra Picker algorithm is a classic short-term average (STA)/long-term average (LTA) algorithm (Lee and Stewart, 1981). The short-term part of the algorithm is derived from simple one‐pole recursive filters. A second STA part with a separate filter is used for longer-period teleseismic arrivals. The LTA is derived by low-pass filtering of the STAs.
The onset time is set when one of the STAs exceeds the mid-level of the LTA. The mid-level is automatically updated based on the LTA and a preconfigured triggering value. A short buffer is maintained around the onset time so that the arrival time can be refined. Once the detection is confirmed by the STA continuing to exceed the mid-level of the LTA by an amount of time related to the amplitude of the STA, the LTA is no longer updated. The detection is shut down when the STA falls below a level set by the LTA. A considerable drawback of this algorithm is that detections are suppressed until shutdown; this suppression precludes detecting shear waves (S waves) from local and regional earthquakes in addition to the compressional waves (P waves).
The Hydra Picker algorithm is made considerably more complex by the need to suppress detections on common nonseismic signals, such as telemetry spikes or local noise. There are several

5
intertwined subsystems used to accomplish this task. An eight-pole prefilter is used to suppress large coastal microseism signals. To deal with severe telemetry or seismometer problems, the signal will be rejected if it is very asymmetric. Finally, detections are suppressed for a set amount of time after an earlier detection shuts down to minimize the number of detections per day resulting from unrelenting communication problems.
The Hydra Picker does not make any amplitude measurements because the algorithms used by Hydra to calculate magnitude estimates compute their own amplitudes. The set of stations used by the Hydra Picker is regenerated automatically each day based on waveform availability, appropriate (vertical) channel selection, and human input.
Unassociated pick data can be supplemented by additional waveform phase arrivals from various regional, multiband, and cross-correlation picking algorithms, as needed. All picks, whatever their source, are forwarded to Data Insertion.
Automatic earthquake detection in Hydra is performed using an algorithm called the Global Associator (GLASS). GLASS, developed in the mid-2000s by the NEIC, gathers unassociated phase arrival picks into a collection that provides location and phase assignment to earthquakes, quarry blasts, or other seismic events at teleseismic, regional, and (or) local distances. The GLASS algorithm consists of two processing steps, nucleation and association.
GLASS uses an algorithm called nucleation to determine a trial location from a minimum set of unassociated phase arrival picks. The nucleation algorithm is based on the principle of travel-time back projection. For all picks from a given quake, the travel-time back projections (that is, where a phase was at a given time) will intersect at a point near the actual event’s hypocenter. The geospatial coincident of the picks and the time of coincidence provides a trial location, origin time, and initial phase identification. Nucleation considers only the picks that have not been associated with an existing event. The back projection is applied to the picks on each of a set of spherical, geocentric shells spanning the seismogenic depth range, and a spatial clustering algorithm is used to form a distribution of potential hypocenters on each shell. The hypocenter used for association is selected from the tightest fitting cluster from all shells.
Nucleation assumes that the pick being considered is a P phase, so the possible hypocenters are a small circle on the current depth shell being considered. These potential hypocenters can be considered as the intersection of two spheres: (1) the depth shell and (2) another sphere centered at the station reporting the pick being considered. For each of the other picks within the time range, similar spheres can be constructed. Given two or more picks (the pick being considered and others), considering each pair of picks results in three spheres (including the depth shell, not shown on figure) and the intersection of these three spheres can be either one or two points (or no points if there is no intersection). Thus, each pair of picks leads to a maximum of two possible hypocenters, each on the surface of the depth shell. Repeating this process for each of the arrivals in the time range generates a set of potential hypocenters on the surface of the depth shell. The algorithm then calculates the distance between each potential hypocenter. The potential hypocenter closest to the center of the smallest cluster of hypocenters from all possible depth shells is used to declare a new seismic event with the determined parameters (fig. 3).

6
Figure 3. Diagram showing the Global Associator nucleation algorithm, demonstrating the intersections of the travel-time back projections for three picks at stations equidistant from the source event, represented by the star, on a single depth shell.
If the nucleation algorithm does not place a pick into an event, the pick is either (1) left in the pool of unassociated picks available to be used for future nucleation, or (2) associated as a secondary phase in the association process. Association of phase arrivals determines whether a given arrival time pick belongs to, or is associated with, a given known seismic event. Association is determined based on travel-time tables; phase-type lists; the empirical likelihood of observation; station quality; and tunable affinity statistics, including distance range, time range, and residual width. If the arrival time pick does not associate with any known seismic events, the pick is passed to nucleation as a new pick (fig. 4).

7
Figure 4. Diagram showing the Global Associator association algorithm and demonstrating the flow of new picks from association to nucleation.
The set of stations used for nucleation and association is regenerated automatically each day based on station density and the following station quality statistics:
• Association ratio.—The number of arrival time picks associated with quakes divided by the number of total arrival time picks from a station.
• Sensitivity ratio.—The number of total arrival time picks from a station. • Association quality.—The number of magnitude (M) 5.1or greater earthquakes for which the
station recorded a P phase arrival time pick. These three statistics are all normalized to some degree around the median value for each metric
from all stations. Stations that are noisy (that is, they have a high sensitivity ratio), or that have a poor association quality and (or) ratio are excluded for use in nucleation and association.
The resulting associated phases and seismic event detections are forwarded to Data Insertion, shown in figure 5, using well-defined formats. These formats include the NEIC-designed global_pick and global_loc space delimited formats for the exchange of seismic detections.

8
Data Insertion In Data Insertion, Hydra gathers all the parametric seismic information provided to it from many sources and inserts these data into Data Storage, shown in figure 5. Parametric seismic information includes event specific data products such as origins, magnitudes, and moment tensors, as well as unassociated data such as picks. As shown in figure 5, Hydra differentiates between real-time (mission critical), near-real-time contributed (mission supplemental), and catalog update (mission supplemental) data upon insertion. In general, Event Detection is the source of the real-time parametric data. The near-real-time contributed data are received from various seismic organizations as QuakeML (Schorlemmer and others, 2004) formatted earthquake data products. QuakeML is an international seismic-event data exchange format that represents earthquake origins, magnitudes, phases, amplitudes and supporting metadata in well-formatted extensible markup language (XML) (https://quake.ethz.ch/quakeml/). Hydra receives the QuakeML products through PDL. The catalog update data are also received as QuakeML formatted products through PDL. The real-time data are given priority and a separate insertion path from the contributed and catalog products. Additionally, the catalog update data-insertion rate is throttled to preserve system capacity for mission critical processing.
Figure 5. Diagram showing the Data Insertion design. Depicted are the various input paths from Event Detection and the Product Distribution Layer (PDL) and the real-time, contributed, and throttled inserters used by Hydra. (Assoc., associated; Contrib., contributed)
Waveform arrival picks are inserted into Hydra using a data deduplication process that is called smart Pick Insertion because it considers existing picks during insertion. The goals of smart pick

9
insertion are storing unique picks in the database and selecting the best pick when multiple contributions are available. The Pick Insertion process is shown in figure 6.
Figure 6. Diagram showing the Pick Insertion algorithm.
The Pick Insertion process first uses the pick attribution and known pick identifier to determine if the new pick is an exact duplicate from the contributing source. An exact duplicate pick is not inserted. The process then searches the database for any existing picks from the same station channel that match the new pick based on source-type specific time windows. For example, a pick from a human source has a tighter time window than a pick from an automatic source, under the assumption that a human source is more likely to be accurate than an automatic source. Similarly, a pick from a local source has a tighter time window than a pick from a nonlocal source, assuming that a local source is more accurate than a contributed one. If a match is found, the preferred pick is selected based on a combination of source-type factors including human creator versus automatic creator, and contributed (non-NEIC) source versus local source. A pick from a human source (new or existing) always supersedes a pick from an automatic source, and when the source types are the same, a newer pick supersedes an older pick. Additionally, a pick from a local-human source supersedes a pick from a contributed-human source. If the new pick is deemed preferred, or if an existing matching pick is not

10
found, the new pick is inserted into the database. The end result of this process is that only a single pick is stored in the database for a given time on a given station channel.
A pick is not inserted if the station location information, or the source for a waveform arrival pick, is not known to Hydra. Once a day, Hydra automatically acquires station location information from the central Station Metadata Server, which is treated as the master source for station metadata.
Other earthquake information, such as origins, pick associations, magnitudes, and moment tensors are inserted using a data aggregation process called Event Insertion. The goal is to aggregate all the information available for a seismic event into a single dataset, as shown in figure 7.
Figure 7. Diagram showing the Event Insertion algorithm.
During Event Insertion, the database is searched for an existing seismic event using either a combination of attribution plus a known identifier or a similar seismic event using the provided hypocentral parameter data. If an existing event is found, the new information is added to the seismic dataset for that event. If no existing event is found, a new dataset is created for the event. This insertion algorithm has the effect of aggregating locations, magnitudes, pick associations, and other pertinent seismic data from many sources into individual datasets that are stored in Data Storage. This process preserves all contributed earthquake locations and magnitudes. A contributed solution that updates existing parametric data replaces only the prior solution from that contributor. All other solutions are unaffected. In Hydra, pick associations are considered to be part of the seismic dataset, not the solutions with which they were contributed. Additionally, a pick can be associated with only a single dataset or event.
As with contributed waveform arrival-time picks, the data are not inserted if Hydra does not know the source for a contributed seismic event. Given NEIC’s current earthquake response policy requirements, any externally contributed seismic data with a magnitude estimate below 2.0 are not inserted into Hydra.

11
Data Storage Hydra is a database-centric system. That is, all seismic algorithm configuration, attribution,
process communication, and parametric data are stored in a database, as depicted in figure 8.
Figure 8. Diagram showing the Data Storage design, including the Application Programmer Interface (API), Database Schema, and relationship to other Hydra design aspects.
The Database Schema, which consists of the organization, relationships, and constraints of the seismic and other data stored in the database, is abstracted from the rest of Hydra by a set of well-defined Application Programmer Interfaces (APIs). The Hydra processes, analysis GUIs, and algorithms communicate with Data Storage exclusively through these APIs. A simplified version of the Hydra Database Schema is as shown in figure 9.
12
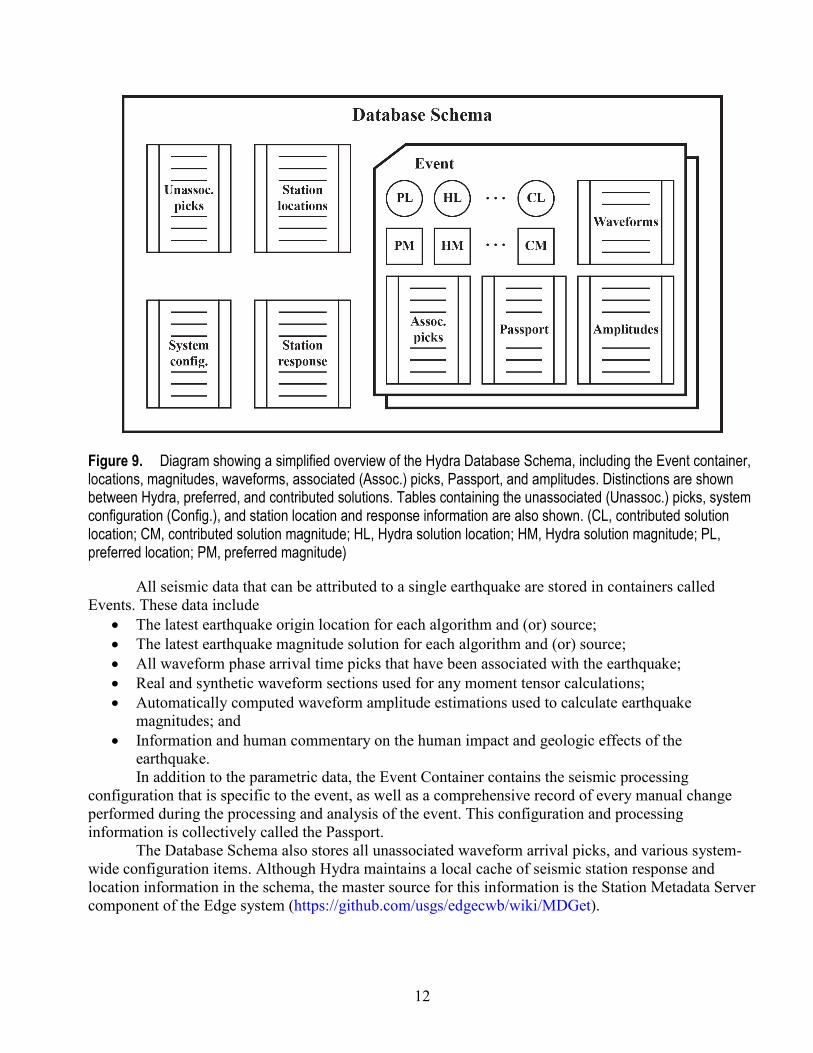
Figure 9. Diagram showing a simplified overview of the Hydra Database Schema, including the Event container, locations, magnitudes, waveforms, associated (Assoc.) picks, Passport, and amplitudes. Distinctions are shown between Hydra, preferred, and contributed solutions. Tables containing the unassociated (Unassoc.) picks, system configuration (Config.), and station location and response information are also shown. (CL, contributed solution location; CM, contributed solution magnitude; HL, Hydra solution location; HM, Hydra solution magnitude; PL, preferred location; PM, preferred magnitude)
All seismic data that can be attributed to a single earthquake are stored in containers called Events. These data include
• The latest earthquake origin location for each algorithm and (or) source; • The latest earthquake magnitude solution for each algorithm and (or) source; • All waveform phase arrival time picks that have been associated with the earthquake; • Real and synthetic waveform sections used for any moment tensor calculations; • Automatically computed waveform amplitude estimations used to calculate earthquake
magnitudes; and • Information and human commentary on the human impact and geologic effects of the
earthquake. In addition to the parametric data, the Event Container contains the seismic processing
configuration that is specific to the event, as well as a comprehensive record of every manual change performed during the processing and analysis of the event. This configuration and processing information is collectively called the Passport.
The Database Schema also stores all unassociated waveform arrival picks, and various system-wide configuration items. Although Hydra maintains a local cache of seismic station response and location information in the schema, the master source for this information is the Station Metadata Server component of the Edge system (https://github.com/usgs/edgecwb/wiki/MDGet).
13
Hydra uses Oracle 12c Standard One combined with the Hydra Schema as its database management system. The mature APIs that support all database interactions are written in the C and C++ programming languages.
It is important to note that Hydra is a seismic analysis system, not a long-term seismic data archive system. All published seismic events are sent to the ANSS ComCat system (http://earthquake.usgs.gov/earthquakes/map/doc_aboutdata.php) for long-term archival storage. All parametric data, including seismic events, are deleted from Hydra after the NEIC catalog production process is completed, about 12 weeks after event detection.
Seismic Processing Hydra uses a modular-state transition design to perform seismic processing on events. An
example is shown in figure 10. In essence, there is a set of tasks that can be performed on a seismic event. These tasks are called states. Each of these states may have an associated processing module that performs the task. An Event Processor reads the state of the event and calls the appropriate processing module to perform the task. The processing module loads the event data from the database in Data Storage, loads the Passport containing the module-specific configuration, performs the task, and then writes the results back into the database. Once the task is completed, the Event Processor determines what the next state for the event should be based on the defined “state transitions,” and schedules the corresponding task(s). These state transitions are predefined in a list accessible by Event Processors.

14
Figure 10. Diagram showing the Hydra Seismic Processing design, depicting the Event Processor, modules, and transitions, as well as the data relationships to other Hydra design aspects. The example shown demonstrates processing when Hydra generates the seismic data outputs.
The state transition algorithm allows for a high level of modularity in processing. Any seismic processing algorithm, regardless of software language or implementation, can be inserted into the processing architecture simply by modifying the state transition rules. If the algorithm cannot directly interface with the database in Data Storage using the APIs, it is relatively simple to implement a “wrapper” program to perform any required interface functionality.
For example, the NEIC location algorithm is written in Fortran, a language that does not support interfacing with the Data Storage database. In this case, a Hydra API compatible “wrapper” program was developed to communicate with the database and produce a well-defined input file based on the Passport and event information. The location program is then run using the input file. Once the location program has completed, the resulting output file(s) are read by the “wrapper” program and then inserted into the database.
In addition to modularity, the Hydra Seismic Processing system supports both parallel and sequential processing. This support is accomplished using two methods: (1) parallel state processing and (2) event processing segmentation.

15
Parallel state processing is accomplished by encapsulating the state transition model in the Event Processor application. In theory, Hydra can perform as many tasks in parallel as there are instances of the Event Processor running. In practice, the level of parallelization is limited by the availability of system resources and the prioritization of real-time and manual processing requests over contributed and automatic processing requests. As of 2016, the NEIC runs a total of 60 Event Processors, 20 of which are reserved for real-time and manual processing. An Event Processor will start a task only if there are sufficient system resources available. Additional Event Processors can be added to the system if needed as local system resources permit (for example, if additional servers or virtual machines are available).
Although parallel state processing allows multiple events to be processing at the same time, event processing segmentation permits the system to process different aspects of a seismic event concurrently, such as generating station magnitude estimates and calculating moment tensor solutions. This processing segmentation is accomplished by organizing the state transition rules for a seismic event into groups of tasks called segments. This grouping is done by functionality. An example of a segment is shown in figure 11.
Figure 11. Diagram depicting an example of a sequential processing segment. The example shown is the Location Segment with the various location and association tasks demonstrated. (Assoc, association; Loc, location)
Depending on the desired functionality of the segment, the tasks within the segment can be sequential or parallel. For instance, when a location is desired, the Location Segment, as shown in figure 11, is organized so that the steps for generating a new location and updating associations follow sequentially. Conversely, when computing simple magnitudes, such as body-wave magnitude (mb) and local magnitude (ML), the magnitude algorithms in the segment are independent, so the tasks are organized in parallel, as shown in figure 12.

16
Figure 12. Diagram depicting an example of a parallel processing segment. The example depicted is for the Simple Magnitudes Segment, showing the local (ML), surface body-wave at regional distances (mbLG), P-wave moment (Mwp), body-wave (mb), broadband body-wave (mbBB), and coda-duration magnitude (Md) calculation tasks.
Much like states, segments have their own transition rules that control the order of segment execution. These segment transitions are shown in figure 13.

17
Figure 13. Diagram showing the processing segment transitions. Shown are the transitions for the Locate, Locate Miscellaneous (Locate Misc.), Simple Magnitudes, Complex Magnitudes, Validation, Optional Calculations (Optional Calc.), Verification, Deletion, Replication and Outputs, Forced Outputs, and Forced Replication Segments.
Specific segments may be processed several times during the course of a complete processing cycle because of the segment transition rules. Users of the processing system have the flexibility to choose whether to perform a complete cycle, a specific segment, or a specific task within a segment. Event Processors automatically schedule any expected follow-on processing according to the transition rules.
At the completion of each processing cycle, the event is packaged as a snapshot in a schema-independent file and is archived in Data Storage as a complete snapshot of the condition of the event at that time. A copy of this same snapshot is routed to Data Output to support system redundancy.
The state and segment transition algorithms enable Hydra to process multiple events simultaneously. The number of events that can be processed simultaneously depends on the available system resources, available Event Processor instances, and event prioritization.
In Hydra Seismic Processing, multiple segments are allowed to concurrently process for a single event. The ability to process multiple segments at the same time further supports parallel processing within Hydra. For example, an event could be processing the Simple Magnitude and the Complex Magnitude Segments concurrently. Because all tasks in these segments are organized to run in parallel,

18
the total processing time to compute the magnitudes for this event is the duration of the slowest magnitude-processing task, not the time it takes for all the tasks to complete.
Finally, Hydra Seismic Processing is automatic. At the completion of each processing cycle, the event is automatically scheduled for reprocessing after an amount of time that varies based on the age of the event. This enables events to pick up any relevant unassociated data that may have been contributed since the last time the event was processed. This automatic rescheduling process, in combination with automatic reprocessing when new data are contributed, ensures that all seismic events in Hydra have been updated to reflect the latest available data. The only period during which an event will not automatically reprocess is when a user is analyzing the event.
Seismic Processing History Hydra maintains a record in the Hydra database of each of the state transitions. This record
includes the task processed, when the task was scheduled, when it started, when it finished, and the system resources that were available during processing. This information is used to troubleshoot module problems and to characterize system load, responsiveness, and available resources.
Seismic Processing Algorithms As stated above, the state transition algorithm enables Hydra to efficiently perform seismic
processing on aspects of an event, including the location, pick reassociation, magnitude calculation, moment tensor calculation, and depth calculation. Hydra computes an event’s hypocentral location using an earthquake location program known as the Locator. Originally written for the NEIC in the 1960s (Engdahl and Gunst, 1966), the algorithm has been revised and continuously improved by multiple NEIC researchers and scientists.
The Locator uses, among other algorithms, an advanced one-dimensional (1-D) travel-time model (Buland and Chapman, 1983) with three-dimensional ellipticity and bounce point corrections (Kennett and Gudmundsson, 1996). To generate fast, accurate, and robust hypocentral locations for events, the Locator uses (1) robust phase reidentification and weighting, which was developed as part of the Engdahl, Hilst, and Buland algorithm catalog effort (Engdahl and others, 1998); (2) Bayesian depth control; (3) singular value decomposition and correlation analysis (Bondar and McLaughlin, 2009); and (4) region-specific earth models. The Locator also supports the use of the Regional Seismic Travel Time (RSTT) two-and-a-half-dimensional model, in lieu of the standard one-dimensional model, for more precise regional earthquake locations (Meyers and others, 2010).
After detecting an event, Hydra performs event phase association/reassociation/disassociation using a figure-of-merit model that predicts the likelihood that a pick at a station represents the arrival of a particular phase type for a particular event. The likelihood is calculated based upon station quality, event magnitude, event depth, picker type, and empirical statistics on phase observability by distance. Hydra supports not only association with an event, but also reassociation from one event to another.
Hydra estimates the magnitude of an event using various algorithms, including peak amplitude and amplitude duration. Peak-amplitude calculations include mb, broadband body wave, surface body wave at regional distances, surface wave, broadband surface wave, ML, and P-wave moment. Amplitude-duration calculations include the coda duration method. Both algorithms use seismic waveform data to compute ground-motion amplitudes automatically. These amplitudes, and any other relevant data, are stored in the database to increase the speed of future calculations.
Hydra does not use manually produced or adjusted-amplitude data in magnitude calculations. Manual control of magnitude calculations is limited to basic configuration (for example, setting a period

19
or distance window) or including/excluding automatically computed amplitude data. These manual interactions are stored in the event’s Passport.
Hydra also estimates the magnitude and moment tensor of the event using methods that examine different parts of the wave train, including regional body waves, teleseismic body waves, surface waves, and long-period phase waves (W Phase). For these calculations, Hydra automatically matches filtered seismic waveform data with computed synthetic waveforms. These filtered and decimated waveforms for specified window durations are stored in the database.
Hydra implements the formula for magnitudes that was developed by the Working Group on Magnitudes of the International Association of Seismology and Physics of the Earth’s Interior (IASPEI) Commission on Seismological Observation and Interpretation. A description of the formula for magnitudes is available online at http://www.iaspei.org/commissions/CSOI/Summary_of_WG_recommendations.pdf. Using a broadband depth method, Hydra estimates the depth of events by correlating filtered seismic waveform data with computed synthetic waveforms over a higher-frequency range than those used for moment tensor estimation.
Seismic Processing Dependencies Hydra accesses the Edge CWB (https://github.com/usgs/edgecwb/wiki/CWBQuery) to retrieve
seismic waveform data for use in seismic processing. Hydra uses a modified version of the Earthworm Wave Server protocol for requesting seismic waveform data. Hydra also depends on the ANSS GeoServe Web service (http://earthquake.usgs.gov/ws/geoserve/) for regional geographic information such as place names, authoritative regions, and response regions. As mentioned previously, Hydra depends on the Edge-hosted Station Metadata Server as the source of station location and response information.
Seismic Analysis Interfaces Similar to Seismic Processing, Hydra takes a modular approach to seismic analysis GUIs. Each
aspect of an event is presented in a specialized and independent graphical, interactive display. This architecture, which is depicted in figure 14, supports interfaces written in any programming language, as long as the programming language supports connections with the database in Data Storage. In addition to providing support for embedded Web interfaces, this architecture enables the 24/7 NEIC operations staff to quickly respond to and process any earthquake detected by, or contributed to, Hydra.

20
Figure 14. Diagram showing the Seismic Analysis user interface design, including the Hydra, Review, Summary, Create, Location, Waveform, Merge, Travel Time, Magnitude, History and Publication Displays. The empty box indicates the potential to add any number of other displays as needed. The figure also shows how Seismic Analysis interacts with Data Storage.
The Hydra analysis GUIs are designed to update automatically to reflect the current state of the event being analyzed. Each interface is connected to a notification service that broadcasts the current state of event processing. This allows the interfaces to know when they should reload the latest information for the event being shown. The interfaces are designed so that automatic reloads are seamless and transparent to the user. This mechanism also supports the interface’s ability to notify users when a new event has occurred. Use of the Hydra analysis interfaces initiates from two entry points: (1) the Hydra display for all earthquake response work and (2) the Review display for use by senior staff in the catalog production process.
During earthquake response, the user is notified of a newly detected or contributed earthquake by the continuously running Hydra display. The Hydra display provides a single line describing each event in Hydra, and plots the event location on a map. The user accesses the event by opening the Summary display. This display serves two purposes. First, the display gives a detailed summary of the event’s seismic parameters. Second, the display acts as a “switchboard” to enable users to examine aspects of the event in more detail. The more detailed displays include interfaces for (1) repicking the event; (2) refining the earthquake location and magnitude; (3) reviewing the history of the event in Hydra; and (4) using PDL to publish the event for data consumers such as ShakeMap (http://earthquake.usgs.gov/research/shakemap/), Prompt Assessment of Global Earthquake Response

21
(PAGER) (http://earthquake.usgs.gov/research/pager/), the EHP Web site (http://earthquake.usgs.gov/), ANSS ComCat (http://earthquake.usgs.gov/earthquakes/search/), and various national and international seismic research and analysis collaborating organizations.
Event publication is done using a snapshot for an event, rather than the latest data. This gives the user confidence that what is displayed in the publication interface is exactly what is being sent out, and prevents some late-arriving piece of seismic data from unnecessarily delaying publication. The publication interface also enables the user to update individual aspects of the event, such as the moment tensor.
Hydra supports a robust workflow for catalog production, as shown in figure 15. Throughout this workflow, events move through various checkpoints, from automatic, to working or rejected, then submitted, needs revision (if needed), corrected, accepted, and finally verified. Once verified, events are resubmitted to the ANSS ComCat. The key to this workflow is the Review interface, where senior analysts mark events for revision, accept corrections, and perform the final verification. To ensure stability throughout the catalog production process, the Review interface uses event snapshots rather than the latest data available for an event. This allows the reviewers to see exactly what the analysts submitted, the analysts to see what revisions are needed, and so on. However, to capture event corrections, a new snapshot including those corrections must be generated to ensure that any late arriving data will be included.
Figure 15. Diagram showing the Hydra catalog production workflow, which demonstrates the transitions between the earthquake detection, earthquake response, catalog production, catalog review, catalog correction, catalog verification, and data deletion steps. The diagram also shows the staff or process responsible during each step, and the rough timeframe for each step.
Data Output The Data Output component of the Hydra design, as shown in figure 16, exists to route various
files produced in Seismic Processing to their eventual destinations. Data Output consists of two sets of files: seismic data outputs and replication snapshots.

22
Figure 16. Diagram depicting the Data Output design of Hydra, showing the types, methods, and destinations of Hydra outputs. The interactions with the Seismic Processing and System Redundancy designs of Hydra are also shown. (ComCat, Comprehensive Catalog; FTP, file transfer protocol; PDL, Product Distribution Layer; Unassoc., unassociated)
Hydra generates most parametric data outputs in QuakeML format during Seismic Processing, shown previously in figure 10. Once these files are generated, they are routed to a pair of redundant output servers. These output servers use the PDL client to send the QuakeML files as origin, phase-data, impact, or moment tensor products to all interested data consumers. These products are routed to ComCat for a Catalog PDL Client or to PDL for a Response PDL Client. In addition to the QuakeML files, the Catalog Aggregator component of Data Output supports generating PDE-aggregated IASPEI Seismic Format (ISF) 2.0 (http://www.isc.ac.uk/standards/isf/) formatted files for the USGS file transfer protocol (FTP) site (http://earthquake.usgs.gov/data/pde.php). Data Output also routes replication snapshots, which are generated in Seismic Processing, to one or more other Hydra systems to support quality assurance (QA) and system redundancy needs.
System Redundancy A critical aspect of Hydra design is System Redundancy. Hydra is a mission critical system that
is expected to be operational 24/7. To achieve this, Hydra supports redundancy throughout its design, as depicted in figure 17. Hydra runs multiple instances of the Event Detection component, integrating the

23
multiple detection results into single events during Data Insertion. Similarly, Hydra supports running as many Event Processors as computing resources allow in Seismic Processing. This not only improves the overall system throughput, but also enables the system to survive the loss of event processing machines. Hydra also supports redundant outputs, where the Data Output layer can run multiple output machines to ensure delivery of QuakeML-formatted earthquake data products to PDL.
Figure 17. Diagram showing the Hydra System Redundancy design, including redundant event detection, duplicate inputs to active and backup Hydras, replication, analyst interfaces, redundant data distribution, and QuakeML output to the Product Distribution Layer (PDL).
In addition to the above-mentioned aspects of the Hydra system design, Hydra also supports copying the seismic event data, using schema-independent snapshots, for input to other Hydra systems to support whole-system redundancy. This process is called replication. Because of the nature of event processing, an updated snapshot is always replicated at the end of each processing cycle. This snapshot replication, in combination with the backup system receiving the same input data as the primary or active Hydra system, ensures that any backup Hydra systems will have the latest information, including

24
any analyst work, for each seismic event. In the case of a whole-system failure, users can simply switch to the backup system and continue their analysis work where they left off. In practice, the NEIC runs one active Hydra with a paired backup locally at the USGS Geologic Hazards Science Center in Golden, Colorado, and then runs another contingency backup Hydra system at a physically different location. This same replication mechanism can be used to maintain copies of the Hydra event dataset for disaster recovery and QA purposes.
Hardware The Hydra system is designed to run on multiple Windows Server 2012 computer servers. Using
the principle of functional separation, the Hydra software is separated into the following server roles that correspond to the design areas detailed in figure 1:
• Real-time processing servers for Event Detection, • Contributed and real-time insertion servers for Data Insertion, • The database server for Data Storage, • Event Processor servers for Seismic Processing, • Replication and output servers for Data Output, and • A secondary or backup set of Hydra servers for System Redundancy.
The requirement to have a backup Hydra system available at all times means that the total number of logical servers required is 16, as shown in figure 18. Note that if the redundancy and functional separation requirements are removed, Hydra can be, and has been, configured to run on as few as three virtual machines or physical servers. The system also requires various Windows 7 user desktops that host the analysis graphical interfaces for seismic analysis.

25
Figure 18. Diagram showing the logical computer systems that host Hydra at the National Earthquake Information Center, as well as the data flows between them. Each box is a logical (physical or virtual) computer system. (Proc., processing server; Repl., replication server; RT, real time)
System Monitoring As a mission critical system, Hydra is monitored for hardware, software component, and overall
system application problems. This monitoring includes assessing the physical host and virtual machine status and available and consumed resources, scanning system and Hydra log files for warning and error states, and querying the database for data integrity and completeness. The NEIC uses the monitoring system Icinga (https://www.icinga.org/) as its monitoring solution for Hydra. In addition, the analyst interfaces provide visual cues when the connection to Hydra is lost.
Specialized Use Cases In addition to the primary earthquake response and catalog production uses of Hydra, the NEIC
has utilized Hydra for more specialized uses including supporting seismic research and meeting other NEIC requirements. Two of these use cases are portable array processing and quality assurance.
Portable Array Processing Use Case A specific configuration of Hydra, called Portable Array (PA) Hydra, shown in figure 19, is used
to process data from aftershock deployment studies. Once waveform data from all available seismic

26
networks and portable deployments have been acquired and assembled into the Portable Array CWB (PWB) waveform archive, the data are played into the preconfigured PA Hydra system. Researchers then use all the Hydra interfaces to repick, relocate, and estimate the magnitudes of the aftershocks. Once the study is completed, PA Hydra can generate QuakeML products for all the studied earthquakes, which can be used in additional research and (or) submitted to the ANSS ComCat. This system was used extensively for the M5.8 Virginia aftershock sequence (McNamara and others, 2014) and induced seismicity studies in Oklahoma and Colorado (Barnhart and others, 2014), as well as studies of the aftershock sequences following recent notable earthquakes such as the 2010 Chile M8.8 earthquake (Hayes and others, 2013).
Figure 19. Diagram depicting the Portable Array Hydra use case using only five of the Hydra design areas (Event Detection, Data Insertion, Data Storage, Seismic Processing, and Seismic Analysis), as well as the data flows between them. (PWB, Portable Array Continuous Waveform Buffer)
Quality Assurance Use Case Hydra also supports the NEIC QA assurance and quarterly reporting process. The QA Hydra is
an installation of the Hydra software that consists of only the database and replication machines. This system archives the event snapshots used for replication. By storing only the event snapshots used for replication, the Hydra database can archive more than 3 years of seismic events, a much longer timeframe than that supported in the processing use case. The QA Hydra archive is used to generate NEIC quarterly reports, to evaluate system and staff performance, and to support development of NEIC policy.
Additional Development In 2016, work within the Hydra project continued on two efforts. The first task focuses on
improving Hydra’s magnitude estimations by operationalizing the W-Phase moment tensor algorithm

27
into a Hydra processing module. The second task focuses on improving Hydra’s regional and local capabilities by (1) developing a multiband picker, a next generation GLASS, and an automated explosion/mine activity detection capability; and (2) integrating improved quality metrics on picks and other contributed data using well-defined JavaScript Object Notation (JSON) formats to distribute the resulting information. Additional suggestions for further development of Hydra include improving its integration with other NEIC products such as ShakeMap, PAGER, and Did You Feel It?; migrating the desktop seismic analysis graphical interfaces to a Web-based architecture; and migrating Hydra’s server backend from Windows Server 2012 to Scientific Linux.
Summary The Hydra system is the 24/7 seismic monitoring and analysis system used for global earthquake
response and catalog production at the U.S. Geological Survey National Earthquake Information Center (NEIC). Hydra supports the NEIC’s worldwide earthquake monitoring mission in areas such as seismic event detection, seismic data insertion and storage, seismic processing and analysis, and seismic data output.
Hydra picks seismic phase arrival times from waveforms in real time, and detects the occurrence of earthquakes at teleseismic and (or) regional distances in near-real time. Hydra integrates parametric and waveform seismic data from multiple sources, including near-real-time and late-arriving data, into discrete events and stores these events in a database for analysis. Hydra computes seismic event hypocentral locations, as well as multiple magnitude, moment tensor, and depth estimates. Hydra includes a suite of modular and robust seismic analysis graphical user interfaces used by the NEIC’s 24/7 analyst staff. In addition to the primary monitoring use case, Hydra supports PA processing and QA use cases. Hydra is designed with a high level of system redundancy that ensures minimum mission interruptions resulting from system errors, hardware faults, and (or) routine maintenance. Expanding its seismic analysis and monitoring capabilities will enable the Hydra system to continue to support the NEIC mission.
References Barnhart, W.D., Benz, H.M., Hayes, G.P., Rubinstein, J.L., Bergman, Eric, 2014, Seismological and
geodetic constraints on the 2011 Mw 5.3 Trinidad, Colorado earthquake and induced deformation in the Raton Basin: Journal of Geophysical Research: Solid Earth, v. 119, p. 7923–7933.
Bondar, Istvan, and McLauglin, Keith, 2009, Seismic location bias and uncertainty in the presence of correlated and non-Gaussian travel-time errors: Bulletin of the Seismological Society of America, v. 99, p. 172–193.
Buland, Ray, and Chapman, C.H., 1983, The computation of seismic travel times: Bulletin of the Seismological Society of America, v. 73, p. 1271–1302.
Engdahl, E.R., and Gunst, R.H., 1966, Use of a high speed computer for the preliminary determination of earthquake hypocenters: Bulletin of the Seismological Society of America, v. 56, p. 325–336.
Engdahl, E.R., van der Hilst, R.D., and Buland Ray, 1998, Global teleseismic earthquake relocation with improved travel times and procedures for depth determination: Bulletin of the Seismological Society of America, v. 88, p. 722–743.
Guy, Michelle, Patton, John, Fee, J.M., Hearne, Mike, Martinez, E.M., Ketchum, D., Worden, C.B., Quitoriano, Vince, Hunter, E.J., Smoczyk, G.M., and Schwarz, Stan, 2015, National Earthquake Information Center systems overview and integration: U.S. Geological Survey Open-File Report 2015–1120, 25 p., accessed June 01, 2016, at http://dx.doi.org/10.3133/ofr20151120.

28
Hayes, G.P., Bergman, Eric, Johnson, K.L., Benz, H.M., Brown, Lucy, and Meltzer, A.S., 2013, Seismotectonic framework of the 2010 February 27 Mw 8.8 Maule, Chile earthquake sequence: Geophysical Journal International, v. 195, p. 1034–1051.
Kennett, B.L.N., and Gudmundsson O., 1996, Ellipticity corrections for seismic phases: Geophysical Journal International, v. 127, p. 40–48.
Lee, W.H.K., and Stewart, S.W., 1981, Advances in Geophysics, Supplement 2—Principles and applications of microearthquake networks: New York, Academic Press, 293 p.
McNamara, D.E., Benz, H.M., Herrmann, R.B., Bergman, E.A., Earle, Paul, Meltzer, Anne, Withers, Mitch, and Chapman, Martin, 2014, The Mw 5.8 Mineral, Virginia, earthquake of August 2011 and aftershock sequence—Constraints on earthquake source parameters and fault geometry: Bulletin of the Seismological Society of America, v. 104, p. 40–54.
Meyers, S.C., Begnand, M.L., Ballard, Sanford, Pasyanos, M.E., Phillips, W.S., Ramirez, A.L., Antolik, M.S., Hutchenson, K.D., Dwyer, J.J., Rowe, C.A., and Wagner, G.S., 2010, A crust and upper-mantle model of Eurasia and North Africa for Pn travel-time calculation: Bulletin of the Seismological Society of America, v. 100, p. 640–656.
Patton, J.M., Ketchum, D.C., and Guy, M.R., 2015, An overview of the National Earthquake Information Center acquisition software system, Edge/Continuous Waveform Buffer: U.S. Geological Survey Open-File Report 2015–1174, 10 p., accessed June 01, 2016, at http://dx.doi.org/10.3133/ofr20151174.
Schorlemmer, Danijel; Wyss, Adrian; Maraini, Silvio; Wiemer, Stefan; and Baer, Manfred, 2004, QuakeML—An XML schema for seismology: Observatories and Research Facilities for European Seismology (ORFEUS) Newsletter, v. 6, no. 2, p. 9.
ISSN 2331-1258 (online) http://dx.doi.org/10.3133/ofr20161128