hybrid wireless hull monitoring system for naval combat ...jerlynch/papers/seafighter.pdf ·...
TRANSCRIPT

Hybrid wireless hull monitoring system for naval combat vessels
R. Andrew Swartza, Andrew T. Zimmermanb, Jerome P. Lynchb,c*, Jesus Rosariod, Thomas Bradyd,Liming Salvinod and Kincho H. Lawe
aDepartment of Civil and Environmental Engineering, Michigan Technological University, Houghton, MI, USA; bDepartment ofCivil and Environmental Engineering, University of Michigan, 2350 Hayward Avenue, 2380 G.G. Brown Building, Ann Arbor, MI,USA; cDepartment of Electrical Engineering and Computer Science, University of Michigan, Ann Arbor, MI, USA; dNaval SurfaceWarfare Center, Carderock Division, West Bethesda, MD, USA; eDepartment of Civil and Environmental Engineering, Stanford
University, Stanford, CA, USA
(Received 14 October 2009; final version received 17 May 2010; accepted 19 May 2010; published online 15 July 2010)
There is increasing interest by the naval engineering community in permanent monitoring systems that can monitorthe structural behaviour of ships during their operation at sea. This study seeks to reduce the cost and installationcomplexity of hull monitoring systems by introducing wireless sensors into their architectural designs. Wirelesssensor networks also provide other advantages over their cable-based counterparts such as adaptability,redundancy, and weight savings. While wireless sensors can enhance functionality and reduce cost, the com-partmentalised layout of most ships requires some wired networking to communicate data globally throughout theship. In this study, 20 wireless sensing nodes are connected to a ship-wide fibre-optic data network to serve as ahybrid wireless hull monitoring system on a high-speed littoral combat vessel (FSF-1 Sea Fighter). The wireless hullmonitoring system is used to collect acceleration and strain data during unattended operation during a one-monthperiod at sea. The key findings of this study include that wireless sensors can be effectively used for reliable andaccurate hull monitoring. Furthermore, the fact that they are low-cost can lead to higher sensor densities in a hullmonitoring system thereby allowing properties, such as hull mode shapes, to be accurately calculated.
Keywords: naval vessels; structural monitoring; hull monitoring; wireless sensor networks
1. Introduction
The US Navy is currently exploring novel ship designconcepts optimally suited for future littoral combatoperations. For example, the joint high-speed vessel(JHSV) and littoral combat ship (LCS) acquisitionprograms are focused on high-speed ships constructedfrom lightweight materials such as aluminium alloys(Hess 2007). In addition to the use of new materials,many of the vessels under investigation in theJHSV and LCS acquisition programs employ non-conventional hull forms including the use of multi-hullcatamarans. The combination of lightweight alumi-nium and multi-hull forms provide ships with the speedand manoeuvrability necessary for littoral combatoperations. However, high-performance aluminiumships also provide a number of operational challengesto the naval engineering community. First, the use ofaluminium in the construction of the hull will lead tohigher incidences of fatigue cracking (Donald 2007);in addition, once fatigue cracks initiate, their growth inaluminium will be significantly greater than those insteel hulls. Other challenges associated with aluminiummaterials are stress-corrosion cracking and material
sensitisation during high operational temperatures(Katsas et al. 2007). Second, multi-hull ship designscan lead to complex dynamic behaviour during high-speed operation in demanding sea conditions (Hess2007). Furthermore, the unique design of these shipsincreases the probability that crews will operate themnear, or even beyond, their safe operating envelops dueto the loss of ‘feel’ for the vessels’ response to seawayloads (Pran et al. 2002).
Historically, the hulls of US Navy ships areinspected by the crew and port engineers to ensurethe hull is in a state of good health. While thisapproach has proven effective in the past, the methoddoes suffer from some inherent drawbacks. First,visual inspection is labour-intensive. As the Navycontinues to reduce manning on future naval vessels(Lively et al. 2008), the manning requirements of visualhull inspections will grow increasingly difficult tosatisfy. Second, visual inspection can only observeobvious damage conditions. For example, hairlinecracks with small dimensions are difficult to identifyvisually, even when using dye penetrants (Zoughi andKharkovsky 2008). In the case of ships constructed of
*Corresponding author. Email: [email protected]
Structure and Infrastructure Engineering
Vol. 8, No. 7, July 2012, 621–638
ISSN 1573-2479 print/ISSN 1744-8980 online
This work was authored as part of the Contributors official duties as an Employee of the United States Government and is therefore a work of the United States
Government. In accordance with 17 U.S.C. 105, no copyright protection is available for such works under US law.
http://dx.doi.org/10.1080/15732479.2010.495398
http://www.tandfonline.com
Dow
nloa
ded
by [
Kor
ea A
dvan
ced
Inst
itute
of
Scie
nce
& T
echn
olog
y (K
AIS
T)]
at 1
7:31
14
Apr
il 20
12

aluminium, thick insulation is commonly installed toprotect the aluminium hull from heat and fire. Visualinspection would require removal and reinstallation ofthe insulation, which adds significant complexity andcost to the inspection process. The US Navy istherefore interested in the development of permanenthull monitoring systems that monitor the anticipatedperformance and health of high-performance alumi-nium vessels. This interest is in response to themaintenance issues (e.g. fatigue cracking) and inspec-tion difficulties associated with high-speed aluminiumships.
Hull monitoring systems in use in the commercialshipping industry typically consist of foil strain gauges,accelerometers and gyroscopes installed throughout avessel to measure the ship rigid-body motion and hulldeformations due to seaway loads. Crews providedwith real-time hull response data can pilot the ship in amanner that minimises overloading during extremeseaway conditions (Pran et al. 2002). Commercial hullmonitoring systems consisting of a handful of sensors,can cost on average $50,000 per system to purchaseand install (Slaughter et al. 1997). A large fraction ofthe system cost is associated with the installation ofcoaxial wiring used for the communication of sensordata to the hull monitoring system central processingunit. In addition to being expensive to install, cablesadd weight to the vessel, which is a critical issue forvessels designed to be lightweight, such as high-speedaluminium vessels. Furthermore, wires installed in acombat vessel are vulnerable to detriments such asheat, moisture, and toxic chemicals common in harshmilitary operational environments (MacGillivray andGoddard 1997). For multi-hulled aluminium ships, thecosts affiliated with the installation of a hull monitor-ing system grows higher because of the thick insulationlayers covering the aluminium hull for protection fromheat and fire (Sielski 2007).
Provided the challenges associated with wired hullmonitoring systems, wireless sensors can be exploredfor use within monitoring system architectures. Wire-less sensors have emerged in recent years as low-costalternatives to tethered sensors; their use is especiallyattractive for structures with large dimensions or withdifficult to access spaces (Lynch and Loh 2006). In thisstudy, a hull monitoring system is designed usingwireless sensors to measure the response of a high-speed aluminium vessel undergoing sea-keeping trials.Specifically, a two-tiered hull monitoring system isproposed in the study. At the lowest layer of the systemarchitecture, wireless sensors capable of sustainingreliable short-range communication within ship com-partments are installed to collect strain and accelera-tion measurements of the hull. Wireless sensornetworks are then connected to a shipboard fibre-optic
data network which serves as the hull monitoringsystem’s second tier. The fibre-optic layer of the systemarchitecture is necessary to establish communicationbetween spatially distributed clusters of wirelesssensors contained within different ship compartments.The fibre-optic network also facilitates the use of acentral server to control and operate the multiplewireless sensor clusters as a single, global hullmonitoring system.
The FSF-1 Sea Fighter (Figure 1), a high-speedlittoral combat vessel designed with a wave-piercingcatamaran aluminium hull, is used to demonstrate theefficacy of the hybrid wireless hull monitoring systemin a realistic marine environment. The strain andacceleration response of the ship is continuously andautonomously (i.e. without user intervention) collectedby the hull monitoring system during a one-monthtransit from Panama City, Florida, to Portland,Oregon. As part of the study, a comparison betweenhull response data recorded by the experimentalwireless hull monitoring system and those identicallyrecorded by the ship’s permanent tethered hullmonitoring system is made to assess the accuracy ofthe experimental wireless system. Finally, accelerationhull response data collected from the wireless monitor-ing system is used to perform a modal analysis of theship including identification of the ship’s global modalfrequencies and operational deflection shapes. First,the paper presents a detailed description of the SeaFighter and the wired hull monitoring system installedon-board prior to this study. Then, the hybrid wirelesshull monitoring system designed and installed for thisstudy is presented in detail. The third part of the paperpresents raw data collected by both hull monitoringsystems along with the modal characteristics of theship derived from the raw data presented. Finally,concluding remarks about the effectiveness of thehybrid wireless hull monitoring system in the ship-board environment are presented along with adescription of the lessons learned during the study.
2. FSF-1 Sea Fighter
The FSF-1 Sea Fighter (Figure 1) is a 79.9 metres long,multi-hull catamaran-style ship designed for high-speed littoral combat missions. The ship is designedby BMT Nigel Gee (Southampton, UK) and con-structed in 2003 by Nichols Brothers Boat Builders(Freeland, WA) (Bachman et al. 2007). To provide theship with speed, the hull is constructed from alumi-nium, thereby keeping the total weight of the shipdown. The Sea Fighter’s hull consists of 61 identicalaluminium frames evenly spaced (1.2 metres apart)along the length of the ship; six of these frames serve aswatertight bulkheads. The ship is designed with three
622 R.A. Swartz et al.
Dow
nloa
ded
by [
Kor
ea A
dvan
ced
Inst
itute
of
Scie
nce
& T
echn
olog
y (K
AIS
T)]
at 1
7:31
14
Apr
il 20
12

main levels: (1) the main deck, (2) the bridge, and (3)the machinery and tank spaces. Using both diesel andgas turbine propulsion systems, the Sea Fighter iscapable of operating at speeds up to 50 knots and inconditions up to sea state 5. Sea Fighter is alsoequipped with a sophisticated ride control system(active rear interceptors and forward T-foils) whichenhances the ship’s manoeuvrability at high speed(Bachman et al. 2007).
Designed as a multi-purpose sea-based combatplatform, the ship’s main deck is relatively open for thesecure housing of modular shipping containers thatcontain gear and equipment specific to a variety oflittoral combat missions. The main deck area forstoring these containers is referred to as the missionbay (Figure 2). The mission bay runs from the stern ofthe ship, 52 metres forward, and spans the entire widthof the vessel (22.0 metres). The inside of the missionbay is generally protected from the sea environment,but does have some small openings above the shipwaterline to the outside.
As Sea Fighter is an experimental vessel, the NavalSurface Warfare Center (NSWC) elected to install apermanent hull monitoring system during and after theship’s construction in 2003. The monitoring system,referred to as the scientific payload data acquisitionsystem (SPDAS) is designed by the TechnologyManagement Group, Inc. (TMG). In its design, themonitoring system is intended to capture data pertain-ing to the performance of Sea Fighter during sea-keeping trials. The SPDAS system has been inoperation, collecting data on ship behaviour duringoperation at sea since 2006. In this study, it will serveas a baseline to which the proposed hybrid wireless hullmonitoring system performance will be compared.
Figure 1. The FSF-1 Sea Fighter, a high-speed aluminiumship designed to support future littoral combat operations ofthe US Navy: (a) side view (courtesy US Navy), (b) back view(courtesy US Navy), view of the Sea Fighter in operation(courtesy US Navy).
Figure 2. FSF-1 Sea Fighter mission bay. While an openspace, the bay is occupied by large steel shipping containersas seen in this photograph.
Structure and Infrastructure Engineering 623
Dow
nloa
ded
by [
Kor
ea A
dvan
ced
Inst
itute
of
Scie
nce
& T
echn
olog
y (K
AIS
T)]
at 1
7:31
14
Apr
il 20
12

2.1. SPDAS
As an experimental vessel, the Sea Fighter is closelymonitored using an extensive hull monitoring systemcustom designed by TMG for the US Navy. TheSPDAS is a wired hull monitoring system featuring 10tri-axial accelerometers (Columbia 307-HPTX), over100 metal-foil strain gauges (Micro Measurements),and a wave height measurement system (TSK) installedon the ship bow (Bachman et al. 2007). Theaccelerometers are intended to measure the rigidbody dynamics of the ship while the strain gauges areused to measure the strain response of the hull. TheTSK wave height measurement system is installed onthe ship hull to measure wave height and period.
The accelerometer and strain gauges are installedthroughout the ship and are interfaced to local datacollection units known as data acquisition ‘bricks’. Thebricks locally filter and digitise (using internal analo-gue-to-digital converters) the sensor data before it iscommunicated on the ship’s high-speed fibre-opticnetwork. While accelerometers can be interfaceddirectly to the SPDAS bricks, an amplification bridgecircuit is necessary to take strain measurements usingmetal-foil strain gauges. For this purpose, each straingauge is connected to a Wheatstone bridge circuit (witha gain of 100) contained in an enclosure called a‘stamp’ module. To limit load resistance, each stampmodule is installed within one metre of the gauge thatit services. Then, shielded coaxial wiring is used tocommunicate the voltage output of the stamp moduleto a brick where data is digitised and communicated tothe server via the fibre-optic network. Measurementdata communicated by the hull monitoring system’s 28bricks are aggregated at a single data server connectedto the network in a lower deck of the ship. A LabViewvisualisation client running on a Windows 2000operating system is located on the ship bridge to querythe server for real-time data (e.g. peak hull strain, waveheight, etc.) to be presented to the crew. The system isdesigned to provide users with a rich set of responseparameters associated with hull monitoring. The sea-keeping parameters include 6-degrees of freedom shipmotion measurements, strain responses, wind andwave measurements, as well as ship controlparameters.
3. Experimental setup
In this section, the prototype hybrid wireless hullmonitoring system developed for the Sea Fighter isdescribed in detail. First, the Narada wireless sensorplatform is presented as a building block of the two-tiered hull monitoring system. Following that is adescription of the hybrid wireless/fibre-optic network
developed for the system’s upper tier to aggregate datafrom wireless sensors installed across the ship. Finally,unattended operation of the experimental system isdescribed in detail.
3.1. Narada wireless sensors
The Narada wireless sensor (Figure 3), developed atthe University of Michigan (Swartz et al. 2005), isdesigned for use in low-cost, high-density sensornetworks where the high cost of cable installationmakes traditional tethered sensor networks undesir-able. Furthermore, it is intended to be able to operateon battery power for a long period of time (e.g. for upto two years using a low duty cycle) in the absence of apower supply native to the monitored structure;therefore it is designed to be a very low-power device.Finally, to meet low-cost requirements, its design takesadvantage of commercial, off-the-shelf (COTS) tech-nology for all of its functional components.
The sensor node itself includes four modules (seeFigure 3(a)). The first module is the computationalcore which is defined by the microcontroller (AtmelAtmega128) and is responsible for operation of thedevice. The Atmega128 is a low-power, 8-bit micro-controller with 128 kB of flash memory, 4 kB of staticrandom access memory (SRAM), and 4 kB of elec-trically erasable programmable read-only memory(EEPROM). Embedded software, termed firmware, isstored within the microcontroller. The firmwareincludes two categories of software: first, an operatingsystem (OS) is embedded for the configuration andoperation of peripheral components on the sensor, aswell as for real-time allocation of processing power.Second, application software is installed consisting ofspecific engineering algorithms that are responsible forlocal data processing of interest to the end-user. Anadditional 128 kB of external SRAM has also beenadded to the computational core in order to enhancelocal data buffering and computational capabilitiescontained within each sensor node.
The second module is the sensing interface. Itconsists of a Texas-Instruments ADS8341 which is a4-channel, 16-bit analogue-to-digital converter (ADC)with an input range of 0–5 V. This interface allows thesensing system to measure data from up to fourtransducers per sensing node (channels numbered 0through 3) and gives considerable flexibility in the typeof transducer used. The resolution of the ADC isunique for a wireless sensing platform as it is unusuallyhigh (i.e. most commercial wireless sensors employ 10to 12-bit ADC interfaces). Narada is designed with ahigh resolution ADC to allow for low signal datacollection; low amplitude signals may be lost in thequantisation noise of the ADC if the ADC resolution
624 R.A. Swartz et al.
Dow
nloa
ded
by [
Kor
ea A
dvan
ced
Inst
itute
of
Scie
nce
& T
echn
olog
y (K
AIS
T)]
at 1
7:31
14
Apr
il 20
12

is not sufficiently high. The Narada printed circuitboard (PCB) has been carefully designed to preservethis resolution resulting in true 16-bit performancewhere the quantisation error is just one bit (1/65536thof the input analogue voltage range, which is 5 V). Thethird sensor module is the actuation module consistingof a Texas Instruments DAC7612; the DAC7612 is a2-channel, 12-bit digital-to-analogue converter (DAC)with an output range from 0 to 4.1 V. This actuationcapability will not be utilised in this study.
The final module in the Narada design is the com-munication interface. The wireless interface con-sists of a Texas Instruments CC2420, which is awireless transceiver that meets the IEEE 802.15.4
communications standard for dense, adaptive, andlow-power wireless networking (IEEE 2006). Thewireless transceiver is a spread-spectrum device thatoperates within the 2.4 GHz Federal CommunicationsCommission (FCC) defined unlicensed industrial,scientific, and medical (ISM) communications fre-quency band. It also operates below the FCCestablished power limit of 1.0 W which is defined forsuch devices. The transceiver is capable of maintainingan over-the-air communication rate of 250 kbps andcan communicate over a range of 50 metres using itsnative configuration. However, the range of thetransceiver can be extended to up to 500 metres usinga power amplified radio and directional antenna
Figure 3. Narada wireless sensing unit: (a) architectural schematic, (b) top-view of fully assembled prototype.
Structure and Infrastructure Engineering 625
Dow
nloa
ded
by [
Kor
ea A
dvan
ced
Inst
itute
of
Scie
nce
& T
echn
olog
y (K
AIS
T)]
at 1
7:31
14
Apr
il 20
12

system as has been previously developed for theNarada system.
The power draw of the Narada wireless sensor is200 mW, assuming all components are operatingsimultaneously. Power savings can be accomplishedby putting portions of the wireless sensor node (or theentire node) into sleep mode. The sensor is designed torun on 6 AA size nickel-metal hydride (NiMH)rechargeable batteries. Without being placed in sleepmode, the sensor would exhaust this power supply inapproximately two weeks, assuming continuous opera-tion. Because constant monitoring over a one monthperiod is desired for this study, power is provided tothe wireless sensors from the shipboard AC electricaldistribution grid; Table 1 summarises the specificationof the Narada wireless sensor.
3.2. Hybrid multi-tiered network
Due to their compartmentalised nature, naval vesselspresent some challenges to centralisation of measure-ment data from wireless sensors distributed through-out the ship. First, wireless sensors can be installed inhigh density because of their low costs and modularinstallations. However, available wireless bandwidthlimits the total amount of data that can be transmittedon a given frequency channel over a given time periodsince only one device can transmit at a time. This factwill effectively limit the channel count that cansimultaneously operate on the same wireless channel.In addition, communication reliability can be guaran-teed if nodes acknowledge reception of data; thispractice places greater demand on the limited wirelessbandwidth.
Uncertain conditions in the wireless communica-tion environment will also affect the reliability of thecommunication system (i.e. the consistency of atransmitted packet being successfully received). In theshipboard environment, three major sources of un-certainty that affect peer-to-peer communication per-formance, and by extension, network performance, areidentified. First, changes in the usage and configura-tion of shipboard compartments during the voyage
may adversely change the characteristics of thecommunication channel. In addition, transient radio-frequency (RF) noise (e.g. from high-powered equip-ment on the ship) may be present and corrupt datatransmissions requiring bandwidth-consuming resendprotocols to be enacted. The time synchronisationbetween units may also be an issue since the internalclock used by each sensor may slowly drift over time.The net effect of these uncertainties is a limit to thetotal data that can be communicated through thenetwork as additional time must be built into commu-nication protocols to allow the system to recover fromerrors that arise due to lost packets or synchronisationerrors.
In an example of the effects of these limitations, theNarada wireless sensor network configured to samplemeasurement data at 100 Hz can reliably transmit 12to 15 channels of real-time data continuously on asingle communication channel; the exact number ofchannels depends on the level of interference present inthe wireless channel since interference requires packetsto be occasionally retransmitted. To help alleviate theburden on a single communication channel, the IEEE802.15.4 standard defines 16 communication channelswithin the 2.4 GHz frequency band (spanning from2.405 to 2.485 GHz in increments of 0.005 GHz) thatcan be accessed simultaneously in the same spacewithout interference with each other (IEEE 2006),thereby increasing the amount of data that may bemoved through a network in a fixed space of time. Byuse of sub-networks (subnets) of wireless sensors ondifferent communication channels, the achievablesensor channel count in the total monitoring systemmay be dramatically increased.
The second shipboard challenge, transmission ofdata between compartments, is more problematic forwireless sensor networks. Decks and watertight bulk-heads made of conductive materials (e.g. steel oraluminium) that enclose ship compartments functionnaturally function as Faraday cages, reflecting vir-tually all incident electromagnetic waves (Harvey1963). To overcome this inherent challenge of theshipboard environment, existing fibre-optic Ethernetnetwork cables installed on Sea Fighter are utilised toform a wired upper tier of the hull monitoring systemarchitecture. The fibre-optic system offers a high-datarate connection between the wireless subnets (con-tained in separate compartments) in the lower tier, andthe data server remotely located below deck. On SeaFighter, the SPDAS system has access points to thefibre-optic Ethernet network at the fore and aft ends ofthe mission bay. Access to this network provideslinkage to other important areas of the ship includingthe SPDAS data server located below deck, the securecommunications room located behind a water-tight
Table 1. Performance specifications of the Narada wirelesssensor node.
Form Factor 6 cm 6 6 cm 6 2 cmEnergy Source 6 AA Ni-metal hydride
batteries (7.2 V)Power 40 mA @ 5V (max.)Range 50 m (nominal)Communication data rate 250 KbpsData acquisition sample rate 10 kHz (max.)Cost $175 per unit
626 R.A. Swartz et al.
Dow
nloa
ded
by [
Kor
ea A
dvan
ced
Inst
itute
of
Scie
nce
& T
echn
olog
y (K
AIS
T)]
at 1
7:31
14
Apr
il 20
12

bulkhead on the main deck, and the bridge. A diagramdepicting the multi-tier, hybrid monitoring system ispresented in Figure 4.
3.3. System installation
Installation of the wireless hull monitoring systemaboard the Sea Fighter takes place over four days atthe Naval Surface Warfare Center, Panama CityDivision, in Panama City, Florida. A network con-sisting of 20 Narada wireless sensors is installed alongwith sensing transducers (namely accelerometers andinterfaces to existing strain gauges) and receiverhardware that enables communication between thewireless sensors and a centralised data repository.These instruments are removed while the ship is in drydock at the Cascade General Shipyard in Portland,Oregon, after two months of combined sea-keepingtrials and port time.
The flexural response of the Sea Fighter ismeasured by the wireless hull monitoring system using
strain gauges. Strain measurements are taken frompre-existing metal-foil strain gauges (Micro Measure-ments) previously installed as part of the SPDAS sea-keeping system during construction of the vessel.Metal-foil strain gauges indicate changes in strainthrough a coupling of electrical resistance and mechan-ical strain (Window 1992). Changes in strain can bemeasured by changes in resistance but generallyrequire power and conditioning circuitry (e.g. Wheat-stone bridge and amplification) to convert the changein metal-foil resistance into a measurable analoguevoltage signal. These circuits are already included inthe SPDAS stamp enclosures that are installed with thestrain gauges. The outputs of the SPDAS stampenclosures located both below deck and in the super-structure above the mission bay are routed to brickslocated throughout the ship. At the SPDAS bricks,analogue signals are converted into the digital domain,using on-board analogue-to-digital converters, andsent via the shipboard local area network to the datarepository situated below deck. As a result, the output
Figure 4. Overview of the multi-tiered, hybrid wireless/wired network installed on Sea Fighter.
Structure and Infrastructure Engineering 627
Dow
nloa
ded
by [
Kor
ea A
dvan
ced
Inst
itute
of
Scie
nce
& T
echn
olog
y (K
AIS
T)]
at 1
7:31
14
Apr
il 20
12

of the wireless sensors used to record strain of the hullare installed close to the SPDAS hull monitoringsystem bricks where the voltage signal from the stamp
enclosures are collected. Eight strain gauge channelsfrom Brick 19 are spliced in order to feed them into thewireless sensor nodes; for this study the selected gaugesare physically located on Frame 20 (see Figures 5 and6). The voltage output levels of the SPDAS strainchannels are between 0 and 5 V which perfectly meetthe input requirements for the Narada sensing inter-face. Preliminary tests of the SPDAS strain/Naradainterface suggest some high-frequency noise contam-ination due to the splicing of the cable at the brick. Asa result, each strain gauge sensor channel is providedwith a low-pass, four-pole, Butterworth filter, eachhaving a cut-off frequency of 25 Hz, prior to theinterface with the Narada nodes. The filters areassembled on a solderless breadboard and installed inweatherproof enclosures with the wireless sensors(Figure 7a). Four Narada wireless sensor nodes areused to record the eight strain measurements; eachsensor node is configured to collect two channels ofstrain data.
Acceleration is recorded using micro-electro-mechanical systems (MEMS) accelerometers installedthroughout the mission bay (Figure 6). Vertical-onlyacceleration measurements are collected using Cross-bow CXL02LF1Z accelerometers. The CXL02LF1Zhas an input range of 0 to 2 g, a sensitivity of 1 V/g, aDC-offset of 2.5 V, an output range between 0 and5 V, and a noise floor of 1 mg (RMS). CrossbowCXL02TG3 ultra-low noise, tri-axial accelerometerarrays are also provided along the centreline ofthe ship. The performance characteristics of theCXL02TG3 include an input range of 2 g, a sensitivityof 0.833 V/g, a DC-offset of 2.5 V, an output range
Figure 5. Layout of metal-foil strain gauges on Frame 20measured by the proposed hybrid wireless hull monitoringsystem.
Figure 6. Layout of the wireless sensing network divided into three subnets in the Sea Fighter mission bay.
628 R.A. Swartz et al.
Dow
nloa
ded
by [
Kor
ea A
dvan
ced
Inst
itute
of
Scie
nce
& T
echn
olog
y (K
AIS
T)]
at 1
7:31
14
Apr
il 20
12

between 0.5 and 4.5 V, and a noise floor of 0.6 mg(RMS). For temporary installation of accelerometers,mechanical connections such as screws are best so thatthe transducer is not damaged during removal. Sincedrilling holes for screws in the deck is deemedunacceptable, accelerometers are instead screwed to1.2 cm thick aluminium mounting plates that aresecurely bonded to the deck by epoxy (Figure 7b).Protection of the accelerometers from crew activity isprovided by rubber traffic cones placed over the top ofthe accelerometers and epoxied in place (Figure 7c).The layout of the accelerometers in a regular gridpattern is intended to generate response data for modalanalysis of the ship.
A laptop computer that co-ordinates sea-keepingdata collection runs and archives wireless sensor data isinstalled below deck in close proximity to the SPDASdata server. This laptop controls the wireless sensorsubnets through a pair of bridge devices (Figure 4). Acommercial wireless transceiver development kit(Texas Instruments CC2420DBK) is commonly usedby a central data server to wirelessly communicate withthe wireless sensor nodes. The development kit has aCC2420 transceiver (just like the Narada nodes)supported by an Atmel Atmega128 microcontrollerfor wireless communications. The microcontroller isconnected to a serial (RS-232) port and is configuredsimply to pass data from the serial port to the radio.Similarly, data packets received from the wireless radioare read, reformatted, and sent out the serial port.Unfortunately, in the proposed hull monitoringsystem, the laptop is not collocated with the wirelesssensor nodes. This requires use of the ship fibre-opticnetwork to communicate data between the laptop andthe wireless transceiver development kit. To connect
the transceiver to the Ethernet network, a commercialserial-to-Ethernet converter box (Moxa Nport DE-311) is used as a bridge. This connector is a verypowerful device because its internal firmware allows itto appear to the laptop as a local serial port eventhough it is remotely located on the Ethernet network.Hence, the Nport device driver handles all of thenetworking details when establishing communicationbetween the laptop and the transceiver. As shown inFigure 4, a total of three Nport converters are used toconnect these wireless transceiver development kits tothe network; each Nport/transceiver pair is packagedin a weatherproof container and installed in themission bay.
The layout of the transducers, sensing nodes andreceivers within the mission bay is depicted in Figure 6.Twenty Narada wireless sensing units, collecting theeight channels of strain data and 20 channels ofacceleration data, are organised into three subnetsoperating on three different IEEE 802.15.4 commu-nications channels (channels 11, 24, and 26). Dividingthe wireless sensors into three subnets represents anefficient use of the wireless bandwidth which is criticalfor allowing continuous data streaming from thewireless sensor nodes during operation of the hullmonitoring system. These sensing units are allocatedinto the three subnets based on their location withinthe mission bay, as well as their functionality (e.g.strain versus acceleration data collection). Subnets 1and 2 include Narada sensing nodes measuringacceleration and have their receivers located forwardin the mission bay. Subnet 1 contains two Naradasensing units collecting tri-axial acceleration near thecentre of gravity of the ship. In addition, subnet 1contains four Narada nodes, each collecting uni-axial
Figure 7. Details of the wireless sensor installation on Sea Fighter: (a) Four-pole Butterworth filter with Narada nodes forstrain gauge de-noising, (b) accelerometer bonded to mission bay deck by epoxy, (c) wireless sensor within an enclosure withdirectional antenna installed in the mission bay.
Structure and Infrastructure Engineering 629
Dow
nloa
ded
by [
Kor
ea A
dvan
ced
Inst
itute
of
Scie
nce
& T
echn
olog
y (K
AIS
T)]
at 1
7:31
14
Apr
il 20
12

vertical acceleration. Subnet 2 contains 10 Naradasensing units collecting vertical acceleration from theforward part of the mission bay. As previouslymentioned, subnet 3 consists of four Narada nodesrecording two strain channels each. Because theircommunication distance is greater, directional patchantennas are used on sensor nodes in subnet 1 whileomni-direction quarter-wave dipole antennas aresufficient for subnets 2 and 3. Subnet 3 is located aftof subnet 1 near SPDAS brick 19 with the receiver andNport converter located nearby (see Figure 6).
3.4. Data collection
The proposed hybrid wireless hull monitoring systemis set to continuously collect hull response data andoperate in an autonomous mode, without humanintervention. The Narada nodes are all set to collectdata at a rate of 100 Hz. To begin data collection, astart beacon is initiated by the laptop serving asnetwork coordinator and is broadcast from thewireless transceiver boards servicing each sensorsubnet. Network synchronisation is handled throughthis beacon. Before the start command is transmitted,the Narada units are put in a wait state where theirembedded microprocessors cycle through four assem-bly instructions waiting for the server command.Limiting the actions of the embedded OS in this waylimits the discrepancy between processing times thatmay occur within the sensing nodes upon receipt ofthe beacon. This practice effectively limits thesynchronisation error between nodes. The upperbound on synchronisation error in this system isdefined by the sum of the difference in wirelesspropagation times from receiver to sensor (wirelesssignal path length divided by the speed of light) andthe differential processing times for the beacon packetwithin the sensor. Differential processing times mayarise from stochastic delays in the wireless transceiveror within the microcontroller (Maroti et al. 2004).Observations made on the differential processingtimes (absolute value) between units (measured usinga digital oscilloscope in the laboratory) yield adistribution with an average synchronisation errorof 10 ms and peak observed value of 30 ms. Assuming1000 metres in differential path length (the high endof the system’s communication range), the upperbound on the synchronisation error from the bea-coned network is less than 35 ms. This error level isnegligible when considering sampling in the low kHzrange, or less.
Once the system is time synchronised, data is thenbuffered within the wireless sensor nodes until 30,000samples are collected. After 300 seconds, the networkco-ordinator queries the sensing units, one at a time,
and requests the data in packets of 50 data points each.Received packets are then archived in the data server.Because the timing within each Narada wireless node isnot exact (each sensor relies on a crystal oscillator tokeep time which are subject to drift thereby addingadditional synchronisation error as data collectionprogresses) the system is configured to stop collectingdata every 30 minutes so that the monitoring systemcan briefly re-synchronise before it re-initiates its datacollection activities. Oscillators on the Narada wirelesssensing nodes operate at 8.0 MHz and are rated tohave stability of 2.0 parts per million (ppm) or better.This level of stability yields a worst-case clock driftof 9 ms during the 30 minute inter-synchronisationperiods.
4. Results
Results of this study are presented in this section inthree parts. First, data collected by the experimentalwireless hull monitoring system is compared with datacollected using the SPDAS wired hull monitoringsystem. Second, wireless reliability of data transmittedin the experimental system is discussed. Finally, resultsderived from modal analysis of the Sea Fighter arepresented.
4.1. Comparison of wireless hull monitoring system toSPDAS system
Wirelessly collected data compares well to identicaldata collected by the SPDAS system. On the strainchannels where the Narada system and the SPDASrecord the same signal, the signals recorded andarchived are nearly identical. Figures 8 and 9 showstrain comparisons between the Narada derived straintime histories and those recorded by the SPDASsystem of strain gauges 2 and 3 (as numbered inFigure 5), respectively, measuring hog/sag bending ofthe twin-hull structure. A slamming event (i.e. waveimpact on the ship bow) is evident in Figure 9. Inaddition, some minor spikes are evident in the Naradasignal in Figure 9 due to imperfect connections in thebreadboard filter readings from the strain gaugechannel. Vibrations and shock loadings generated atsea will affect the quality of these connections andcorresponding noise levels. Even at the higher levelsthough, noise levels are within acceptable limits. Of theeight strain channels recorded by Narada, one of thestrain gauges (or its associated power circuit) failedbefore the ship disembarked for its sea trials resultingin zero voltage levels recorded by both the SPDAS andthe Narada systems for that channel (strain gauge 6).Also, one Butterworth low-pass filter failed duringinstallation (strain gauge 7). Hence, during the sea
630 R.A. Swartz et al.
Dow
nloa
ded
by [
Kor
ea A
dvan
ced
Inst
itute
of
Scie
nce
& T
echn
olog
y (K
AIS
T)]
at 1
7:31
14
Apr
il 20
12

keeping trials, the wireless hull monitoring system hassix channels of high-quality strain measurements(strain gauges 1 to 5 and 8 in Figure 5). In general,the error between the wireless and wired strainreadings is roughly less than 0.03 me, as shown inFigure 8.
The Narada sensing nodes recording hull accel-eration do not share a channel directly with the
SPDAS hull monitoring system. However, eachsystem does have a tri-axial accelerometer located atthe ship centre-of-gravity (COG). The wireless arrayis located on the top surface of the mission bay deckwhile the SPDAS tri-axial array is mounted directlybeneath, on the underside of the deck; comparisonof the acceleration signals measured by these twoaccelerometers shows excellent agreement (Figures 10
Figure 9. Strain comparison between strain measured at strain gauge 3 (in Figure 5) by the SPDAS (top) and wireless (bottom)hull monitoring systems. A slamming event is evident at 307 seconds in a transient vibration response.
Figure 8. Time history response of the ship hull (top) during rough seas (sea state 3) as measured by the Narada and SPDASbased hull monitoring systems (corresponding to strain gauge 2 in Figure 5). The difference in the two measured time-histories isshown below.
Structure and Infrastructure Engineering 631
Dow
nloa
ded
by [
Kor
ea A
dvan
ced
Inst
itute
of
Scie
nce
& T
echn
olog
y (K
AIS
T)]
at 1
7:31
14
Apr
il 20
12
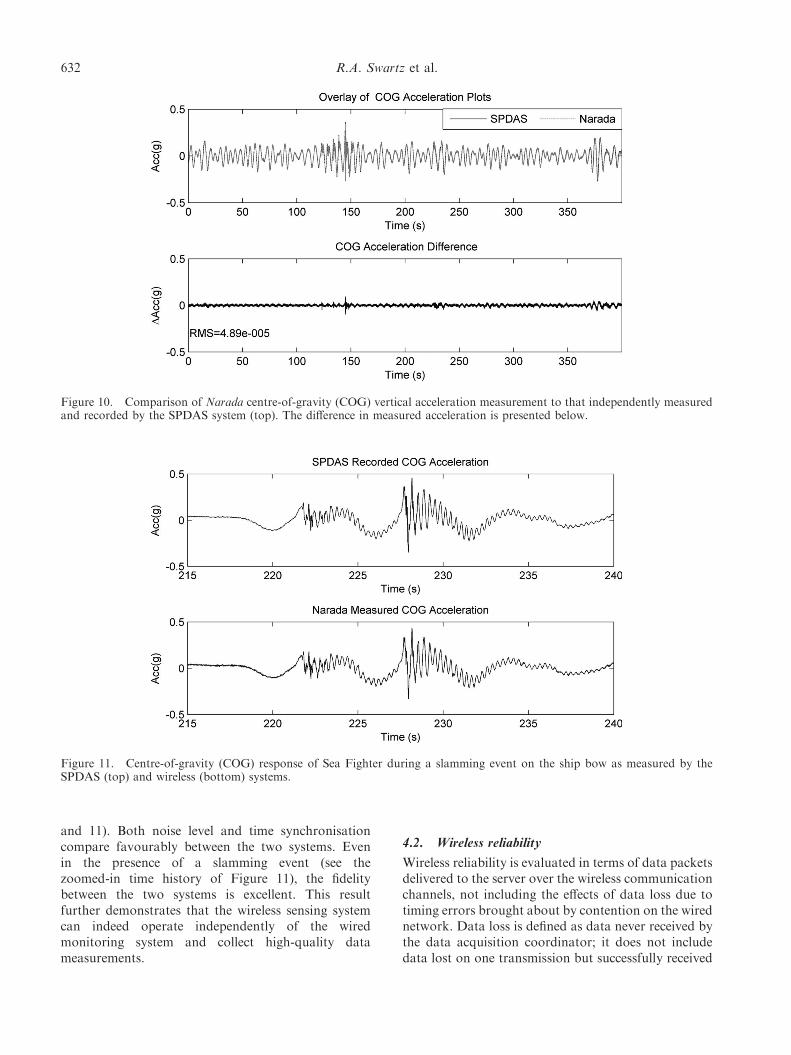
and 11). Both noise level and time synchronisationcompare favourably between the two systems. Evenin the presence of a slamming event (see thezoomed-in time history of Figure 11), the fidelitybetween the two systems is excellent. This resultfurther demonstrates that the wireless sensing systemcan indeed operate independently of the wiredmonitoring system and collect high-quality datameasurements.
4.2. Wireless reliability
Wireless reliability is evaluated in terms of data packetsdelivered to the server over the wireless communicationchannels, not including the effects of data loss due totiming errors brought about by contention on the wirednetwork. Data loss is defined as data never received bythe data acquisition coordinator; it does not includedata lost on one transmission but successfully received
Figure 10. Comparison of Narada centre-of-gravity (COG) vertical acceleration measurement to that independently measuredand recorded by the SPDAS system (top). The difference in measured acceleration is presented below.
Figure 11. Centre-of-gravity (COG) response of Sea Fighter during a slamming event on the ship bow as measured by theSPDAS (top) and wireless (bottom) systems.
632 R.A. Swartz et al.
Dow
nloa
ded
by [
Kor
ea A
dvan
ced
Inst
itute
of
Scie
nce
& T
echn
olog
y (K
AIS
T)]
at 1
7:31
14
Apr
il 20
12

on a retransmission as part of the wireless communica-tion resend/acknowledge protocol. In this regard, datadelivery in the strain subnet (subnet 3) is very good. Thecommunications range for all Narada units measuringstrain is relatively constant, approximately 3 m.For these units, data loss on the wireless communica-tion channel ranges from 0 to 3%. It is worth notingthat, during early testing, units exhibited poor perfor-mance when located very close to a metal bulkhead dueto their increased exposure to signal reflections.Moving them away from the bulkhead early in thevoyage resulted in greatly improved reliability insubnet 3.
On the other hand, subnets made up of acceleration-based Narada nodes include large variability in unitcommunication distances, multi-path effects, and an-tenna configurations, leading to some very interestingresults. Subnet 1, which has communication ranges asfar as 30 metres, is equipped with directional, high-gain,patch antennas. The directional antennas providerobust communications as a result of increased signalstrength in the direction of desired wave propagation,reduced multi-path effects, and increased clear distancebetween the antenna and the metal deck. While theNarada wireless sensing nodes have some inherentprotection against adverse multi-path effects due totheir use of spread-spectrum transceivers, some unac-ceptable performance losses due to multi-path effectswere still observed during the sea keeping trials. Sincethese issues were only identified during the ship’svoyage, the resources necessary to implement moreelegant solutions (e.g. a digital data processing ap-proach, such as blind channel equalisation, or a networkapproach, such as geographic routing) were not avail-able on the ship. However, the use of directionalantennas and minor modifications in antenna locationproved to be quite effective as data loss on the subnet 1wireless communication channel is between 0 and 5%during the transits under normal conditions.
Additional data loss occurs during some transient,adverse conditions. For example, if the steel doors of
the shipping containers in the mission bay are open inclose proximity to a wireless sensing node (within 0.5metres or less), the line-of-sight then between thesensing node and the receiver could be obstructedresulting in data loss as high as 50%. This resultindicates that the gain in effective transmission rangeachieved through use of directional antennas comes ata cost of a loss in redundant wireless transmissionpaths. In addition, one sensing node in subnet 1located in a very high-traffic area is damagedcatastrophically very early in the transit (the node isstepped on by a crew member) and subsequently,communicates only sporadically and returns corrupteddata.
Subnet 2 enjoys a shorter average distancebetween the receiver and sensing units than subnet1, but sensors are equipped with omni-directional,quarter-wave dipole antennas. Sensors in this subnetexhibit both the best and worst sustained commu-nication loss rates observed during this study. As aresult of both the antennas and the geometry, dataloss on the wireless channel (on average) is higherthan the other two subnets due to a combination ofrange and multi-path interference effects. For sensorsclosest to the receiver, data loss is minimal, withabout 0 to 1% of packets lost during the entire courseof the study. For the other sensors in subnet 2 thatare farthest from the receiver, data loss rate is as highas 7%. In particular, two units performed particularlypoorly (these units are later replaced to test if there issome hardware malfunction with no effect). Theseunits are physically closer to its receiver than thebetter performing units of subnet 1 but, due to itslower-gain, non-directed antenna, data loss is sig-nificantly higher. Other units located nearly as farfrom the server, but with more advantageouspositioning with regards to reducing negative multi-path, give much better communications results, withonly 2% data loss over the course of the study. Anode by node list of wireless data delivery perfor-mance is presented in Table 2.
Table 2. Percentage data loss, by unit number, in the wireless hull monitoring network.
Unit number Data loss (%) Data type Antenna type Unit number Data loss (%) Data type Antenna type
10 1 Strain Omni 30 0 Acc. Omni11 1 Strain Omni 31 2 Acc. Omni12 3 Strain Omni 32 4 Acc. Omni21 4 Acc. Directional 33 2 Acc. Omni22 1 Acc. Directional 34 0 Acc. Omni23 3 Acc. Directional 35 1 Acc. Omni26 5 Acc. Directional 36 3 Acc. Omni27 Broken Acc. Directional 37 3 Acc. Omni28 6 Acc. Omni 57 2 Strain Omni29 7 Acc. Omni 60 0 Acc. Directional
Structure and Infrastructure Engineering 633
Dow
nloa
ded
by [
Kor
ea A
dvan
ced
Inst
itute
of
Scie
nce
& T
echn
olog
y (K
AIS
T)]
at 1
7:31
14
Apr
il 20
12

4.3. Operational deflection shape results
Besides simple data collection, it is desirable to use thehybrid wireless hull monitoring system for systemidentification of the ship, which is the first step in manystructural health monitoring applications (Doeblinget al. 1998). Since wireless sensors have collocatedmemory and processing, they have the ability toprocess data as soon as it is collected (Straser andKiremidjian 1998). This practice has two mainadvantages: it eliminates the potential glut of unpro-cessed data that has been collected but is neveranalysed, and it can alleviate bandwidth congestion ifprocessed, low-bandwidth engineering results can betransmitted in lieu of high-bandwidth raw data. Inbattery powered sensor networks, this practice alsosaves battery power as embedded computing consumesless power than does data transmission (Lynch andLoh 2006). In this study, testing the ability of thewireless hull monitoring system to collect and archivevibrational data is of primary interest, so the modalanalysis is done offline using the frequency domaindecomposition (FDD) method.
This study utilises acceleration data from thewireless sensors and the FDD method to determinemode shapes from the identified modal frequencies.In the FDD method developed by Brincker, et al.(2001), modal frequencies are determined from thepeaks of the fast Fourier transform (FFT) of therecorded output response functions. Singular valuedecomposition (SVD) is used to decompose thespectral density matrix at modal frequencies into singledegree-of-freedom systems in the frequencydomain. By decomposing the system in the frequencydomain, the FDD method is very useful in determiningclosely spaced modes. To execute the FDD method,the power spectral density (PSD) matrix of themeasured outputs, Gyy(jo), is necessary. The PSDmatrix satisfies the input (x) and output (y)relationship:
Gyy joð Þ ¼ H* joð ÞGxx joð ÞHT joð Þ ð1Þ
where Gxx(jo) is the input PSD, and H( jo) is thetransfer function between the known output and theunknown input. Since the input and transfer functionare unknown, the following estimate of the outputPSD is used instead of Gyy( jo) (Allemang 1999):
Gyy joið Þ ¼ Fy joið Þ F*y joið Þ� �T ð2Þ
where Gyy(joi) is the estimate of the output PSD atfrequency oi and Fy(joi) is an array of FFT values of
the outputs at frequency oi. The next step is to deter-mine the SVD of the output PSD matrix:
Gyy joið Þ ¼ UiSiUHi ð3Þ
where Si is the diagonal matrix of singular values atfrequency oi, and Ui is the matrix of singular vectors.
Ui ¼ ½ui1 ui2 � � � ui1m � ð4Þ
The singular values indicate the relative amount ofenergy associated with each singular vector with themost energy at that frequency associated with the firstsingular value. Thus, from the first singular vector, anestimate of the mode shape at that frequency may bedetermined.
bf i � ui1 ð5Þ
While the FDD method has been successfullyimplemented in a distributed fashion embedded onthe Narada wireless sensor (Zimmerman et al. 2008),due to the complicated and unknown nature of theship structure, the FDD method employed in thisstudy is applied offline.
Mode shape determination from data collectedaboard the Sea Fighter is particularly challenging dueto the nature of the input to the system. The input ishighly coloured, not broadband, and further influencedby the ship’s ride control system that mitigates theeffects of the sea upon the vessel rigid-body dynamics.Due to these difficulties, it cannot be stated withcertainty that any frequency dependent deflectionshapes identified from the data are indeed mode shapes,therefore the term operational deflection shapes will bereferred to in lieu of mode shapes. However, opera-tional deflection shapes are known to be closelyconnected to mode shapes. One aid in the search foroperational deflection shapes that are likely to be modeshapes is the presence of slamming events. Slammingevents act as impulse-like loads (i.e. broadband) thatexcite all of the hull’s modes. This effect can be seen intwo frequency spectra identified from wirelessly col-lected acceleration data in the presence of and in theabsence of a slamming event (Figure 12). With aslamming event present, peaks in the response spectraat 2.2 Hz and 3.3 Hz are evident (Figure 12b); withoutthose events, those peaks are extremely difficult todiscern (Figure 12a).
Figure 12 also shows that, regardless of thepresence or absence of slamming events, the effect ofthe predominant wave period dominates the response
634 R.A. Swartz et al.
Dow
nloa
ded
by [
Kor
ea A
dvan
ced
Inst
itute
of
Scie
nce
& T
echn
olog
y (K
AIS
T)]
at 1
7:31
14
Apr
il 20
12

spectra. Throughout the transit, wave periods aremeasured by the TSK wave height sensor at approxi-mately 5.0 s which corresponds to the peak in theresponse spectra at 0.2 Hz. If the peaks at 2.2 and3.3 Hz do represent flexure modes of the hull, theyshould be invariant despite changes in ship speed andwave period. Furthermore, if the peak at 0.2 Hz is dueto the wave loading, it should vary with wave period.
While variance in the wave period at 0.2 Hz isrelatively small, there is some variance over the courseof the transit. There is, however, almost no variance inthe resonant frequencies near 2.2 and 3.3 Hz. Thelocation of the dominant peak in the frequencyspectrum (near 0.2 Hz), on the other hand is variable,and strongly correlated to the wave period and shipspeed. Specifically, that period is correlated to waveperiod and the inverse of ship speed. The correlationbetween spectra peak period and wave period is plottedin Figure 13. The linear regression between the waveperiod and main peak period is almost one-to-one (slope ¼ 1.0366) while it is nearly uncorrelated(slope ¼ 70.0041 and slope ¼ 0.0002, respectively)for the 2.2 and 3.3 Hz peaks.
As shown in Figure 14, the two operationaldeflection shapes calculated using FDD at 2.2 and3.3 Hz correspond to torsion and hog-sag modes of theship, respectively. It should be noted that the accel-erometers interfaced to the wireless hull monitoringsystem correspond to the central section of the ship.However, the SPDAS hull monitoring system hasaccelerometers at the four corners of the ship, as wellas at the centre of gravity, which would provide a morecomprehensive view of the global operational deflec-tion shape. The operational deflection shapes obtainedby applying FDD to the combined accelerationmeasurements from the experimental hybrid wirelesssystem and the SPDAS hull monitoring system (timesynchronised in post-processing using the COG accel-eration measurement as a reference) are shown inFigure 15. The two operational deflection shapesobtained from the combined data set help to confirmthe findings obtained by the wireless hull monitoringsystem alone.
Figure 12. Response spectra of the Sea Fighter measured ataccelerometer location 35 (in Figure 7): (a) Withoutslamming event, (b) with slamming event.
Figure 13. Correlation of identified spectra peak period to wave period using data collected during the transit between LongBeach and San Francisco.
Structure and Infrastructure Engineering 635
Dow
nloa
ded
by [
Kor
ea A
dvan
ced
Inst
itute
of
Scie
nce
& T
echn
olog
y (K
AIS
T)]
at 1
7:31
14
Apr
il 20
12

5. Conclusions
For this study a wireless sensing network is installedand tested on the FSF-1 Sea Fighter during transitfrom Panama City, Florida, to Portland, Oregon. Thesystem is based on the Narada wireless sensor, awireless sensing platform developed specifically forvibrational monitoring. Twenty Narada sensors re-cording 28 channels of strain and acceleration data areinstalled on three subnets in the Sea Fighter missionbay. These sensors communicate with receiver boxesthat are interfaced with the existing shipboard Ether-net network via serial-Ethernet converters that ab-stract the networking details from the networkcoordinator. The network co-ordinator server is belowdeck and is accessed via remote desktop from the ship’ssecure communications room as well as from thebridge. This experimental validation of a hybridsensing network composed of wired and wireless tiersdemonstrates the value of combining the strengths ofboth technologies in a single system. Wireless sensorsare used to collect hull response data from transducerslocated throughout a ship’s compartment. Onceconsolidated at a receiver box, a high-bandwidth wiredsystem carries the sensor data through bulkheads to acentral repository below deck.
Once collected, wirelessly collected data compareswell with data collected by the wired system. Compar-isons between the strain signals recorded by theSPDAS monitoring system and the proposed hybridwireless hull monitoring system show little difference
between the two. Errors observed are, on average, inthe range of 0.023 micro-strain, RMS. In these cases,the SPDAS and the proposed wireless hull monitoringsystems share use of the same transducers. Compar-isons of acceleration data between the SPDAS and theproposed wireless hull monitoring systems (eachcollecting data measured from independent transdu-cers) also show very good agreement, with representa-tive errors less than 50 mg, RMS. These resultsdemonstrate the high-fidelity of the hybrid wirelesshull monitoring systems.
Data is transmitted successfully with little data lossdue to use of a robust send/acknowledgement protocolwhen wirelessly communicating. The reliability resultsobtained in this study demonstrate that high qualitywireless communications can be achieved in theshipboard environment, but a number of factorsinfluence success and can greatly impact the qualityof the wireless communication system. The mostcritical component in most wireless applications istransmission power (strongly correlated to range), butin many shipboard applications, compartments aresmall enough that range is not a factor. However, themission bay, which is nearly 60 metres long, is anexception. Just as important as range on Sea Fighter(and likely more important on vessels lacking large,open bays) are multi-path effects. Multi-path effectscan be harmful as well as helpful. They are harmfulwhen primary and secondary transmission waves reacha receiver antenna simultaneously, resulting in decod-ing errors by the wireless receiver. Negative multi-patheffects are significantly alleviated on subnet 1 by use ofdirectional antennas. However, some of the usefulaspects of multi-path effects are mitigated as wellincluding the provision of redundant signal paths thatcan overcome transient conditions such as physicalobstructions along the primary line-of-sight pathwaybetween transmitter and receiver. Wireless sensorslocated near their receivers or those that useddirectional antennas performed extremely well in thesea trials. Sensors relatively far from receivers usingomni-directional antennas did not perform as well,suggesting that wireless communication issues arose asa result of a combination of range and multi-patheffects. Greater use of directional and high-gainantennas (where appropriate) and power amplifiedradios will improve performance where data loss is anissue. Creating clear space, wherever possible, betweendecks (or bulkheads) and the antennas attached to theNarada nodes, will also help in improving thereliability of the wireless channel. As such, this studyidentifies sensing node placement, receiver placement,and antenna selection as non-trivial tasks in shipboardinstallations. In addition, the application of advancedwireless signal processing and routing algorithms to
Figure 14. Operational deflection shapes determined fromNarada collected acceleration data.
Figure 15. Operational deflection shapes determined fromcombined Narada and SPDAS collected acceleration data.
636 R.A. Swartz et al.
Dow
nloa
ded
by [
Kor
ea A
dvan
ced
Inst
itute
of
Scie
nce
& T
echn
olog
y (K
AIS
T)]
at 1
7:31
14
Apr
il 20
12

alleviate negative multi-path effects promises to be avery fruitful avenue for future investigation in the areaof wireless sensing in compartmentalised metal struc-tures such as the Sea Fighter.
Improvements in the communications performancecan be accomplished by taking advantage of additionalboard features and additional testing. One feature ofthe CC2420 wireless modem employed by the Naradawireless sensor is that it returns to the microcontrollera measurement of the received wireless signal strengthwhenever it decodes a packet. This information can beused to provide to the network a real-time map ofnetwork reliability given transient conditions. Thisinformation can be used at the time of installation tooptimise sensor node location and antenna orientationfor maximum performance. Second, leveraging thecomputational abilities of the sensor for embeddeddata processing can greatly improve robustness andreliability of the wireless communication channels aswell as save battery power (where necessary) as datatransmission is an energy intensive operation for thewireless unit (Lynch et al. 2004). Communication ofraw data over the wireless communication channelsconsumes a large amount of bandwidth and is apractice that scales poorly as sensor networks grow insize. Communicating a reduced set of processed dataalleviates stress on the available bandwidth, therebyincreasing the time window available for multiple,robust resend/acknowledge protocols to help ensurethat data is delivered.
Future work should include even larger sensornetworks, defined by hundreds of sensor channels withboth greater physical resolution and scope (i.e. adenser sensor network located throughout the entirelength of the ship). Greater reliance on embedded dataprocessing will alleviate demand on the crowdedwireless communication band, increase system scal-ability, and reduce the system’s reliance on the dataservers that serve as potential single points of failure.The use of wirelessly collected acceleration data formodal analysis of the ship demonstrates the value ofthe hull response data. Leveraging the ability ofwireless sensors to serve as a platform for economical,high-density sensing networks can also help in makingautomated ship-board hull health monitoring systemsa reality.
Acknowledgements
Funding was provided by the Joint High Speed Vessel(JHSV), program manager, CDR Jess Arrington,Program Executive Office, Ships (PEO Ships), PMS325, and the JHSV system design manager, SEA 05D4,through Award Number N000178-04-D-4023-22. Theproject was administered through BMT Planners while
the Naval Surface Warfare Center, Carderock Division(NSWCCD) Points of Contact were Thomas Bradyand Frank Leban. The Narada wireless sensorextensively used in this study was developed under aseparate Office of Naval Research (ONR) award(N00014-05-1-0596) administered by Program Man-ager Anthony Seman. In addition, the advice andguidance offered by Dr. Paul Hess (ONR),andAnthony Seman (ONR) are gratefully acknowledged.Finally, this project would not have been successfulwithout the strong support and cooperation of theofficers and crew of the FSF-1 Sea Fighter.
References
Allemang, R., 1999. Vibrations: Experimental modal analy-sis. Course notes. Technical report UC-SDRL-CN-20-263-663/664. Structural Dynamics Research Laboratory,University of Cincinnati, OH.
Bachman, R.J., Woolaver, D.A., and Powell, M.D., 2007.Sea Fighter (FSF-1) seakeeping measurements. Technicalreport NSWCCD-50-TR-2007/010. Naval Surface War-fare Center Carderock Division, West Bethesda, MD.
Brincker, R., Zhang, L., and Anderson, P., 2001. Modalidentification of output-only systems using frequencydomain decomposition. Smart Materials and Structures,10 (3), 441–445.
Doebling, S.W., Farrar, C.R., and Prime, M.R., 1998. Asummary review of vibration-based damage identifica-tion methods. Shock and Vibration Digest, 30 (2), 91–105.
Donald, J.K., 2007. Fracture mechanics characterization ofaluminum alloys for marine structural applications.Technical report SSC-448. Ship Structure Committee.US Coast Guard, Washington, DC, USA.
Harvey, A.F., 1963. Microwave engineering. London andNew York: Academic Press.
Hess, P.E., 2007. Structural health monitoring for high-speednaval ships. 6th international workshop on structuralhealth monitoring, 11–14 September 2007, Stanford, CA.Lancaster. PA: DEStech Publishing, 3–15.
IEEE, 2006. 802.15.4: Standard for Information technology –Telecommunications and information exchange betweensystems – Local and metropolitan area networks – Specificrequirements Part 15.4: Wireless medium access control(MAC) and physical layer (PHY) specifications for lowrate wireless personal area networks (LR-WPANs). NewYork, NY, USA: IEEE Standards Association.
Katsas, S., Nikolaou, J., and Papadimitriou, G., 2007.Corrosion resistance of repair welded naval aluminiumalloys. Materials and Design, 28 (3), 831–836.
Lively, K.A., Seman, A.J., and Kirkpatrick, M., 2008.Human systems integration and advanced technology inengineering department workload and manpower reduc-tion. Naval Engineers Journal, 115 (1), 57–66.
Lynch, J.P. and Loh, K.J., 2006. A summary review ofwireless sensors and sensor networks for structural healthmonitoring. The Shock and Vibration Digest, 38 (2),91–128.
Lynch, J.P., Sundararajan, A., Law, K.H., Kiremidjian,A.S., and Carryer, E., 2004. Embedding damage detec-tion algorithms in a wireless sensing unit for attainmentof operational power efficiency. Smart Materials andStructures, IOP, 13 (4), 800–810.
Structure and Infrastructure Engineering 637
Dow
nloa
ded
by [
Kor
ea A
dvan
ced
Inst
itute
of
Scie
nce
& T
echn
olog
y (K
AIS
T)]
at 1
7:31
14
Apr
il 20
12

MacGillivray, P. and Goddard, K., 1997. Advanced sensortechnology for marine propulsion control systems. In:Proceedings of the 11th ship control systems symposium,11–14 April 1997, Southampton, UK. Southampton,UK: Computational Mechanics Publications, 245–257.
Maroti, M., Kusy, B., Simon, G., and Ledeczi, A., 2004. Theflooding time synchronisation protocol. Proceedings ofthe 2nd international conference on embedded networkedsensor systems, 3–5 November 2004, Baltimore, MD,USA. New York: ACM Press, 39–49.
Pran, K., Johnson, G., Jensen, A.E., Hegstad, K.A.,Sagvolden, G., Farsund, O., Chang, C.-C., Malsawma,L., and Wang, G., 2002. Instrumentation of a high-speedsurface effect ship for structural response characteriza-tion during sea trials. Proceedings of SPIE, 3986,372–379.
Sielski, R.A., 2007. Research needs in aluminium structure.Ships and Offshore Structures, 3 (1), 57–65.
Slaughter, S.B., Cheung, M.C., Sucharski, D., and Cowper,B., 1997. State of the art in hull monitoring systems.Technical report SSC-401. Ship Structure Committee.US Coast Guard, Washington DC.
Straser, E. and Kiremidjian, A.S., 1998. Modular, wirelessdamage monitoring system for structures. Technicalreport 128. John A. Blume Earthquake EngineeringCenter, Stanford, CA.
Swartz, A., Jung, D., Lynch, J.P., Wang, Y., Shi, D., andFlynn, M.P., 2005. Design of a wireless sensor forscalable distributed in-network computation in a struc-tural health monitoring system. 5th international work-shop on structural health monitoring, 12–14 September2005, Stanford, CA. Lancaster, PA: DEStech Publishing,1570–1577.
Window, A.L. ed., 1992. Strain gauge technology. London:Elsevier Applied Science.
Zimmerman, A.T., Shiraishi, M., Swartz, R.A., and Lynch,J.P., 2008. Automated modal parameter estimation byparallel processing within wireless monitoring systems.Journal of Infrastructure Systems, 14 (1), 102–113.
Zoughi, R. and Kharkovsky, S., 2008. Microwave andmillimetre wave sensors for crack detection. Fatigue &Fracture of Engineering Materials & Structures, 31 (8),695–713.
638 R.A. Swartz et al.
Dow
nloa
ded
by [
Kor
ea A
dvan
ced
Inst
itute
of
Scie
nce
& T
echn
olog
y (K
AIS
T)]
at 1
7:31
14
Apr
il 20
12