hw 3 stats
TRANSCRIPT

8/10/2019 HW 3 Stats
http://slidepdf.com/reader/full/hw-3-stats 1/13
Chris Cianfarini
Professor Campbell
DSS 560
Homework 3
3.
A. The Decision to be made is if they should construct aSmall or large plant
The Chance event is whether the“long run demand” will be low medium or high.
B.
C.

8/10/2019 HW 3 Stats
http://slidepdf.com/reader/full/hw-3-stats 2/13
D. Optimistic approach: I would chooseLarge plant thinking I could profit 500 million
in the best case scenario
Conservative Approach: I would choose theSmall Plant thinking that worst case
scenario I will make 150 Million
4.
A. The decision in this instance is whatlease would be the best option
The chance event ishow many miles amy will drive over the next 36 months
B.
Hepburn Pricing:
36(299) + .15(0) = $10,764
36(299) + .15(45,000 - 36,000) = $12,114
36(299) + .15(54,000 - 36,000) = $13,464
Midtown Pricing:
36(310) + .2 (0) = $11,160

8/10/2019 HW 3 Stats
http://slidepdf.com/reader/full/hw-3-stats 3/13
36(310) + .2 (0) = $11,160
36(310) + .2 (54,000-45,000) = $12,960
Hopkins Pricing:
36(325) + .15 (0) = $11,70036(325) + .15 (0) = $11,700
36(325) + .15 (0) = $11,700
C.
Optimistic approach: I would chooseHepburn because I would hope to drive the least
amount of miles and have the lowest cost.
Conservative Approach: I would choose theHopkins so that assuming I drove the max
amount of miles per year (18,000) I would have the lowest price available for that
amount of driving.
D.
Expected Values:
Hepburn:
.5 (10,764) + .4 (12,114) + .1 (13,464) =$11,574
Midtown:
.9 (11,160) + .1 (12,960) =$11,340
Hopkins:
1 (11,700) =$11,700
Amy should choose to lease her car from midtown

8/10/2019 HW 3 Stats
http://slidepdf.com/reader/full/hw-3-stats 4/13
F.
Hepburn:
.3(10,764) + .4(12,114) + .3(13,464) =$12,114
Midtown:
.7(11,160) + .3(12,960) =$11,700
Hopkins
1 (11,700) =$11,700
Hopkins or midtown would be the best options with these expected value probabilities.
9.
A.
The decision to be made is whether it would be better to go with the full price service orthe discount service.
The chance event is whether itwill be a strong demand for service or a weak demand
for service.

8/10/2019 HW 3 Stats
http://slidepdf.com/reader/full/hw-3-stats 5/13
The consequence is eithera profit / loss depending on their model choice and the
demand brought in.
There aretwo alternate decisions or options available to the decision maker
There areTwo outcomes that could happen with this chance event, strong & weak.
B.
Optimistically, Myrtle air should choose to go with theFull price service in hopes to
make the $960 in a strong market.
Conservatively, Myrtle air should choose to go with theDiscount service so that in aworst case scenario they will make $320 in a weak market.
C.
Full service:
.7 (960) + .3 (-490) =525
Discount service:
.7 (670) + .3 (320) =565
The best decision with the probabilities above is the discount service.
D.
Full service:
.8(960) + .2 (-490) =670
Discount Service:
.8(670) + .2(320) =600
The best decision with the probabilities above is the full service.

8/10/2019 HW 3 Stats
http://slidepdf.com/reader/full/hw-3-stats 6/13
E.
This graph depicts the percentage chance of a strong market.
With the expected value in the Y axis, and the probability of a strong market in the x axis
Approximately, if there is less than an 80% chance of a strong market it would be better
for the investor to go with the Discount service model.
If there is information reflecting that there is greater than an 80% chance of a strong
market it would be wise to go with the Full price service.

8/10/2019 HW 3 Stats
http://slidepdf.com/reader/full/hw-3-stats 7/13
13.
A.
The decision to be made is whether to plant Chardonnay , Riesling, or Chardonnay &
Riesling.
The Chance events are whether the demand for each wine will be strong or weak.
The Consequence is how much profit can be made when selling the wine they produce.
There are3 decisions Seneca can make and the possible outcomes are as follows:
All Riesling- Weak
All Riesling- Strong
All Chardonnay-Weak
All Chardonnay-Strong
Both C&R- C Strong R StrongBoth C&R-C Weak R Strong
Both C&R- R Weak C Strong
Both C&R- R Weak C Weak
8 Chance Events
B.

8/10/2019 HW 3 Stats
http://slidepdf.com/reader/full/hw-3-stats 8/13
C.
Chardonnay Only:
.55(20,000) + .45(70,000)
=42,500
Combination of Both:
.25(26000) + .2(60,000) + .5(40,000) + .05(22,000)
=39,600
Riesling Only:
.3(25,000) + .7(45,000)
=39,000
Seneca should only produce Chardonnay.
D.

8/10/2019 HW 3 Stats
http://slidepdf.com/reader/full/hw-3-stats 9/13
Chardonnay Only:
.55(20,000) + .45(70,000)
=42,500
Combination of Both:
.05(26,000) + .05(22,000) + .4(60,000) + .5(40,000)
=46,400
Riesling Only
.90 (45,000) + .10(25,000)
=43,000
Seneca Should produce a combination of both wines.
E.
Chardonnay Only:
.55(20,000) + .45(50,000)
=33,500
Combination of Both:
.25(26000) + .2(60,000) + .5(40,000) + .05(22,000)
=39,600
Riesling Only:
RieslingChardonnayWeakStrong
Weak0.050.50Strong0.050.40

8/10/2019 HW 3 Stats
http://slidepdf.com/reader/full/hw-3-stats 10/13
.3(25,000) + .7(45,000)
=39,000
Seneca Should produce a combination of both wines.
18.
A.
8/10/2019 HW 3 Stats
http://slidepdf.com/reader/full/hw-3-stats 11/13
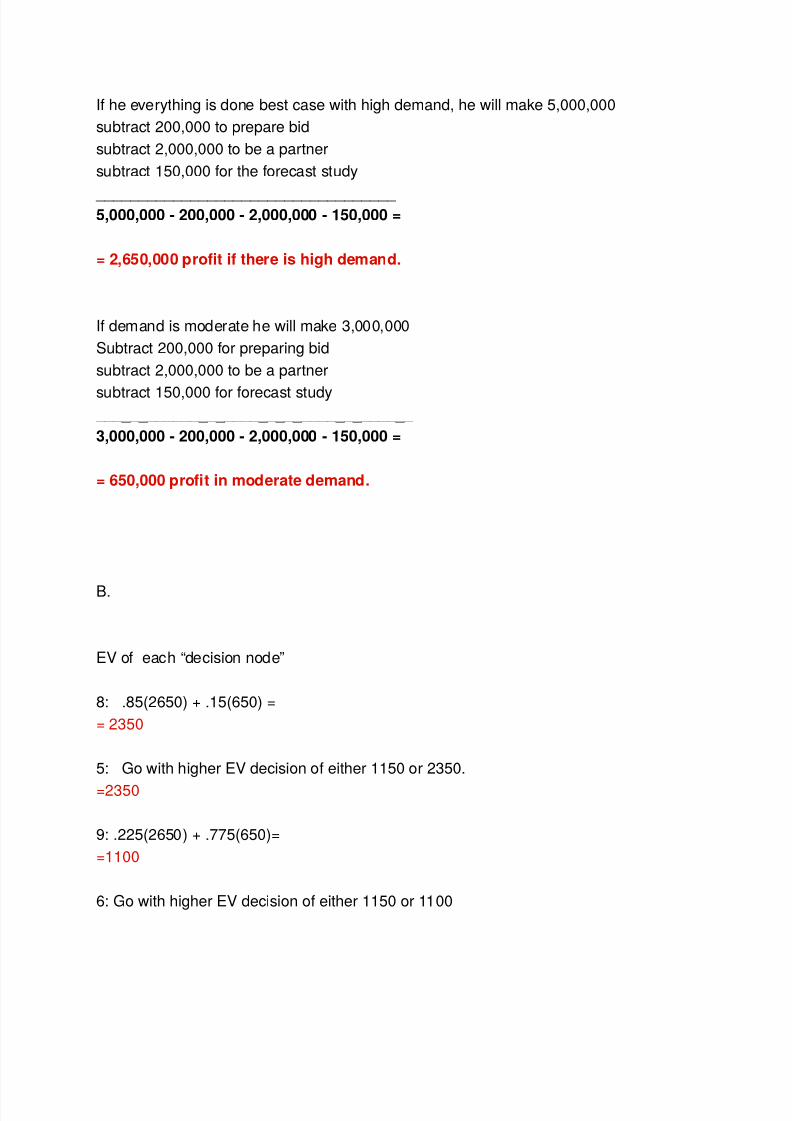
If he everything is done best case with high demand, he will make 5,000,000
subtract 200,000 to prepare bid
subtract 2,000,000 to be a partner
subtract 150,000 for the forecast study
___________________________________5,000,000 - 200,000 - 2,000,000 - 150,000 =
= 2,650,000 profit if there is high demand.
If demand is moderate he will make 3,000,000
Subtract 200,000 for preparing bid
subtract 2,000,000 to be a partner
subtract 150,000 for forecast study _____________________________________
3,000,000 - 200,000 - 2,000,000 - 150,000 =
= 650,000 profit in moderate demand.
B.
EV of each “decision node”
8: .85(2650) + .15(650) =
= 2350
5: Go with higher EV decision of either 1150 or 2350.
=2350
9: .225(2650) + .775(650)=
=1100
6: Go with higher EV decision of either 1150 or 1100

8/10/2019 HW 3 Stats
http://slidepdf.com/reader/full/hw-3-stats 12/13
=1150
4: .6(2350) + .4(1150) =
=1870
10: .6(2800) + .4(800)=
=2000
7: Go with higher EV decision of either 2000 or 1300
=2000
3: Go with higher EV of 1870 or 2000
=2000
2: .8 (2000) + .2(-200) =
=1560
1: Go with higher EV of 1560 or 0
=1560
The optimal decision strategy is to:
Bid on the projectDo Not have market research
Build the complex
C.
Node 4 = 1870
Node 7 = 2000
2000-1870 =130

8/10/2019 HW 3 Stats
http://slidepdf.com/reader/full/hw-3-stats 13/13
The plans would break even once the cost of this research was reduced by at least
130,000 dollars.
The cost of the market research study would have to be less than 20,000 dollars.