hurricane katrina - orleans parish - 08/31/2005 … flood report.pdfhurricane katrina - orleans...
TRANSCRIPT

Hurricane Katrina - Orleans Parish - 08/31/2005 Water Depth
Other: 22,771
White: 135,956
Black: 325,947
Households: 188,251
Total: 215,091
Vacant Housing: 26,840
Owner Occupied: 87,589
Renter Occupied: 100,662
Total Population
Total: 216,543
White: 84,628
Black: 122,638
Households: 90,150
Total: 106,360
Vacant Housing: 16,210
Owner Occupied: 37,464
Renter Occupied: 52,686
Less than 4 feet of floodwater
4+ feet of floodwater
Total: 268,131
White: 51,328
Black: 203,309
Households: 98,101
Total: 108,731
Vacant Housing: 10,630
Owner Occupied: 50,125
Renter Occupied: 47,976
28.1%
67.3%
12.5%
40.7%
46.8%
39.1%
56.6%
15.2%
35.2%
49.5%
19.1%
75.8%
9.8%
46.1%
44.1%
% of Selected
62.2%
37.6%
60.4%
42.8%
52.3%
37.8%
62.4%
39.6%
57.2%
47.7%
44.7%
55.3%
% of Selected % of Total Population
% of Selected % of Total Population
Total: 484,674
4.7%
Population
Housing Units
100.0%
100.0%
Other: 9,277 4.3% 40.7%
100.0%
Population
Housing Units
100.0%
Population
Other: 13,494 4.3% 40.7%
100.0%
Housing Units
100.0%
49.4%
50.6%

Depth of Flood Calculated by BlockPeople and Households Effected
East and West Bank Areas2000
Population WHITE BLACK OTHERHOUSE HOLDS
OWNER OCCUPIED
RENTER OCCUPIED VACANT
Orleans 484,674 135,956 325,947 22,771 215,091 87,589 100,662 26,840 Percent 28.1% 67.3% 4.7% 40.7% 46.8% 12.5%Less than 2' 148,690 66,988 74,368 7,334 74,861 26,697 36,555 11,609
30.7% 49.3% 22.8% 32.2% 34.8% 30.5% 36.3% 43.3%2' to 4' 67,853 17,640 48,270 1,943 31,499 10,767 16,131 4,601
14.0% 13.0% 14.8% 8.5% 14.6% 12.3% 16.0% 17.1%Over 4' 268,131 51,328 203,309 13,494 108,731 50,125 47,976 10,630
55.3% 37.8% 62.4% 59.3% 50.6% 57.2% 47.7% 39.6%
East Bank Flood Experience2000
Population WHITE BLACK OTHERHOUSE HOLDS
OWNER OCCUPIED
RENTER OCCUPIED VACANT
East Bank 427,892 115,635 293,170 19,087 191,574 76,517 91,049 24,008 Less than 2' 91,908 46,667 41,591 3,650 51,344 15,625 26,942 8,777
21.5% 40.4% 14.2% 19.1% 26.8% 20.4% 29.6% 36.6%2' to 4' 67,853 17,640 48,270 1,943 31,499 10,767 16,131 4,601
15.9% 15.3% 16.5% 10.2% 16.4% 14.1% 17.7% 19.2%Over 4' 268,131 51,328 203,309 13,494 108,731 50,125 47,976 10,630
62.7% 44.4% 69.3% 70.7% 56.8% 65.5% 52.7% 44.3%
West Bank Flood Experience2000
Population WHITE BLACK OTHERHOUSE HOLDS
OWNER OCCUPIED
RENTER OCCUPIED VACANT
West Bank 56,782 20,321 32,777 3,684 23,517 11,072 9,613 2,832 Less than 2' 56,782 20,321 32,777 3,684 23,517 11,072 9,613 2,832
100.0% 100.0% 100.0% 100.0% 100.0% 100.0% 100.0% 100.0%

10
510
610
90
61
90
90
39
46
47
407
23
3139
428
3021
3046
40645
39
47
39
ALV
AR
FLORIDA AV EXCANAL BLVD
ALMONASTER AV
REA
D B
LVD
ROBER
ST C HARLES AV
EL
YS
IAN
FIE
LD
S A
V
DONNER EXWY
TE
RR
Y P
KW
Y
FR
AN
KL
IN A
V
CARROLL
TO
N AV
LAK
E P
ON
TC
HA
RT
RA
IN C
SW
Y
HAYNE BLVD
LE ON C SIMON B LVD
CLAIBORNE AVE
DO
WN
MA
N R
D
CA
US
EW
AY
BLV
D ST B
ER
NA
RD
AV
E A RHART EXWY
LOU
ISIA
NA
AV
E
VETERANS MEMORIAL HWYL
OY
OL
A
EARHART
BASIN
WE
ST
EN
D B
LV
D
WH
ITN
EY
BLV
D
BRIDGE CITY AVE
CHARTRES ST
JOU
RD
AN
RD
PATTERSON RD
Depth of Flood by BlockHurricane Katrina
Less than 1 foot
1 to 2 feet
2 to 3 feet
3 to 4 feet
Over 4 feet

10
510
610
90
61
90
90
39
46
47
407
23
3139
428
3021
3046
40645
39
47
39
ALV
AR
FLORIDA AV EXCANAL BLVD
ALMONASTER AV
REA
D B
LVD
ROBER
ST C HARLES AV
EL
YS
IAN
FIE
LD
S A
V
DONNER EXWY
TE
RR
Y P
KW
Y
FR
AN
KL
IN A
V
CARROLL
TO
N AV
LAK
E P
ON
TC
HA
RT
RA
IN C
SW
Y
HAYNE BLVD
LE ON C SIMON B LVD
CLAIBORNE AVE
DO
WN
MA
N R
D
CA
US
EW
AY
BLV
D ST B
ER
NA
RD
AV
E A RHART EXWY
LOU
ISIA
NA
AV
E
VETERANS MEMORIAL HWYL
OY
OL
A
EARHARTBAS
IN
WE
ST
EN
D B
LV
D
WH
ITN
EY
BLV
D
BRIDGE CITY AVE
CHARTRES ST
JOU
RD
AN
RD
PATTERSON RD
Days Wet by BlockHurricane Katrina
1 - 6
7 - 1112 - 1516 - 22
23 - 29

10
510
610
90
61
90
90
90
39
46
47
407
3139
428
23
3021
3046
406
39
47
39FLORIDA AV EX
ALV
AR
CANAL BLVD
ALMONASTER AV
ROBER
ST CHARLES AV
RE
AD
BLV
D
HAYNE BLVD
CARROLLTON AV
ELY
SIA
N F
IEL
DS
AV
FR
AN
KLIN
AV
LAK
E P
ON
TC
HA
RT
RA
IN C
SW
Y
DONNER EXWY
LEON C SIMON BLVD
CLAIRBORNE AVE
EARHART EXWY
VETERANS MEMORIAL HWY
DO
WN
MA
N R
D
TERRY PKWY
CA
US
EW
AY
BLV
D
ST B
ER
NA
RD
AV
LOU
ISIA
NA
AV
E
EARHART
LO
YO
LA
N ROBERTSON ST
BASIN N RAM
PART
WE
ST
EN
D B
LV
D
CHARTRES ST
BRIDGE CITY AVE
FLORIDA AVE
WH
ITN
EY
BL
VDGIROD ST
PO
NT
CH
AR
TR
AIN
BL
VD
JOU
RD
AN
RD
PATTERSON RD
TCHOUPITOULAS ST
OPELOUSAS AVEP
OLA
ND
ST CLAUDE
N PETERS RD
Viavant/Venetial IslesViavant/Venetial Isles
Village de L'EstVillage de L'Est
Edgelake/Little WoodsEdgelake/Little Woods
Mid-CityMid-City
Read Boulevard EastRead Boulevard East
LakeviewLakeview
BehrmanBehrman
River Park/Cut Off/Lower CoastRiver Park/Cut Off/Lower Coast
Desire AreaDesire Area
FillmoreFillmore
St. RochSt. Roch
DillardDillard
BywaterBywater
Tall Timbers/BrechtelTall Timbers/Brechtel
Pines VillagePines Village
Audubon/UniversityAudubon/University
St. ClaudeSt. Claude
MilanMilan
Lower Ninth wardLower Ninth ward
NavarreNavarre
Seventh WardSeventh Ward
UptownUptown
Gentilly TerraceGentilly Terrace
Plum OrchardPlum Orchard
Aurora/Walnut Bend/Huntlee VillageAurora/Walnut Bend/Huntlee Village
MilneburgMilneburg
Central City/MagnoliaCentral City/Magnolia
Lake Terrace/Lake OaksLake Terrace/Lake Oaks
West RiversideWest Riverside
Holy CrossHoly Cross
HollygroveHollygrove
READ Boulevard West BREAD Boulevard West B
Ponchartrain ParkPonchartrain Park
St. AnthonySt. Anthony
Lakeshore/Lake VistaLakeshore/Lake Vista
BroadmoorBroadmoor
Tulane/GravierTulane/Gravier
TouroTouro
Gentilly WoodsGentilly Woods
Fairgrounds/ BroadFairgrounds/ Broad
Central Business DistrictCentral Business District
Gerttown/Zion CityGerttown/Zion City
Country Club/Dixon BCountry Club/Dixon B
Lakewood/West EndLakewood/West End
Vieux CarreVieux Carre
MarignyMarigny
Algiers WhitneyAlgiers WhitneyMc DonoghMc Donogh
Irish ChannelIrish Channel
Leonidas/ West CarrolltonLeonidas/ West Carrollton
Algiers Naval StationAlgiers Naval Station
St. Thomas ProjectSt. Thomas Project
READ Boulevard West AREAD Boulevard West A
FreretFreret
Sixth Ward/Treme/LafitteSixth Ward/Treme/Lafitte
Bayou St. JohnBayou St. John
Florida AreaFlorida Area
East CarrolltonEast Carrollton
Marlyville/FountainebleauMarlyville/Fountainebleau
Black PearlBlack Pearl
Algiers PointAlgiers Point
East RiversideEast Riverside
Calliope ProjectCalliope Project
St. Bernard Area/ ProjectSt. Bernard Area/ Project
Garden DistrictGarden District
Desire ProjectDesire Project
Fischer ProjectFischer ProjectSt. Thomas Area/Lower Garden DistrictSt. Thomas Area/Lower Garden District
Warehouse DistrictWarehouse District
Country Club/Dixon ACountry Club/Dixon A
Iberville ProjectIberville Project
Florida Housing DevelopmentFlorida Housing Development
LegendNeighborhoods
Water Depth (feet)depth_blocks.MEAN
0 - 2
3 - 4
5 - 7
8 - 10
11 - 18
Orleans Parish - Flooding by Neighborhood

Total White Black HouseholdsHousing
UnitsVacant Housing
Owner Occupied
Renter OccupiedOther
Hurricane Katrina - Orleans Parish - 08/31/2005 Water Depth
Algiers Naval Station3,114 975 2,023 964 1,065 101 514 450
3,114 975 2,023 964 1,065 101 514 450
0 0 0 0 0 0 0 0
Total Population
Less than 4 feet of floodwater
4+ feet of floodwater
42.3%
42.3%
0.0%
48.3%
48.3%
0.0%
9.5%
9.5%
0.0%
3.7%
3.7%
0.0%
116
116
0
65.0%
65.0%
0.0%
31.3%
31.3%
0.0%
Algiers Point
2,539 1,765 663 1,220 1,504 284 589 631
2,539 1,765 663 1,220 1,504 284 589 631
0 0 0 0 0 0 0 0
Total Population
Less than 4 feet of floodwater
4+ feet of floodwater
42.0%
42.0%
0.0%
39.2%
39.2%
0.0%
18.9%
18.9%
0.0%
4.4%
4.4%
0.0%
111
111
0
26.1%
26.1%
0.0%
69.5%
69.5%
0.0%
Algiers Whitney3,617 254 3,295 1,070 1,266 196 473 597
3,617 254 3,295 1,070 1,266 196 473 597
0 0 0 0 0 0 0 0
Total Population
Less than 4 feet of floodwater
4+ feet of floodwater
47.2%
47.2%
0.0%
37.4%
37.4%
0.0%
15.5%
15.5%
0.0%
1.9%
1.9%
0.0%
68
68
0
91.1%
91.1%
0.0%
7.0%
7.0%
0.0%
Audubon/University14,800 13,123 766 5,585 6,059 474 2,989 2,596
12,583 11,222 686 4,693 5,104 411 2,570 2,123
2,217 1,901 80 892 955 63 419 473
Total Population
Less than 4 feet of floodwater
4+ feet of floodwater
42.8%
41.6%
49.5%
49.3%
50.4%
43.9%
7.8%
8.1%
6.6%
6.2%
5.4%
10.6%
911
675
236
5.2%
5.5%
3.6%
88.7%
89.2%
85.7%
Aurora/Walnut Bend/Huntlee Village14,571 9,675 3,974 5,459 5,850 391 4,374 1,085
14,571 9,675 3,974 5,459 5,850 391 4,374 1,085
0 0 0 0 0 0 0 0
Total Population
Less than 4 feet of floodwater
4+ feet of floodwater
18.5%
18.5%
0.0%
74.8%
74.8%
0.0%
6.7%
6.7%
0.0%
6.3%
6.3%
0.0%
922
922
0
27.3%
27.3%
0.0%
66.4%
66.4%
0.0%
Bayou St. John5,323 1,430 3,702 2,312 2,598 286 804 1,508
3,309 1,366 1,791 1,492 1,658 166 619 873
2,014 64 1,911 820 940 120 185 635
Total Population
Less than 4 feet of floodwater
4+ feet of floodwater
58.0%
52.7%
67.6%
30.9%
37.3%
19.7%
11.0%
10.0%
12.8%
3.6%
4.6%
1.9%
191
152
39
69.5%
54.1%
94.9%
26.9%
41.3%
3.2%
Page 1 of 12

Total White Black HouseholdsHousing
UnitsVacant Housing
Owner Occupied
Renter OccupiedOther
Hurricane Katrina - Orleans Parish - 08/31/2005 Water Depth
Behrman11,156 1,605 8,814 3,824 4,596 772 1,645 2,179
11,156 1,605 8,814 3,824 4,596 772 1,645 2,179
0 0 0 0 0 0 0 0
Total Population
Less than 4 feet of floodwater
4+ feet of floodwater
47.4%
47.4%
0.0%
35.8%
35.8%
0.0%
16.8%
16.8%
0.0%
6.6%
6.6%
0.0%
737
737
0
79.0%
79.0%
0.0%
14.4%
14.4%
0.0%
Black Pearl
1,611 873 667 870 1,005 135 373 497
1,611 873 667 870 1,005 135 373 497
0 0 0 0 0 0 0 0
Total Population
Less than 4 feet of floodwater
4+ feet of floodwater
49.5%
49.5%
0.0%
37.1%
37.1%
0.0%
13.4%
13.4%
0.0%
4.4%
4.4%
0.0%
71
71
0
41.4%
41.4%
0.0%
54.2%
54.2%
0.0%
Broadmoor6,802 1,643 4,954 2,687 2,995 308 1,277 1,410
0 0 0 0 0 0 0 0
6,802 1,643 4,954 2,687 2,995 308 1,277 1,410
Total Population
Less than 4 feet of floodwater
4+ feet of floodwater
47.1%
0.0%
47.1%
42.6%
0.0%
42.6%
10.3%
0.0%
10.3%
3.0%
0.0%
3.0%
205
0
205
72.8%
0.0%
72.8%
24.2%
0.0%
24.2%
Bywater4,486 1,459 2,904 1,925 2,332 407 759 1,166
4,257 1,455 2,688 1,850 2,239 389 716 1,134
229 4 216 75 93 18 43 32
Total Population
Less than 4 feet of floodwater
4+ feet of floodwater
50.0%
50.6%
34.4%
32.5%
32.0%
46.2%
17.5%
17.4%
19.4%
2.7%
2.7%
3.9%
123
114
9
64.7%
63.1%
94.3%
32.5%
34.2%
1.7%
Calliope Project4,363 14 4,318 1,432 1,668 236 62 1,370
863 2 852 306 347 41 10 296
3,500 12 3,466 1,126 1,321 195 52 1,074
Total Population
Less than 4 feet of floodwater
4+ feet of floodwater
82.1%
85.3%
81.3%
3.7%
2.9%
3.9%
14.1%
11.8%
14.8%
0.7%
1.0%
0.6%
31
9
22
99.0%
98.7%
99.0%
0.3%
0.2%
0.3%
Central Business District2,079 1,179 715 1,049 1,320 271 220 829
2,079 1,179 715 1,049 1,320 271 220 829
0 0 0 0 0 0 0 0
Total Population
Less than 4 feet of floodwater
4+ feet of floodwater
62.8%
62.8%
0.0%
16.7%
16.7%
0.0%
20.5%
20.5%
0.0%
8.9%
8.9%
0.0%
185
185
0
34.4%
34.4%
0.0%
56.7%
56.7%
0.0%
Page 2 of 12

Total White Black HouseholdsHousing
UnitsVacant Housing
Owner Occupied
Renter OccupiedOther
Hurricane Katrina - Orleans Parish - 08/31/2005 Water Depth
Central City/Magnolia20,116 2,845 16,813 8,764 11,082 2,318 1,564 7,200
14,474 2,807 11,257 6,474 8,223 1,749 1,219 5,255
5,642 38 5,556 2,290 2,859 569 345 1,945
Total Population
Less than 4 feet of floodwater
4+ feet of floodwater
65.0%
63.9%
68.0%
14.1%
14.8%
12.1%
20.9%
21.3%
19.9%
2.3%
2.8%
0.9%
458
410
48
83.6%
77.8%
98.5%
14.1%
19.4%
0.7%
Country Club/Dixon
3,973 1,967 1,923 1,554 1,655 101 1,031 523
673 582 77 275 284 9 231 44
3,300 1,385 1,846 1,279 1,371 92 800 479
Total Population
Less than 4 feet of floodwater
4+ feet of floodwater
31.6%
15.5%
34.9%
62.3%
81.3%
58.4%
6.1%
3.2%
6.7%
2.1%
2.1%
2.1%
83
14
69
48.4%
11.4%
55.9%
49.5%
86.5%
42.0%
Desire Area4,038 144 3,828 1,470 1,762 292 692 778
1,075 115 927 436 480 44 188 248
2,963 29 2,901 1,034 1,282 248 504 530
Total Population
Less than 4 feet of floodwater
4+ feet of floodwater
44.2%
51.7%
41.3%
39.3%
39.2%
39.3%
16.6%
9.2%
19.3%
1.6%
3.1%
1.1%
66
33
33
94.8%
86.2%
97.9%
3.6%
10.7%
1.0%
Desire Project408 0 404 115 272 157 4 111
0 0 0 0 0 0 0 0
408 0 404 115 272 157 4 111
Total Population
Less than 4 feet of floodwater
4+ feet of floodwater
40.8%
0.0%
40.8%
1.5%
0.0%
1.5%
57.7%
0.0%
57.7%
1.0%
0.0%
1.0%
4
0
4
99.0%
0.0%
99.0%
0.0%
0.0%
0.0%
Dillard5,859 486 5,183 2,394 2,533 139 1,320 1,074
2,861 189 2,582 1,169 1,235 66 434 735
2,998 297 2,601 1,225 1,298 73 886 339
Total Population
Less than 4 feet of floodwater
4+ feet of floodwater
42.4%
59.5%
26.1%
52.1%
35.1%
68.3%
5.5%
5.3%
5.6%
3.2%
3.1%
3.3%
190
90
100
88.5%
90.2%
86.8%
8.3%
6.6%
9.9%
East Carrollton4,771 3,116 1,435 2,331 2,524 193 907 1,424
4,771 3,116 1,435 2,331 2,524 193 907 1,424
0 0 0 0 0 0 0 0
Total Population
Less than 4 feet of floodwater
4+ feet of floodwater
56.4%
56.4%
0.0%
35.9%
35.9%
0.0%
7.6%
7.6%
0.0%
4.6%
4.6%
0.0%
220
220
0
30.1%
30.1%
0.0%
65.3%
65.3%
0.0%
Page 3 of 12
Total White Black HouseholdsHousing
UnitsVacant Housing
Owner Occupied
Renter OccupiedOther
Hurricane Katrina - Orleans Parish - 08/31/2005 Water Depth
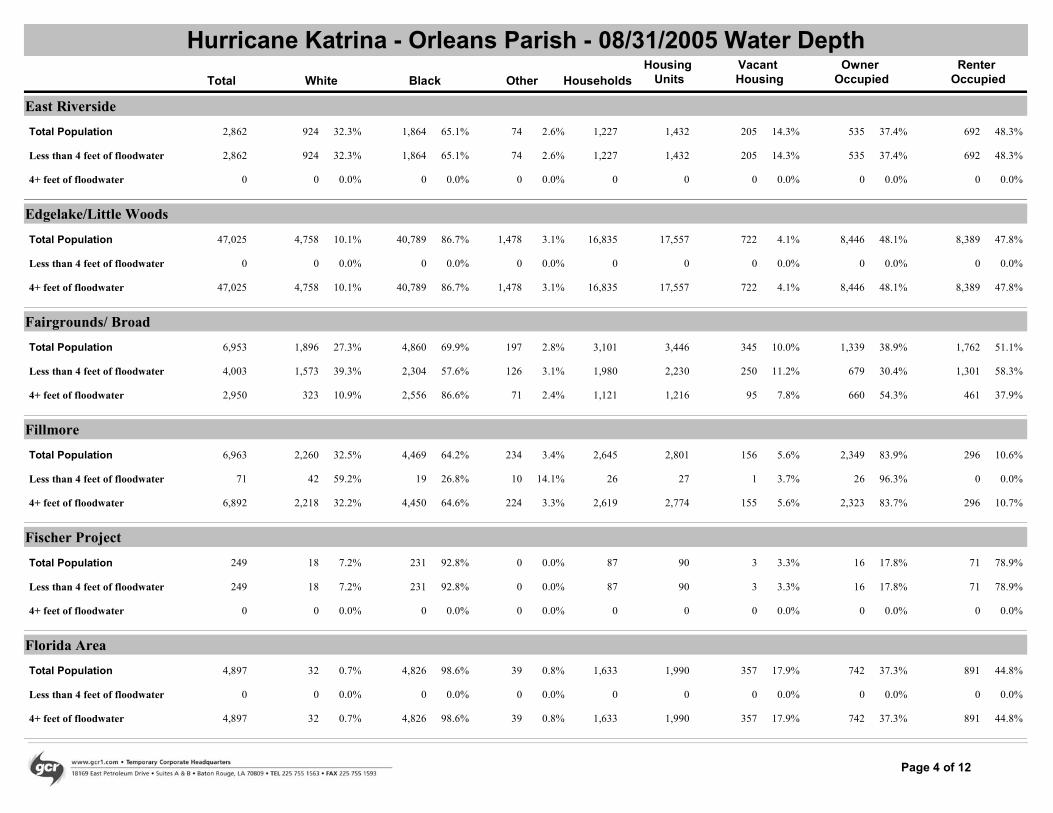
East Riverside2,862 924 1,864 1,227 1,432 205 535 692
2,862 924 1,864 1,227 1,432 205 535 692
0 0 0 0 0 0 0 0
Total Population
Less than 4 feet of floodwater
4+ feet of floodwater
48.3%
48.3%
0.0%
37.4%
37.4%
0.0%
14.3%
14.3%
0.0%
2.6%
2.6%
0.0%
74
74
0
65.1%
65.1%
0.0%
32.3%
32.3%
0.0%
Edgelake/Little Woods
47,025 4,758 40,789 16,835 17,557 722 8,446 8,389
0 0 0 0 0 0 0 0
47,025 4,758 40,789 16,835 17,557 722 8,446 8,389
Total Population
Less than 4 feet of floodwater
4+ feet of floodwater
47.8%
0.0%
47.8%
48.1%
0.0%
48.1%
4.1%
0.0%
4.1%
3.1%
0.0%
3.1%
1,478
0
1,478
86.7%
0.0%
86.7%
10.1%
0.0%
10.1%
Fairgrounds/ Broad6,953 1,896 4,860 3,101 3,446 345 1,339 1,762
4,003 1,573 2,304 1,980 2,230 250 679 1,301
2,950 323 2,556 1,121 1,216 95 660 461
Total Population
Less than 4 feet of floodwater
4+ feet of floodwater
51.1%
58.3%
37.9%
38.9%
30.4%
54.3%
10.0%
11.2%
7.8%
2.8%
3.1%
2.4%
197
126
71
69.9%
57.6%
86.6%
27.3%
39.3%
10.9%
Fillmore6,963 2,260 4,469 2,645 2,801 156 2,349 296
71 42 19 26 27 1 26 0
6,892 2,218 4,450 2,619 2,774 155 2,323 296
Total Population
Less than 4 feet of floodwater
4+ feet of floodwater
10.6%
0.0%
10.7%
83.9%
96.3%
83.7%
5.6%
3.7%
5.6%
3.4%
14.1%
3.3%
234
10
224
64.2%
26.8%
64.6%
32.5%
59.2%
32.2%
Fischer Project249 18 231 87 90 3 16 71
249 18 231 87 90 3 16 71
0 0 0 0 0 0 0 0
Total Population
Less than 4 feet of floodwater
4+ feet of floodwater
78.9%
78.9%
0.0%
17.8%
17.8%
0.0%
3.3%
3.3%
0.0%
0.0%
0.0%
0.0%
0
0
0
92.8%
92.8%
0.0%
7.2%
7.2%
0.0%
Florida Area4,897 32 4,826 1,633 1,990 357 742 891
0 0 0 0 0 0 0 0
4,897 32 4,826 1,633 1,990 357 742 891
Total Population
Less than 4 feet of floodwater
4+ feet of floodwater
44.8%
0.0%
44.8%
37.3%
0.0%
37.3%
17.9%
0.0%
17.9%
0.8%
0.0%
0.8%
39
0
39
98.6%
0.0%
98.6%
0.7%
0.0%
0.7%
Page 4 of 12
Total White Black HouseholdsHousing
UnitsVacant Housing
Owner Occupied
Renter OccupiedOther
Hurricane Katrina - Orleans Parish - 08/31/2005 Water Depth
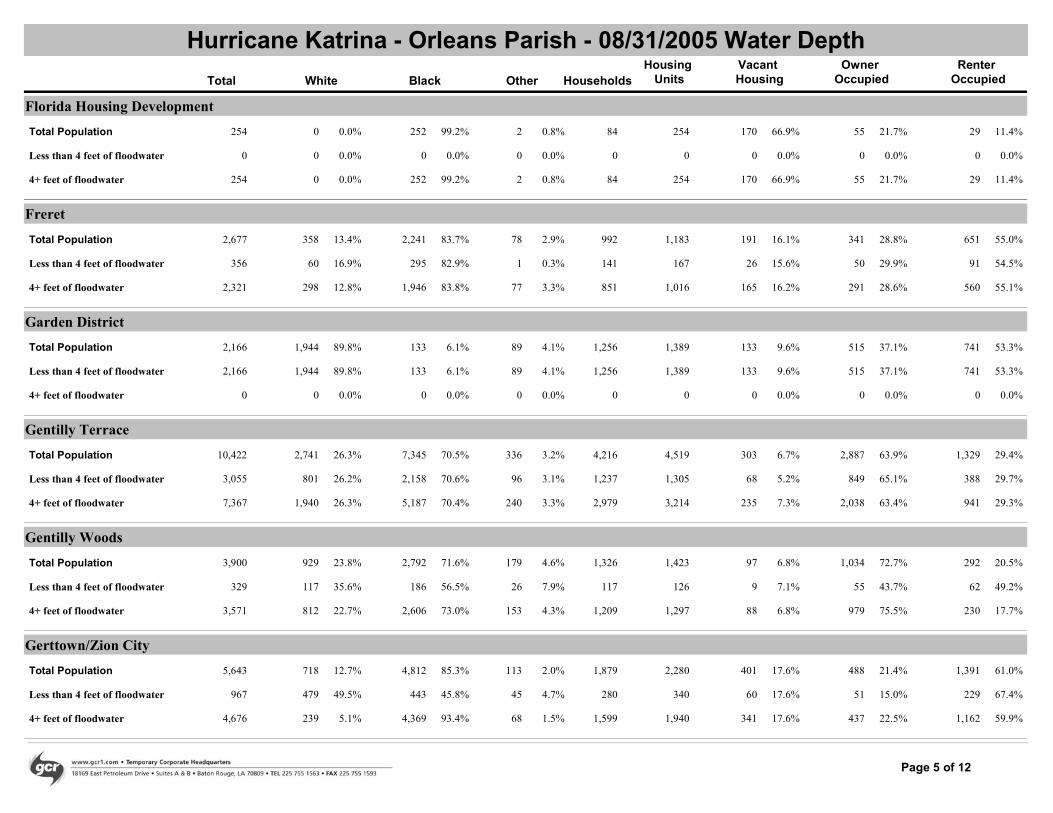
Florida Housing Development254 0 252 84 254 170 55 29
0 0 0 0 0 0 0 0
254 0 252 84 254 170 55 29
Total Population
Less than 4 feet of floodwater
4+ feet of floodwater
11.4%
0.0%
11.4%
21.7%
0.0%
21.7%
66.9%
0.0%
66.9%
0.8%
0.0%
0.8%
2
0
2
99.2%
0.0%
99.2%
0.0%
0.0%
0.0%
Freret
2,677 358 2,241 992 1,183 191 341 651
356 60 295 141 167 26 50 91
2,321 298 1,946 851 1,016 165 291 560
Total Population
Less than 4 feet of floodwater
4+ feet of floodwater
55.0%
54.5%
55.1%
28.8%
29.9%
28.6%
16.1%
15.6%
16.2%
2.9%
0.3%
3.3%
78
1
77
83.7%
82.9%
83.8%
13.4%
16.9%
12.8%
Garden District2,166 1,944 133 1,256 1,389 133 515 741
2,166 1,944 133 1,256 1,389 133 515 741
0 0 0 0 0 0 0 0
Total Population
Less than 4 feet of floodwater
4+ feet of floodwater
53.3%
53.3%
0.0%
37.1%
37.1%
0.0%
9.6%
9.6%
0.0%
4.1%
4.1%
0.0%
89
89
0
6.1%
6.1%
0.0%
89.8%
89.8%
0.0%
Gentilly Terrace10,422 2,741 7,345 4,216 4,519 303 2,887 1,329
3,055 801 2,158 1,237 1,305 68 849 388
7,367 1,940 5,187 2,979 3,214 235 2,038 941
Total Population
Less than 4 feet of floodwater
4+ feet of floodwater
29.4%
29.7%
29.3%
63.9%
65.1%
63.4%
6.7%
5.2%
7.3%
3.2%
3.1%
3.3%
336
96
240
70.5%
70.6%
70.4%
26.3%
26.2%
26.3%
Gentilly Woods3,900 929 2,792 1,326 1,423 97 1,034 292
329 117 186 117 126 9 55 62
3,571 812 2,606 1,209 1,297 88 979 230
Total Population
Less than 4 feet of floodwater
4+ feet of floodwater
20.5%
49.2%
17.7%
72.7%
43.7%
75.5%
6.8%
7.1%
6.8%
4.6%
7.9%
4.3%
179
26
153
71.6%
56.5%
73.0%
23.8%
35.6%
22.7%
Gerttown/Zion City5,643 718 4,812 1,879 2,280 401 488 1,391
967 479 443 280 340 60 51 229
4,676 239 4,369 1,599 1,940 341 437 1,162
Total Population
Less than 4 feet of floodwater
4+ feet of floodwater
61.0%
67.4%
59.9%
21.4%
15.0%
22.5%
17.6%
17.6%
17.6%
2.0%
4.7%
1.5%
113
45
68
85.3%
45.8%
93.4%
12.7%
49.5%
5.1%
Page 5 of 12

Total White Black HouseholdsHousing
UnitsVacant Housing
Owner Occupied
Renter OccupiedOther
Hurricane Katrina - Orleans Parish - 08/31/2005 Water Depth
Hollygrove7,055 230 6,720 2,698 3,032 334 1,474 1,224
2 1 0 1 1 0 0 1
7,053 229 6,720 2,697 3,031 334 1,474 1,223
Total Population
Less than 4 feet of floodwater
4+ feet of floodwater
40.4%
100.0%
40.3%
48.6%
0.0%
48.6%
11.0%
0.0%
11.0%
1.5%
50.0%
1.5%
105
1
104
95.3%
0.0%
95.3%
3.3%
50.0%
3.2%
Holy Cross
4,802 508 4,190 1,753 2,077 324 724 1,029
4,802 508 4,190 1,753 2,077 324 724 1,029
0 0 0 0 0 0 0 0
Total Population
Less than 4 feet of floodwater
4+ feet of floodwater
49.5%
49.5%
0.0%
34.9%
34.9%
0.0%
15.6%
15.6%
0.0%
2.2%
2.2%
0.0%
104
104
0
87.3%
87.3%
0.0%
10.6%
10.6%
0.0%
Iberville Project2,349 19 2,316 768 852 84 4 764
2,349 19 2,316 768 852 84 4 764
0 0 0 0 0 0 0 0
Total Population
Less than 4 feet of floodwater
4+ feet of floodwater
89.7%
89.7%
0.0%
0.5%
0.5%
0.0%
9.9%
9.9%
0.0%
0.6%
0.6%
0.0%
14
14
0
98.6%
98.6%
0.0%
0.8%
0.8%
0.0%
Irish Channel3,746 843 2,786 1,468 1,721 253 582 886
3,746 843 2,786 1,468 1,721 253 582 886
0 0 0 0 0 0 0 0
Total Population
Less than 4 feet of floodwater
4+ feet of floodwater
51.5%
51.5%
0.0%
33.8%
33.8%
0.0%
14.7%
14.7%
0.0%
3.1%
3.1%
0.0%
117
117
0
74.4%
74.4%
0.0%
22.5%
22.5%
0.0%
Lake Terrace/Lake Oaks3,345 2,316 682 1,257 1,326 69 868 389
1,883 1,377 405 585 605 20 554 31
1,462 939 277 672 721 49 314 358
Total Population
Less than 4 feet of floodwater
4+ feet of floodwater
29.3%
5.1%
49.7%
65.5%
91.6%
43.6%
5.2%
3.3%
6.8%
10.4%
5.4%
16.8%
347
101
246
20.4%
21.5%
18.9%
69.2%
73.1%
64.2%
Lakeshore/Lake Vista3,698 3,556 23 1,557 1,657 100 1,318 239
2,948 2,848 11 1,243 1,319 76 1,062 181
750 708 12 314 338 24 256 58
Total Population
Less than 4 feet of floodwater
4+ feet of floodwater
14.4%
13.7%
17.2%
79.5%
80.5%
75.7%
6.0%
5.8%
7.1%
3.2%
3.0%
4.0%
119
89
30
0.6%
0.4%
1.6%
96.2%
96.6%
94.4%
Page 6 of 12

Total White Black HouseholdsHousing
UnitsVacant Housing
Owner Occupied
Renter OccupiedOther
Hurricane Katrina - Orleans Parish - 08/31/2005 Water Depth
Lakeview10,006 9,698 74 4,604 4,883 279 3,198 1,406
0 0 0 0 0 0 0 0
10,006 9,698 74 4,604 4,883 279 3,198 1,406
Total Population
Less than 4 feet of floodwater
4+ feet of floodwater
28.8%
0.0%
28.8%
65.5%
0.0%
65.5%
5.7%
0.0%
5.7%
2.3%
0.0%
2.3%
234
0
234
0.7%
0.0%
0.7%
96.9%
0.0%
96.9%
Lakewood/West End
4,834 4,563 82 2,529 2,817 288 1,552 977
229 221 1 159 265 106 84 75
4,605 4,342 81 2,370 2,552 182 1,468 902
Total Population
Less than 4 feet of floodwater
4+ feet of floodwater
34.7%
28.3%
35.3%
55.1%
31.7%
57.5%
10.2%
40.0%
7.1%
3.9%
3.1%
4.0%
189
7
182
1.7%
0.4%
1.8%
94.4%
96.5%
94.3%
Leonidas/ West Carrollton8,948 2,225 6,436 3,715 4,218 503 1,484 2,231
7,152 1,919 4,988 3,023 3,453 430 1,165 1,858
1,796 306 1,448 692 765 73 319 373
Total Population
Less than 4 feet of floodwater
4+ feet of floodwater
52.9%
53.8%
48.8%
35.2%
33.7%
41.7%
11.9%
12.5%
9.5%
3.2%
3.4%
2.3%
287
245
42
71.9%
69.7%
80.6%
24.9%
26.8%
17.0%
Lower Ninth ward14,174 87 13,961 4,878 5,671 793 2,863 2,015
4,577 58 4,473 1,581 1,872 291 850 731
9,597 29 9,488 3,297 3,799 502 2,013 1,284
Total Population
Less than 4 feet of floodwater
4+ feet of floodwater
35.5%
39.0%
33.8%
50.5%
45.4%
53.0%
14.0%
15.5%
13.2%
0.9%
1.0%
0.8%
126
46
80
98.5%
97.7%
98.9%
0.6%
1.3%
0.3%
Marigny3,368 2,618 565 2,115 2,576 461 688 1,427
3,368 2,618 565 2,115 2,576 461 688 1,427
0 0 0 0 0 0 0 0
Total Population
Less than 4 feet of floodwater
4+ feet of floodwater
55.4%
55.4%
0.0%
26.7%
26.7%
0.0%
17.9%
17.9%
0.0%
5.5%
5.5%
0.0%
185
185
0
16.8%
16.8%
0.0%
77.7%
77.7%
0.0%
Marlyville/Fountainebleau6,437 4,381 1,738 2,931 3,183 252 1,625 1,306
2,950 2,087 705 1,375 1,490 115 713 662
3,487 2,294 1,033 1,556 1,693 137 912 644
Total Population
Less than 4 feet of floodwater
4+ feet of floodwater
41.0%
44.4%
38.0%
51.1%
47.9%
53.9%
7.9%
7.7%
8.1%
4.9%
5.4%
4.6%
318
158
160
27.0%
23.9%
29.6%
68.1%
70.7%
65.8%
Page 7 of 12

Total White Black HouseholdsHousing
UnitsVacant Housing
Owner Occupied
Renter OccupiedOther
Hurricane Katrina - Orleans Parish - 08/31/2005 Water Depth
Mc Donogh2,755 258 2,451 1,028 1,371 343 493 535
2,755 258 2,451 1,028 1,371 343 493 535
0 0 0 0 0 0 0 0
Total Population
Less than 4 feet of floodwater
4+ feet of floodwater
39.0%
39.0%
0.0%
36.0%
36.0%
0.0%
25.0%
25.0%
0.0%
1.7%
1.7%
0.0%
46
46
0
89.0%
89.0%
0.0%
9.4%
9.4%
0.0%
Mid-City
20,267 5,483 13,326 5,877 6,792 915 1,633 4,244
287 230 36 167 191 24 66 101
19,980 5,253 13,290 5,710 6,601 891 1,567 4,143
Total Population
Less than 4 feet of floodwater
4+ feet of floodwater
62.5%
52.9%
62.8%
24.0%
34.6%
23.7%
13.5%
12.6%
13.5%
7.2%
7.3%
7.2%
1,458
21
1,437
65.8%
12.5%
66.5%
27.1%
80.1%
26.3%
Milan6,910 1,543 5,162 2,893 3,475 582 977 1,916
2,541 1,108 1,312 1,171 1,440 269 381 790
4,369 435 3,850 1,722 2,035 313 596 1,126
Total Population
Less than 4 feet of floodwater
4+ feet of floodwater
55.1%
54.9%
55.3%
28.1%
26.5%
29.3%
16.7%
18.7%
15.4%
3.0%
4.8%
1.9%
205
121
84
74.7%
51.6%
88.1%
22.3%
43.6%
10.0%
Milneburg5,795 1,185 4,384 2,257 2,434 177 1,606 651
0 0 0 0 0 0 0 0
5,795 1,185 4,384 2,257 2,434 177 1,606 651
Total Population
Less than 4 feet of floodwater
4+ feet of floodwater
26.7%
0.0%
26.7%
66.0%
0.0%
66.0%
7.3%
0.0%
7.3%
3.9%
0.0%
3.9%
226
0
226
75.7%
0.0%
75.7%
20.4%
0.0%
20.4%
Navarre2,789 2,543 113 1,433 1,513 80 763 670
355 279 42 201 212 11 67 134
2,434 2,264 71 1,232 1,301 69 696 536
Total Population
Less than 4 feet of floodwater
4+ feet of floodwater
44.3%
63.2%
41.2%
50.4%
31.6%
53.5%
5.3%
5.2%
5.3%
4.8%
9.6%
4.1%
133
34
99
4.1%
11.8%
2.9%
91.2%
78.6%
93.0%
Pines Village5,363 502 4,745 1,755 1,921 166 1,036 719
598 65 493 216 246 30 52 164
4,765 437 4,252 1,539 1,675 136 984 555
Total Population
Less than 4 feet of floodwater
4+ feet of floodwater
37.4%
66.7%
33.1%
53.9%
21.1%
58.7%
8.6%
12.2%
8.1%
2.2%
6.7%
1.6%
116
40
76
88.5%
82.4%
89.2%
9.4%
10.9%
9.2%
Page 8 of 12

Total White Black HouseholdsHousing
UnitsVacant Housing
Owner Occupied
Renter OccupiedOther
Hurricane Katrina - Orleans Parish - 08/31/2005 Water Depth
Plum Orchard7,303 388 6,770 2,556 2,833 277 1,401 1,155
549 77 445 181 236 55 43 138
6,754 311 6,325 2,375 2,597 222 1,358 1,017
Total Population
Less than 4 feet of floodwater
4+ feet of floodwater
40.8%
58.5%
39.2%
49.5%
18.2%
52.3%
9.8%
23.3%
8.5%
2.0%
4.9%
1.7%
145
27
118
92.7%
81.1%
93.6%
5.3%
14.0%
4.6%
Ponchartrain Park
3,131 226 2,807 1,169 1,226 57 1,021 148
2 2 0 0 0 0 0 0
3,129 224 2,807 1,169 1,226 57 1,021 148
Total Population
Less than 4 feet of floodwater
4+ feet of floodwater
12.1%
0.0%
12.1%
83.3%
0.0%
83.3%
4.6%
0.0%
4.6%
3.1%
0.0%
3.1%
98
0
98
89.7%
0.0%
89.7%
7.2%
100.0%
7.2%
Read Boulevard East7,561 1,271 5,626 2,486 2,560 74 2,358 128
2 2 0 1 1 0 1 0
7,559 1,269 5,626 2,485 2,559 74 2,357 128
Total Population
Less than 4 feet of floodwater
4+ feet of floodwater
5.0%
0.0%
5.0%
92.1%
100.0%
92.1%
2.9%
0.0%
2.9%
8.8%
0.0%
8.8%
664
0
664
74.4%
0.0%
74.4%
16.8%
100.0%
16.8%
Read Boulevard West13,947 1,182 12,503 5,098 5,550 452 2,530 2,568
8 0 5 3 5 2 2 1
13,939 1,182 12,498 5,095 5,545 450 2,528 2,567
Total Population
Less than 4 feet of floodwater
4+ feet of floodwater
46.3%
20.0%
46.3%
45.6%
40.0%
45.6%
8.1%
40.0%
8.1%
1.9%
37.5%
1.9%
262
3
259
89.6%
62.5%
89.7%
8.5%
0.0%
8.5%
River Park/Cut Off/Lower Coast4,697 977 3,337 1,420 1,522 102 1,168 252
4,697 977 3,337 1,420 1,522 102 1,168 252
0 0 0 0 0 0 0 0
Total Population
Less than 4 feet of floodwater
4+ feet of floodwater
16.6%
16.6%
0.0%
76.7%
76.7%
0.0%
6.7%
6.7%
0.0%
8.2%
8.2%
0.0%
383
383
0
71.0%
71.0%
0.0%
20.8%
20.8%
0.0%
Seventh Ward16,951 673 15,891 6,600 7,878 1,278 2,184 4,416
10,012 594 9,201 3,832 4,655 823 1,119 2,713
6,939 79 6,690 2,768 3,223 455 1,065 1,703
Total Population
Less than 4 feet of floodwater
4+ feet of floodwater
56.1%
58.3%
52.8%
27.7%
24.0%
33.0%
16.2%
17.7%
14.1%
2.3%
2.2%
2.4%
387
217
170
93.7%
91.9%
96.4%
4.0%
5.9%
1.1%
Page 9 of 12

Total White Black HouseholdsHousing
UnitsVacant Housing
Owner Occupied
Renter OccupiedOther
Hurricane Katrina - Orleans Parish - 08/31/2005 Water Depth
Sixth Ward/Treme/Lafitte9,121 925 8,044 3,681 4,704 1,023 804 2,877
4,699 882 3,706 2,063 2,773 710 599 1,464
4,422 43 4,338 1,618 1,931 313 205 1,413
Total Population
Less than 4 feet of floodwater
4+ feet of floodwater
61.2%
52.8%
73.2%
17.1%
21.6%
10.6%
21.7%
25.6%
16.2%
1.7%
2.4%
0.9%
152
111
41
88.2%
78.9%
98.1%
10.1%
18.8%
1.0%
St. Anthony
4,891 1,488 3,108 2,026 2,325 299 1,240 786
0 0 0 0 0 0 0 0
4,891 1,488 3,108 2,026 2,325 299 1,240 786
Total Population
Less than 4 feet of floodwater
4+ feet of floodwater
33.8%
0.0%
33.8%
53.3%
0.0%
53.3%
12.9%
0.0%
12.9%
6.0%
0.0%
6.0%
295
0
295
63.5%
0.0%
63.5%
30.4%
0.0%
30.4%
St. Bernard Area/ Project6,539 93 6,396 2,083 2,293 210 438 1,645
284 5 272 105 116 11 65 40
6,255 88 6,124 1,978 2,177 199 373 1,605
Total Population
Less than 4 feet of floodwater
4+ feet of floodwater
71.7%
34.5%
73.7%
19.1%
56.0%
17.1%
9.2%
9.5%
9.1%
0.8%
2.5%
0.7%
50
7
43
97.8%
95.8%
97.9%
1.4%
1.8%
1.4%
St. Claude11,996 1,053 10,745 4,296 5,095 799 1,873 2,423
9,425 1,015 8,244 3,381 4,034 653 1,431 1,950
2,571 38 2,501 915 1,061 146 442 473
Total Population
Less than 4 feet of floodwater
4+ feet of floodwater
47.6%
48.3%
44.6%
36.8%
35.5%
41.7%
15.7%
16.2%
13.8%
1.7%
1.8%
1.2%
198
166
32
89.6%
87.5%
97.3%
8.8%
10.8%
1.5%
St. Roch11,877 579 11,001 4,264 5,129 865 1,762 2,502
4,390 314 3,958 1,620 1,975 355 532 1,088
7,487 265 7,043 2,644 3,154 510 1,230 1,414
Total Population
Less than 4 feet of floodwater
4+ feet of floodwater
48.8%
55.1%
44.8%
34.4%
26.9%
39.0%
16.9%
18.0%
16.2%
2.5%
2.7%
2.4%
297
118
179
92.6%
90.2%
94.1%
4.9%
7.2%
3.5%
St. Thomas Area/Lower Garden District4,101 2,249 1,590 2,143 2,462 319 596 1,547
4,101 2,249 1,590 2,143 2,462 319 596 1,547
0 0 0 0 0 0 0 0
Total Population
Less than 4 feet of floodwater
4+ feet of floodwater
62.8%
62.8%
0.0%
24.2%
24.2%
0.0%
13.0%
13.0%
0.0%
6.4%
6.4%
0.0%
262
262
0
38.8%
38.8%
0.0%
54.8%
54.8%
0.0%
Page 10 of 12
Total White Black HouseholdsHousing
UnitsVacant Housing
Owner Occupied
Renter OccupiedOther
Hurricane Katrina - Orleans Parish - 08/31/2005 Water Depth
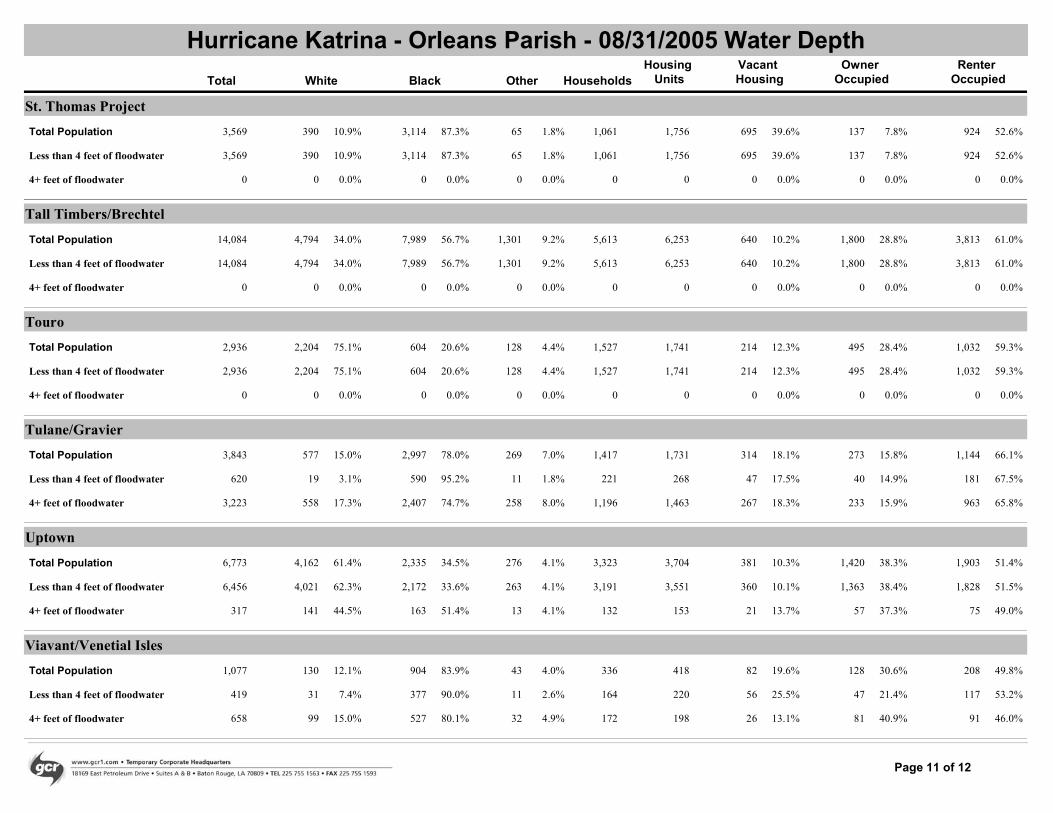
St. Thomas Project3,569 390 3,114 1,061 1,756 695 137 924
3,569 390 3,114 1,061 1,756 695 137 924
0 0 0 0 0 0 0 0
Total Population
Less than 4 feet of floodwater
4+ feet of floodwater
52.6%
52.6%
0.0%
7.8%
7.8%
0.0%
39.6%
39.6%
0.0%
1.8%
1.8%
0.0%
65
65
0
87.3%
87.3%
0.0%
10.9%
10.9%
0.0%
Tall Timbers/Brechtel
14,084 4,794 7,989 5,613 6,253 640 1,800 3,813
14,084 4,794 7,989 5,613 6,253 640 1,800 3,813
0 0 0 0 0 0 0 0
Total Population
Less than 4 feet of floodwater
4+ feet of floodwater
61.0%
61.0%
0.0%
28.8%
28.8%
0.0%
10.2%
10.2%
0.0%
9.2%
9.2%
0.0%
1,301
1,301
0
56.7%
56.7%
0.0%
34.0%
34.0%
0.0%
Touro2,936 2,204 604 1,527 1,741 214 495 1,032
2,936 2,204 604 1,527 1,741 214 495 1,032
0 0 0 0 0 0 0 0
Total Population
Less than 4 feet of floodwater
4+ feet of floodwater
59.3%
59.3%
0.0%
28.4%
28.4%
0.0%
12.3%
12.3%
0.0%
4.4%
4.4%
0.0%
128
128
0
20.6%
20.6%
0.0%
75.1%
75.1%
0.0%
Tulane/Gravier3,843 577 2,997 1,417 1,731 314 273 1,144
620 19 590 221 268 47 40 181
3,223 558 2,407 1,196 1,463 267 233 963
Total Population
Less than 4 feet of floodwater
4+ feet of floodwater
66.1%
67.5%
65.8%
15.8%
14.9%
15.9%
18.1%
17.5%
18.3%
7.0%
1.8%
8.0%
269
11
258
78.0%
95.2%
74.7%
15.0%
3.1%
17.3%
Uptown6,773 4,162 2,335 3,323 3,704 381 1,420 1,903
6,456 4,021 2,172 3,191 3,551 360 1,363 1,828
317 141 163 132 153 21 57 75
Total Population
Less than 4 feet of floodwater
4+ feet of floodwater
51.4%
51.5%
49.0%
38.3%
38.4%
37.3%
10.3%
10.1%
13.7%
4.1%
4.1%
4.1%
276
263
13
34.5%
33.6%
51.4%
61.4%
62.3%
44.5%
Viavant/Venetial Isles1,077 130 904 336 418 82 128 208
419 31 377 164 220 56 47 117
658 99 527 172 198 26 81 91
Total Population
Less than 4 feet of floodwater
4+ feet of floodwater
49.8%
53.2%
46.0%
30.6%
21.4%
40.9%
19.6%
25.5%
13.1%
4.0%
2.6%
4.9%
43
11
32
83.9%
90.0%
80.1%
12.1%
7.4%
15.0%
Page 11 of 12
Total White Black HouseholdsHousing
UnitsVacant Housing
Owner Occupied
Renter OccupiedOther
Hurricane Katrina - Orleans Parish - 08/31/2005 Water Depth
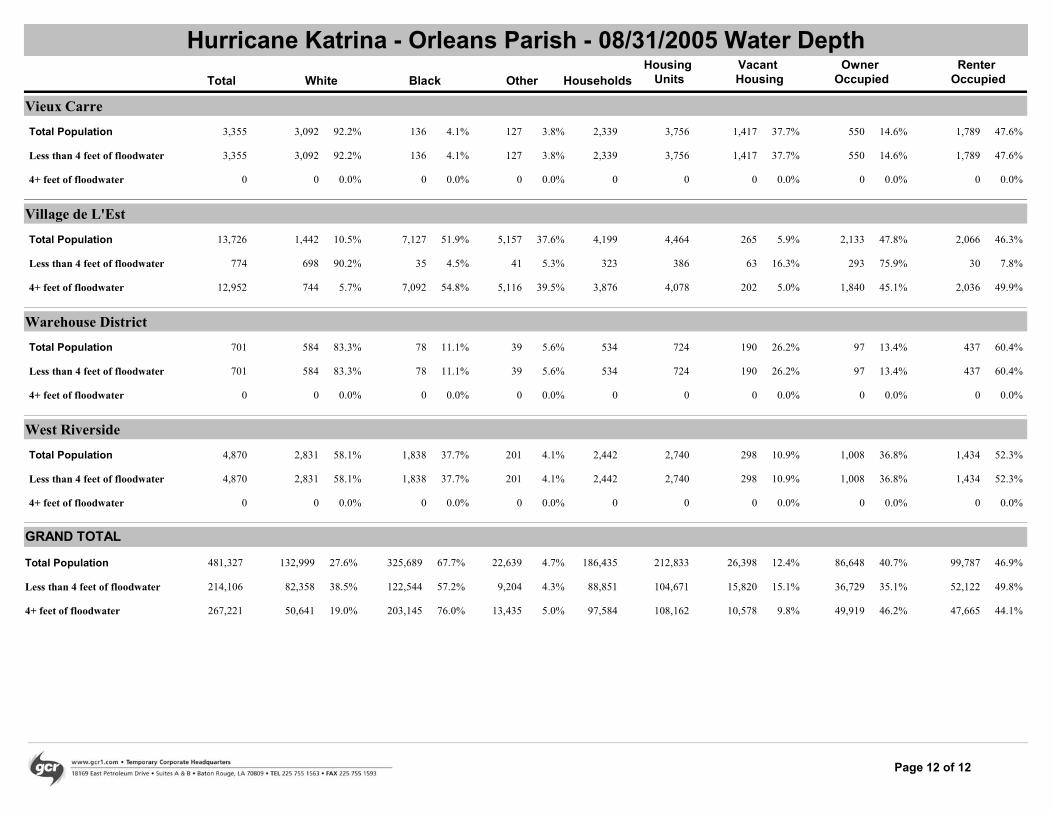
Vieux Carre3,355 3,092 136 2,339 3,756 1,417 550 1,789
3,355 3,092 136 2,339 3,756 1,417 550 1,789
0 0 0 0 0 0 0 0
Total Population
Less than 4 feet of floodwater
4+ feet of floodwater
47.6%
47.6%
0.0%
14.6%
14.6%
0.0%
37.7%
37.7%
0.0%
3.8%
3.8%
0.0%
127
127
0
4.1%
4.1%
0.0%
92.2%
92.2%
0.0%
Village de L'Est
13,726 1,442 7,127 4,199 4,464 265 2,133 2,066
774 698 35 323 386 63 293 30
12,952 744 7,092 3,876 4,078 202 1,840 2,036
Total Population
Less than 4 feet of floodwater
4+ feet of floodwater
46.3%
7.8%
49.9%
47.8%
75.9%
45.1%
5.9%
16.3%
5.0%
37.6%
5.3%
39.5%
5,157
41
5,116
51.9%
4.5%
54.8%
10.5%
90.2%
5.7%
Warehouse District701 584 78 534 724 190 97 437
701 584 78 534 724 190 97 437
0 0 0 0 0 0 0 0
Total Population
Less than 4 feet of floodwater
4+ feet of floodwater
60.4%
60.4%
0.0%
13.4%
13.4%
0.0%
26.2%
26.2%
0.0%
5.6%
5.6%
0.0%
39
39
0
11.1%
11.1%
0.0%
83.3%
83.3%
0.0%
West Riverside4,870 2,831 1,838 2,442 2,740 298 1,008 1,434
4,870 2,831 1,838 2,442 2,740 298 1,008 1,434
0 0 0 0 0 0 0 0
Total Population
Less than 4 feet of floodwater
4+ feet of floodwater
52.3%
52.3%
0.0%
36.8%
36.8%
0.0%
10.9%
10.9%
0.0%
4.1%
4.1%
0.0%
201
201
0
37.7%
37.7%
0.0%
58.1%
58.1%
0.0%
481,327 132,999 325,689 186,435 212,833 26,398 86,648 99,787
214,106 82,358 122,544 88,851 104,671 15,820 36,729 52,122
267,221 50,641 203,145 97,584 108,162 10,578 49,919 47,665
Total Population
Less than 4 feet of floodwater
4+ feet of floodwater
46.9%
49.8%
44.1%
40.7%
35.1%
46.2%
12.4%
15.1%
9.8%
4.7%
4.3%
5.0%
22,639
9,204
13,435
67.7%
57.2%
76.0%
27.6%
38.5%
19.0%
GRAND TOTAL
Page 12 of 12