hunter questionnaire improvement report - azgfd questionnaire improvement report...hunter...
TRANSCRIPT

ARIZONA GAME AND FISH DEPARTMENT
HUNTER QUESTIONNAIRE IMPROVEMENT REPORT
December 16, 2008
Team Members:
Amber Munig, WMGM Todd Pringle, WMFS Linda Melker, SSIS Tom McCall, FOR2 Team Leader: Brian Wakeling, WMGM Team Sponsor: Bob Broscheid, WMHQ

Hunter Questionnaire Improvement Report 1
HUNTER QUESTIONNAIRE IMPROVEMENT REPORT
EXECUTIVE SUMMARY
The Arizona Game and Fish Department (Department) currently uses a business-reply postcard questionnaire to survey hunters about harvest, methods, and effort. This technique has been used by the Department for over 45 years. This costs the Department approximately $110,000–120,000 annually. Harvest estimates are relatively precise (generally ±5–9% for individual units, <3% statewide), but questionnaires probably overestimate (bias) harvest by 5–10% (successful applicants that participate in a hunt are more likely to return questionnaires than those that do not participate, and successful hunters are more likely to return questionnaires than unsuccessful hunters; this is known as nonresponse bias). Statewide, estimates of general season deer harvest are typically ±0.4%, although overestimated by 10% (in 2007, the estimate was 9,750 deer harvested statewide during general seasons, ±39 deer, although it was probably overestimated by 975 deer). A reasonable estimate of 2007 statewide general deer harvest was 8,736–8,814. To increase response rates by 20% for general deer alone using the existing system would increase costs by 32% ($19,800 to $29,100) and improve precision by less than 1% (typically ±1–2 deer per hunt area). Increasing hunter questionnaire survey intensity within the current system seems unnecessary. We compared the existing process used by Arizona with available information from Colorado, Nevada, New Mexico, South Dakota, Utah, and Washington. We developed and evaluated 5 alternatives that range from the existing questionnaire process, including the option to respond via the web, implementing a multiple-wave mail out with the option of responding via the web, using an interactive voice recorder system, or mandatory reporting by website or telephone. We recommend that the Department pursue the ability to accept responses to hunter questionnaires via the website, while retaining the current business-reply postcard. We recommend avoiding additional mandatory reporting requirements. When Point of Sale (POS) and online systems become available, exploring additional electronic survey mechanisms will be appropriate, but should be implemented in a staged fashion while maintaining existing surveys to evaluate differences in precision, bias, and public acceptance. Establishing POS and online systems will be the most costly (current estimates >$400,000). Current mail out costs ($85,000–90,000 annually) will be reduced by the proportion of applicants that receive and respond to questionnaire electronically. Although technically the hunter questionnaire process is statistically robust, the acceptance of the system and data quality by the public presents an adaptive challenge. Information presented within this report should be shared with the public through e-newsletters, print media including our own magazine, and television. The extent of distrust with the existing system should be determined through a subsequent survey. If the distrust is limited, no further action may be warranted. However, if distrust is broad, a small group of constituents should be convened that represent a broad cross section of vocal and generally silent customer segments. This group should be provided with legitimate agency sideboards and facilitation assistance, and the Department should be prepared to implement recommendations from this group.

Hunter Questionnaire Improvement Report 2
HUNTER QUESTIONNAIRE IMPROVEMENT REPORT
The Arizona Game and Fish Commission annually set goals and objectives for the Director. On May 1, 2008 the Commission approved the following goal: Goal 4: Develop a strategy to enhance [the] precision [of] harvest data and the public’s
acceptance of the big game harvest estimate; and work towards the development of an online
ability to recover harvest and other hunting related data.
A cross-functional task team was established and met on June 18, 2008 to initiate discussion on enhancing the precision of the harvest questionnaire data and the public's acceptance of the harvest estimate. The team subsequently evaluated the precision of our harvest data and the feasibility of an online questionnaire, which included an analysis of the advantages and challenges of amending the current voluntary mail questionnaire. This report presents the Arizona Game and Fish Department's (Department's) current precision of harvest data for each species or species group, an evaluation of precision derived from other states' comparative data, cost estimates for obtaining similar data through other means (such as electronic data collection), and an evaluation of benefits and challenges for possible amendments to the current questionnaire process. This report analyzes a range of alternatives for implementing amendments to the hunter questionnaire process and recommends a course of action. The biggest challenge to any process is improving public acceptance of that data. The report includes recommendations by which the public may become more familiar with and accepting of these processes. Current Hunter Questionnaire Process in Arizona The Department estimates harvest numbers and hunter activity levels through a series of hunter report questionnaires. During a typical year, 16–20 different questionnaires are mailed to hunters; 4 game species have mandatory checkouts. Each questionnaire is designed to provide information necessary to evaluate seasonal hunter activities and to judge programs designed to manage game animal populations. The questionnaire process was implemented in 1958, after an evaluation of the method against the hunter report card (attached to the tag itself) method that was used in the 1940s and 1950s. The evaluation showed the mail questionnaire to be more effective in estimating harvest levels than the old report card. Research showed that the use of mailed questionnaires could be used to estimate harvest levels and hunter days afield, as well as provide information on weapon type used, age class and sex of animal(s) killed, area hunted in, and wounding rates. These data were accurate enough to provide trend information to wildlife managers and administrators who then used the data for establishing season dates, bag limits, and weapon types for upcoming hunts. Today, the Department has over 45 years of comparable data on which to base management decisions. Deadline dates have shortened and hunt structures have become more complex, but basically the process remains the same today as in the 1960s and 1970s. This consistency is maintained so long-term trends may be analyzed and appropriate management decisions made.

Hunter Questionnaire Improvement Report 3
Sampling Effort
The questionnaire process is designed to provide wildlife managers and administrators with as accurate and precise data as possible under fiscal and time constraints. With the advent of the permit system in 1971, sampling for big game hunts increased substantially as the area from which inference was drawn was reduced from a statewide level to a hunt area level. The only other substantial shift in sampling paradigm was in 1997–1998 when the game bird questionnaire was discontinued and the Harvest Information Program (HIP) took its place. Current sampling differs primarily by type of hunt (Table 1). Table 1. Sample units and effort for the 18 questionnaires.
Type of Hunt Area of Inference Sample Effort
General deer Hunt area Tag holders, 800 maximum (90–100%) Archery deer Statewide Tag sales (about 65%) Antelope Hunt area Tag holders (100%; 2 wave) General elk Hunt area Tag holders (100%) Archery elk Hunt area Tag holders (100%) Fall turkey Hunt area Tag holders (100%) Archery turkey Statewide Tag sales (about 90%) Spring turkey Hunt area Tag holders (100%) Fall javelina Hunt area Tag holders (100%) Spring General javelina Hunt area Tag holders, 800 maximum (90–100%) Spring Archery javelina Hunt area Tag holders, 800 maximum (90–100%) Small game Statewide Class F, G, H licenses (about 7%) Game bird Statewide (Discontinued-Replaced by HIP in 1997) Dove-Band-tailed Pigeon Statewide MGB Stamp sales (about 16%) Waterfowl Statewide WF Stamp holders (about 50–70%) Predator Statewide Specific hunts (3000–5000) Sandhill crane Hunt area Tag holders (100%; 2 wave) Spring bear Hunt area Tag holders (100%; every 3–5 years) Bear or Lion Statewide Tag sales (50%; every 3–5 years; alternating) Archery deer Statewide All successful hunters (mandatory check) Bighorn sheep Hunt area All hunters (mandatory check) Bear Statewide All successful hunters (mandatory check) Lion Statewide All successful hunters (mandatory check)
Generally, a return of 400 questionnaires per area of inference is very robust for calculating harvest, hunt success, and confidence limits. Because return rates for permitted hunts (those with a hunt number) are sometimes as low as 44%, questionnaires are sent to all permit-tag holders in hunts with 800 or fewer permits. Greater numbers of questionnaires are sent for statewide nonpermitted hunts which have even lower return rates and sometimes for permitted hunts that include multiple units. Two-wave mail outs are used for questionnaires such as antelope and sandhill crane since statewide permit-tag levels are less than 1000. Nevertheless, even relatively low numbers of returns can yield reasonably precise estimates of harvest (Figure 1).

Hunter Questionnaire Improvement Report 4
Figure 1. Simulated relationship between precision (± number of animals harvested at 90%
confidence interval [CI]) and number of returns received for a high hunt success unit (341 deer
harvested for 55% success with 650 permits and 95% participation rate), moderate hunt success
(123 deer harvested for 21% hunt success with 600 permits and 95% participation rate), and low
hunt success (59 deer harvested for 14% hunt success with 450 permits and 95% participation rate)
survey results. Although precision continues to improve after 50 returns, most improvement occurs
between 20–50 returns.
Questionnaire mail outs are sent as close to the end of the hunt as possible. Mail outs for permitted hunts are generally within 2 weeks of the end of the hunt, but mail outs for nonpermitted hunts can be up to 3 months after the end of the season. These delays result from late reporting of sales by license dealers and from the time involved in entering the names and addresses. Migratory Game Bird and Waterfowl stamps are returned to Game Branch from the various Department offices for entry. Generally, files for mail outs for those hunts are ready within 1 month of the season's end, or sooner if a partial sample is used. Analysis
The main purpose of the questionnaire process is to provide harvest and hunter activity data. The returns are delivered by business-reply mail, hand sorted into the various seasons, and entered into a database. Raw totals are expanded from the sample to estimate total hunt results by simple linear extrapolation. Information reported in most summaries is numbers of applicants, permits issued, hunters, hunter days, harvest success, questionnaire returns, weapon type use, wounding rates, and multiple unit breakdowns. Sample sizes of returns are frequently less than ideal, particularly for hunts with low permit numbers or when statewide data are subset into individual units with low representation. Nevertheless, most estimates are relatively precise. Precision estimates at the 90% confidence

Hunter Questionnaire Improvement Report 5
level for firearms deer hunts range from ±2.6% to 46.9% and have a median confidence interval (CI) of ± 5.9%; at the statewide level, CIs for deer hunts are ± 0.4%. Hunts with higher CIs are often a reflection of low permit-tag numbers and low returns, which vary by hunt and species (Table 2). Table 2. Ninety percent confidence intervals from the 2007–2008 hunter questionnaires for
statewide and hunt areas for each type of hunt.
Questionnaire Type Total %
CI Median % CI
Lowest % CI (for a specific Hunt)
Highest % CI (for a specific Hunt)
Firearms Deer 0.4 5.9 2.6 46.9 (10 permits) Archery Deer 0.5 3.3 0.8 100 (low returns) Antelope 1.5 11.5 1.8 100 (<4 permits) Firearms Elk 0.6 10.1 3.0 100 (low returns) Archery Elk 1.0 8.4 4.9 100 (<5 permits) Spring Turkey 0.9 7.6 3.0 95.9 (low returns) Fall Turkey 1.0 7.7 1.8 80.6 (5 permits) Archery Turkey 1.6 9.4 0.8 100 (<6 hunters) Spring Firearms Javelina 0.6 7.1 2.8 50.6 Spring Archery Javelina 0.9 4.5 2.2 20.4 Fall Firearms Javelina 2.4 16.7 2.3 100 (low returns) Fall Archery Javelina 2.5 7.1 2.5 22.9 Spring Bear 5.4 20.6 5.5 100 (low returns)
To determine how increased questionnaire returns would affect the precision of our data, we used existing data obtained from hunt questionnaire returns in 2007 to simulate necessary returns to achieve improved precision. We used a 600 permit hunt with 21% hunt success and about a 50% questionnaire return rate for the simulations. Current precision for this hunt was ±3.1% at 90% confidence; which is the same as ±4 deer harvested. By increasing questionnaire return rates to 70% through simulation, precision only improved to ±2.6%; which yields ±3 deer harvested (Figure 2). CIs for this type of data rely on tabular t values for degrees of freedom (sample size) n and an assumption that data will approximate a normal distribution. This approach and assumption is generally used when conducting election polls. The CI is calculated according to the following formula and generates a plus or minus percentage of the estimated harvest (Thompson 1992:36).
CI = Confidence Interval (± % of the estimated harvest).
t = t distribution table value for the selected confidence level and
Degrees of Freedom (sample size – 1).
p = Number of permits issued.
r = Number of questionnaires returned.
s = Hunter success (%).
n = Number of individuals who hunted in the returned questionnaires.
Thompson, S.K. 1992:36. Sampling. John Wiley and Sons, Inc., New York.

Hunter Questionnaire Improvement Report 6
Medium Hunt Success: - 21 % Hunter Success
- 600 permit hunt
- 50 % Questionnaire Return Rate
- Estimated Harvest of 123 Deer
Current Precision at a
90% Confidence Level
± 3.1 % or ± 4 deer
Increase Return Rate by 20% -
Precision at a
90% Confidence Level
± 2.6 % or ± 3 deer
Figure 2. Effect of increasing hunt questionnaire return rates from 50% to 70% on a 600 permit
deer hunt with 95% participation rate yields improved precision of about ±1 deer.
We also looked at what it would cost to increase the questionnaire return rates by 20%. This would involve ordering additional amounts of questionnaires at the onset, costs of a second mailing, and costs of additional questionnaire returns. It currently costs the Department $19,800 to complete the general deer questionnaire. In an attempt to increase the return rates by 20%, it would cost the Department an additional $9,300. Therefore, to increase questionnaire return rates by 20% and improve precision by less than 1% (typically ±1–2 deer per hunt area), it will cost the Department $9,300, or an increased cost of about 32%. Similar simulations were conducted for the low and high hunt success examples presented earlier (see Appendix A). Biases
Various analyses have shown that biases exist within our questionnaire data. Based on multiple-wave mail outs (to increase return rates) and comparisons with hunter checks, check station data, and telephone interviews, it appears that hunter numbers, success, and harvest tend to be overestimated. This results from the fact that tag holders who hunted and those who harvested an animal are more likely to return their questionnaires than are other people in the sample (nonresponse bias) (Table 3). The biases generally result in harvest overestimates of about 10 percent, although it may vary depending on harvest (Munig and Wakeling 2005). Because our methods are consistent, the biases should also be consistent and should therefore not compromise the comparability of data between years or areas. No correction for bias is done. Some difficulty in assignment of sex, wounding, and species has also been noted but generally results

Hunter Questionnaire Improvement Report 7
in errors of less than 5 percent. Fewer permits have been authorized recently, largely in response to declining deer herds. This results in smaller sample sizes, which may influence the bias and precision of harvest estimates. Table 3. Studies and their estimate of the bias associated with hunter questionnaires.
Source
Percent Overestimation
of Hunters
Percent Overestimation
of Harvest
1961 deer field checks (Smith 1962) -- 8.2% 1958–1963 multiple deer mail-outs with extrapolation (Snyder
1963) 12.6% --
1982 Region 3 javelina phone survey (unpublished) -- 10.0% 1983–1987 3-Bar deer check station (unpublished) 5.0% 15.3% 1983–1987 Tonto deer check station (unpublished) 3.3% 8.2% 1984–1987 Kaibab deer check station (unpublished) (assume
100% check-out) -- <13.6%
1990–1991 Unit 8 field checks, deer (unpublished) 4.6% -- 1991 Kaibab deer check station (unpublished) (corrected for
non-checked deer) 4.4% 5.7%
1990–2002 Kaibab deer check station (Munig and Wakeling 2005)
-- 10–15%
1993 Region 5 phone survey, turkey (unpublished) 11.4% -- NM deer, 1960–1962 (Snyder 1963) -- 1.9% NM deer (MacDonald and Dillman 1968) -- 8.0% MT small game (Cada 1984) -- 4.0% New Zealand waterfowl (Barker 1991) -- 20.0%
Statewide, estimates of general season deer harvest are typically ±0.4%, although overestimated by 10% (in 2007, the estimate was 9,750 deer harvested statewide during general seasons, ±39 deer, although it was probably overestimated by 975 deer). A reasonable estimate of 2007 statewide general deer harvest was 8,736–8,814 when using 90% CI and correcting for bias. Comparative Data from Other States Six western states were contacted to gather information on their Hunter Questionnaire Process and precision of their data; 5 states responded (Colorado, New Mexico, South Dakota, Utah, and Washington; Table 4). Colorado and Washington were the only states that used or provided estimates of precision. In Colorado, precision for larger hunt areas was ±5% at the 90% CI. In Washington, precision averaged ±3 to 6% for deer and ±2 to 4% for elk at the 95% CI. These results for both states are very similar to existing Arizona precision. Questionnaire survey techniques from these states varied from mandatory return via website, telephone, or mail to website-telephone response to website-mail response. Colorado, New Mexico, and Washington indicated their surveys or mandatory reporting programs would be impossible to enforce without their Point of Sale (POS) system, which provides real-time interface with linked databases. It was difficult obtaining reliable cost estimates from these states for operating their questionnaire process. South Dakota and Washington indicated their costs were rolled up into a large program and difficult to separate. Colorado, New Mexico, and Washington have modified

Hunter Questionnaire Improvement Report 8
Table 4. Comparative data and estimated costs from hunter questionnaire processes currently used in western states.
State Process Requirements Benefits Challenges Estimated Cost
Arizona Mail only, single mailing Pre-paid return postcard 100% mailing for all draw
hunts. 60–70% mailing for archery
deer. Mailing for small game is
about 2% of license sales
Voluntary for all species
Narrow confidence intervals overall and at the statewide or even regional level.
Overall response rate is 45%
Lower return rates on non-draw questionnaires.
Confidence Intervals on hunts with low permit numbers can be very wide.
Mailing standards are becoming more strict and will require changes in our design
$85,000 to $90,000 with current postage rates (2008). Approximate cost per return is $1.30 PS-ERE is about another $25,000
Colorado For big game – online or telephone (IVR) response only (no mail option).
Random Sample – CDOW initiates contact via email or telephone.
Trophy hunts have mandatory questionnaire response.
Process has been in place for 2 years
Voluntary response Sample is greater than or
equal to 35% of permits. Overall, sample is 40– 50%.
Random sample process would not be possible without a Point of Sale System to capture email and phone numbers that are used to sample hunters
Mixed survey method helps to increase response rates.
Precision – for big game, ±5% for the top 10 largest herd units (about 40 herd units in CO).
For small game, ±1% to 300% depending on the size of the area
Emails have high bounce rate. Spends up to $50,000 per year to manage email bounces and spam filters.
Telephone surveys must have live person at all times – must have easy, quick way to connect with the live person (not menu after menu)
No overall cost given. No cost given for initial start up of process.
Currently, $2.00 per response rate – about $170,000 –200,000 for deer, elk, and small game
Nevada
- per their
vendor,
Systems
Consultants
Inc (SCI).
25,000 tags issued through draw
Sends a courtesy reminder note by mail to applicants.
Web response >60% Phone response – 20% (live
person) Mail response – 15% Fax response – 5%
Big game has a mandatory report.
If fail to return survey, the hunter cannot purchase a license or apply in the draw for 1 year unless they buy back in and complete the survey.
Penalty fee of $50 to buy back in
Precision of data for mandatory returns is better.
Saw significant difference between data from a random mail survey to the mandatory return survey
Cost is $1 to $2 per return. SCI charges a $1 convenience fee when the penalty fee is paid by credit card

Hunter Questionnaire Improvement Report 9
Table 4. Comparative data and estimated costs from hunter questionnaire processes currently used in western states.
State Process Requirements Benefits Challenges Estimated Cost
New Mexico For deer, elk, and furbearer – Return by Feb 15 or receive a
penalty. Other species – online or
mail response (not sure if mandatory or voluntary)
Small game is voluntary – online (possibly mail too but did not receive a return call).
NM provides vendor with listing of all tag-license sale 3 times a week
Mandatory for deer, elk, and furbearer – online or phone response.
Hunters must have a UNIQUE Sportsman ID (not multiple numbers as can be attained in AZ).
Point of Sale – not all tags-licenses are issued through the point of sale system (landowner tags).
$8.00 penalty for failure to return the questionnaire
Vendor operates website and toll free number
Get about a 75% return rate by Feb 15 due date
Do not calculate precision. Field check data is crossed with harvest questionnaire – this is the only checking done
Private landowner hunts have a lower response rate
$60,000–75,000 per year for 70,000 deer and elk hunters
No cost given of other big game species. No cost for small game. No estimate of start up costs of process
Receive about $40,000 each year in penalty fees -offsets the cost of running the process
South
Dakota
Mail card with a unique hunter code. Hunter may mail in the postage paid card but are strongly encouraged to go to a website to complete the card.
4-wave mailing 27 different types of
questionnaires sent
Mandatory Return Point of Sale System All tags are issued
through the draw. Small game is a separate
license than big game
In-house system Coding does not allow
multiple responses. 80% response rate for
BG 85% response rate for
DR alone 70% response rate for
SG After a 70% return rate,
they could not detect any change in the hunt estimates
Mandatory return not enforced
Only 20–25% of hunters respond via the web option
Precision not calculated but feel their data is good
No email notice to hunters, they must go to a website to complete the questionnaire. When they attempted to use email, the bounce rate was very high
$150,000 to $180,000 but this included hunter opinion surveys too

Hunter Questionnaire Improvement Report 10
Table 4. Comparative data and estimated costs from hunter questionnaire processes currently used in western states.
State Process Requirements Benefits Challenges Estimated Cost
Utah Limited Entry Big Game draw.
General Season BG and Antlerless – random telephone survey, 6 attempts
Waterfowl – mail survey (sample = 5,000)
Small Game – random telephone survey
Bear, Lion, and Predator-Furbearer – random telephone survey to determine effort towards pursuit
Vendor operates hunter questionnaire system
Mandatory return Penalty for nonresponse –
hunter can not apply the following year
Mandatory has an 80%–90% return rate
Voluntary questionnaires – they hope for a 25% response rate from any given hunt
Switched from mail to telephone survey because they felt it lessened the bias that successful hunters are more likely to return a mail questionnaire
Precision not calculated but feel their data for big game is reliable
$150,000–200,000: costs are increasing each year
Washington Deer, elk, turkey, and bear – telephone or website survey
Small game – for general harvest information, surveyed via IVR telephone or website survey
10% of small game hunters are mailed a questionnaire to get area specific information
Small game has its own license separate from big game
Deer, elk, turkey, and bear – mandatory reporting by Jan 31
Small game – mandatory for general harvest categories
$10.00 penalty for nonresponse. About 35% nonresponse rate
Small game has its own license separate from big game
Point of Sale – Integrated Licensing System. Questionnaire process would not be possible without POS
Response rate for the mandatory returns is about a 65%; then WA randomly samples non-respondents by telephone to improve the response rate and adjust for response bias
Precision averaged ±3–6% for deer and ±2–4% for elk at the 95% CI
Costs of the quest. process are rolled into the larger Integrated Licensing System – cannot separate.
Non compliance of mandatory response brings in $40,000–60,000 each year.
Small game mail survey costs about $16,000–17,000 annually

Hunter Questionnaire Improvement Report 11
their processes in the past 5 years but could not provide estimates of start-up costs for the new process. Best estimate of operating costs ranged from $150,000–180,000 per year for South Dakota’s mail-web return process to $170,000–200,000 for Colorado’s web-email-telephone process. Cost estimates for Colorado, New Mexico, and Washington did not include all species of big and small game. Alternatives for Consideration in Managing the Hunter Questionnaire Process Pennsylvania produced a publication entitled “Harvest Estimates: Why can’t we just count them?” In this publication, there are points that relate to the evaluation of hunter questionnaire processes.
“The Game Commission recognizes the desire for a simple, straightforward count to
determine deer harvests, but the fact is, no one has devised a cost-effective, simple and
foolproof method to do so.”
“The best way to increase the precision of the Game Commission’s current harvest
estimating procedures currently rests with increased cooperation and responsibility
among [all] hunters to return their harvest report cards.”
If all hunters complied with the second paragraph, the first paragraph would be inaccurate. Because hunters don't comply, agencies struggle with offering incentives or penalties to encourage hunters to comply. Even mandatory compliance regulations often result in incomplete response rates (sometimes no better than without mandatory regulations) and create enforcement challenges for agencies. Moreover, these mandatory reporting requirements may create even greater, unnecessary barriers for recruitment and retention of hunters when the current data is demonstrably sufficient for managing Arizona's game animals. Based on available data on efficacy and cost, the team evaluated 5 alternatives for continuing the hunter questionnaire process. Alternatives:
1. No Change: maintain the current Hunter Questionnaire Process (single wave mail-out) without changes.
Benefits: Hunters and agency familiar with existing process Provides statistically-valid biological data that meets current needs
for game management perspectives Relatively inexpensive process that does not rely on advanced
technologies to implement Long-term data set exists that is directly comparable among years No statutory or rule changes needed
Challenges: Public has some level of distrust for quality of data

Hunter Questionnaire Improvement Report 12
Public has only a single method for reporting (business-reply postcard)
2. Add an option to the current process for hunters to respond via the web: Maintain
the current Hunter Questionnaire Process (single wave mail-out) with the option for web return or mail return. The idea behind the web return is to reduce postage and data-entry costs. There will be additional start up costs for designing and programming the web return form. We would not necessarily expect to see a change in questionnaire return rates. Cost estimates for set up and maintenance is estimated at a minimum of $20,000 to begin and $20,000 annually to maintain if the system were to interface with the existing sportsmen's database and automatically load this data. Alternatively, web surveys may be developed using more passive software that requests coded information (hunt and permit number) already printed on the postcard. This latter approach is likely to cost $1,000–5,000 annually. Some reduced costs in human resources for data entry depending on degree of website use.
Benefits: Possible postage cost reduction for those that return their questionnaire via the web form; although difficult to estimate, other states see 20–50% of returns via website
Human resources necessary for data entry would be reduced because the website entry would compile responses
This data could easily be merged and compared to the historical questionnaire data set
Would allow the public a second venue for providing questionnaire data
Would not require any rule or statute changes
Challenges: The cost of designing and programming the website is not a hard estimate and will be in addition to existing costs for start-up time period
Would not expect return rates to increase; they may actually decrease due to hunters procrastinating on completing the web return form
Some hunters may enter data on website and return mail questionnaire, in essence double reporting; without a unique identifier, there would be no way to detect
3. Multiple-wave mail out and website response: Modify the current Hunter
Questionnaire Process to include a multiple wave mail-out (2 to 4 waves) with the option for web return or mail return. There would be additional postage costs for the multiple mail outs but the precision of our data set may improve, although not substantially. We would be able to more accurately determine nonresponse biases. The web return may reduce postage and data entry costs. There will be additional start up costs for designing and programming the web return form. South Dakota has a similar process with a 4-wave mail-out and web or mail return that could be used as a template. Again, costs are difficult to estimate accurately, but would probably require $20,000 to initiate, $20,000

Hunter Questionnaire Improvement Report 13
per year to maintain, and some added costs $25,000–60,000 due to multiple-wave mail out. Reductions in business-reply mail and human resources depend on degree of website use.
Benefits: Possible postage cost reduction for those that return their
questionnaire via the web form; although difficult to estimate, other states see 20–50% of returns via website
Human resources necessary for data entry would be reduced because the website entry would compile responses
This data could easily be merged and compared to the historical questionnaire data set
Would allow the public a second venue for providing questionnaire data
Would expect return rates to increase with multiple wave mail out Would not require any rule or statute changes
Challenges: The cost of designing and programming the website is not a hard estimate and will be in addition to existing costs for start-up time period
Multiple-wave mail out would result in increased postage costs Some hunters may enter data on website and return mail
questionnaire, in essence double reporting; without a unique identifier, there would be no way to detect
4. Use Interactive Voice Recorder (IVR) system: Convert the Hunter Questionnaire
Process to an IVR telephone system. An IVR telephone system would have hunters voluntarily call in to complete their questionnaire or hunters would receive an autodial from the Department informing them they have been selected to complete a questionnaire. After hunters make or receive the telephone call, the IVR system would prompt them to answer the questions. Other states using this system indicate that there would need to be a live person available to assist the hunter should they need help during all operational hours.
Benefits: Because there is no mail out questionnaire, no printing or postage costs are incurred
No data entry costs are incurred because the IVR system will collect and compile data
Most hunters have a telephone Would not require any rule or statute changes
Challenges: Cost of the vendor to develop the IVR system could be
significantly more than a single year of current process’s costs; the initial quote for such services from Qwest (the state's telephone services contract) was $110,000 for set up, but did not include the cost of connections to Department mainframe database

Hunter Questionnaire Improvement Report 14
Data collected from the IVR system could not be directly compared to the Department’s historic questionnaire data set because response rates and bias are likely to change substantially; response rate initially will probably drop off without mandatory reporting; automated reminder calls could be placed, although this would increase cost and would require rule change so that hunters had to provide a phone number when purchasing licenses or tags
The Department would need to provide response assistance personnel during all hours when IVR was active so that callers that needed assistance could reach help, which would increase costs
People often hang up when they receive an automated phone call
5. Mandatory reporting by website or telephone reporting: Make the Hunter Questionnaire Process a mandatory return via web or telephone return. This alternative would require that the Department have a POS system and a truly unique hunter identification number for each hunter to enforce the mandatory reporting requirement. POS and the unique identifying number are needed to determine if a hunter returned a questionnaire and enforce restrictions on purchasing a license in subsequent years.
Benefits: No postage costs No data entry costs Should increase response rate, and may increase precision and
accuracy of data Public perception is that the data will be more precise Many hunters expect the process to be mandatory similar to some
other western states A monetary penalty would compensate for some process costs
Challenges: Arizona's precision of the harvest estimate is comparable to other
states with mandatory reporting, although Arizona's reporting is not mandatory; mandatory reporting requirements are not likely to markedly improve the precision of our harvest estimate
Cost to develop the mandatory tracking system could be substantially more than a single year of current process’s costs
Would require rule and/or statute changes to require mandatory reporting and allow for penalty fee to be collected
Penalty fee needs to be substantial (≥$50) to affect compliance Difficult to enforce (except for in limited draw hunts; licenses and
nonpermit tags could be purchased at any license dealer) without POS system (several states noted this need)
Many hunters currently have multiple sportsman identification numbers
Hunter Questionnaire Improvement Report 15
A monetary penalty may negatively impact hunter retention May lose license sales because of a failure to return the
questionnaire penalty Data collected from the mandatory system could not be compared
to the Department’s historical questionnaire data set without testing
Would require changes to the Department’s Draw Process to exclude those who did not report
Hunter recruitment and retention may drop; hunters may perceive the mandatory reporting as another restriction being placed on their ability to hunt
Hunters that were excluded from hunting because they failed to report could appeal these actions to the Commission if they believed they were excluded erroneously; it is difficult to estimate the volume
Alternative Analysis Arizona's current mail hunter questionnaire provides a precise estimate of harvest using a method familiar to most Arizona hunters. IVR telephone is quite expensive and not a logical choice for selection. Although many vocal critics of the existing system dislike the inconsistent application of mandatory reporting requirements, enforcement of existing mandatory reporting requirements is problematic. Use of additional mandatory reporting requirements should minimally await implementation POS capabilities because detection and enforcement of compliance would be greatly enhanced. Multiple-wave mail outs would add relatively little to improvement in precision with a substantial increase in costs, although this would provide a regular estimate of nonresponse bias. The addition of an electronic submission of questionnaire results provides an alternative method with moderate additional costs for the public to submit questionnaire responses, while maintaining the existing hunter questionnaire process system. As the online application process and POS become available, continuous innovation in questionnaire capabilities should be explored. These innovations should be implemented in a stepwise fashion and compared to existing approaches to maintain data comparability.
Recommended Course of Action Maintain the current Hunter Questionnaire Process single-wave mail out with the option of returning the questionnaire via mail or website entry without interfacing with existing sportsmen's database. An IVR telephone system is not being recommended due to the high cost of implementing the system with the State’s current telephone services provider. The additional start-up costs for designing and programming the web return form has not been accurately determined, but expect a minimum of $1,000–5,000 to operate annually. We do not expect to see a change in questionnaire return rates.
Benefits: Possible postage cost reduction for those that return their
questionnaire via the web form

Hunter Questionnaire Improvement Report 16
Reduced data-entry costs from web returns Easy of merging and comparing data to the historical questionnaire
data set Would not require any rule or statute changes
Challenges: Cost of designing and programming the website
Increase postal restrictions on mail pieces Would not expect return rates to increase; they may actually
decrease due to hunters procrastinating on completing the web return form
We also recommend a 3-wave mail out survey every 5 to 7 years on 1 or 2 questionnaire types so we can track and calibrate for nonresponse biases. Although the mandatory return concept may bolster the precision and reduce the bias of the questionnaire data in the long term, the team recommends avoiding this option for several reasons. First, all states we queried that have a mandatory return indicated their process would not be successful without a POS system in place, which would track and assign a unique identification number to every hunter in Arizona, not just those hunters applying in our limited draw. Second, hunter recruitment and retention may be negatively influenced by adding another restriction to hunters (particularly for those that may be cited for violation). Third, changes to rule would be needed to require reporting and possibly changes to statute to allow for the collection of meaningful financial penalties for failing to report. Lastly, with current fiscal constraints and the fact that current precision of our questionnaire data is very good, the cost of implementing the mandatory return alternative is not cost efficient. When POS systems become available, electronic survey mechanisms will be appropriate to convert to, but should be implemented in a staged fashion while maintaining existing surveys to evaluate differences in precision, bias, and public acceptance. Implementation sequence should be:
• POS and online application system established that collects physical address at time of tag sale
• Develop revised electronic questionnaire process with vendor or Department personnel that develop the POS and online application system
• For two years, test system in portion (e.g., one half) of units to determine differences in precision and bias between the two systems
• In year three, switch entire questionnaire process to electronic response
• In year four, conduct multiple-wave survey to determine the bias and precision of new electronic questionnaire process
• Financial cost of this approach is difficult to estimate; primary cost will be to establish POS and online system (currently estimated at >$400,000); mail out cost would decrease in accordance with amount of questionnaire shift to electronic (currently $85,000–90,000); electronic capture of data would range from $5,000–20,000 annually depending on system used (i.e., how much of sportsmen's database must be linked to electronic reporting file)

Hunter Questionnaire Improvement Report 17
Future innovations may allow for electronic reminders to be sent to hunters if an online application procedure is in place that captures email addresses. Some states report substantial expenses in tracking and correcting email addresses (e.g., currently Colorado spends about $50,000 annually). Email addresses tend to be more ephemeral than are physical addresses, with which we have substantial problems already. Currently, not all applicants have an email address, and in some households, multiple applicants use a single email address. Increasing the Public's Acceptance of Hunter Questionnaire Process A critical component to improving the hunter questionnaire process is informing and educating the public about the process and its functionality. The questionnaire process was recently scrutinized when harvest estimates for archery deer were compared with harvest estimates by general deer on a hunt area basis. Archery deer hunters have a mandatory reporting requirement, but this requirement is difficult to enforce and we are unable to determine compliance rates. Estimates of archery deer harvest by the mandatory phone reporting system and the hunter questionnaire differ substantially. The public duly noted the differences in accuracy, bias, and precision among the various estimates, but failed to understand the strengths of the comparisons drawn. When decisions are based on the best available data, arguments abound regarding various positions and perceptions of fairness. When a specific customer segment believes that they are being treated unfairly, the desire surfaces for a perfect knowledge of the many parameters that influence those conditions. Essentially, the task of increasing the public's acceptance of the hunter questionnaire process and support for the data it contains presents an adaptive challenge rather than a technical one. Few in the public understand or have interest in learning about statistical sampling. Technical presentations are likely to bore or infuriate constituents. With an adaptive challenge, using technical solutions are generally ineffective. But involving the constituency in the problem-solving effort can be effective. It will be important to identify the degree to which this is perceived to be a real problem with the public before initiating much work. Much of the public seems comfortable with the system, although a few archery hunters have questioned its effectiveness because recent deer and elk hunt recommendations influenced the amount of opportunity they have to participate in archery hunts. A survey of the hunting public should be used to determine the level of trust in the data obtained through the hunter questionnaire process. The technical information presented in this report should be shared with the public through a variety of advertising approaches. Information should be disseminated through the e-newsletters and a contemporary Arizona Wildlife Views magazine article should be composed. A segment on the process could be included in the television show Arizona Wildlife Views. These activities will be important with the impending revisions to the hunt guidelines, which will be presented to the Commission in August 2009. If there is broad distrust, providing the interested public with an opportunity to work toward solutions with Department staff could generate innovative new options. This approach is equally likely to generate very popular ideas that the Department may not support (e.g., mandatory

Hunter Questionnaire Improvement Report 18
reporting). The key to the success of such an approach would be to select a small group of individuals that represent both vocal and relatively silent constituencies, providing an accurate description of the sideboards that limit innovation, and providing skilled facilitation assistance. This report could be the basis for discussion and future recommendation. Literature Cited Barker, J. B. 1991. Nonresponse bias in New Zealand waterfowl harvest surveys. Journal of
Wildlife Management 55:126–131. Cada, J. D. 1984. Evaluations of the telephone and mail survey methods of obtaining harvest
data from licensed sportsmen in Montana. Pages 117–128 in S. L. Beasom and S. F. Roberson, editors. Game Harvest Management. Caesar Kleburg Wildlife Research Institute, Kingville, Texas.
MacDonald, D., and E. G. Dillman. 1968. Technique for estimating non-statistical bias in big
game harvest surveys. Journal of Wildlife Management 32:119–129. Munig, A. A., and B. Wakeling. 2005. An evaluation of mule deer harvest estimates on the
North Kaibab, Arizona. Pages 291–296 in C. van Riper and D. J. Mattson, editors. The Colorado Plateau II: Biophysical, Socioeconomic, and Cultural Research. University of Arizona Press, Tucson.
Smith, R. H. 1962. Reporting bias in the deer hunt questionnaire. Arizona Game and Fish
Department, Phoenix. Snyder, W. A. 1963. Random card survey of big game license holders. New Mexico Game and
Fish Department, Santa Fe. Thompson, S. K. 1992. Sampling. John Wiley and Sons, Inc., New York.
Hunter Questionnaire Improvement Report 19
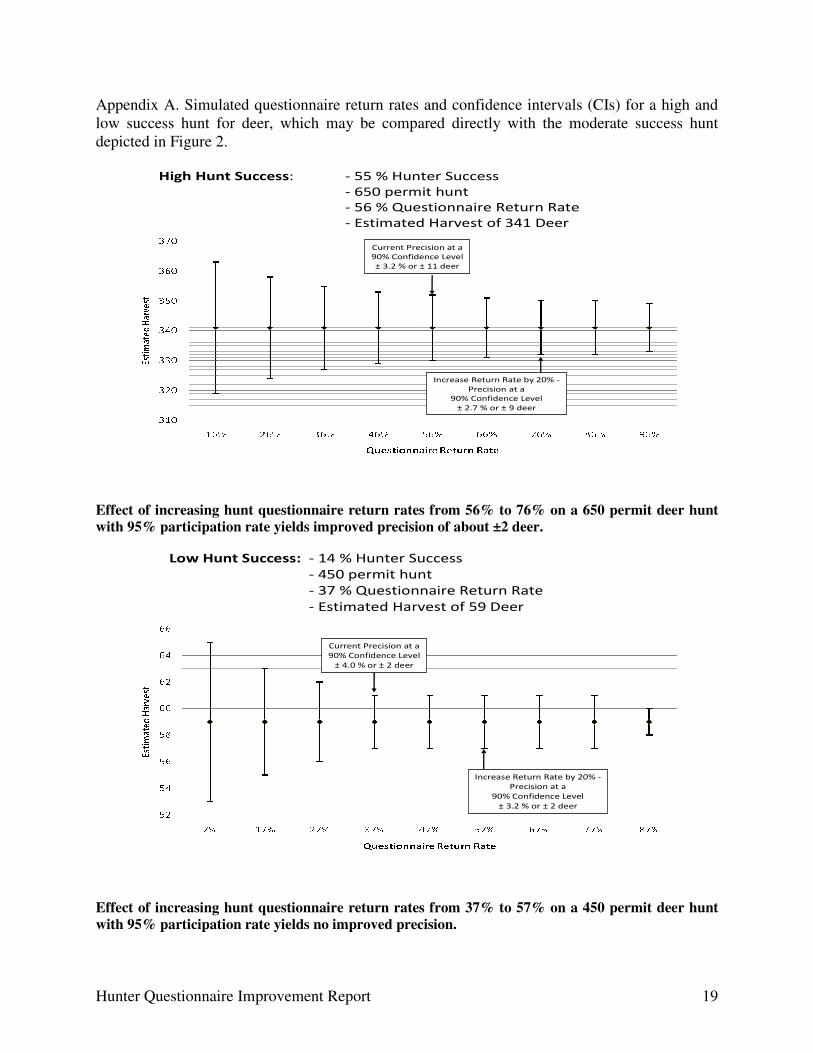
Appendix A. Simulated questionnaire return rates and confidence intervals (CIs) for a high and low success hunt for deer, which may be compared directly with the moderate success hunt depicted in Figure 2.
High Hunt Success: - 55 % Hunter Success
- 650 permit hunt
- 56 % Questionnaire Return Rate
- Estimated Harvest of 341 Deer
Current Precision at a
90% Confidence Level
± 3.2 % or ± 11 deer
Increase Return Rate by 20% -
Precision at a
90% Confidence Level
± 2.7 % or ± 9 deer
Effect of increasing hunt questionnaire return rates from 56% to 76% on a 650 permit deer hunt
with 95% participation rate yields improved precision of about ±2 deer.
Low Hunt Success: - 14 % Hunter Success
- 450 permit hunt
- 37 % Questionnaire Return Rate
- Estimated Harvest of 59 Deer
Current Precision at a
90% Confidence Level
± 4.0 % or ± 2 deer
Increase Return Rate by 20% -
Precision at a
90% Confidence Level
± 3.2 % or ± 2 deer
Effect of increasing hunt questionnaire return rates from 37% to 57% on a 450 permit deer hunt
with 95% participation rate yields no improved precision.