hunger for knowledge: food...
TRANSCRIPT

1
BACKGROUND &
KEY CONCEPTS
2
METHOD
3
FINDINGS
4
DISCUSSION
Nicholas Munro, Michael Quayle,
Heather Simpson, and Shelley Barnsley
Hunger for knowledge:
Food insecurity
amongst students at the
University of KwaZulu-Natal

Growing numbers of
“hungry students”
What is the extent of food insecurity at UKZN?
Increased access to
higher education
Ad hoc assistance
by individual depts
Who is more vulnerable
to food insecurity (FI)?
What impact does
student hunger
have on retention
and throughput?
1
BACKGROUND &
KEY CONCEPTS
Massification
+
Globalisation
Marketisation

“limited or uncertain availability of
nutritionally adequate and safe foods or
limited or uncertain ability to acquire
acceptable food in socially acceptable
ways” (Anderson, 1990, p.1598)
Food insecurity•Definition
•Dimensions
•National indicators
•Educational impact

Physical availability of
food
Nutritional value of food
Stability of above dimensions over
time
Economic and physical access
to food
4 dimensions (FAO, 2008)
Food insecurity•Dimensions

23.9%21.5% 21.5%
23.1% 22.5%
28.6%
25.0%26.1% 26.0% 26.2%
0%
5%
10%
15%
20%
25%
30%
35%
2010 2011 2012 2013 2014
Complex food access: Households Complex food access: Persons
Food access for South African households and
persons? Indicators of food access (questions
based on HFIAS, within GHS, 2010-2014)
Food insecurity •National indicators

Not well documented or researched in SA
In SA: The causes of academic failure and/or dropout in
higher education have been attributed to financial or
funding problems (Africa, 2005; Jones et al., 2008).
By implication this includes FI, however no studies have
specifically considered this issue.
Food insecurity in higher education •Educational impact

In adults, food insecurity can lead to:
• reduced efficiency,
• decreased ability to learn,
• increased levels of stress and anxiety,
• passivity,
• feelings of demotivation and powerlessness, and
• difficulty in social interactions.
(Food Research and Action Centre in America)
In school children:
• Food insecurity is associated with diminished cognitive
functioning or academic achievement (Taras, 2005)
• Diet quality/variety is positively associated with academic
performance (Florence, Asbridge & Veugelers, 2008).
•Educational impactFood insecurity in education

a) Pilot study (2005)
b) Consolidation of the questionnaire
c) Sampling
2
METHOD

Expert input from
dieticians on
items
Reflections and
findings from pilot
study
University Students Food Insecurity Questionnaire (USFIQ) – design finalisation 2006/7
b) Consolidating the questionnaire
anxiety (about food supply)
insufficient quality of food intake and phys conseq.
insufficient quantity of food intake and phys conseq.
Inclusion of 3
domains of
HFIAS

anxiety (about food supply)
•32 item self-report questionnaire
•13 items = a scale providing a
measure of vulnerability to food
insecurity (internal consistency/
reliability, Cronbach = .924)
•4 sections
•2 uses (1: individual counselling,
and 2: assess indiv/group
vulnerability to food insecurity)
1.biographic data
2.eating habits
3.spending habits
4.behavioural
responses to FI
insufficient quality of food intake and phys conseq.
insufficient quantity of food intake and phys conseq.
USFIQ

c) Sampling
• Anonymous
• Voluntary
• No incentives
• Referral for assistance for FI
independent from research
► 367 questionnaires administered to students in 3 level 200
courses across faculties (Science & Agric, Humanities, and
Management Studies) - 2007
► 425 questionnaires administered to students in residences
– 2007
► 291 questionnaires administered to students in Centre for
Science Access – 2008, 2009
► 1 083 total

Gender Female 52.4%
Male 47.6%
Nationality South African 88.6%
International 10.3%
Refugee 1.1%
Residence UKZN residence 63.5%
Home 16.6%
Relative 2.1%
Board 2.5%
Flat/digs 11.3%
Other .9%
Financial aid Yes 34.5%
No/other 65.5%
c) Sampling

3
FINDINGS
b) How often to students worry about where
their next meal will come from?
c) Are students more vulnerable to FI at the
end of a semester (near exams) than at the
beginning of a semester?
a) How often do students experience
problems with concentration and fatigue in
relation to FI?
d) Overall, how vulnerable are students to
FI?
e) Is there a difference in vulnerability to FI
in different groups of students?

38.7%
28.5%
21.5%
7.9%
3.4%
0%
5%
10%
15%
20%
25%
30%
35%
40%
45%
never seldom sometimes often almostalways
Perc
en
t
Deficits in
concentration as a
result of hunger
a) How often do students experience problems with
concentration and fatigue in relation to FI?

37.8%
31.2%
18.8%
9.1%
3.1%
0%
5%
10%
15%
20%
25%
30%
35%
40%
never seldom sometimes often almost always
Pe
rce
nt
Experience of fatigue
as a result of hunger
a) How often do students experience problems with
concentration and fatigue in relation to FI?

47.6%
23.3%
18.4%
6.5%4.2%
0%
5%
10%
15%
20%
25%
30%
35%
40%
45%
50%
never seldom sometimes often almost always
Pe
rce
nt
Worry in relation to
capacity to access
next meal
b) How often to students worry about where their next
meal will come from?

c) Are students more vulnerable to FI at the end of a
semester (near exams) than at the beginning of a
semester?
Students are significantly more likely (t = -6.817; df = 1059; p<.001) to report going hungry at the end of the semester (M = 1.12; SD = 1.3) than at the beginning of the semester (M = .9; SD = 1.2).
Yes, using a repeated measures (paired
samples) t test
“Often” or “almost always”
going hungry at the beginning
of the semester = 11.4%
“Often” or “almost always”
going hungry at the end of the
semester = 17.3%

d) Overall, how vulnerable are students to FI?
USFIQ includes a scale of 13 items that measure vulnerability to FI
anxiety (about food supply)
insufficient quality of food intake and phys conseq.
insufficient quantity of food intake and phys conseq.
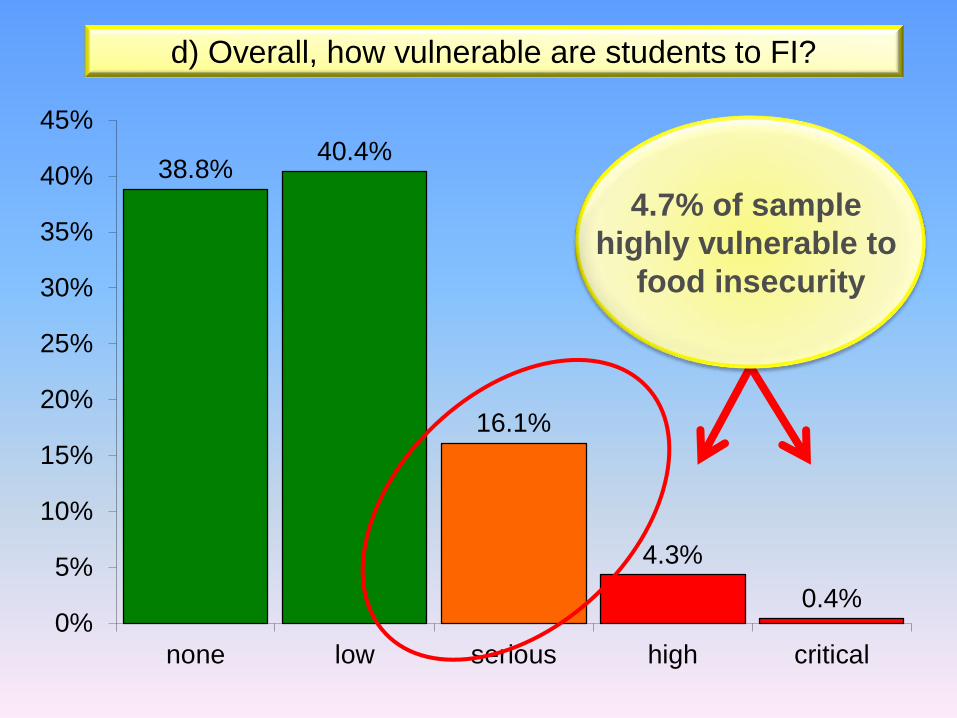
38.8%40.4%
16.1%
4.3%
0.4%0%
5%
10%
15%
20%
25%
30%
35%
40%
45%
none low serious high critical
d) Overall, how vulnerable are students to FI?
4.7% of sample
highly vulnerable to
food insecurity
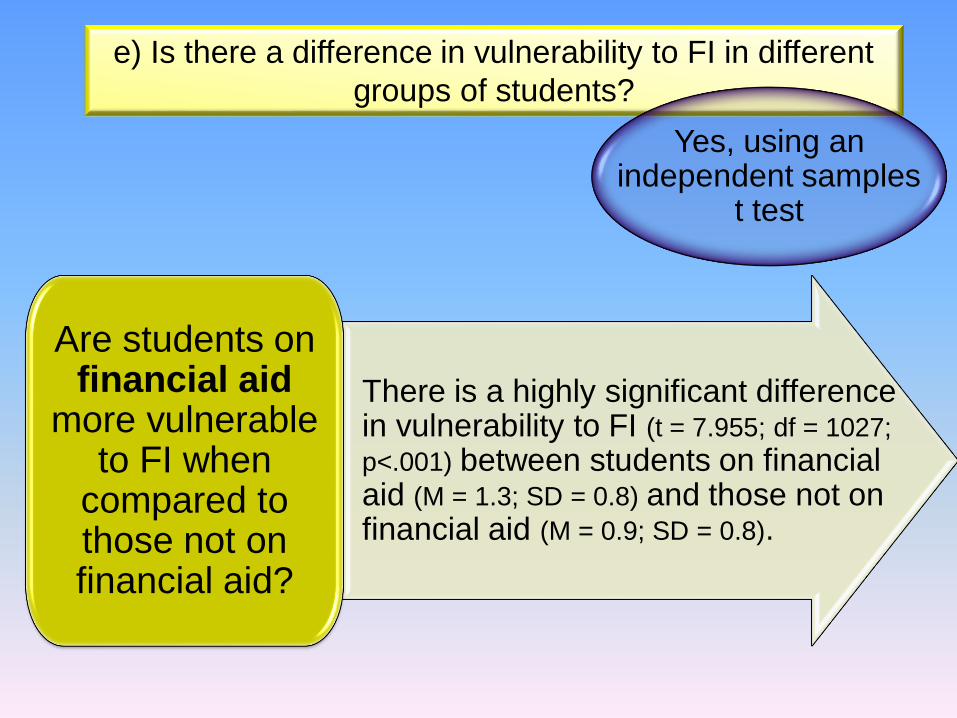
e) Is there a difference in vulnerability to FI in different
groups of students?
Yes, using an independent samples
t test
There is a highly significant difference in vulnerability to FI (t = 7.955; df = 1027;
p<.001) between students on financial aid (M = 1.3; SD = 0.8) and those not on financial aid (M = 0.9; SD = 0.8).
Are students on financial aid
more vulnerable to FI when
compared to those not on financial aid?

e) Is there a difference in vulnerability to FI in different
groups of students?
Yes, using an independent samples
t test
The difference in vulnerability to FI between students in the CSA (M
= 1.4; SD = 0.8) and those in mainstream programmes (M = 0.9;
SD = 0.8) is also highly significant (t = 9.708; df = 1034; p<.001).
Are Centre for Science Access
students more vulnerable to FI
when compared to those in
mainstreamprogrammes?

4
DISCUSSION
Recommendations and way
forward for FI in HE
Method: limitations &
recommendations
Vulnerability to food insecurity at
UKZN

High levels (11% - 18%) of
worry in relation to sourcing
food, as well as adverse
effects on concentration and
fatigue.
At UKZN, estimated
between 4 400 – 7 200
students
Experience of “often” or
“almost always” going hungry
at the end of a semester
near exams – 17.3%.
At UKZN, approximately
7000 students
Extent of vulnerability to food
insecurity at UKZN

38.8%40.4%
16.1%
4.3%
0.4%0%
5%
10%
15%
20%
25%
30%
35%
40%
45%
none low serious high critical
79.2% with low/no
vulnerability to FI
Extent of vulnerability to food
insecurity at UKZN
4.7%
20.8% with serious to critical
vulnerability to FI

79.2% with low/no
vulnerability to FI
Extent of vulnerability to food
insecurity at UKZN
4.7%
20.8% with serious to critical
vulnerability to FI
At UKZN, approx 8 320
students
At UKZN, approx
1 880 students

23.9%21.5% 21.5%
23.1% 22.5%
28.6%
25.0%26.1% 26.0% 26.2%
0%
5%
10%
15%
20%
25%
30%
35%
2010 2011 2012 2013 2014
Complex food access: Households Complex food access: Persons
20.8% with serious to critical
vulnerability to FI
UKZN and national data?
• Correlation between food insecurity and academic
achievement.
• Positive association between diet quality/variety and
academic performance.

Students on financial aid significantly more vulnerable to
FI when compared to those not on financial aid.
Variations in vulnerability to
food insecurity at UKZN
Students in access programmes significantly more
vulnerable to FI when compared to those in mainstream
programmes.

Recommendations:
• Correlation between vulnerability to food insecurity,
academic performance and other dimensions/effects of
food insecurity (eg, wellness)
• Replicate research at other institutions – with the aim of
yielding a national indicator of food insecurity in higher
education students – with the eventual aim of informing a
national response in higher education SA
Limitations:
• Possible exaggeration of extent of food insecurity despite
attempts to minimize this
• Generalisability to larger UKZN student population given
purposive sampling
Method: limitations & recommendations

(1) Create awareness
of FI at UKZN and
other HEIs
(2) Provision of a food
voucher or parcel
system for FI students
(3) Investigate viability
of on-campus food
banks or reduced fee
meals on campus
(4) Bolster student
employment
opportunities
(5) Provision of
psychoeducation and
lifeskills training
Recommendations and way forward for FI in HE
(6) Reassessment of
financial aid

1
BACKGROUND &
KEY CONCEPTS
2
METHOD
3
FINDINGS
4
DISCUSSION
• We explored the dimensions of FI in South Africa, highlighting the absence of engagement with this in HE.
• What are the effects of vulnerability to FI in HE context?
• What is the extent of vulnerability to FI at UKZN, and are some students more vulnerable than others?
SUMMARY AND CONCLUSION
• Design and consolidation of USFIQ
• Administration to 1 083 UKZN students across 3 years
• Identified similar levels of vulnerability to FI in UKZN student population when compared to SA population (approx 20%).
• Identification of students who are likely to be more vulnerable to FI.
Likely extent of vulnerability to FI at UKZN
Is it reasonable to expect a food secure UKZN society?
If so, what can be done to facilitate this?