hungary - iuj.ac.jp hungarian territory at the second battle of mohacs in 1687, allowing austria to...
TRANSCRIPT

COUNTRY PROFILE 2002
HungaryThis Country Profile is a reference work, analysing thecountry’s history, politics, infrastructure and economy. It isupdated annually. The EIU’s quarterly Country Reportsanalyse current trends and provide a two-year forecast.
The full publishing schedule for Country Profiles is nowavailable on our website at http://www.eiu.com/schedule
The Economist Intelligence Unit15 Regent St, London SW1Y 4LRUnited Kingdom

The Economist Intelligence UnitThe Economist Intelligence Unit is a specialist publisher serving companies establishing and managingoperations across national borders. For over 50 years it has been a source of information on businessdevelopments, economic and political trends, government regulations and corporate practice worldwide.
The EIU delivers its information in four ways: through our digital portfolio, where our latest analysis isupdated daily; through printed subscription products ranging from newsletters to annual referenceworks; through research reports; and by organising seminars and presentations. The firm is a member ofThe Economist Group.
LondonThe Economist Intelligence Unit15 Regent StLondonSW1Y 4LRUnited KingdomTel: (44.20) 7830 1007Fax: (44.20) 7830 1023E-mail: [email protected]
New YorkThe Economist Intelligence UnitThe Economist Building111 West 57th StreetNew YorkNY 10019, USTel: (1.212) 554 0600Fax: (1.212) 586 0248E-mail: [email protected]
Hong KongThe Economist Intelligence Unit60/F, Central Plaza18 Harbour RoadWanchaiHong KongTel: (852) 2585 3888Fax: (852) 2802 7638E-mail: [email protected]
Website: www.eiu.com
Electronic deliveryThis publication can be viewed by subscribing online at www.store.eiu.com
Reports are also available in various other electronic formats, such as CD-ROM, Lotus Notes, on-linedatabases and as direct feeds to corporate intranets. For further information, please contact your nearestEconomist Intelligence Unit office
Copyright© 2002 The Economist Intelligence Unit Limited. All rights reserved. Neither this publication norany part of it may be reproduced, stored in a retrieval system, or transmitted in any form or by anymeans, electronic, mechanical, photocopying, recording or otherwise, without the prior permissionof The Economist Intelligence Unit Limited.
All information in this report is verified to the best of the author’s and the publisher’s ability. However,the EIU does not accept responsibility for any loss arising from reliance on it.
ISSN 0269-6061
Symbols for tables“n/a” means not available; “–” means not applicable
Printed and distributed by Patersons Dartford, Questor Trade Park, 151 Avery Way, Dartford, Kent DA1 1JS, UK.


EIU Country Profile 2002 © The Economist Intelligence Unit Limited 2002

Hungary 1
© The Economist Intelligence Unit Limited 2002 EIU Country Profile 2002
Contents
3 Basic data
4 Politics4 Political development7 Constitution, institutions and administration8 Political forces
12 International relations and defence
17 Resources and infrastructure17 Population18 Education19 Health21 Natural resources and the environment21 Transport, communications and the Internet24 Energy provision
27 The economy27 Economic structure29 Economic policy37 Economic performance40 Regional trends
41 Economic sectors41 Agriculture, forestry and fishing42 Mining and semi-processing43 Manufacturing45 Construction46 Financial services48 Other services
49 The external sector49 Trade in goods51 Invisibles and the current account52 Capital flows and foreign debt54 Foreign reserves and the exchange rate
56 Appendices56 Regional organisations58 Sources of information59 Reference tables59 Population60 Labour force60 Transport statistics60 Structure of energy sources (production plus imports)61 Central state budget61 Money supply61 Gross domestic product62 Gross domestic product by expenditure62 Gross domestic product by sector62 Prices63 Volume indices of sales of agricultural products

2 Hungary
EIU Country Profile 2002 © The Economist Intelligence Unit Limited 2002
63 Livestock numbers63 Output of energy, minerals and mineral products64 Industrial production by sector64 Construction64 Budapest Stock Exchange65 Retail sales65 Exports65 Imports66 Main trading partners67 Balance of payments, IMF series68 External debt, World Bank estimates68 Foreign reserves69 Exchange rates

Hungary 3
© The Economist Intelligence Unit Limited 2002 EIU Country Profile 2002
Hungary
Basic data
93,030 sq km, of which 70% agricultural, 18% forested
10,195,513 (February 1st 2001)
Population in ‘000, January 1st 2000
Budapest (capital) 1,812Debrecen 204Miskolc 172Szeged 158Pecs 157Gyor 127Szekesfehervar 105
Continental
Hottest month, July, 16-28°C (average daily minimum and maximum); coldestmonth, January, minus 1-4°C; driest month, September, 33 mm averagerainfall; wettest month, May, 72 mm average rainfall
Magyar (Hungarian)
Metric system. A cadastral yoke (1 acre=0.7033 cadastral yokes) is used formeasuring land
Forint (Ft)=100 filler. Fillers ceased to circulate in 1996. Average exchange ratefor 2001: Ft286.5:US$1. Exchange rate on March 15th 2001: Ft278.9:US$1;Ft245.8:€1
January 1st-December 31st
1 hour ahead of GMT
January 1st, March 15th, Easter Sunday and Monday, Pentecost Monday, May1st, August 20th, October 23rd, November 1st, December 25th and 26th
Total area
Population
Main towns
Climate
Weather in Budapest(altitude 139 metres)
Language
Weights and measures
Currency
Fiscal year
Time
Public holidays

4 Hungary
EIU Country Profile 2002 © The Economist Intelligence Unit Limited 2002
Politics
The head of state is the president, currently Ferenc Madl, who was elected byparliament for a five-year term on June 5th 2000 after Arpad Goncz’s termexpired. A right-wing coalition government, consisting of the Federation ofYoung Democrats-Hungarian Civic Party (Fidesz-HCP, but commonly referred toas “Fidesz”), the Smallholders’ Party (SP) and the Hungarian Democratic Forum(HDF) took office in July 1998, led by the Fidesz prime minister, Viktor Orban.
Political development
Magyar tribes from the region between the Volga, Kama and Belaia rivers andthe Ural mountains, now in Russia, settled in the Carpathian Basin towards theend of the ninth century. The date of settlement is traditionally commem-orated as 896. The foundation of the Hungarian state is dated to 1000, whenKing (later Saint) Stephen also adopted Christianity. The medieval Hungariankingdom suffered a catastrophic defeat at the hands of the Ottomans in thebattle of Mohacs in 1526 and was partitioned between Austria, the Ottomansand a nominally independent Transylvania. The Austrians drove the Turksfrom Hungarian territory at the second battle of Mohacs in 1687, allowingAustria to take control of all of Hungary under the 1699 Treaty of Karlowitz.
National and social tensions under Austrian rule led to a nationalist/liberaluprising as part of the pan-European 1848 revolutions. Lajos Kossuthestablished an independent national government, but this was crushed in 1849with Russian help. However, the Compromise (Ausgleich) of 1867 reorganisedthe Habsburg empire as the Dual Monarchy of Austria and Hungary, allowingMagyar domination of Hungarian lands and German domination of Austrianlands. The last quarter of the nineteenth century saw political stability, aneconomic boom and much social and infrastructural modernisation, with thenewly-unified Budapest acquiring many of its major public buildings.
The military defeat of the Austro-Hungarian monarchy in 1918 led to adramatic reduction in the area and population of Hungary. The 1920 TrianonTreaty reduced Hungary’s territory from about 325,000 sq km to 93,000 sq km,and the population from 20.9m to 7.8m, leaving sizeable Hungarian minoritiesin neighbouring Slovakia, Romania and the future Yugoslavia. A communist-dominated revolutionary government in March-August 1919 gave way to along period of conservative rule under the regency of Admiral Miklos Horthy.In the 1930s Hungary grew increasingly close to Germany, allying itself withthe Nazi power to regain territory from Slovakia, Romania and Yugoslavia. Ittook the German side in the second world war. Germany occupied Hungaryfrom March 1944 until the Soviet Red Army pushed out its troops in early 1945.
A free election in November 1945 resulted in a majority for the Smallholders’Party (SP), but another—this time flawed—election in 1947 gave the largestvote share to the Communist Party, which established one-party rule andnationalised property. Stalinism dominated Hungary until 1953. A revolution
Austro-Hungary
Early history
The communist takeover

Hungary 5
© The Economist Intelligence Unit Limited 2002 EIU Country Profile 2002
began in Budapest on October 23rd 1956. The reform communist primeminister, Imre Nagy, declared Hungary’s neutrality and withdrawal from theWarsaw Pact, prompting a Soviet Red Army invasion on November 4th. Bymid-December all resistance had been crushed and Janos Kadar, the generalsecretary of the restyled Hungarian Socialist Workers’ Party (HSWP), began thetask of political consolidation.
The regime relaxed its political stance somewhat from the early 1960s, with afinal amnesty for the revolutionaries declared in March 1963. In 1968 Hungaryintroduced the New Economic Mechanism, a reform package designed toincrease enterprise autonomy and the role of markets in economic decision-making. The more liberal system resulted in a boom in agricultural and consumergoods production, but income inequality increased and global recessionsfollowing the 1973 and 1979 oil-price shocks undermined the reform efforts.Worsening terms of trade, combined with excessive imports of Westerntechnology and consumption goods, increased the country’s foreign debt tomore than US$11bn by the early 1980s. Signs of social difficulties appeared, suchas the start of population decline on the back of high death and low birth rates.
When the 13th Congress of the Hungarian Socialist Workers’ Party (HSWP) in1985 failed to bring substantial changes in policy, unrest among reformerswithin the party and state apparatus began to increase. Karoly Grosz replacedMr Kadar as general secretary of the HSWP in May 1988, and reformists (led byImre Pozsgay and the architect of the 1968 economic reform, Rezso Nyers)gained control of the party in 1989. The prime minister, Miklos Nemeth, alsoenacted political liberalisation. In a dramatic break with the past, Nagy, whohad been secretly executed following the 1956 revolution, was given a publicfuneral and reburial in June 1989. The HSWP joined with opposition groups innational roundtable negotiations about establishing democracy and, inOctober 1989, transformed itself into the Hungarian Socialist Party (HSP).
Post-communist Hungary has benefited from a high level of political stability.Despite often bitter conflict between government and opposition, democraticprocedures have become accepted. The three democratic parliamentaryelections since 1990 each brought sharp changes in political direction, but allgovernments have retained a working majority and served out their four-yearterms. Party politics has also been relatively stable, with five of the six partiesrepresented in the 1998-2002 parliament present in the legislature since 1990.Political stability has been reinforced by negotiations for EU membership since1998 and accession to NATO in March 1999.
In the March-April 1990 parliamentary election the opposition HungarianDemocratic Forum (HDF) emerged as the most popular party and formed acoalition government with two other conservative parties, the SP and theChristian Democratic People’s Party (CDPP). The liberal parties, the Alliance ofFree Democrats (AFD) and the Federation of Young Democrats (Fidesz), joinedthe HSP in opposition. Jozsef Antall, the president of the HDF, became the primeminister and made a post-election deal with the AFD that increased his powers,as well as eliminating the two-thirds majority requirement on most legislation.Although the government set some important institutional reforms in motion,
Burying the past
Post-communist Hungary
6 Hungary
EIU Country Profile 2002 © The Economist Intelligence Unit Limited 2002
in 1993-94 it pursued an undisciplined spending programme that left thebudget in severe deficit and had a negative effect on the current-account deficit.
The May 1994 election returned the HSP to power. Despite having an absolutemajority, it formed a coalition government with the AFD. The governmentintroduced an austerity programme (the “Bokros Package”) in March 1995designed to curb the government deficit and the external account imbalances.Economic growth decelerated and real wages fell sharply as a result. By 1997these policies began to yield results and real GDP grew by 4.6%, but in the1998 parliamentary election voters punished the HSP-led government for theeffects of earlier austerity. Fidesz (which had added the Hungarian CivicParty—HCP—to its official name) won 148 seats against 134 for the HSP, andformed a new coalition government with two other right-wing oppositionparties, the HDF and the SP. Like both its predecessors, the government servedits four-year term until the scheduled election in April 2002.
Important recent events
October 1989: Democratic constitution proclaimed
March-April 1990: After a free election, the Hungarian Democratic Forum(HDF) emerges to form a centre-right coalition government.
December 1991: Association agreement with the EU signed.
December 1993: HDF prime minister Jozsef Antall dies and is succeeded byPeter Boross.
March 1994: Hungary applies for membership of the EU.
May 1994: The Hungarian Socialist Party (HSP) under Gyula Horn winselections and forms a coalition government with the Alliance of FreeDemocrats (AFD).
March 1995: The “Bokros Package” of wide-ranging austerity measures isintroduced, including fiscal cuts, devaluation, an import tax and wage controls.
April 1995: Hungary and Slovakia sign a “basic treaty” recognising existingborders and ethnic minority rights.
March 1996: Hungary is invited to join the OECD.
September 1996: Hungary and Romania sign a “basic treaty” recognisingexisting borders and ethnic minority rights.
July 1997: Hungary is invited to begin accession negotiations with the EUand NATO. EU accession negotiations begin in 1998.
May 1998: The Federation of Young Democrats-Hungarian Civic Party (Fidesz-HCP) wins the election and forms a right-wing coalition government underViktor Orban.
March 1999: Hungary, the Czech Republic and Poland join NATO.
January 2001: Industrial trade with EU becomes fully liberalised.
May 2001: Preparations begin for full convertibility of the forint, after thecurrency’s exchange-rate bands are widened.

Hungary 7
© The Economist Intelligence Unit Limited 2002 EIU Country Profile 2002
October 2001: The forint becomes fully convertible.
April 2002: Parliamentary election.
Constitution, institutions and administration
The constitution is a heavily amended version of the communist constitutionintroduced in 1949. A multiparty committee worked on a comprehensive newconstitution between 1994 and 1998, but divisions between parties and withinthe government prevented parliament from approving a new document. Thereis no state religion, but recognised religions receive state funding. The post-1998 government moved to elevate the position of the churches in public life.
Hungary is a parliamentary democracy with a single-chamber NationalAssembly. The electoral system is complex, combining elements of majorityand proportional voting. Of the 386 seats in the National Assembly, 176 areelected from individual electoral constituencies. An absolute majority isrequired for election to an individual district in the first round. Two or threetop candidates advance to the second round of voting, where a pluralitysuffices for victory. Candidates are not required to reside in the district inwhich they run. The remaining seats are distributed proportionally accordingto the party-list vote at the regional (county or Budapest) level, with a nationallist (for which citizens do not vote) operating as a top-up mechanism. In 1990there was a 4% minimum threshold for parties to enter parliament. Thethreshold was raised to 5% before the 1994 election.
The president, elected by parliament for a five-year term, has few formalpowers. The position is responsible for the nomination of certain posts, but islargely ceremonial. Mr Madl took office in August 2000. The constitutionpermits a maximum of two terms.
Until recently the judiciary was a three-tier system, involving local, county andhigh courts. A 1997 constitutional amendment added an additional tier, a courtof appeal. However, the post-1998 government failed to provide funding forimplementation of the appeal courts, which are to hear appeals submitted fromcounty court decisions and handle selected cases. There is also a constitutionalcourt, which is modelled on the powerful German model and has been highlyactivist. It has the power to review and invalidate parliamentary acts.
Reform of the legal system has generally been based on west European norms,with a view to preparing the judicial system for EU entry. However, there arestill several problem areas. In its progress reports the EU Commission has notedthat although the judiciary functions satisfactorily and the training of judgesin the acquis communautaire (the body of EU law) has progressed, the largebacklog of cases before the Supreme Court needs to be addressed. The low payand status of members of the judiciary is also a problem (salaries of lower courtjudges are only about one-third of those of private lawyers). Some doubtsabout the full independence of the judiciary were raised in the latter part of thepost-1998 government’s term.
The president and judiciary

8 Hungary
EIU Country Profile 2002 © The Economist Intelligence Unit Limited 2002
Despite extensive formal decentralisation to the local level, the centralgovernment retains strong powers. Local governments are small andfragmented, numbering over 3,000, and remain heavily dependent on thecentre for funds. The 19 county governments are directly elected but lackpolicymaking and fund-raising powers. The seven new regional bodies set upto participate in EU structural fund programmes are purely administrative, lackindependent funds and consist of government appointees and local delegates.Under the 1993 minority rights law, there are national and, where relevant,local governments for ethnic minorities.
The national government centres on a powerful prime ministership. The primeminister can be replaced only by a so-called positive vote of no confidence,which requires the naming of an alternative candidate at the time of the vote.Under the Fidesz-led government especially, the prime minister’s office hasemerged with a powerful agenda-setting and monitoring role. Individualministers in the government are not subject to parliamentary votes ofconfidence, but only to the prime minister’s authority. Ministries can bepowerful through the use of orders and decrees to implement policy. Thetraditionally conservative finance ministry was traditionally first among equalsamong the ministries, but its status has been downgraded under Fidesz, withthe more activist new Ministry of Economic Affairs emerging to take the keyrole in economic strategy design.
The use of close personal networks in policymaking and administration iscommon and probably inevitable in a country with such a small elite. Thepost-1998 right-wing government especially has felt hampered by hostilecommunist-era holdovers in public administration, and has put “its” peopleinto many positions. Government is still seen to some extent as anopportunity for patronage. The various ombudsmen and the State Audit Officehave achieved a good reputation for independence.
Political forces
Hungarian public life is strongly polarised around a historically and culturallyrooted split between the left and the right. In the Hungarian context, theliberal AFD is in effect on the left, along with the HSP, because of itsinternationalist, universalist and progressive outlook. Government-oppositionconflict is often bitter, but opposition parties have sometimes been willing toco-operate over more technical issues of bipartisan concern. Under normalcircumstances, the need for a two-thirds majority to amend some laws can givethe opposition some leverage.
The Federation of Young Democrats-Hungarian Civic Party(officially Fidesz-HCP, but known as “Fidesz”), the senior governmentparty in 1998-2002, was formed in 1988 by students in the law faculty atBudapest’s Eotvos University. During the conservative government of 1990-94,Fidesz espoused a liberal ideology and often co-operated with the AFD.However, its more liberal, pro-AFD leaders left in 1993. When the HSP-AFDgovernment coalition was formed in 1994, Fidesz remained in opposition andbegan to court conservative opinion. As part of its attempt to broaden its
Central and localgovernment
Political polarisation

Hungary 9
© The Economist Intelligence Unit Limited 2002 EIU Country Profile 2002
political appeal beyond the youth vote, the party dropped its upper age limit of35 in 1993, and added Hungarian Civic Party (HCP) to its name in 1995. Thesame year, in effort to change its image as a “youth” movement, the partyofficially dropped “Federation of Young Democrats” from its name, adoptingits Hungarian acronym “Fidesz” as the official name along with HungarianCivic Party. Fidesz became increasingly populist and socially conservative, andformed an electoral coalition with the HDF before the May 1998 election.Mr Orban’s abrasive style led to a decline in Fidesz’s popularity in 1999-2000,but it subsequently recovered. The party is now led by Zoltan Pokorni, withLaszlo Kover—who briefly followed Mr Orban in the leadership post in 2000—stepping down to concentrate on the 2002 election campaign.
The Independent Smallholders’ Party (SP) is a populist agrarian forceand the contemporary incarnation of a party of the same name popular in theimmediate post-war period. Its electorate is primarily elderly and rural. The SPparticipated in both the post-1990 and post-1998 right-wing governments. Inthe HDF-led government after 1990, the SP focused on the re-privatisation ofland. The party’s strong influence on this single issue resulted in a complicatedland compensation programme that worked to maintain small land-holdings.The party split as it pursued its goals, with more radical members under JozsefTorgyan gaining the upper hand by 1994. In opposition in the mid-1990s, theSP improved its electoral performance via radical criticism of the HSP-ledgovernment and became the key to the formation of the Fidesz-led coalition.However, a series of corruption scandals, including allegations made againstMr Torgyan, caused his resignation as agriculture minister and probably hisdemise as a significant political player. The SP has in effect disintegrated, withMr Torgyan’s rump party unlikely to remain in parliament after the 2002election and pro-government figures opting to run as Fidesz candidates.
The Hungarian Socialist Party (HSP) came into being in October 1989when a congress of the ruling HSWP voted to change the party’s name andaccept democratic politics. Reformers in the HSWP steered it in a newdirection, and the HSP declared itself a west European-style socialist party. Theparty received only 10.9% of the proportional vote in 1990 and went intoopposition. After the election the former foreign minister Gyula Horn becameparty chairman and began to bring together the various factions. The HSPunites diverse groups that include liberal economists who sought radicalreform of the state-centred economy, social democrats, trade unionists andmiddle- and lower-level officials from the previous regime. At various timesduring his prime ministership after 1994, different groups expresseddissatisfaction with Mr Horn’s leadership, but no substantial challengeremerged to lead the party into the 1998 election, which the HSP lost. Mr Hornretired from the party leadership after the election defeat. His protégé, LaszloKovacs, who served as foreign minister in 1994-98, was elected to the top HSPpost in September 1998, but failed to consolidate his position in the party orshow decisive opinion poll success. Although remaining party leader, hestepped aside in June 2001 to allow Peter Medgyessy to be nominated as theHSP’s compromise candidate for the prime ministership.

10 Hungary
EIU Country Profile 2002 © The Economist Intelligence Unit Limited 2002
The Alliance of Free Democrats (AFD) has its roots in the dissidentdemocratic opposition of the 1980s, which was prominent in the political trans-formation of 1988-89. In the 1990 election the AFD finished a strong second tothe HDF. In 1994 the AFD again finished second, but entered what turned outto be a difficult coalition with the HSP. By the 1998 election the party’s supporthad dropped substantially and has subsequently failed to recover. Some AFDvoters never accepted the party’s coalition with the HSP, with some in theleadership also doubtful over the wisdom of the alliance. However, in currentpolitical circumstances, the HSP remains the party’s natural partner. The AFD isa liberal party, with a focus on a small state and individual rights. The partydraws its main support from wealthy, well-educated urban voters. With theAFD’s national position weak since 1998, its hold on the Budapest mayoralty,with Gabor Demszky in the post since 1990, has become increasinglyimportant. However, Mr Demszky could face a strong challenge from the rightin the autumn 2002 poll. Mr Demszky’s attempt to combine his Budapest postwith the party leadership in 2001 was unhappy and short-lived; the partyleadership has now reverted to former interior minister Gabor Kuncze.
Once the leading force in government, but now a minor partner of Fidesz, theHungarian Democratic Forum (HDF) was formed in 1987 by a group ofpopulist-oriented intellectuals and cultural figures allied with Mr Pozsgay. Asprime minister and party leader, Jozsef Antall consolidated control over theparty and moved it away from its more populist roots and towards a moreconservative and Christian Democratic profile. This change angered manyradicals within the HDF, which had difficulty regaining unity after theexpulsion of one of its founders, Istvan Csurka, for attacking the leadership,and the subsequent death of Mr Antall. After a heavy defeat in the 1994election, in February 1996 many HDF moderates left to form their own party,the Hungarian Democratic People’s Party (HDPP). The HDF gained17 parliamentary seats in 1998 on the strength of its alliance with Fidesz,having failed to gain representation based on the proportional party list vote.The HDPP won no parliamentary representation. For the 2002 election theHDF abandoned all hope of achieving parliamentary representation alone andin effect merged with Fidesz for electoral purposes—the two parties will standon the first joint regional lists in Hungary’s post-communist electoral history.
The Hungarian Justice and Life Party (HJLP) was formed in 1993 whenthe radical populist/nationalist Mr Csurka and his supporters were expelledfrom the HDF. Mr Csurka is a controversial figure who receives a great deal ofmedia attention. He wants the post-first world war territorial settlement to bereopened, and his statements often include thinly veiled anti-Semitism. Theparty opposed Hungary’s membership of NATO, and although it formallysupports EU accession, it wishes this to take place only many years in thefuture, when Hungary is “stronger”. In 1994 the HJLP failed to gainparliamentary representation, but it garnered 5.5% of the vote in 1998. As the2002 election approached Mr Csurka attempted increasingly to portray himselfas a future government player, although no other political force wouldcountenance any formal political co-operation.

Hungary 11
© The Economist Intelligence Unit Limited 2002 EIU Country Profile 2002
Parliamentary election results 1994 1998
% vote Individual Seats in % vote Individual Seats infor party districts parlia- % of for party districts parlia- % of
list won ment seats list won ment seats
Alliance of Free Democrats (AFD) 19.7 16 69 17.9 7.6 2 24 6.2
Christian Democratic People’s Party (CDPP) 7.0 3 22 5.7 2.3 0 0 0.0
Federation of Young Democrats (Fidesz) 7.0 0 20 5.2 29.4 90 148 38.3
Hungarian Democratic Forum (HDF) 11.7 5 38 9.8 2.8 17 17 4.4
Hungarian Justice and Life Party (HJLP) 1.6 0 0 0.0 5.5 0 14 3.6
Hungarian Socialist Party (HSP) 33.0 149 209 54.1 32.9 54 134 34.7
Smallholders’ Party (SP) 8.8 1 26 6.7 13.2 12 48 12.4
Other parties 11.2 2 2 0.6 6.3 0 0 0.0
Independent candidates – 0 0 0.0 – 1 1 0.3
Total 100.0 176 386 100.0 100.0 176 386 100.0
Memorandum itemTotal votes cast 5,400,194 – – 4,526,860 – – –Source: Press reports.
Main political figures
Viktor Orban: Prime minister after 1998 and leading figure of the Federationof Young Democrats-Hungarian Civic Party (Fidesz), although he gave up theparty leadership at the end of 1999. From the fiery speech at the reburial ofImre Nagy in 1989 demanding the withdrawal of Soviet troops with which hefirst made his mark, Mr Orban has often courted controversy with outspokenrhetoric. Under his unchallenged leadership since 1993, Fidesz has shed itsliberal political identity and moved steadily to the right. He has been anenergetic prime minister, but his imperious style has made him unpopular withmany. Since relinquishing the party leadership, he has attempted to project aless combative image.
Peter Medgyessy: A minister in the last years of communist rule and the lastfinance minister of the government led by the Hungarian Socialist Party (HSP)in 1996-98, presiding over the pension reform and the improvements ingrowth, inflation and external accounts that followed the implementation ofhis predecessor’s “Bokros Package”. He held senior posts in the private financialsector and worked as a consultant after 1998, before returning to the politicalstage after being chosen as the HSP’s prime ministerial candidate in 2001. He isnot a member of parliament or the party. His liberal economic record andbusiness links helped his emergence as a compromise candidate for the HSPnomination, especially as it appeared increasingly likely that the party wouldneed a repeat partnership with the liberal Alliance of Free Democrats (AFD) inorder to govern again.
Laszlo Kovacs: Foreign minister in 1994-98 under the HSP’s Gyula Horn, ofwhom he is a close protégé. Mr Kovacs took over from Mr Horn as HSP leaderafter the party’s 1998 election defeat, but with his moderate leadership stylefailed to impose himself decisively on the party or the electorate. Mr Kovacsruled himself out of consideration as the HSP’s prime ministerial candidate for
12 Hungary
EIU Country Profile 2002 © The Economist Intelligence Unit Limited 2002
the 2002 election but remains party leader. He would be in line to return to theforeign ministry were the HSP to form another government.
Jozsef Torgyan: Chairman of the Smallholders’ Party (SP), Mr Torgyan was alawyer before entering politics in 1989. Conflict during the first post-communist government under Jozsef Antall saw Mr Torgyan split his party andtake his more radical wing out of the coalition, before establishing himself asthe main SP force via a comeback in the 1994 election. Although his populistrhetoric in opposition earned him support, he moderated his image sufficientlyto be able to enter government with Fidesz in 1998. However, he was broughtdown as agriculture minister by corruption allegations, compounded by angerin his core agricultural constituency about the state of the sector andfrustration in his party about his authoritarian leadership style. With his rumpSP unlikely to enter parliament in the 2002 election, Mr Torgyan appearedincreasingly a spent political force.
Istvan Csurka: Controversial founder and leader of the far-right HungarianJustice and Life Party (HJLP), following his expulsion from the HungarianDemocratic Forum (HDF) in 1993. Owing to Mr Csurka’s strident nationalism,no other parliamentary parties will countenance a formal alliance with him,but he has increasingly talked up his prospects as a major political player.
Zsigmond Jarai: Appointed governor of the National Bank of Hungary(NBH, the central bank) for a six-year term in March 2001, after serving asfinance minister in the ruling coalition since June 1998. His tenure as financeminister followed a career in senior private- and public-sector finance posts.Although his previous relations with the government probably meant greatertolerance of pre-election fiscal loosening than might have occurred underother governors, Mr Jarai has presided over a new central bank act thatenhances its independence and enshrines price stability as its overriding goal.Mr Jarai was also responsible for the surprising widening of the forint’sexchange-rate band in May 2001, which helped to reduce inflation in the latterpart of that year.
Ferenc Madl: Mr Madl began his first five-year presidential term in August2000. After a career as an academic lawyer, he ran previously as the right’scandidate for the post in 1995. He was nominated again in 2000 as acompromise candidate intended to bridge a rift between Fidesz and the SP.Mr Madl seems to have been accepted by the opposition as a non-partisanhead of state.
International relations and defence
The presence of large Hungarian minorities in neighbouring countries has beena source of problems for Hungary since the 1920 Treaty of Trianon, whichreallocated more than two-thirds of the country’s pre-first world war territory(mostly to Romania, Czechoslovakia and the future Yugoslavia). During the1980s the difficulties faced by Hungarian minorities, particularly in Romania,were an important mobilising element for the opposition parties. Since thecollapse of communist rule, Hungarian governments have sought to balancethe need to build constructive relations with neighbours with the wish to
Minorities and neighbours

Hungary 13
© The Economist Intelligence Unit Limited 2002 EIU Country Profile 2002
extend greater support to the Hungarian minorities. There are perhaps2.7m-3.3m Hungarians in Hungary’s neighbouring states, including upwards of1.6m in Romania and around 500,000 in Slovakia. Generally, the Hungarianleft has prioritised state-to-state relations, whereas the right has given greaterweight to the claims of the minorities.
Under the 1994-98 HSP-led government, basic treaties were signed withSlovakia (1995) and Romania (1996), guaranteeing existing borders as well asminority rights. The Fidesz-led government sought to build on this foundation,for example by supporting Romania’s and Slovakia’s western integration.Relations with Romania were facilitated when that country’s main Hungarianparty, the Hungarian Democratic Union in Romania (HDUR), entered acoalition government with reformist forces in 1996. Hungary’s first two-waylabour exchange agreement, for 8,000 seasonal workers per year, was signedwith Romania in May 2000. The leftist Party of Social Democracy (PSD) wonthe Romanian election in November 2000, but its minority administration hasdepended on the support of the HDUR, with which it has signed aparliamentary co-operation agreement. Romania’s drive to joint NATO isexerting pressure on its government to maintain good relations with Hungary,and to provide new educational and cultural rights to its large ethnicHungarian minority.
Slovak-Hungarian relations also improved after the November 1998 electionbrought the ethnic Hungarian party into the Slovak government. The two sideshave been negotiating on the outstanding issue of the disputedNagymaros/Gabcikovo Danube dam project, agreed between the twocommunist governments in 1977, which Slovakia chose to continue afterHungary withdrew on cost and environmental grounds.
However, the Hungarian minority issue remains highly sensitive, and in 2001Hungary’s relations with both Romania and Slovakia were put under severestrain by the so-called Status Law, passed by the Budapest parliament in June2001. The legislation offered Hungarians living in Hungary’s neighbouringstates the opportunity to apply for a Hungarian identity card that would entitlethem to education, healthcare, travel and cultural discounts, and short-termwork opportunities in Hungary. Parents educating their children in Hungarian-language schools in Hungary’s neighbours would also be able to apply forfinancial support from Budapest. The legislation was intended to offer practicalsupport to the Hungarian minority communities as well as symbolicreassurance that Hungary’s western integration, and its “disappearance”behind the Schengen border at the new frontier of the EU, would not meanabandonment of Hungarian minorities in non-EU member states.
However, Romania and Slovakia regarded the Status Law as discriminatory andextra-territorial and as destabilising the system of bilateral relations built upsince the mid-1990s. However, Hungary and Romania agreed a bilateralmemorandum in late 2001 that involved significant Hungarian concessions,most notably the extension of the short-term employment opportunity to allRomanian citizens. This concession was attacked by the HSP for threateningthe Hungarian labour market, reducing the government’s incentive to makesimilar concessions to Slovakia. With pre-election passions also rising in

14 Hungary
EIU Country Profile 2002 © The Economist Intelligence Unit Limited 2002
Bratislava, it appeared that no agreement would be reached between the twostates before the Hungarian parliamentary election.
As regards the Hungarian minority in Yugoslavia (Serbia-Montenegro),Hungary faced its greatest test when NATO—of which Hungary was a newmember—took military action against Yugoslavia in 1999. Budapest was fearfulof a backlash against the Hungarian minority in the province of Vojvodina andrelieved that only logistical support was required, but in political terms itbacked the NATO action strongly as a defence of minority rights. Relationswith Yugoslavia since Slobodan Milosevic’s ouster in 2000 have improved, withHungary encouraging Yugoslavia’s democratising and Westernising course andYugoslavia returning a degree of autonomy to Vojvodina and passing aminority rights law in early 2002.
Hungary was developing links with international bodies well before the 1991dissolution of the Warsaw Pact (established in 1955) and the Council forMutual Economic Assistance (CMEA, or Comecon; 1949). It joined the UN in1955, and the IMF and the World Bank in 1982. Entry into the GeneralAgreement on Tariffs and Trade (GATT) in 1973 allowed it to become afounding member of the World Trade Organisation (WTO). Hungary signed atrade and co-operation agreement with the European Community in 1988 andwas a founding member of the European Bank for Reconstruction andDevelopment (EBRD) in 1991. In 1991 Hungary, Poland and Czechoslovakiaformed the Central European Free-Trade Agreement (CEFTA). Hungary wasinvited to join the OECD in 1996, and joined the International Energy Agency(IEA) in 1997.
Hungary applied to join the EU in March 1994. In July 1997 the EuropeanCommission’s Agenda 2000 report recommended beginning accessionnegotiations with Hungary, alongside the Czech Republic, Poland, Slovenia,Estonia and Cyprus. The Commission noted that Hungary had a developeddemocracy with stable institutions, a functioning market economy, and aproductive base and legislative framework already compatible with single-market membership in many areas. Annual “progress reports” havesubsequently commended Hungary’s move towards monetary convergenceand structural complementarity with the EU. In the course of 2001 the EUadopted enlargement in 2004 as an objective and named Hungary as one often states that should be able to join at that date. However, the EU continuesto call on Hungary to make more progress in some areas, notably theavoidance of unsustainable budgetary and external deficits, a better resourcedjudiciary, elimination of corruption, and improvements in consumerprotection, customs control, environment and energy.
Accession talks began in 1998. The government has emphasised itscommitment to defending the national interest, and Mr Orban hasperiodically attacked the EU for its negotiating demands and delays, butHungary has often been willing to make compromises in order to reachagreement earlier than other candidates. In June 2001 Hungary closed the freemovement of people and free movement of capital chapters of the acquiscommunautaire (the body of EU law). In doing so it agreed to restrictions on
Growing internationalintegration
Westward reorientation

Hungary 15
© The Economist Intelligence Unit Limited 2002 EIU Country Profile 2002
labour mobility of up to seven years. In return, the EU agreed on transitionperiods for the sale of arable land to companies and joint ventures of sevenyears and to self-employed EU farmers of three years. Non-arable land sales arerestricted for five years. Some problem areas remain: in agriculture, forexample, which is to be negotiated in 2002, Hungary wants to retain the rightto subsidise agricultural investments, even though EU regulations limitinvestments in areas where there is chronic overproduction.
Admission talks with NATO commenced in September 1997, and in aNovember 1997 referendum 85% of those who voted (turnout was only 49%)approved entry to the alliance. The admission protocol was signed inDecember 1997, and the formal signing ceremony for membership occurred onMarch 12th 1999. Hungary has benefited from providing a forward base for theNATO-led Stabilisation Force (SFOR) and the earlier Implementation Force(IFOR) in Bosnia and Hercegovina (BiH). A 300-member Hungarian technicalcontingent also served in both forces. These activities led to close co-operationbetween NATO and the Hungarian armed forces.
Military forces, 2000
Active forcesArmya 13,430Border guards 12,000Air force 7,500UN & peacekeeping 816Total incl others 33,810 of which: conscripts 22,900
ReservesArmy 74,900Air force 15,400
a Includes 270 personnel in Army Maritime Wing.
Source: International Institute for Strategic Studies, The Military Balance, 2001-2002.
The government has promised a virtual doubling of defence spending, raisingthe defence budget by 0.1% of GDP over four years, in order to carry out thesubstantial modernisation, especially of communications and aircraft, requiredfor military compatibility with NATO. Major military reforms have still to becarried out, including substantial technology upgrades. The military continuesto reduce the number of active troops, and has discussed ending conscription(which has been cut to six months), but the pay increases needed to effect thishave proved difficult to fund.
Security risk
Armed conflict
Hungary faces few external security risks, especially since becoming a memberof NATO. Austria borders Hungary, and four of Hungary’s neighbours areleading candidates for either NATO or EU membership. The security situationin neighbouring Croatia and Yugoslavia (Serbia-Montenegro) has improvedmarkedly, and Ukraine has long tried to establish closer ties with Europeansecurity organisations. Security along the borders with Croatia, Yugoslavia and
Defence

16 Hungary
EIU Country Profile 2002 © The Economist Intelligence Unit Limited 2002
Ukraine remains an issue in EU accession negotiations, with Hungary recentlyhaving taken several steps to bolster surveillance. Sizeable minorities of ethnicHungarians in Slovakia, Romania and Yugoslavia have been a source ofcontention between Hungary and its neighbours in the past, but Hungarianauthorities long ago gave up claims to Hungary’s former lands. The risk ofarmed conflict is thus low.
Terrorism
By lending its airspace and military bases to the US-led “war on terror”,Hungary has probably increased the risks of becoming a terrorist target itself,although the likelihood remains low. Hungarian security forces have steppedup their patrols of the country’s borders and airports since September 11th andremain on high alert.
Civil unrest
With the exception of the 1956 events, Hungary’s post-war history has beenfree of civil strife. The risk of civil or labour unrest is extremely low, especiallygiven Hungary’s homogenous society and lack of divisive issues. A majority ofthe population looks forward to joining the EU, and an overwhelmingmajority maintains a pro-Western outlook.
Violent crime
Violent crime is not much of a problem in Hungary, although petty crime is aconcern and has been growing in frequency since the fall of communism.Tourists, and tourist areas, are especially the targets of petty criminals,pickpockets and scam artists. Theft of, and from, vehicles is also common.Although decreasing in number, incidents still occur infrequently in certainbars and restaurants in Budapest where tourists are charged exorbitant pricesand then threatened with physical violence.
Drug smuggling and organised crime
If Hungary faces any substantial security risks, they emanate from the activitiesof organised crime in the country, particularly that of the Russian mafia. Sincethe fall of communism in the region, organised crime activities have risensignificantly, especially that of Russian, Italian, ethnic Albanian, Nigerian, andChinese criminal organisations and Colombian drug-trafficking groups.Hungary shares a border with seven countries and its well-developedtransportation network makes it a logical transit zone for smuggling. Recentevidence shows that it also is a transit point on one of the pathways forsmuggling heroin to western Europe from Afghanistan and other parts ofCentral Asia. Authorities have tightened border controls, altering smugglingmethods, but having little discernible impact on the extent of traffic.

Hungary 17
© The Economist Intelligence Unit Limited 2002 EIU Country Profile 2002
Resources and infrastructure
Population
Hungary is one of the smaller European countries. According to preliminarydata from the February 2001 census, the population is 10,195,513. The capitalcity, Budapest, is losing inhabitants but remains home to just under 1.8mpeople, or 18% of the population, and 47% live in other urban areas. The agestructure of the population is typical for Europe, with 17% of the populationbelow the age of 14 and 20% aged 60 or above in 2000.
In ethnic terms, the population is relatively homogeneous, especiallycompared with many other countries in the region. Relevant figures from the2001 census are not yet available, but the 1990 census showed minorities,including Roma (142,700), Germans (30,800), Croatians (13,600), Romanians(10,700) and Slovaks (10,500), totalling only around 2% of the total populationat the time. Unofficial estimates suggest that the minority populations arehigher; the European Roma Rights Centre claims that there are more than halfa million Roma, 5.7% of the population. Hungarian minorities inneighbouring countries are much larger, at least 3m, and thus have a higherpolitical profile than domestic minorities, who are mostly assimilated. Politicalmobilisation by Hungary’s Roma, however, has become increasingly visible.(See Reference table 1 for population statistics.)
Population by age, 2000(‘000)
Age bracket Males Females Total
0-14 880.0 837.3 1,717.2
15-19 334.2 320.1 654.3
20-39 1,471.0 1,421.7 2,892.8
40-59 1,346.5 1,458.2 2,804.8
60-74 573.5 832.5 1,406.0
75+ 186.6 381.6 568.2
Total 4,791.8 5,520.8 10,043.2
Source: Central Statistical Office (CSO), Statistical Yearbook.
Hungary’s population has been falling since 1982, when the death rate beganto exceed the birth rate. According to official figures, the population droppedfrom 10.38m in 1990 to 10.01m at end-2000. The 2001 census, however,confirmed that the population may be higher than previously thought,probably owing to immigration since 1990. The birth rate declined from12.3 per 1,000 population in 1991 to 9.4 in 1999, but recovered somewhat in2000 and 2001, to 9.7 per 1,000. The death rate rose to a peak of 14.6 per 1,000in 1993, before falling back to 13.2 per 1,000 in 2001.
The ageing population has placed an increasing strain on the traditionallygenerous system of pensions and early retirement. Successive governmentshave worked to tighten eligibility for pensions and let them erode against
Ethnic homogeneity
An ageing population

18 Hungary
EIU Country Profile 2002 © The Economist Intelligence Unit Limited 2002
inflation, but the growing voting power of older people makes it hard tocontinue this. After 1994 the government led by the Hungarian Socialist Party(HSP) significantly reduced maternity and family benefits as part of its austeritydrive, and the post-1998 administration led by the Federation of YoungDemocrats-Hungarian Civic Party (Fidesz) has sought to increase support forfamilies via tax breaks. Reversing the population decline has been an explicitaim of the Fidesz-led government.
Unemployment rose sharply during the economic downturn of the early1990s, and the subsequent return to strong growth was slow to bring it downbecause of rapidly rising labour productivity, especially in manufacturing withheavy foreign investment. Employment has also contracted, reflecting ademographic decline in the working-age population, and a fall in theparticipation rate as older or less-skilled workers are sidelined from the labourmarket. According to labour force surveys by the Central Statistical Office(CSO), the economically active population fell from 5.28m persons in 1989 toa low of 4m in 1997. However, it has since started to rise, recording 4.11m in2000, although it fell back again slightly in 2001. Between 1990 and 2000 thepercentage of the working-age population that was not economically activegrew from 15.9% to more than 33.9%. Whereas virtually all of theeconomically active population was employed in 1989, at the end of 2001some 226,500 persons were unemployed, or 5.6% of the economically activepopulation. However, registered unemployment at labour offices was higher, at343,000 at end-2001 (for more on unemployment, see The economy).
The nature of employment has also changed. There has been a marked shiftaway from employment in agriculture towards service occupations. Accordingto CSO surveys, 15.8% of the labour force was employed in agriculture andforestry in 1991. By 2001 the percentage had fallen to 6.2%. Between the twodates employment in agriculture dropped by over 222,000. The share ofindustry in employment declined from 29.5% to a low of 26.7% in 1995 beforerebounding somewhat. Job creation and redeployment in the services sectorsaw employment there rise to 60% of the total by 2001. (See Reference table 2for data on the labour force.)
Education
Educational attainments are comparable to those of western Europe. A highstandard of general and vocational education has been important in attractingforeign employers to Hungary, especially in new-technology sectors. In 1999carmaker Opel reported that the workforce at its Szentgotthard componentplant was significantly better educated than its counterpart in Germany, withmore than half holding a degree or equivalent qualification. Among centralEuropean countries, Hungary is consistently at the top of the educationspending league table. However, annual state spending on education as apercentage of GDP declined from about 7% in the early 1990s to under 5% inthe late 1990s and 2000, as the government was forced to curtail expenditure.The post-1998 government attempted to reverse this trend as it sought toencourage an expansion in higher education in particular. Primary and
Labour force

Hungary 19
© The Economist Intelligence Unit Limited 2002 EIU Country Profile 2002
secondary education have been decentralised since the transition. Church andprivate schools educate about 4% of students, the rest attending state schoolsrun by local authorities.
Schooling is compulsory for children between the ages of six and 16. Under thecommunist regime, education in a general elementary school was usuallyfollowed by four types of outcomes: exit from school; apprentice school forskilled workers’ training; vocational secondary school; and gymnasium orgeneral secondary school. The gymnasium was the primary feed for universityeducation, although other higher education institutions were fed fromvocational secondary schools. This system has persisted since 1989, andcompletion rates for general elementary school remain quite high.
Apprentice schools have declined as a destination among secondary students. In1990/91, 45% of those completing elementary school continued to apprenticeschools; in 1999/2000 only 25% did so. The percentage continuing tovocational secondary schools increased from 28% in 1990 to 39% in 1999/2000,and the percentage continuing to gymnasium rose from 21.1% to 31.6%. Thesechanges reflect a move away from an emphasis on industrial productiontowards a more diversified market economy, where higher education is valuable.Another trend that reflects the growing importance of preparation for highereducation is the re-emergence of gymnasium schooling in grades five to eight.
In 1990/91 only 8.5% of the population aged 18-22 was attending university orcollege, applicants’ success rate being 36%. By 1999/2000 enrolment had morethan doubled, to 17.5%, with 52.1% of applicants gaining admission. Expansionhas been helped by the Fidesz-led government’s elimination of the tuition feesfor first-degree programmes introduced by its predecessor. University educationlasts for five years, and college-level programmes can range from three to four.The 89 universities, colleges and other institutions of higher education retaintheir traditional subject specialisms. In 1998 the government began plans toconsolidate the number of state higher education institutions in connectionwith a US$150m World Bank loan, which also financed renovation and con-struction of buildings, training for managers in higher education, reforms ofinformation systems, and implementation of a student loan programme.
Health
Despite a relatively high share of healthcare spending in GDP, Hungarianshave the lowest life expectancy among OECD member countries. The healthof the Hungarian population has been poor by international standards forseveral decades, and a 1999 World Bank study warned of an impending“public health crisis” without expansion and better allocation of resources. In2000 life expectancy at birth was 67 years for men and 76 years for women.The figure for men has returned to its 1965 peak, after hitting a low of 64.5in 1993. The suicide rate is one of the highest in the world, at more than30 per 100,000 inhabitants, although the rate is gradually declining. Infantmortality has continued to decline, from 47.6 per 1,000 live births in 1960 to9.2 per 1,000 in 2000.
Higher education

20 Hungary
EIU Country Profile 2002 © The Economist Intelligence Unit Limited 2002
With little experience of preventative medicine, the healthcare system faces anageing population characterised by unhealthy lifestyles and accustomed tocheap medication. Average annual drug consumption is the second highest inEurope after France; the Economist Intelligence Unit estimates that the drugsbill accounts for nearly 30% of state healthcare spending, compared with theusual rate of 10-15% seen in similar countries. Healthcare remainsconcentrated on the hospital sector rather than primary care. Hospitals areoversupplied with doctors and specialists but lack nurses and new equipment.Some reorientation has begun but the process is slow, with inertia coming fromlobbies in the industry as well as from the general population. The number ofhospital beds per 1,000 population dropped from 11 at the beginning of the1990s to just over eight in 1998, slightly lower than the ratio in Germany, on apar with that in France and double that in the UK and the US. Earnings in thehealthcare sector relative to the total economy ranked among the lowest in theOECD in 1996, and the continued erosion of pay against private-sectorcounterparts makes competent staff hard to retain. The hospital sector hasbeen hit by numerous cash crises and threatened strikes in recent years.
Basic health services are available through the National Health InsuranceFund (NHIF), part of the social security system. The NHIF is an extra-budgetary organisation, which acts as purchaser of services of doctors,hospitals, and other providers. It has substantial autonomy, but was broughtunder closer finance ministry supervision by the Fidesz-led government in1998 after a ballooning of the deficit. The Fund receives a combination ofemployer and employee contributions, with people outside the labour forcecovered by state contributions.
Local governments are largely responsible for service provision, providing mostprimary healthcare and operating a majority of hospitals. Local district doctorsprovide basic healthcare services and make referrals to specialists. All services,including hospital care, are in theory free to the patient. Primary care isreimbursed by flat fees per patient, which are adjusted according to the ageprofile of the patients and the qualifications of the doctors treating them.Outpatient treatment is paid on the basis of a points system, and hospital careis reimbursed according to diagnostic group. However, tipping of doctors inthe state system is common, particularly for advanced services such as surgery.In addition, doctors receive private patients in their free time, both in separateprivate practices and occasionally at their official practice. This informalsystem supplements the low salaries received by medical professionals andencourages a de facto fee-for-service system. Medicines are heavily subsidised,although price caps on prescribed drugs since 1999 have helped to reduce theresultant NHIF deficit.
Responsibility for healthcare planning is divided between the NHIF and theministries of health and finance, with the economy ministry and the primeminister’s office also involved. Turf wars between bureaucracies, the stronglobbying efforts of doctors, and political conflict within the government andwith the opposition caused large-scale reform to stall under the Fidesz-ledgovernment, although the administration has shown signs that it is aware ofthe needed direction of reform. A first step was taken in February 2000, with
Poorly structuredhealthcare system
Systemic reform delayed

Hungary 21
© The Economist Intelligence Unit Limited 2002 EIU Country Profile 2002
passage of a law giving 7,000 general practitioners, paediatricians and dentiststhe right to practise free of charge. Currently these practitioners are contractorswith the NHIF and have been selected through tenders offered by localcouncils. A component of the legislation is a Ft70bn (US$250m) loan guaranteeprogramme for doctors to allow them to purchase doctors’ offices andequipment from local councils. Some reform to the status of hospitals wasintroduced but had little time to take effect before the 2002 election.
Natural resources and the environment
Hungary has a land area of 93,030 sq km and a population in February 2001 of10,195,513, which gives the country a population density of 109.6 per sq km,similar to that of France and Poland. The country is a low-lying plain dividedroughly into three equal parts by two rivers running north-south, the morewesterly Danube and the Tisza towards the east. The land is generally fertile,with about 70% suitable for agriculture. Hungary lacks extensive domesticenergy resources and raw materials, except for bauxite.
There are three primary geographic regions. Transdanubia, the area lying westof the Danube, is a hilly region extending to the foothills of the Austrian Alps.It is primarily an agricultural area with crops, livestock and viticulture. TheGreat Plain (Nagy Alfold), lying east of the Danube and including the Tiszariver basin, contains about half of the country and includes regions of fertilesoil, sandy areas and wetlands. Drainage projects in the late 19th centurycurbed the traditional floods and opened the land for cultivation, although theflood problem has returned to the region in recent years. The northern hillsrun from north of Budapest to the north-east along the Slovak border. Thecountry’s limited mineral deposits (and the Tokay wine region) are largelylocated in this area, which was the location for most of the heavy industries ofthe communist era.
There are a few moderately high ranges of mountains, but only 2% of thecountry reaches heights of 300 metres or more. The highest peak is Kekes at1,014 metres. Lake Balaton in Transdanubia is the largest lake in centralEurope, measuring 78 km in length and between 3 km and 14 km in width.The hills surrounding the lake are an important site of viticulture. Budapestand much of the remainder of the country have numerous thermal spas. Theclimate is subject to dramatic changes. Average daytime temperatures inBudapest range from minus 1-4°C in January to 16-28°C in July. There is aslight variation in the climate across the country, with the south slightlywarmer and the north and east slightly cooler.
Transport, communications and the Internet
Decades of underinvestment during the socialist period left rail, road andtelephone systems dilapidated. The trend has been reversed since 1989 assignificant inflows of international capital have been directed towardsinfrastructure. However, public finance constraints have led to the scaling-
Three main regions
22 Hungary
EIU Country Profile 2002 © The Economist Intelligence Unit Limited 2002
down or cancellation of some long-awaited projects, notably the Ft160bn(US$571m) Budapest metro expansion scrapped in 1998.
Upgrading of the motorway network has been one of the infrastructurepriorities. In 1993 the European Bank for Reconstruction and Development(EBRD) headed a consortium providing US$200m of financing for thecompletion of the motorway linking Budapest and Vienna. The project wascompleted in 1995. This remains the only motorway from Budapest to reachone of Hungary’s borders. In 2000 the government approved a seven-yearroadbuilding programme, involving the construction of 702km of roads,bringing forward targets originally planned for a ten-year period. Preference isbeing given to routes that form part of European transport corridors. Theroadbuilding programme was further accelerated, extended to 2015 andexpanded to include other infrastructural projects, as an economic stimulusmeasure in October 2001. Under this “Szechenyi Plus” programme, statespending on the new tranche of projects is budgeted at Ft302bn, but the totalcost of the programme is given as Ft1,244bn.
With support from the EBRD and the EU’s instrument for structural policies forpre-accession (Ispa), the M3 motorway (running north-east from Budapest) isdue to reach the border by 2004. The motorways running south-west andsouth-east from Budapest are also under development, as are several bridgesover the Danube and Tisza, non-motorway inter-city roads and ring-roads. Itwas initially hoped that much motorway construction could be privatelyfinanced, with builders recovering their outlay through tolls, but protests atthe level of these forced the government to renegotiate, and to step up thepublic contribution.
Road transport has replaced railways as the primary form of freight haulage,reflecting both the improvements in main road provision and past lack ofinvestment in the state-owned railway, MAV. Waterway shipping began torecover in 1996 after the lifting of sanctions against Yugoslavia (Serbia-Montenegro), but growth slowed in 1997-98 and another reversal was inflictedby damage to bridges over the Danube at Novi Sad in Vojvodina duringNATO’s air strikes against Serbia in 1999. Although most of the debris had beencleared by mid-2000, temporary pontoon bridges continued to disrupt rivertraffic. Air cargo plays a minor role in the freight system, although smallvolumes of higher value-added products are imported and exported this way.
Although the dominant form of long-distance passenger traffic is still bustravel, the private car plays an important role in Hungarian life. Car ownershipincreased from 187.6 per 1,000 of the population in 1990 to 244.4 per 1,000 in2001. Air passenger traffic has grown rapidly in the past five years, but it stillmakes only a small contribution to total long-distance passenger traffic.Capacity at Budapest Ferihegy, the international airport, rose to 5.5mpassengers per year after a recent expansion. (See Reference table 3 fortransport statistics.)
Motorway construction
Freight haulage
Passenger transport

Hungary 23
© The Economist Intelligence Unit Limited 2002 EIU Country Profile 2002
Early telecommunications privatisation initially brought an advantageouscombination of faster improvement in the fixed-line network run by Matav andgrowing competition as the network began to open to rival companies. Develop-ments in mobile and cable telephone technology also helped to improvecompetition ready for the strong growth in demand for Internet and other formsof data transmission. The number of telephone lines has risen from 1.8m in 1989to nearly 4m by 2001 (close to 40% penetration), helped by more than US$3bnof foreign direct investment (FDI) and total investment into the sector since1989 of nearly US$6bn. The density of the cable telephone network hasincreased significantly, and the mobile network has expanded at a very fast pace.Matav’s monopolies have been progressively removed; the last, on long-distanceand international fixed-line calls, ended on January 1st 2002, a year earlier thanoriginally scheduled. Majority owned by Deutsche Telekom since that firmbought out consortium partner Ameritech (US) in 2000, Matav embarked on anambitious upgrading of capacity and expansion of mobile services.
Matav’s hold over the country’s main telecoms networks has been difficult tobreak, and this is partly responsible for a loss of momentum in recent yearsthat has left Hungary with some of the region’s highest call and Internet accesscharges. In 2000 Matav persuaded the State Procurement Committee toprevent the Post Office from switching its information technology account toPanTel, the alternative national network established by KPN (Netherlands) andthe railway company MAV. Moreover, in 1999 Matav acquired cable networksin the regions where its fixed-line monopoly had been broken, and spun off itscable subsidiary to insurance company Hungaria to side-step monopolyrestrictions. Matav still controlled more than 75% of access lines in mid-2000,despite a sale of local telephone operators (most acquired by France’s Vivendi)in 2000. Although Matav’s long-distance and international voice callmonopoly expired at the end of 2001, local services will not be fullycompetitive in all areas until November 1st 2002—a target date that could, asin many EU countries, be missed because of difficulties in inducing othercompanies to compete for the “local loop”. Number portability, important tothe easy switching of customer accounts, is not envisaged until 2004.
Matav has been pushed to improve by the well-developed cellular telephonemarket. The rapid growth in mobile telephone service subscribers continued in2001, with the market penetration rate increasing to 45%, surpassing that of thefixed-line market. The current market leader is Westel 900, a unit of Matav,which owns the mobile phone operator outright after taking an option topurchase the 49% stake previously held by Deutsche Telekom. The secondlargest operator is Pannon GSM, in which KPN holds a 45% share along withstakes owned by Norway’s Telenor and Finland’s Sonera. The latest entrant tothe market, Vodafone, which started providing services on 1800 MHz in 1999, isthe local unit of the UK mobile company of the same name, in a joint venturewith Antenna Hungaria and RWE Telliance of Germany. All three service prov-iders offer wireless application protocol (WAP) services, although less than 10%of subscribers currently have WAP phones. General packet radio service (GPRS)networks were wheeled out in 2001. Hungary intended to launch a tender for3G universal mobile telecommunications service (UMTS) licences in 2001, but
Telecommunications:progress has slowed
Mobile phone penetrationsurpasses fixed-line
24 Hungary
EIU Country Profile 2002 © The Economist Intelligence Unit Limited 2002
postponed the sale until 2002, citing poor market conditions. The authoritiesare planning to offer three licences for sale, estimated to be worth Ft21bn.
Matav has also been accused of exploiting its network ownership advantage inassignment of capacity for high-speed (ADSL) Internet connections, helping itto defend a 45% share of the dial-up access market. Matav and KPN are alsobattling in the Internet service provider (ISP) market. The future of Matav’smain rival, Euroweb (with a 35% share), was thrown into doubt when KPN, astrategic partner in its 51% owner Euroweb International, announced theabandonment of its central European operations in April 2001. Official figuresshowing 21 people per 100 using the Internet probably overstate the numberswith access to the web—the number of regular Internet users is probably about1m. The main obstacles to the growth of Internet use are the high cost ofaccess and the relatively low numbers of personal computers for home use.
State control of the broadcast media has been slow to relax since the fall ofcommunism, and remains a source of criticism from elements of the publicand the EU. A compromise on the opening of radio and television to privatecompetition was reached only in December 1995, under the government ledby the Hungarian Socialist Party (HSP). The National Radio and TelevisionBoard (ORTT), composed of representatives of both government andopposition parties, was established to supervise public service broadcasting andthe privatisation process, and two national commercial TV stations startingbroadcasting in 1997. However, the regulatory framework established underthe HSP-led government proved inadequate, and when cross-party consensusbroke down, the post-1998 Fidesz-led government appointed only its ownnominees to the state media supervisory committees and managerial boards.The government has also been accused by its rivals of favouring political alliesin the allocation of new broadcasting frequencies, authorising surveillance ofhostile journalists, and discriminating against these when deciding on job cutsat state television. However, the audience share taken by the main statechannel (Channel 1) has dropped below 10%.
The print media market is more competitive. There are a number of nationaldaily newspapers, most with some form of foreign ownership. By far the largestdaily, Nepszabadsag, was formerly the newspaper of the Hungarian SocialistWorkers’ Party (HSWP) and remains close to the HSP. It is part-owned by theBertelsmann group (Germany). Magyar Hirlap is considered to be close to theAlliance of Free Democrats (AFD) and is owned by Ringier (Switzerland), whichalso now holds a stake in Nepszabadsag and several other Hungarian dailies.Postabank, which has majority state ownership, owns both a conservativedaily, Magyar Nemzet, and a tabloid, Kurir.
Energy provision
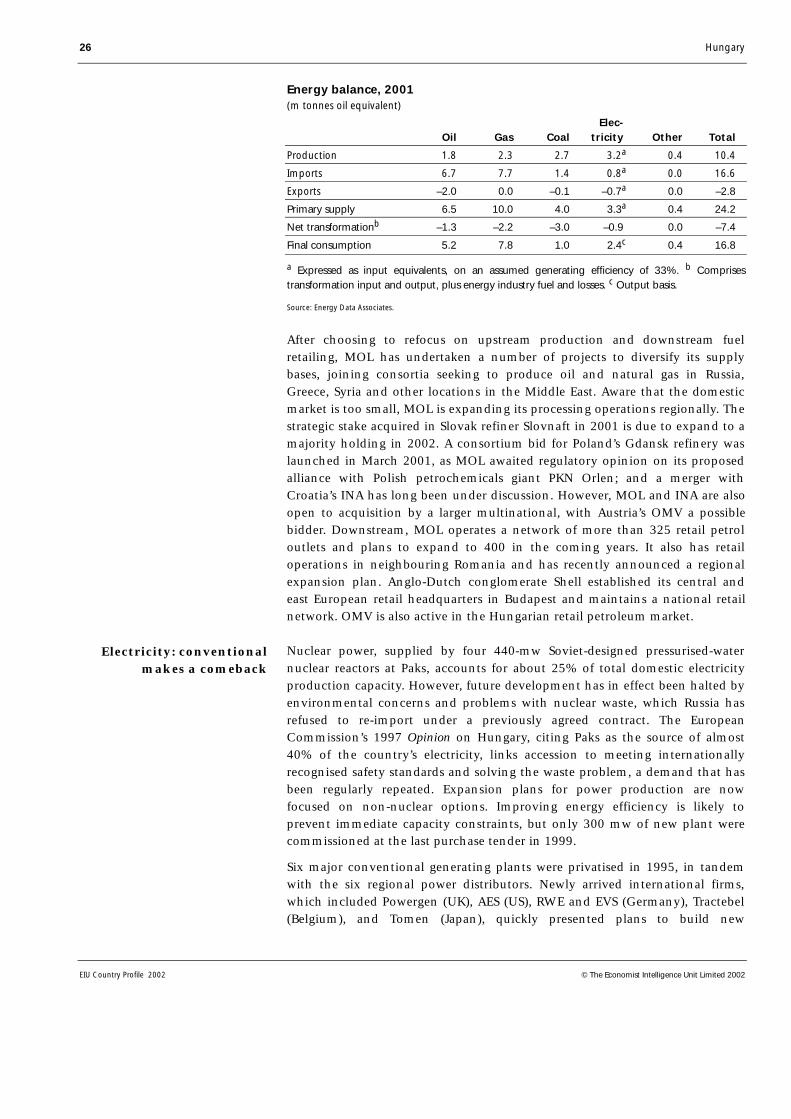
Hungary is poorly endowed with natural resources, and has to import morethan half of its energy needs. Indigenous oil reserves, estimated at 58m tonnes,enabled domestic primary production of 1.8m tonnes in 2001, 22% of refininginput. Oil production declined steadily through the 1990s, after averaging
Expanding media
Domestic resources arelimited
Internet usage hindered bycosts and computer access

Hungary 25
© The Economist Intelligence Unit Limited 2002 EIU Country Profile 2002
around 2m tonnes/year before 1989. No new major oil discoveries areexpected. Estimated gas reserves are around 113bn cu metres, with domesticproduction now meeting around one-fifth of consumption, down from almosttwo-thirds in 1980. This reflects rising domestic consumption, especially as asubstitute for the more pollutive coal, and a steady decline in production fromthe 6.2bn cu metres recorded in 1989. There are natural gas deposits nearSzeged, Miskolc and in eastern Hungary, and smaller crude oil deposits nearSzeged, Zala county (western Hungary) and in other areas. Although there aresmall uranium deposits, the mining company based near Pecs has closed afterunsuccessful attempts to sell it, leaving the Paks nuclear power plant (incentral Hungary) dependent on imports. (See Reference table 4 for abreakdown of energy sources.)
Although energy consumption is forecast to rise as the economy expands, itsgrowth has so far been held down by sharp improvements in industrial energyefficiency. Electricity consumption growth is estimated to have been around2% per annum in 1997-2001, even as overall economic growth was running atabout 4%. Under communism, energy use per unit of GDP was around 2.5times the OECD average. The 1989 level of industrial production was regainedduring 1999 with around 25% less fuel use. Savings were achieved mainlythrough the closure of inefficient enterprises, motivated by a rise in industrialfuel prices as subsidies were withdrawn.
As elsewhere in Europe, oil and natural gas had replaced coal as the primarysource of energy by the end of the 1970s. Gas accounted for more than 45% ofnational energy consumption by 2001. Hungary’s dependence on natural gasfrom the former Soviet Union was broken in 1996, when a pipeline betweenGyor and Baumgarten linked it to Austria’s gas grid for the first time. Oil supplyhas also started to diversify, with the opening of a pipeline to the Adriatic.
The National Oil and Gas Trust (MOL) was privatised in 1994, and the sixregional gas supply companies in 1995. A subsequent share offering in 1997reduced the state stake in MOL from 59% to 25% plus one golden share, withforeign investors holding more than 30%. However, this did not mean an endto political influence on the company’s activities. MOL is the sole domesticproducer, dominates imports (which account for 85% of Hungary’s gas needs),owns a network of high-pressure gas transport and collection pipelines, isHungary’s largest company in terms of sales and is the sole distributor to theregional gas suppliers. The company’s distribution network must be open tocompetition if Hungary is to conform to the EU gas directive (which took effectin 2000), but progress towards this and a liberalised price regime has been slow.Gas liberalisation raises the politically sensitive problem that prices to industryand households will rise, owing to the withdrawal of subsidy, before greatercompetition and efficiency leads to a fall. The date for full market opening hasnow been set at January 1st 2003. Fearing the impact on inflation, and onpoorer households’ welfare, of a sharp rise in residential gas prices, thegovernment restricted these to a below-inflation 6% in 2000 and 2001. Thepersistent losses inflicted by these price controls prompted MOL to put itswholesale gas business up for sale in 2000.
The growth of gas
26 Hungary
EIU Country Profile 2002 © The Economist Intelligence Unit Limited 2002
Energy balance, 2001(m tonnes oil equivalent)
Elec- Oil Gas Coal tricity Other Total
Production 1.8 2.3 2.7 3.2a 0.4 10.4
Imports 6.7 7.7 1.4 0.8a 0.0 16.6
Exports –2.0 0.0 –0.1 –0.7a 0.0 –2.8
Primary supply 6.5 10.0 4.0 3.3a 0.4 24.2
Net transformationb –1.3 –2.2 –3.0 –0.9 0.0 –7.4
Final consumption 5.2 7.8 1.0 2.4c 0.4 16.8
a Expressed as input equivalents, on an assumed generating efficiency of 33%. b Comprisestransformation input and output, plus energy industry fuel and losses. c Output basis.
Source: Energy Data Associates.
After choosing to refocus on upstream production and downstream fuelretailing, MOL has undertaken a number of projects to diversify its supplybases, joining consortia seeking to produce oil and natural gas in Russia,Greece, Syria and other locations in the Middle East. Aware that the domesticmarket is too small, MOL is expanding its processing operations regionally. Thestrategic stake acquired in Slovak refiner Slovnaft in 2001 is due to expand to amajority holding in 2002. A consortium bid for Poland’s Gdansk refinery waslaunched in March 2001, as MOL awaited regulatory opinion on its proposedalliance with Polish petrochemicals giant PKN Orlen; and a merger withCroatia’s INA has long been under discussion. However, MOL and INA are alsoopen to acquisition by a larger multinational, with Austria’s OMV a possiblebidder. Downstream, MOL operates a network of more than 325 retail petroloutlets and plans to expand to 400 in the coming years. It also has retailoperations in neighbouring Romania and has recently announced a regionalexpansion plan. Anglo-Dutch conglomerate Shell established its central andeast European retail headquarters in Budapest and maintains a national retailnetwork. OMV is also active in the Hungarian retail petroleum market.
Nuclear power, supplied by four 440-mw Soviet-designed pressurised-waternuclear reactors at Paks, accounts for about 25% of total domestic electricityproduction capacity. However, future development has in effect been halted byenvironmental concerns and problems with nuclear waste, which Russia hasrefused to re-import under a previously agreed contract. The EuropeanCommission’s 1997 Opinion on Hungary, citing Paks as the source of almost40% of the country’s electricity, links accession to meeting internationallyrecognised safety standards and solving the waste problem, a demand that hasbeen regularly repeated. Expansion plans for power production are nowfocused on non-nuclear options. Improving energy efficiency is likely toprevent immediate capacity constraints, but only 300 mw of new plant werecommissioned at the last purchase tender in 1999.
Six major conventional generating plants were privatised in 1995, in tandemwith the six regional power distributors. Newly arrived international firms,which included Powergen (UK), AES (US), RWE and EVS (Germany), Tractebel(Belgium), and Tomen (Japan), quickly presented plans to build new
Electricity: conventionalmakes a comeback

Hungary 27
© The Economist Intelligence Unit Limited 2002 EIU Country Profile 2002
generation capacity, which is needed to replace older fossil-fuel plants that willnot meet future EU emissions standards, as well as to cater for rising demand.However, implementation has been slowed by arguments with thegovernment, which has tried to promote gas as an alternative to coal. Tractebeland AES have suspended coal-fired investment plans after failing to win long-term contracts. Supply companies also warned of risks to investment after retailprice rises were capped at 6% in 2001, compared with a wholesale rise of 13%;an 8% minimum return on capital was promised at the time of privatisation.
The Hungarian Electricity Works (MVM) operates the electricity grid and is thedominant exporter, importer and wholesaler of electricity. Vertical separationbetween these functions must be achieved to satisfy EU directives. MVM’sprivatisation has also been promised, but is unlikely to take place quickly.Deregulation, to allow regional distributors to buy from (and generators to sellto) companies other than MVM, and users to choose their distributor, is still inits early stages. In view of the right of large (100-gwh) commercial consumersfrom 2001 to shop around for supply, around 15% of the market is currentlyopen. This figure is set to rise to around 30% by 2003, as the number of firmsallowed to choose their supplier rises to around 200. These large consumerswill only be allowed to buy 50% of their power from foreign suppliers untilHungary joins the EU, when imports must be fully liberalised.
MVM, like MOL, will need to have its network opened to upstream anddownstream competition before EU energy directives are satisfied. In principle,deregulation could reduce power prices, because of the surplus capacity thatwould be forced into greater competition. However, the government fears thatthis could render MVM’s present purchase agreements with domesticgenerators uneconomic (especially the Paks plant). The risk of new electricitymarket arrangements making peak-time supplies unavailable, or prohibitivelyexpensive, has also induced some heavy users to install their own reservegenerating plant.
The economy
Economic structure
Main economic indicators, 2001
Real GDP growth (%) 3.8a
Unemployment rate (year-end; %) 5.6
Consumer price inflation (av; %) 9.2
Central government balance (% of GDP) –2.8a
Current-account balance (% of GDP) –2.2a
Exchange rate (av; Ft:US$) 286.5
a Preliminary data.
Source: National statistics.

28 Hungary
EIU Country Profile 2002 © The Economist Intelligence Unit Limited 2002
Hungary’s domestic market is relatively small, although the economy is stillthe third-largest in east-central Europe in US dollar terms (after Poland and theCzech Republic). Hungary is also one of the region’s most open economies,with significant sectors now tied closely to western Europe via trade andforeign investment. Exports of goods reached the equivalent of about 60% ofGDP in 2001, up from 30.6% in 1991. The EU now accounts for around 75%of exports, up from about 30% in 1990. Although the strength of EU demandhas a clear impact, exports have grown strongly even during phases of slowgrowth in the EU and real appreciation of the exchange rate. Imports haverisen equally rapidly, reflecting Hungary’s emerging role as an industrialprocessing economy. Imports were equivalent to 66% of GDP in 2001, up from34.2% in 1991.
An aggressive privatisation policy has been pursued since 1995. Major stakes inthe telecommunications, banking, utilities and television sectors are now inprivate hands, and the private sector accounts for about 80% of GDP, one ofthe highest shares in the region. Foreign direct investment (FDI) has played asignificant role in modernising production and redirecting trade from east towest. The stock of inward FDI reached just under US$23.5bn by end-2001,equivalent to about 46% of GDP.
Comparative economic indicators, 2000
CzechHungary Slovenia Slovakia Republic Poland
GDP (US$ bn) 45.6 18.1 19.2 50.7 157.7
GDP per head (US$) 4,554 9,105 3,557 4,942 4,082
GDP per head (US$ at PPP) 9,035 14,250 8,718 11,444 7,720
Consumer price inflation (av; %) 9.8 8.9 12.0 3.9 10.1
Current-account balance (US$ bn) –1.5 –0.6 –0.7 –2.2 –10.0 % of GDP –3.3 –3.4 –3.5 –4.4 –6.3
Exports of goods fob (US$ bn) 25.4 8.8 11.9 29.0 28.3
Imports of goods fob (US$ bn) 27.5 9.9 12.7 32.1 41.4
External debt (US$ bn) 29.0 6.2 8.1 22.6 58.8
Source: EIU, CountryData.
The contribution of industry to GDP declined sharply in the first eight yearsafter the end of communist rule, from 42% in 1988 to just under 32% in 1996.However, economic growth from the mid-1990s has been fuelled mainly by arevival in manufacturing industry, as Hungary established itself as acomponent production base and low-cost assembly area for EU-based supplychains. Annual industrial production rose at double-digit rates in 1997-2000,taking the share of industry in GDP back to around 34%. Industry was hit bythe slowdown in international demand in 2001, however, with output growthgrinding to a halt by the end of the year. Owing to rapid productivity growth,industry’s share of employment (excluding construction) declined to around27% in 2000 from 31% in 1985.
Services were neglected under communism, but since 1990 Hungary hasrapidly become a service-based economy, like the EU states it is working to
Manufacturing powers therecovery

Hungary 29
© The Economist Intelligence Unit Limited 2002 EIU Country Profile 2002
join. Expansion in services on the back of domestic personal consumptioncompensated for the slowdown in industry in 2001, helping to sustaineconomic growth. In 2000 total services already accounted for around 62% ofGDP (up from about 40% in the late 1980s) and 60% of employment.
Agriculture’s share in the economy has shrunk significantly since the fall ofcommunism. The sector now accounts for less than 5% of GDP, and employed6.2% of the workforce in 2000, down from 20% in 1985. However, preliminary2001 census figures showed 36% of the population still living in villages. Thishas given disproportionate influence to rural and agricultural interests,although their political management is likely to become somewhat easier withthe de facto demise of the rurally oriented Smallholders’ Party (SP).
Economic policy
The introduction of quasi-market elements into the economy in the late 1960sgave Hungarians greater familiarity with commercial practices and contactwith the West than were available to the populations of most othercommunist states. Small private co-operative ventures were legalised in 1982,and a two-tier banking system and the beginnings of a Western-style taxsystem were also in place by the late 1980s. In 1988-89 the government led bythe Hungarian Socialist Workers’ Party (HSWP) created an opening forprivatisation and foreign investment by passing new legislation on jointventures, foreign investment and the transformation of state enterprises intoshareholding companies.
This early reform experience gave Hungary an institutional and cultural headstart as the east-central European countries pursued marketisation and Westernintegration after 1990. Hungary’s post-communist economic policy has beenaided by political stability. Hungary has consistently been ranked among theleading “transition” economies in EU, OECD and other multilateral progressreports. High foreign debt, limited public finances, the openness of theeconomy and the comparatively large private (especially foreign) stake in theeconomy have left Hungary’s post-communist governments relatively littleroom to deviate from a reformist, liberalising path. The external paymentsdifficulties of the mid-1990s ultimately accelerated the pace of privatisation,and the 1998-99 Russian recession spurred exporters’ efforts to diversify intohigher-income EU and North American markets.
Hungary’s drive to join the EU, on which there is a strong cross-partyconsensus, has also increasingly become a pressure for medium-term fiscaldiscipline and institutional reform. Like other current candidates, Hungarymust eventually meet the Maastricht fiscal and other criteria for adopting theeuro. Hungary hopes to join the EU in 2004 and adopt the euro in 2006,although the Economist Intelligence Unit regards these targets asoverambitious. The key macroeconomic policy challenge facing all Hungary’spost-communist governments has been balancing the need to curb inflationand public deficits against the desire for growth, aimed at raising livingstandards to Western levels. Each government has loosened fiscal policy in therun-up to elections.
Reform has a head start,helped by political stability

30 Hungary
EIU Country Profile 2002 © The Economist Intelligence Unit Limited 2002
In several spheres there was reform continuity from the late communist periodinto the tenure of the first post-communist government, elected in 1990 andled by the Hungarian Democratic Forum (HDF). The HDF administration setout an economic programme in March 1991 that included liberalising foreigntrade, freeing prices, reducing subsidies and improving the position of theprivate sector. Important steps in the privatisation process were taken, with thegoal of reducing state ownership to below 50% by 1994.
In the wake of the reforms and the collapse of the Council for MutualEconomic Assistance (CMEA, or Comecon) trade system, however, real GDPand industrial output contracted and unemployment increased. Fixedinvestment also declined, despite large inflows of foreign investment. Thecountry soon faced structural problems resulting from the government’s failureto reduce its expenditure. Central government deficits between 1991 and 1995were 5.5-6.5% of GDP. There was a dramatic increase in the trade deficit. Evenwhen the current account went into a large deficit in 1993, the HDF-ledgovernment failed to adjust its policies in the run-up to the 1994parliamentary election.
Intra-coalition conflict initially delayed action to tackle the economic situationby the Hungarian Socialist Party-Alliance of Free Democrats (HSP-AFD)government elected in 1994. The administration eventually implemented atough stabilisation programme in 1995-97. The “Bokros Package”, named afterthe finance minister who devised it, included social spending cuts to reducethe fiscal deficit, a 9% devaluation, an 8% import surcharge and a strictincomes policy. The macroeconomic aspects of the package were closely linkedto structural changes, including a medium-term reduction in the size of thepublic sector and an ambitious programme of privatisation of state enterprisesand state-owned commercial banks. The programme also introduced theexchange-rate system used until 2001, involving a pre-announced monthlycrawling-peg devaluation rate.
Announced in March 1995, the Bokros Package led to major improvementsin internal and external balances, although it also fuelled inflation in theshort term. In March 1996 Hungary reinforced its stabilisation programme bysigning an agreement with the IMF. Hungary did not call on the SDR264m(approximately US$400m) loan before it expired in 1998, but emphasised itsimportance in shoring up confidence in the economy on the foreignmoney markets.
As a result of the 1995 measures, the consolidated state budget deficit for 1995declined to 6.3% of GDP, from 7.1% in 1994, and the current-account deficitwas reduced from just over US$4bn to US$2.5bn over the same period. The fiscalsuccess continued in 1996, as the consolidated budget deficit fell to 3.1% ofGDP, and it was still within reasonable limits at 4.5% of GDP in 1997, despitethe government’s softening of policy in the run-up to the May 1998parliamentary election. In 1997 the current-account deficit was cut to just underUS$1bn or 2.2% of GDP. Inflows from a sustained privatisation programme wereused for substantial reduction of the burden of public debt. However, the socialhardships imposed by the Bokros Package contributed to the HSP’s election
Early liberalisation
The austerity programme

Hungary 31
© The Economist Intelligence Unit Limited 2002 EIU Country Profile 2002
defeat in 1998. Subsequent finance ministers have been reluctant to respond tobudget or external deficit overruns with fiscal tightening, even when adversedomestic or external events could justify such action.
The Federation of Young Democrats-Hungarian Civic Party (Fidesz) won theMay 1998 election partly on an “anti-Bokros” ticket, with promises of restoredand increased family and welfare benefits, faster growth, lower taxes and morehealth and higher education spending. The overall aim was to promoteHungary’s convergence with west European wealth levels as fast as possible, byaccelerating economic growth. Fidesz also sought to make a strong contrastwith its predecessor’s policies, while pursuing specific social and economicgoals—principally creating jobs, encouraging more child-bearing andsupporting a new middle class.
Despite its expansionist rhetoric, Fidesz has stepped back from jeopardisingfiscal or monetary stability in office. For example, the government held backfrom some spending in 1999 when the economic balances worsened, and the7% growth rate promised before the election was in effect abandoned. Thegovernment’s first finance minister, Zsigmond Jarai, based his budgets on moremodest forecasts. However, deficit reduction targets have also been modestgiven the strength of the economy. The 2000 budget targeted a reduction to3.5% of GDP for the public-sector deficit, from 3.8% in 1999, while the two-year consolidated budget for 2001 and 2002 aimed for deficits of 3.4% and3.2%, respectively. Both the 2000 and 2001 targets were met.
The Fidesz-led government has been content to achieve continued fiscal deficitreductions by taking advantage of buoyant growth and higher than plannedinflation, rather than by implementing further structural reforms to statespending. The 2001 public-sector deficit came in slightly below target, at 3.3%of GDP, owing mainly to these factors. In both 2000 and 2001 revenue washigher than forecast, but was channelled into increased spending as the 2002parliamentary election approached. For example, pensioners and public-sectorworkers received major increases in payments.
The radical overhaul of public spending and the tax system promised by Fideszduring the 1998 election campaign was not realised. A review discovered that30% of the 1,000 state institutions have no precisely stated function, but littlerationalisation has been implemented. The number of personal income taxbrackets was reduced to three in 1999, but large cuts in personal tax ratesbecame stalled. Employers’ social security contributions were similarly reduced,but only modestly, to 29% by the start of 2002. Overall, personal andemployers’ taxes remain high. Value-added tax (VAT), at 25% for mostproducts, is among the highest in the OECD (although some products currentlyenjoying lower rates will have to move into the higher bracket to meet EUconditions). The Fidesz government has preferred to use tax concessions forparticular social groups rather than across-the-board reductions.
As a result of these trends, Hungary’s underlying fiscal position is improving,but remains weak. Key reform tasks still await the next government, althoughthe rash of pre-election spending promises made by both major parties will
Fidesz goes for growth
Public sector awaitsfurther reform
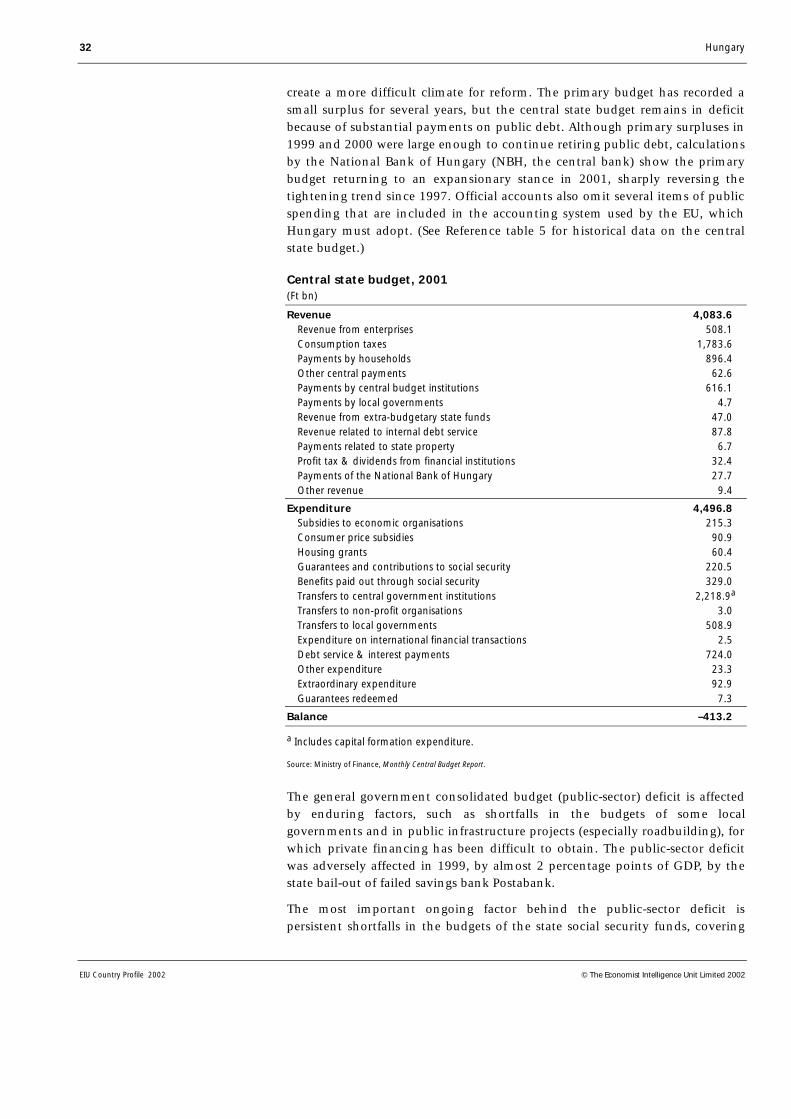
32 Hungary
EIU Country Profile 2002 © The Economist Intelligence Unit Limited 2002
create a more difficult climate for reform. The primary budget has recorded asmall surplus for several years, but the central state budget remains in deficitbecause of substantial payments on public debt. Although primary surpluses in1999 and 2000 were large enough to continue retiring public debt, calculationsby the National Bank of Hungary (NBH, the central bank) show the primarybudget returning to an expansionary stance in 2001, sharply reversing thetightening trend since 1997. Official accounts also omit several items of publicspending that are included in the accounting system used by the EU, whichHungary must adopt. (See Reference table 5 for historical data on the centralstate budget.)
Central state budget, 2001(Ft bn)
Revenue 4,083.6 Revenue from enterprises 508.1 Consumption taxes 1,783.6 Payments by households 896.4 Other central payments 62.6 Payments by central budget institutions 616.1 Payments by local governments 4.7 Revenue from extra-budgetary state funds 47.0 Revenue related to internal debt service 87.8 Payments related to state property 6.7 Profit tax & dividends from financial institutions 32.4 Payments of the National Bank of Hungary 27.7 Other revenue 9.4
Expenditure 4,496.8 Subsidies to economic organisations 215.3 Consumer price subsidies 90.9 Housing grants 60.4 Guarantees and contributions to social security 220.5 Benefits paid out through social security 329.0
Transfers to central government institutions 2,218.9a
Transfers to non-profit organisations 3.0 Transfers to local governments 508.9 Expenditure on international financial transactions 2.5 Debt service & interest payments 724.0 Other expenditure 23.3 Extraordinary expenditure 92.9 Guarantees redeemed 7.3
Balance –413.2
a Includes capital formation expenditure.
Source: Ministry of Finance, Monthly Central Budget Report.
The general government consolidated budget (public-sector) deficit is affectedby enduring factors, such as shortfalls in the budgets of some localgovernments and in public infrastructure projects (especially roadbuilding), forwhich private financing has been difficult to obtain. The public-sector deficitwas adversely affected in 1999, by almost 2 percentage points of GDP, by thestate bail-out of failed savings bank Postabank.
The most important ongoing factor behind the public-sector deficit ispersistent shortfalls in the budgets of the state social security funds, covering

Hungary 33
© The Economist Intelligence Unit Limited 2002 EIU Country Profile 2002
healthcare and pensions. The two funds moved into deficit in the 1990s, andannual top-ups from general taxation became a major cause of the gapbetween the central budget deficit and the wider public-sector deficit. The HSP-led government implemented a pension reform in January 1998 that made aprivate second pension compulsory for those entering the workforce andoptional for others. The scheme was cited internationally as a model whichshould allow the long-term reduction of pension obligations falling on thebudget—particularly important as the population ages. However, by attractingtwice the expected number of subscribers (1.35m by the end of 1998), andallowing opted-out workers to divert some of their national insurancecontributions into private funds, the reform initially widened the state pensionfund deficit, although it has more recently begun to help rein it in. The Fideszgovernment first reduced the agreed salary share that could be paid into theprivate funds, and towards the end of its term eliminated the compulsion tojoin the scheme for new workers. For a second term, Fidesz plans theintroduction of a new, centrally managed state pension scheme.
Plans for a major reform of healthcare financing also foundered, partly owingto intra-governmental differences. The Fidesz government concentrated onsmaller cost-saving schemes, such as control of drugs costs, and changes to thedelivery of healthcare. The administration showed signs of moving towards thekinds of reforms needed to achieve a less costly and more efficient deliverysystem, but major change was again not achieved before the end of theparliament (see Resources and infrastructure). Costs in the healthcare sectorrose by 16.3% in 2001.
Fidesz sees a greater role for the state in promoting economic growth anddevelopment than did the HSP-led government of 1994-98. It has been keen totake some assets under state control and to use state regulatory powers to capprices in the energy and pharmaceutical sectors.
Early in 2000 the government unveiled a long-term National DevelopmentPlan, called the Szechenyi Plan after an entrepreneurial nineteenth-centuryaristocrat. In principle, the plan sees state help, in the form mostly of softloans, helping to stimulate private investment and structural change in areasseen to have been left behind by wholly privately driven economicdevelopment since the mid-1990s. Although not hostile to foreign investors,Fidesz hopes that the plan will aid primarily domestic players.
The Szechenyi Plan in part represents a rationalisation of existing, disparateinitiatives, and provides only Ft50bn-60bn (US$179m-215m) in newgovernment funds. Much of the anticipated value of the plan is intended tocome from private sources, with the government providing only seed capital ornon financial incentives. Most of the public money will come from EU (Phare,Ispa and Sapard) programmes. Although official projections of how muchprivate investment these funds can attract are ambitious, Hungary’s businessenvironment—particularly its small and medium-sized enterprises (SMEs)—isespecially favourable for the attraction of finance. The country captured almostone-quarter of venture capital inflows to the main 12 east European economiesin 2000, according to data from Venture Economics.
A role for the state: theSzechenyi Plan

34 Hungary
EIU Country Profile 2002 © The Economist Intelligence Unit Limited 2002
The Szechenyi Plan prioritises six areas:
Small business support: Reduced regulation, tax concessions, subsidisedloans and technical assistance are among the measures promised to help thecountry’s estimated 700,000 SMEs to expand their economic contribution.Endorsing an EU recommendation, the government wants domestically ownedSMEs to expand, to at least 50%, their share of inputs purchased bymultinationally owned companies. Special help is on offer to SMEs upgradinginformation technology. SMEs employing fewer than 50 people have alsoreceived tax exemption on the first Ft10m (US$35,727) of reinvested profit, tooffset the impact of the 57% minimum wage rise in 2001.
Roadbuilding: Public input, mostly via EU funding and compulsory landpurchase, to private-sector-led roadbuilding plans is aimed at completing700km of new motorway by 2007 (see Resources and infrastructure).
Housebuilding: Annual house completions are planned to rise by at least5,000, from the 19,300 posted in 1999. Mortgage subsidies and more flexibleplanning rules are at the centre of the scheme, which aims both to address theacute social need for new houses (officially assessed at 40,000 per year) and tocreate more jobs.
Research and development (R&D): Special encouragement is to be givento initiatives in information technology, biotechnology, life sciences,environmental improvement and national heritage preservation.
Regional development: Traditional efforts to spread employment andinvestment to less advantaged areas will be redirected towards the seeding ofnew-technology “clusters”, especially through infrastructure clusters and thecreation of industrial parks to house SMEs.
Tourism: Assistance is to be offered to private-sector initiatives, especially forconference centres, theme parks and health tourism.
Szechenyi Plan: government co-financing
2001 2002Ft bn % of total Ft bn % of total
Small business promotion 31.4 10.6 37.3 11.3
R&D 17.5 5.9 37.0 11.2
Information technology 15.0 5.1 28.9 8.7
Tourism 25.0 8.4 28.1 8.5
Regional development 5.0 1.7 6.0 1.8
Motorways 132.1 44.6 120.9 36.5
Housing 69.9 23.6 72.6 21.9
Total 295.9 100.0 330.8 100.0
Source: Ministry of Economic Affairs.
In September 2001, the government announced a “Szechenyi Plus” programmeas a counter-cyclical stimulus programme to counteract the effects of the globaleconomic slowdown. The programme involves the expansion of existingSzechenyi Plan programmes, the bringing forward of some plannedinvestments, such as in roadbuilding, and the incorporation of state cultural
Hungary 35
© The Economist Intelligence Unit Limited 2002 EIU Country Profile 2002
investment projects. According to the Ministry of Economic Affairs, theSzechenyi Plus programme will be worth an additional Ft200bn in 2002, withits beneficial effects being felt into 2004.
Fiscal policy after the 2002 election
The main parties’ economic platforms for the April 2002 general election arethe opposite of what recent history would suggest. The Federation of YoungDemocrats-Hungarian Civic Party (Fidesz), has emerged as the party that prefersto use any spare state revenue to rebuild public infrastructure and services, andto shy away from the full-scale privatisation previously promoted by some ofits members. The main opposition Hungarian Socialist Party (HSP) has seizedon this stance to present itself as the party that would cut taxes, not just to“give back” the extra revenue caused by “bracket creep”, but also to help theprivate sector to play a greater role in the transformation of public services. TheHSP’s “move to the right” is astute because, on the admission of the Ministry ofFinance, the rise in real incomes has given Hungary an acute case of “fiscaldrag”: from 2002 the basic 20% tax rate will only apply to the minimum wage,whereas the average monthly wage of around Ft100,000 (about US$350) putsmost childless or one-child households (a rising proportion of the total) intothe highest, 40% tax bracket. The HSP’s promise to reduce the tax burden isthus especially attractive to the emerging middle class.
The HSP’s liberalising credentials are based on its past experience in power(1994-98), when it prepared Hungary’s major privatisations. It also launchedinnovative pension reform—a partial privatisation—that has served as a modelfor the region, and restructured the coal and steel industries, resulting in asubstantial cut in subsidies. The HSP also pushed for low corporate taxes andlaunched the drive to lower employers’ social security contributions in order tobring them more closely in line with the EU average.
The likelihood that an HSP-led coalition would pursue a similar agenda isstrengthened by the HSP’s nomination of Peter Medgyessy as its candidate forprime minister. Mr Medgyessy returned to the private financial sector followinghis tenure as finance minister in the previous government, and is sympatheticto commercial lobbies, which regard reductions in taxation and red tape asmore of a priority than extra infrastructure investment. He is also sensitive tothe images of corruption that played a large part in bringing down the lastHSP-led government, and which strengthen the argument for allowing spareresources to be spent privately rather than publicly. A government led byMr Medgyessy is likely to include the Alliance of Free Democrats (AFD), and itsneo-liberal leanings would further dispose the coalition towards reducing thesize of government. EU restrictions on state aid, as well as pressures toharmonise taxes, would further push any HSP-led government in the directionof economic regulation rather than greater direct public intervention.
Fidesz has been increasingly explicit in urging a greater role for the state inpromoting economic growth and development. Fidesz took office in 1998committed to implementing the previous government’s pension reform andlaunching a restructuring of healthcare, which, had they happened, wouldhave given private insurance a leading role in paying for healthcare, at the same

36 Hungary
EIU Country Profile 2002 © The Economist Intelligence Unit Limited 2002
time allowing private management to take over more of its provision. However,the party is also committed to rapid growth, job creation, the promotion ofnew industries and the protection of certain national assets—notably ruralland—from what it sees as excessive foreign ownership and control.
The latter goals have prevailed during Fidesz’s first term in office. A preferencefor additional spending over tax cuts has led to an expansionist fiscal policyduring the past two years. The government has also shown no aversion toregulation, as seen by its imposition of caps on retail energy prices to protectlow-income households. A commitment to maintain public services has alsodelayed restructuring. The party’s reliance on a junior coalition partner, theSmallholders’ Party (SP), has also prevented it from making any serious effortto raise efficiency and reduce subsidies in agriculture.
Recognising the popular appeal of tax cuts, Fidesz quickly responded in kindwhen the HSP began its election campaign by promising to reduce incometaxes rather than spend more on transport and housing projects. Both mainparties are now committed to tax reductions after 2002, when the current two-year budget comes to an end. Neither party will find these easy to deliver, sincethey will be constrained by their stated commitment to bring the fiscal deficitwithin Maastricht limits (3% of GDP) by at least 2006 as part of Hungary’s driveto join the euro zone two years after the country’s planned accession to the EU.The official public-sector deficit approached this target last year, but slowergrowth could stall further improvement this year, and the true deficit is at leasta percentage point higher when measured using EU accounting standards.
The next government will also come under strong pressure to cut employers’social security contributions before agreeing to reduce the rates for personalincome tax. Any significant tax reductions must be compensated for, eitherthrough savings or de facto tax increases in other areas. Savings will require amuch more extensive reform of the health service (involving additional privatepurchasing and provision), cost-cutting adjustments to the new pensionsystem, and a return to a faster economic growth (which was the main cause ofimproved fiscal balances in the early days of the present government). Sincethese structural changes take time, any reductions in direct tax will have to becompensated for in other areas, notably by bringing more items into higherbrackets of value-added tax (VAT) and restricting tax concessions—bothmeasures that are in line with EU demands.
Mr Jarai’s move to head the NBH from March 2001 eased potential tensionsbetween the government and the central bank over policy, and probablyallowed the administration greater fiscal latitude in the run-up to the election.Seven base-rate cuts between September 2001 and March 2002, taking the ratedown by 275 basis points (bp), to 8.5%, were supportive of the government’sgrowth aims. Monetary loosening was encouraged by slowing growth andinflation, and by the currency strengthening that followed the widening of theforint’s exchange-rate band, to ±15%, in May 2001.
The NBH appeared increasingly to downplay linkages between the exchangerate, the money supply and domestic prices, pointing to ongoing structuralchanges that mitigate the normally expected dangers of lower interest rates.
Exchange-rate regimechanges

Hungary 37
© The Economist Intelligence Unit Limited 2002 EIU Country Profile 2002
This allowed the NBH’s interest-rate policy simply to track falls in inflation.However, there were concerns that monetary loosening might have gone toofar, especially if fiscal policy is not tightened after the April 2002 election.
Meanwhile, foreign trade performance appeared increasingly impervious toexchange-rate trends, a factor encouraging the widening of the forint’s band.Although the NBH has since been keen not to allow the forint to become tooovervalued, it has been relatively unconcerned about the currency’sappreciation since the widening of the band. Forint appreciation helped tobear down on inflation in the second half of 2002.
The widening of the forint’s band was followed in October 2001 by the aban-donment of the “crawling peg” exchange-rate system. The NBH no longerformally targets the exchange rate, following a shift to direct inflation targeting.The NBH now periodically indicates an informal exchange-rate target that itcalculates to be compatible with the inflation target for the year (4.5% for 2002).
A privatisation law was approved by parliament in May 1995, consolidatingthe existing state asset and management companies into the Privatisation andState Asset Company (APV). Under pressure to reduce public debt, the HSP-ledadministration speeded up privatisation: the forint value of privatised stateassets tripled from Ft156.7bn in 1994 to more than Ft480bn in 1995. Receiptsremained strong over the next three years as the focus shifted to largercompanies, including MOL (gas), electricity generators and distributors,commercial banks, and remaining shares in Matav (telecommunications).
With the budget deficit narrowing, the government led by Fidesz has been underless pressure to privatise. The national electricity grid operator MVM remainsstate-run; the sale of broadcaster Antenna Hungaria (which has long-term plansto derive half of its turnover from telecoms) has been postponed until investorinterest in telecoms revives; and national airline Malev failed to attract anybuyers when offered in 2000, and continues to receive state bail-outs. At the endof 2000 the state privatisation agency (APV) still had 175 companies under itssupervision; some sales took place in 2001, but the value of companies under theAPV still stood at around Ft700bn at the end of 2001. The 1995 privatisation lawdesignated 93 companies to stay in long-term minority, majority or total stateownership. Parliament has also passed “golden share” legislation aimed atmaintaining special veto rights for the state in another 50 companies.
Economic performance
In the 1970s Hungary’s economy experienced relatively high annual growthrates (averaging about 4%) as the government borrowed internationally tofinance investment, hoping to generate sufficient exports to pay back the debt.Misallocation of funds and a hostile international climate prevented this, andexternal hard-currency debt had grown to more than 50% of GDP by the endof the 1980s, when real GDP growth declined significantly (to 1-2% per year)as access to foreign financing slowly closed.
Privatisation
Unfavourable legacies

38 Hungary
EIU Country Profile 2002 © The Economist Intelligence Unit Limited 2002
The economic transition was accompanied by sharp contractions in real GDPand industrial output (of 18% and 25%, respectively) between 1989 and 1993.The economy began to grow again in 1994, when it expanded by 2.9%. Thereturn to growth was accompanied by a fiscal imbalance and a large current-account deficit. The stabilisation measures introduced in 1995 succeeded inreducing these deficits, but they also had the effect of slowing growth. In 1995and 1996 GDP growth was a more modest 1.5% and 1.3%, respectively.However, the economy recovered strongly in 1997-2000 on the back of rapidgrowth in manufactured exports, with growth averaging 4.7% per year. A peakin year-on-year growth rates was reached in the first quarter of 2000, at 6.5%,with a subsequent slowdown restricting growth to 5.2% for the year as awhole. Growth slowed continuously through 2001, taking full-year growth to apreliminary 3.8% (See Reference tables 7-9 for historical data on GDP.).
Gross domestic product(% change; constant prices)
Annual average2001a 1997-2001
Private consumption 4.4 3.8
Government consumption 2.2 2.2
Gross fixed investment 3.5 7.7
Exports of goods & services 8.1 17.2
Imports of goods & services 5.0 17.2
GDP 3.8b 4.0
a EIU estimates. b Preliminary official figure from the Central Statistical Office (CSO).
Source: EIU.
Gross investment fell sharply during the 1990-91 recession and again underthe austerity programme of 1995-96. Investment growth picked up stronglyduring 1997-98 as the privatisation programme picked up speed, but fell backin 1999-2001. The slowdown in year-on-year investment growth to 2.9% inJuly-September 2001 was primarily a response to cautious demand expectationsand highlighted the continued constraints on firms’ capital budgets, as importcompetition and regulation squeezed profit margins, and banks remainedcautious in their commercial lending activity. As in the early 1990s, the slow-down in investment pointed to an ongoing slowdown in production growth,and a danger of domestic demand shifting too far towards consumption.
The stabilisation measures of 1995 had a negative impact on privateconsumption, which fell by 7.1% and 3.4% in 1995 and 1996, respectively.Private consumption gradually pulled out of recession in 1997, growing by1.7%. Strong growth of 4.9% in 1998 and 4.6% in 1999 was followed by aslowdown to 3.3% in 2000, as higher than expected inflation eroded wagegrowth, but a recovery in 2001 as the government’s large rises in the minimumwage and the fall in inflation took effect. Real wages fell sharply as a result ofthe austere Bokros Package, but recorded average growth of around 3.5% in1997-2000, before recording strong growth of 8.4% growth in 2001. (SeeReference table 17 for data on retail sales.)
Investment
Private consumption

Hungary 39
© The Economist Intelligence Unit Limited 2002 EIU Country Profile 2002
Extensive industrial modernisation, financed mainly by inward investment, hassubstantially improved the quantity and quality of goods sold abroad. Exportgrowth has been positive in real terms since 1992 and (except for 1996 and2001) in double digits since 1994. The slowdown in global demand hit exportsin 2001, reducing the sector’s share in driving growth. However, exports stillrose by 11.3% in euro terms, exceeding import growth of 7.8%. Although lowerenergy import prices also helped, this result testified to the ability of Hungary’sindustry to remain competitive despite the strengthening forint.
In common with other transition economies, unemployment in Hungary rosesteeply in 1991-92. However, it has since fallen steadily, from 12.7% in 1992 to5.6% at the end of 2001. This is substantially lower than other central Europeancountries, or the EU average. The official rate is now based on labour forcesurveys by the Central Statistical Office (CSO), in line with International LabourOrganisation (ILO) standards. These surveys show that unemployment hasresulted largely from lay-offs, which have especially affected older workers andresulted in high levels of early retirement (creating a strain on the state pensionsystem). Youth unemployment has also become a serious problem, with aroundone-quarter of the unemployed in 2000 being under 25. Although skill shortagesare part of the problem, demographic factors will help, and the problem couldbecome one of youth labour shortages in the medium term. In 2001 the primeminister, Viktor Orban, several times suggested that employment of ethnicHungarians from Hungary’s neighbouring states might represent a new resourceto help sustain economic growth. Although the government does not wantthese Hungarians to move permanently to Hungary, a concern to facilitate theirshort-term employment in the country was one factor behind the government’spreparation of the “Status Law” (see Political background).
Long-term unemployment (affecting those looking for work for more than oneyear) has increased as a percentage of the total unemployed since the start of thetransition, to over 40%, but there has been some success in reducing the rate inrecent years. Regional variations in unemployment are significant, with unemp-loyment at its lowest in central Hungary, including Budapest (5.2%), and centraland north-western Transdanubia (4.8% and 4.2%, respectively), and highest innorthern Hungary (10.1%) and the northern regions of the Great Plain (9.2%).
Combating inflation has been a priority throughout the transition andespecially since 1995, when consumer subsidy cuts and forint devaluationlifted annual average consumer price inflation to 28.2%. The benefits of theBokros Package began to appear in 1996, when annual average inflation slowedto 23.6%. Although inflation continued to trend downwards in 1997-99, to10% in 1999, successive governments missed their inflation targets. Moreover,progress in 2000 and early 2001 was limited, with 2000 inflation averaging9.8%. This was largely the result of supply-side shocks from higher energycosts, owing to the jump in world oil prices, and higher food costs after anotherpoor regional harvest. Combined with state-administered price supports, thissent farm price inflation to year-end rates of more than 25% in 2002.
From mid-2001 lower agricultural prices reflecting a better growing season,lower imported fuel prices and an appreciating forint produced sharply falling
Exports
Unemployment stays low
Inflation reduction provesdifficult

40 Hungary
EIU Country Profile 2002 © The Economist Intelligence Unit Limited 2002
inflation. Although average inflation was still 9.2% in 2001, the January 2002rate was 6.6% year on year. Inflation would be substantially higher withoutcontinued below-inflation increases in household energy and pharmaceuticalprices, owing to government controls. (See Reference table 10 for data on prices.)
Wages and prices(% change)
Annual average2001 1996-2000
Consumer prices (av) 9.2 12.3
Industrial producer prices (av) 5.2 10.7
Gross nominal wages (av) 18.4 17.4
Sources: CSO, Statistical Yearbook; Monthly Bulletin of Statistics.
Regional trends
Hungary is a small country with a highly centralised government. However,there are some important regional variations, particularly in economicdevelopment. Just under 20% of the population live in Budapest, with thesurrounding Pest county hosting another 10%. The capital’s population isfalling as increasingly wealthy inhabitants move out to new commutersettlements in Pest. The highest levels of economic activity in the 1990s havebeen concentrated in the region around Budapest and in Transdanubia, theregion west of the Danube, particularly in the counties bordering Austria andaround Szekesfehervar. Most of the economic growth, foreign directinvestment (FDI) and export activity has also been in these areas. NorthernHungary, which was the focus of heavy industry development during theprevious regime, has benefited far less from the economic transition. The mainagricultural areas are in the east and south.
Average development levels(2000 unless otherwise indicated)
Pest Trans- Northern GreatBudapest county danubia Hungary Plain Total
Populationa (‘000) 1,812 1,033 3,066 1,269 2,867 10,043
Population densitya (persons/sq km) 3,450 162 84 95 79 108
Births (per 1,000 persons) 8.2 10.6 9.1 10.6 10.4 9.7
Natural increase (per 1,000 persons) –5.7 –1.9 –3.9 –4.5 –3.3 –3.8
Infant deaths (per 1,000 live births) 10.0 8.5 9.4 8.3 9.3 9.2
Per head GDP, 1999 (Ft ‘000) 2,159 911 1,083 751 783 1,132
Net monthly earnings (Ft ‘000) 72.1 53.7 51.1 48.1 46.4 55.8
Per head investment (Ft ‘000) 655.1 291.9 243.9 181.2 130.4 282.5
Foreign direct investment, 1998 (Ft bn) 1,450.6 244.1 465.3 176.5 237.0 2,573.5
Change in industrial production (%) 15.3 8.9 26.1 9.9 11.8 10.7
Unemployment rate (%) 5.3 5.2 7.8 10.1 7.2 6.4
a January 1st 2000.
Source: Central Statistical Office, Statistical Yearbook.

Hungary 41
© The Economist Intelligence Unit Limited 2002 EIU Country Profile 2002
Economic sectors
Agriculture, forestry and fishing
Agriculture and viticulture have traditionally played an important role in theeconomy. The country has a favourable climate and fertile soil conducive tocrop production. It is self-sufficient in almost all agricultural products andduring the communist era exported about one-third of all output. A widevariety of crops are produced, including wheat, maize, rice, fruit andvegetables, rye, barley, oats, sunflower seeds, and sugarbeet. Dairy and livestockproduction is also important. (See Reference table 11 for volume indices ofsales of agricultural products, and Reference table 12 for livestock numbers.)
However, agriculture has fared badly since the end of communism. Transitionmeant the reduction of subsidies and the shrinking of previous Council forMutual Economic Assistance (CMEA, or Comecon) markets, and there has beenincreased competition from cheaper EU and Central European Free-TradeAgreement (CEFTA) food imports. Changes of ownership in the early 1990salso disrupted production and reduced efficiency. Agricultural output (on avalue-added basis) declined in real terms by 16.5% in 1992 and 7.9% in 1993.Although output has held up comparatively well amid an accelerated exodus oflabour from the land, average farm productivity remains well below EU levels,with investment badly needed. Stock breeding, although still generatingalmost half of total output, is in long-term decline, and the livestock numbersrecorded at the start of 2000 were the lowest for a century. Depressed incomesand declining employment in the countryside fuelled the recovery in supportfor the Smallholders’ Party (SP) in the late 1990s.
Serious droughts in 1992-93 and again in 2000 hit the sector, and spring floodsare becoming increasingly common in the north-east, causing major problemsin 1998-2000. In 2000 there was a 4% fall in agricultural real gross value added,and agriculture now accounts for under 5% of GDP. Improved weatherconditions helped agriculture to a better year in 2001, however, withprocurement of agricultural products rising by 9.8% for the year to December.Cereals production for the full year was more than 20% higher than theaverage for the previous five years.
A complicated land redistribution and voucher-based compensation systemwas adopted in 1992-93, to return farmland to private use after forcedcollectivisation in the 1960s. State and collective farms were required to setaside a total of 2.1m ha of land for auction to voucher holders, with 90%coming from collective farms. By the end of 1994 nearly all the co-operativeland had been auctioned. In addition, the government pursued a policy oftransforming the collective farms into co-operatives. Many large collectiveswere split into several smaller co-operatives. Despite the liquidation of 168collective farms, the present number of co-operatives exceeds the 1,273collective farms that existed before the transformation process. Privatisation of
Post-communist troubles
Land redistribution

42 Hungary
EIU Country Profile 2002 © The Economist Intelligence Unit Limited 2002
the 121 large state farms has been much slower than the transformation ofcollective farms.
Some 60% of the 6.3m ha of arable land is cultivated by owners, and 80% ofplots are smaller than 1 ha. Limitations on the transformation of co-operativesinto joint-stock companies and constraints on land sale and leasing will workto maintain the existing agricultural structure. To restrict illegal leasing, theMinistry of Agriculture and Regional Development is enforcing registration ofall landowners and leaseholders cultivating plots larger than 1 ha. In late 2001the government announced a scheme of heavily subsidised loans to supportland purchases by family farmers and the creation of a National Land Fund toallow state land purchases.
The Hungarian Socialist Party-Alliance of Free Democrats (HSP-AFD)government sought to liberalise the 1994 Land Act, which prohibitedorganisations and other legal individuals from owning farmland. Parties in thepresent government oppose allowing the sale of land to foreigners. In June2001, during EU accession negotiations, the government obtained a seven-year derogation from the EU from opening arable land sales to companies andjoint ventures, and a three-year derogation on sales to self-employed EUfarmers. The agreement allows a transition period of five years for the sale ofnon-arable land.
The government protested against the European Commission’s initial plans forthe extension of direct payments to farmers under the common agriculturalpolicy (CAP), unveiled in January 2002. Under the Commission’s plans,farmers in new member states would receive only 25% of the full subsidy onentry in 2004, with a ten-year transition period before becoming eligible forthe full amount. The main problem for Hungary with this proposal, as forother candidate states, is its apparent violation of the principle of faircompetition across the EU and the political message it sends about the statusof the new member states. Compared with the current situation, integrationinto the CAP could actually be relatively unproblematic, because directagricultural subsidies and price supports from the government are small,despite the efforts of the SP to increase them. Export financing is the majorsource of agricultural support.
Mining and semi-processing
The mining industry in Hungary is limited. With the exception of bauxite, thecountry is not endowed with significant natural resources. Mining outputsuffered significant declines in the 1990s and did not show any positive growthuntil 1996. Production in 2000 was down by 10% on 1999, at Ft56m(US$199,359), and accounted for just 0.5% of total industrial output. Bauxiteproduction declined over 1989-94, before stabilising at about 1m tonnes in1995-2000, 40% of the 1989 level.
Hungarian coal generally has a low energy content and rests in thin seams atgreat depths. Mining is therefore difficult and costly. Known economicallyrecoverable reserves of hard coal are about 100m tonnes, with proven reserves
A small sector becomeseven smaller

Hungary 43
© The Economist Intelligence Unit Limited 2002 EIU Country Profile 2002
totalling 714m tonnes. Reserves of lower-quality coal are much larger, withabout 5.7bn tonnes of total proven reserves and 3.7bn tonnes ofeconomically recoverable reserves. Coal production fell during the early yearsof transition, but increased in 1996 and 1997, reaching 15.6m tonnes in1997. Production again dropped in 1998-2000, to around 14.5m tonnes,under 70% of 1989 production. (See Reference table 13 for output of energy,minerals and mineral products.)
Manufacturing
Under communism the manufacturing industry was characterised by large,heavy industrial plants, dependent on cheap energy imports and shelteredfrom competition. With few domestic mineral resources, the emphasis on iron,steel and engineering required large imports of iron ore and energy inputs.Industry suffered a major decline in output during the 1990s. Industrialproduction at the end of 1992 was 31% below its 1989 level, standing roughlyat its 1975 level. Manufacturing output declined even more severely, down by54% in 1989-92. The steepest declines were in those industries most orientedtowards trade with the former Comecon trading bloc, notably metallurgy andengineering. Subsectors less geared to Comecon, such as food-processing andelectricity, experienced much more modest declines. Manufacturing outputrose slightly in 1992 and showed stronger growth from 1993. Output inelectricity and other energy production turned positive in 1994. However, thestabilisation measures introduced in 1995 slowed the growth of manufacturingand energy output in that year and in 1996.
Manufacturing activity has recovered strongly since 1997, with engineeringoutgrowing other sectors. Investment by foreign companies modernising andrestructuring privatisation and commercial acquisitions have led to majorstructural and efficiency improvements in manufacturing industry, and made acontribution to the rise in output in recent years. Manufacturing accounted for91% of industrial production in 2001. Machinery manufacturing has remaineda consistent growth sector, having benefited from increased exports, alongsidechemicals and the food industry. Increases in output were led by subsidiaries ofWestern firms operating in Hungary. (See Reference table 14 for statistics onindustrial production by sector.)
Industrial output and sales(% change, year on year; constant prices)
Annual average2001 1997-2001
Production 4.1 11.0
Total sales 4.5 11.3
Domestic sales 0.1 2.5
Export sales 8.9 24.4Source: Central Statistical Office (CSO).
Although Hungary’s communist-era commercial vehicle makers struggledinitially to generate new business after the loss of their captive Comecon
A sharp contraction as partof the economic transition
Investment spurs industrialgrowth
The car industry

44 Hungary
EIU Country Profile 2002 © The Economist Intelligence Unit Limited 2002
markets, Raba—previously known primarily for producing heavy goodsvehicles—moved successfully into the components and supply market. The busmanufacturer Ikarus continues to export worldwide and has a unit producingprimarily for the US.
Car assembly and components production in Hungary has grown almost fromscratch since the early 1990s thanks to major foreign investment. Suzuki(Japan) opened a car assembly plant in October 1992 and has steadily increasedthe production of cars to more than 50,000 per year. Audi-Volkswagen(Germany) now produces more than 1m engines per year at its facility nearGyor, acting as the main engine supplier to the Volkswagen group. The plant’sability to combine strong technical skills with low wages has also made it theproduction site for the upmarket TT model, of which around 60,000 weremade in 2000. GM-Opel also has manufacturing and car assembly plants.These three operations produced 138,000 cars in 2000. In addition, Ford hasmade parts in Szekesfehervar since 1990. Rising incomes have seen growingnew car registrations and an increasing stock of cars, 244 per 1,000 people in2000. Vehicle manufacturing as a whole accounted for 14% of industrialoutput in 2001. Future gains are likely to be modest, however, as Hungary’s carsector faces stiff competition from the Czech Republic.
Hungary inherited an important pharmaceuticals industry from thecommunist period. The country’s pharmaceutical companies are too small torun research programmes on a scale that can reliably generate new proprietarydrugs, and new competition from Western firms has hit the sector, drivingdomestic firms’ market share down to around 40%. However, the size of themarket in Hungary made the sector an attractive target for foreign investors;five of the six major pharmaceutical firms are majority foreign-owned.Hungary has become an important low-cost production base for patentedcompounds manufactured under licence, and high-quality branded genericsubstitutes for out-of-patent drugs. Domestic firms have benefited from theliberalisation of the growing over-the-counter market, the retail value of whichhas tripled since the mid-1990s in US dollar terms. Multinationals have alsoassigned contract research to local companies. Hungary’s pharmaceuticalssector now accounts for more than 5% of the country’s exports and holds a 2%share in world production.
The continued imposition of price controls on drugs bought by the publichealth service has not unduly affected leading manufacturers’ profitability;producers agreed the 6.3% maximum rise for 2001 after ensuring that theirinvestment and product launch plans would not be disrupted. It may evenhave contributed to improved performance, by forcing companies to upgradetheir products’ quality and clinical effectiveness in order to qualify forcontinued price subsidy, which in turn has made it easier to side-step thecontrols by expanding exports. Leading companies Richter Gedeon, Egis andChinoin suffered during 1998 through the continued importance of Russia(which was then in deep recession) as an export market, but their sales andprofit recovery in 1999-2000 reflects their capacity to reclaim sales in thistraditional market and their growing ability to overcome regulatory hurdles totap new OECD markets.
Chemicals andpharmaceuticals

Hungary 45
© The Economist Intelligence Unit Limited 2002 EIU Country Profile 2002
Chemicals production has undergone rapid rationalisation since privatisation,with two companies—Borsodchem and TVK—emerging as principal rivals insome bulk chemicals markets, while still holding complementary buyer-sellerroles in others. In late 2000 a battle for strategic control of the industrybroke out between MOL, which had built up a controlling stake in TVK, andits Russian counterpart, Gazprom, which acquired a similar hold onBorsodchem through associated company stakes. Gazprom and its Russianallies have the upper hand in being major suppliers of petrochemicalsfeedstock. Vertical supply-chain links between Borsodchem and TVK willforce them to keep working together despite parent company rivalries.Chemicals production fell by just over 4% in 2001, but still accounted for5.2% of total industrial production.
The availability of comparatively cheap, technically skilled labour and nearbyEU markets has attracted a number of leading electronics and software firms toHungary, and encouraged a large number of domestic start-ups in this area. AnOECD survey from 2000 put Hungary among the countries with a highintensity of information and communications technology in its productionprofile, having measured the relative importance of the sector in employment,value added, research and development, and trade. Mobile telephone makerNokia (Finland) has chosen Budapest for its largest software developmentcentre outside Finland, encouraging similar moves by Ericsson and Motorola.Microsoft’s efforts to enter the world computer-game market, through theX-Box video console, are centred on Hungary, through a deal withSingapore-based Flextronics, which has added production of the X-Box toHungarian operations that already employ over 10,000. Among indigenousfirms, specialists such as Graphisoft, which has become the world’s thirdlargest supplier of architectural software, are generally perceived to have amore stable future than those competing directly with major multinationals.Systems integrator Synergon, the most prominent of these, has had somesuccess as an exporter within the region, but came under strong pressure fromEU- and US-based rivals, especially after the downturn in contracts andinvestor confidence in 2000-01. Over 95% of information technologyproduction is exported.
Construction
Residential and commercial construction were neglected under communism, atrend that continued through the early 1990s as neither public nor privatesectors could raise the necessary investment funds. As beneficiaries of liberal-isation began to sink their wealth into property, dwelling construction rose by18% in 1995 and 15% in 1996. However, austerity measures halted thisprogress, and house completions fell by 28% (to 20,300) in 1998 and 5% (to19,300) in 1999. A key part of the Szechenyi Plan (see The economy) is toaccelerate completions to 40,000, which the government calculates is necessaryto meet demand. This target is still below the 43,800 units built in 1990 and the72,500 built in 1985, but will require a significant improvement in availabilityand affordability of mortgage loans, so that ordinary households can join the
Information andcommunication technology
The government sponsors aturnaround

46 Hungary
EIU Country Profile 2002 © The Economist Intelligence Unit Limited 2002
“new rich” as buyers of new property. Initial indications are that thegovernment’s support for the construction and mortgage sector was having aneffect: production by construction firms rose by 5.8% in 2000 and 10% in 2001.Some 60% of the 81,500 construction firms registered at the end of 2000 wereindividual entrepreneurs. (See Reference table 15 for construction statistics.)
Financial services
After an early recapitalisation programme followed by comprehensiveprivatisation, bringing in foreign strategic partners, Hungary has one of theregion’s most advanced banking sectors. Competition is intense, with morethan 20 foreign-invested banks competing for new commercial and retailbusiness. This ensures an improving service for borrowers, with increasingnumbers of businesses able to turn to banks for additional capital. It also makesfurther consolidation inevitable, especially with rapidly growing telephone andInternet banking raising the pressure to close under-used branches. ING’s saleof retail banking interests to Citigroup in 2000, and the merger of ABN-Amro’sand KBC’s Hungarian operations in 2001, are the latest steps in this direction.
Hungary began to transform its banking sector in 1987, when the monopoly ofthe National Bank of Hungary (NBH, the central bank) was abolished and atwo-tier system was created. The two main credit sections of the NBH weretransformed into two commercial banks, the Hungarian Credit Bank and theCommercial and Credit (K&H) Bank. A third major bank, Budapest Bank, wasalso created as a result of these reforms. From 1989 all banks were allowed tohandle all areas of banking including foreign exchange, which had until thenremained a monopoly of the NBH. An interbank foreign-exchange market wasintroduced in 1992. Additional reforms of the banking sector introduced in1992 included the incorporation of Bank for International Settlements (BIS)guidelines and the requirement of an 8% capital-adequacy ratio. Furtherrestructuring of the banking system took place in 1994, as the governmentrecapitalised the banks through a combination of enlarged equity positionsand subordinated loans.
These successful consolidation attempts paved the way for the privatisation ofthe major banks. This was virtually complete by the end of 1996, although thestate still accounted for 22.4% of banking sector assets. The state still retains alarge minority share in the largest bank, National Savings Bank (OTP), and is inthe process of selling a number of medium-sized and smaller banks, as well asPostabank, which it had to bail out, at an eventual cost of Ft153bn (US$800m),after a run on its deposits in March 1997. The trend of declining stateshareholdings has been accompanied by a corresponding increase in foreignownership, from 14.9% in 1994 to 67.6% by 2000.
Improved legal regulation and foreign banks’ presence has greatly improvedsector competitiveness. As of January 1st 1997 banks were allowed to trade ingovernment securities. Reserve requirements were reduced to an EU-comparable 7% (from 11%) in early 2001. Competition is becoming morefocused on the provision of services to retail customers, with developing credit
Slow but sure restructuring
Substantial foreignownership

Hungary 47
© The Economist Intelligence Unit Limited 2002 EIU Country Profile 2002
card and personal loan segments. OTP, sold in stages to institutional investorsbetween 1995 and 1999, has also emerged as the strongest financially. Thismainly reflects its avoidance of politically directed industrial lending before thereforms and its rapid adoption of new techniques and technologies since.Having resisted political pressure to take over Postabank, OTP is now makinginternational expansion plans.
Hungary has developed a competitive insurance sector with the participationof many large foreign companies. Allami (owned by Aegen) is the largestinsurer. Allianz (Germany) holds a dominant stake in Hungaria Insurance.Hermes Kreditversicherung, also of Germany, is in a consortium with Frenchand Austrian partners. Generali (Italy) also has a strong presence. The changein the pension system to allow private pension funds presents a number ofnew opportunities for insurance and other financial companies.
Hungarian public debt is issued and managed by the Government DebtManagement Agency (AKK). The central state budget and the social securityfunds finance their deficits through the AKK. The domestic bond marketcontinues to be dominated by government securities. Maturities were extendedto two- and three-year fixed-rate bonds in 1996, but Treasury bills of up to oneyear in maturity predominate. Five-year fixed-rate bonds were first issued inJanuary 1997. In December 1998 the NBH issued DM500m (US$300m) inseven-year bonds with an annual coupon of 4.625%. In January 1999 theTreasury issued its first domestic fixed-rate, ten-year bonds, sold at an averageyield of 9.82%. About 80% of the Ft12.5bn in bonds are thought to have beenbought by foreign investors, although foreign ownership of all governmentsecurities has grown more slowly, to 15% at the end of 2000. In November2001, the AKK oversaw the launch of a 15-year bond, which sold at an averageyield of 6.81%.Corporate bond issues remain scarce and mainly take the formof floating bonds issued by foreign-owned companies backed by parentcompanies. Non-resident investors may purchase government bills or bondswith a maturity at issue of one year or greater.
The Budapest Stock Exchange (BSE) was reopened on June 21st 1990, withshare trading for eight major companies. The stockmarket boomed in 1996 and1997, with some of the fastest growth rates among emerging markets. Thebenchmark BUX index of 25 stocks increased in forint value by 170% in 1996and by 94% in 1997. On April 23rd 1998 the index reached an all-time high of9,016, up by 12.7% from end-1997. After more than a year in the doldrumsfollowing the Russian crisis of August 1998, which hit emerging marketsgenerally and especially those central European markets regarded as havinglinks with Russia, the BSE came back into favour among emerging marketinvestors. Foreigners account for the bulk of active trading on the BSE (morethan 50%, compared with 30% in Warsaw), which accounts for the greatvolatility in the market in the wake of the Russian crisis and the exchange’sgeneral vulnerability to international market sentiment. At the end of the thirdquarter of 2001, non-resident foreigners held 72% of the value of listedcompanies (See Reference table 16 for stockmarket data.)
A competitiveinsurance sector
The bond market
The equity market

48 Hungary
EIU Country Profile 2002 © The Economist Intelligence Unit Limited 2002
The BSE’s recovery since 1999 has been uneven. Equity prices started revivingtowards the end of that year, but after a boom in early 2000 (the BUX indexclosing at a record 10,493 on March 10th) the general trend was again down-wards, as investors became more pessimistic about the telecommunications,pharmaceutical and financial stocks that dominate the index. Since late 2001there has been another revival, with the BUX back over 8,000 in early 2002.However, equity trading volumes (which account for 85% of the exchange’sbusiness) have remained relatively low, at a total of Ft 2,770bn for 2001,against around Ft 6,800bn in the two preceding years; the number of equitiestransactions fell by 59% in 2001. The number of quoted shares peaked at 66 in1999 and had fallen by ten by the end of 2001. The BSE’s total average dailyturnover in 2001 was Ft13bn from 3,721 transactions—roughly 40% and 60%,respectively, of their 2000 levels. The exchange’s total capitalisation rose bynearly 7% over 2001, but a rise in the value of other securities masked a 16%drop in equities capitalisation. The BSE’s total capitalisation was equivalent toabout 50% of GDP at the end of 2001, with equities worth around 19% of GDP.Low liquidity, compounded by loss of listings as older companies are acquiredby multinationals and new ones float internationally, has forced the BSE todiscuss alliances with other exchanges, notably London.
Other services
Tourism generates at least 5% of GDP and is estimated to have added a positivebalance of US$2.6bn to the current account in 2001. When unofficial dealingswith tourists (such as private room rental) and the indirect impact of the sectorare taken into account, some calculations put tourism’s contribution as high as12% of GDP. Using these calculations, one in eight Hungarian workers isemployed in the travel and tourism industry. Tourism appears again to havemade a significant contribution to the economy in 2001, despite the generallyunfavourable international climate by the end of the year. Hotel occupancyrates and the number of tourist nights held virtually steady from 2000.
Hungary has not only been seeing rising visitor numbers but also, moreimportantly, higher spending per tourist. Government and major traveloperators are working together to shed Hungary’s earlier image as a budgetalternative to EU destinations, so as to continue to attract more higher-incomevisitors and extract more expenditure from them. Upgrading of tourismfacilities and the development of specialist attractions such as spa tourism are akey part of the Szechenyi Plan. Budapest and Lake Balaton are the leadingdestinations for foreign visitors. Modern hotels, a conference centre andattractive prices have helped the capital to become a major location forinternational conferences.
Tourism ugrading supportseconomy

Hungary 49
© The Economist Intelligence Unit Limited 2002 EIU Country Profile 2002
The external sector
Trade in goods
Foreign trade by commodity group, 2001
Exports (fob) Imports (cif) BalanceUS$ m % changea US$ m % changea (US$ m)
Food, tobacco & beverages 2,289.9 17.4 981.0 11.5 1,309.0
Raw materials 605.4 –8.8 679.3 –3.7 –73.9
Fuels & electricity 591.0 18.7 2,762.6 2.9 –2,171.6
Processed goods 9,454.3 15.7 11,889.8 5.0 –2,435.5
Machinery & equipment 17,557.2 4.4 17,369.2 5.4 188.0
Total 30,497.8 8.6 33,681.9 5.0 –3,184.1
a Year on year.
Source: Central Statistical Office (CSO).
Hungary is an open economy, with trade (exports and imports of goods andservices) accounting for around 130% of GDP. Rapid industrial transformationhas substantially altered the composition of exports, more than half of which(by value) are now of machinery and equipment, with electrical goods makingup around one-quarter. Import composition has adjusted to reflect this, withrising imports of raw and semi-processed materials. Exports have consistentlyoutgrown imports over recent years and were the main force behind the strongeconomic recovery. Tourism has been the most dynamic service export, butthere has been success in domestic substitution of service imports, especially offinancial and business services. (See Reference tables 18 and 19 for data onexports and imports.) The government is now working to reduce thecomparatively large proportion of exports derived from regions and sectorsenjoying tax concessions, many of which must be phased out to satisfy EUentry requirements.
Main trading partners, 2001(% of total value, in forint terms)
Exports to: Imports from:
Germany 35.6 Germany 24.9
Austria 7.9 Italy 7.8
Italy 6.3 Austria 7.3
France 6.0 Russia 7.0
US 5.0 France 4.7
Netherlands 4.5 Japan 4.6
Britain 4.3 US 4.2
Source: CSO.
Until 1992 the trade balance was largely neutral, but from 1993 the balance onthe trade and current accounts became negative: deficits of US$4bn andUS$4.3bn (10.4% and 11% of GDP), respectively, were recorded in that year.The dramatic deterioration in the trade balance in 1993-94 was a result of a

50 Hungary
EIU Country Profile 2002 © The Economist Intelligence Unit Limited 2002
precipitate decline in exports at a time when imports continued to increaserapidly. The increase in the external deficit was instrumental in thegovernment’s decision to introduce the Bokros stabilisation package, whichincluded import controls, in 1995 (see The economy). This, combined withstrong export growth, resulted in a narrowing of the trade deficit to aboutUS$2.4bn in 1995 and a stabilisation thereafter, except for an upturn caused byhigher imported fuel prices in 2000. In 2001 the trade deficit narrowed againto US$3.2bn, helped by lower oil prices.
Foreign trade has been substantially redirected towards Western markets since1991. EU partners accounted for almost three quarters of exports and 58% ofimports in 2001. Exports to EU countries in 2001 increased by 7.3% year-on-year in US dollar terms, and EU imports grew by 3.8%. Germany is thecountry’s most important trading partner, accounting for 35.6% of exports andone-quarter of imports in 2001. Austria and Italy are also important tradingpartners. Russia is a key import source; its place in Hungary’s overall rankingtends to vary with the price of oil. (See Reference table 20 for historicalstatistics on Hungary’s main trading partners.)
Food remains an important component of exports, but its share in the totalhas fallen below 8%. The composition of foreign trade has been transformedduring the economic transition. Apparel and clothing accessories, automobileparts, and machinery and equipment have become important exports, withthe re-export of processed imports playing a particularly important part inthese categories.
Direction and composition of trade, 1999(US$ m)
Exports fob Germany Austria Italy Netherlands Total
Food 344 130 126 46 1,841 of which: meat & preparations 173 19 52 7 596 fruit, vegetables & preparations 121 70 7 16 468Beverages & tobacco 25 2 1 1 155Mineral fuels 48 215 7 2 407Chemicals 142 93 153 37 1,540Textile yarn, cloth & manufactures 100 31 83 3 371Non-metallic mineral manufactures 89 23 25 4 332Iron & steel 115 31 38 3 322Non-ferrous metals 107 34 32 19 398Metal manufactures 294 59 19 16 614Machinery & transport equipment 6,546 1,235 407 992 14,309 of which: road vehicles 1,437 76 139 32 2,251Furniture 428 40 10 7 556Clothing 448 167 233 89 1,318Footwear 193 39 80 3 352Total incl others 9,600 2,399 1,477 1,296 25,012
continued

Hungary 51
© The Economist Intelligence Unit Limited 2002 EIU Country Profile 2002
Imports cif Germany Austria Italy Russia Total
Food 68 33 32 3 748Mineral fuels 19 121 1 1,144 1,705Chemicals 637 202 221 50 2,677Leather & manufactures 109 17 89 0 295Paper etc & manufactures 122 109 27 5 590Textile yarn, cloth & manufactures 305 97 244 3 1,148Non-metallic mineral manufactures 111 42 76 5 424Iron & steel 193 67 50 8 612Non-ferrous metals 115 39 20 182 555Metal manufactures 427 86 96 6 944Machinery & transport equipment 5,075 1,355 867 117 14,098 of which: road vehicles 1,093 86 147 51 2,453Clothing 99 81 103 0 511Scientific instruments etc 184 20 30 0 554Total incl others 8,189 2,503 2,159 1,631 28,008
Source: OECD, International Trade by Commodities Statistics.
Hungary has taken a number of steps to promote exports. In accordance withan agreement with the OECD, there are officially supported export credits.Certain interest subsidies to small and medium-sized enterprises (SMEs) may ineffect result in export subsidies. Import duties may be reclaimed by re-exporters, although agreements with the EU and the Central European Free-Trade Agreement (CEFTA) have limited this practice since July 1st 1997. Thereare preferential tax treatments for exporters who invest more than Ft1bn(US$3.5m). The export of a number of agricultural products and food items isalso subsidised, and Hungary ended its 11-year membership of the Cairnsgroup of the World Trade Organisation (WTO) because of its opposition tofurther subsidy reduction. In October 1997 the WTO agreed to allow Hungaryto support agricultural exports directly until 2002, ending a two-year dispute.
Hungary started early on trade liberalisation, but proceeded at a moremeasured pace than most other countries in the region. The 8% importsurcharge introduced in March 1995 was eliminated in July 1997. The EUassociation agreement and membership of the WTO limit the scope foradopting protectionist measures. The Customs Law and the Customs Tariff Act,which both came into force in April 1996, brought 70% of Hungarian customsregulations into line with those of the EU. Tariff harmonisation with the EU isnow complete, with industrial trade fully liberalised from January 1st 2001.
Invisibles and the current account
The current account was in deficit throughout the 1980s, with the exception of1983-84. The deficit reached crisis proportions in 1989, when interestpayments combined with a deterioration in the tourism account to produce adeficit of almost US$600m (2% of GDP), a small sum by the standards of todaybut an unmanageable burden at the time. In 1990-92 the current-accountbalance was positive, thanks to positive trade balances during 1990-91 andpositive services and incomes balances in 1992. By 1993 the trade deficitreached US$4bn, contributing to a current-account deficit of US$4.3bn. A
Balance-of-payments crisisin 1980s and early 1990s

52 Hungary
EIU Country Profile 2002 © The Economist Intelligence Unit Limited 2002
deficit of US$4.1bn in 1994 provided the context for the introduction of the1995 stabilisation programme.
As a result of reforms, the current-account deficit was reduced to US$2.5bn in1995 and US$1.7bn in 1996. A substantial improvement in 1997, to a deficit ofUS$982m, resulted from a reduction in the trade deficit, which fell to justunder US$2bn from US$2.7bn the previous year. The current-account deficitincreased substantially in 1998, to US$2.3bn, as a result of a US$400mworsening of the trade deficit component and an erosion of the services andincome component. There was an improvement in the current-accountbalance in 1999, when the deficit shrank to US$2.1bn. This improvementcontinued in 2000, despite a rise in the import bill of US$3.4bn, caused byhigher oil prices. An improved tourism surplus and a lower investment-incomedeficit helped to keep the current-account deficit shrinking as a proportion ofGDP, despite the renewed rise in the trade gap. (See Reference table 21 forbalance-of-payments statistics.)
Initial figures announced for 2001 showed a current-account deficit of just€518m (US$464m). However, the National Bank of Hungary (NBH, the centralbank) revised this figure up to €1.2bn while simultaneously revisingdownwards the 2000 deficit figure by a smaller amount. The revision wasmainly the result of a worsened trade deficit. The current-account deficit in2001 was still smaller than in 2000, but the revision meant that Hungary’sexternal performance was not as outstanding as initially thought, at a time ofunfavourable international conditions. The revision also underminedconfidence in the NBH’s reporting, spurring moves to shift to theinternationally used customs-based system for calculating the current accountfrom the method based on financial flows still used in Hungary.
Current account, 2001(US$ m)
Merchandise exports fob 28,050
Merchandise imports fob –30,071
Trade balance –2,021
Net services 2,158
Net income –1,487
Net transfers 246
Current-account balance –1,104
Note. Based on preliminary euro figures.
Source: National Bank of Hungary.
Capital flows and foreign debt
Hungary entered transition with the heaviest foreign debt burden in centralEurope. The external debt declined in the early 1990s, but rose again with thedramatic increase in current-account deficits in 1993-94, to reach US$31.6bn(70.7% of GDP) at the end of 1995. Unlike Poland, Hungary did not default sodid not secure a reduction and rescheduling from creditors. As a result, external
Containing the debt
The picture improves

Hungary 53
© The Economist Intelligence Unit Limited 2002 EIU Country Profile 2002
public debt was still more than 60% of GDP in 1998, compared with less than44% for Poland and less than 10% for the Czech Republic. Falling interest ratesand a growing domestic investor base have allowed extensive repayment offoreign-currency with forint-denominated debt, which comprised more than60% of public debt by mid-2000. Debt-servicing in 1999 was 26.6% of totalexports. This is still the highest in east-central Europe, although Poland hascaught up, with a debt-service ratio of 26%.
Since then gains from the stabilisation and privatisation programmes havebeen used to reduce the foreign debt. According to data from the NBH, at theend of December 2001 net foreign debt, which subtracts currency reserves andforeign credits from gross debt, stood at €11.8bn (US$10.4bn). Lower servicingcosts, achieved through better credit ratings and international interest-ratecuts, have been a major factor in the falling net debt burden. More than 80%of medium- and long-term debt is owed to commercial creditors. Although themajor share of the debt is owed by the NBH and the government, the share ofnon-guaranteed private debt has been increasing rapidly. The share of short-term debt has fallen steadily since the 1980s, and was estimated by theEconomist Intelligence Unit at about 13% of the total external debt stock atend-2001. (See Reference table 22 for external debt figures.)
Positive developments in the external balance and external debt have led to asteady upgrading of Hungary’s credit ratings by international rating agencies.In 1996 Japan Credit Rating, Duff & Phelps, IBCA, Standard & Poor’s, andMoody’s all lifted the country’s credit ratings to investment grade. Re-ratingcontinued with a Moody’s upgrade to A3 from Baa1 in November 2000,sparking rapid upgrades from all other agencies. These upgrades have enabledthe country to raise funds more cheaply than in the past. Our risk rating,which assesses a country’s political and economic structure, economic policyand liquidity risk, has shown a gradually improving trend for Hungary. InJanuary 2002 Hungary scored a “B” according to our risk assessment,indicating that there are no significant foreign-exchange constraints, but thateconomic policies or political structure may still be a cause for concern.Hungary is ranked alongside South Korea, Chile and China, and its score iscomparable to that of other east-central European economies.
Hungary has been the most accommodating country in eastern Europe forforeign investors. No other country has been as prepared to sell majority stakesin sensitive sectors, such as banking or energy, to foreign investors. The freerepatriation of after-tax profit and capital is guaranteed. No industrial or servicesectors are entirely off-limits to foreign investment, but foreigners are formallybarred from buying farmland. Some areas, such as defence, transport,telecommunications, pipelines, electric power and gambling, can be enteredonly under the terms of a specific concession. Major investments in banking,securities trading and insurance are also subject to government approval.
Many of the earlier incentives have been phased out. Those remaining apply todomestic and foreign companies. They include an investment tax preference of50% (100% in priority areas), subject to the value and value added of exportsproduced, and a reduction based on a percentage of future taxes to be paid,
A regional leader in FDI

54 Hungary
EIU Country Profile 2002 © The Economist Intelligence Unit Limited 2002
subject to the share capital invested, environmental factors and exportpotential. There are also certain beneficial deduction and depreciationallowances for plant and machinery, as well as tax preferences for offshorecompanies registered in Hungary. Companies operating in free-trade zones areexempt from customs and indirect taxes. Tax holidays are available forinvestments in the depressed east of the country. According to the IMF,Hungary grants the most tax and import duty allowances for greenfieldprojects in the region.
Hungary lost its regional lead to Poland in 1997 in terms of absolute inflows offoreign direct investment (FDI). However, Hungary remains far ahead ofPoland on a per head basis, with a stock of inward FDI of US$1,966 per head in2000, compared with US$923 for Poland. The exceptional US$4.5bn recordedin 1995 resulted from large foreign investments in various utility privatisations.As the privatisation programme comes to an end FDI has fallen gradually, withinflows falling to US$1.7bn in 2000. Despite the sharp decline in global foreigninvestment in 2001, inflows of FDI into Hungary actually reached a six-yearhigh of an estimated US$2.4bn. Although FDI is expected to stay close toUS$2bn in the medium term, it will increasingly depend on greenfield andfollow-on investment rather than privatisations.
Foreign reserves and the exchange rate
Largely as a result of foreign debt payments, Hungary’s foreign-exchangereserves (excluding gold) declined during the 1990s. However, the NBH hadrebuilt them to US$11.2bn at end-2000, largely as a result of foreign-currencypurchases needed to keep the forint within its narrow exchange-rate band priorto May 2001. Reserves fell again in 2001, to US$10.7m. Gold reserves decreasedfrom a high of US$45m at end-1993 to US$28m at end-2001. (See Referencetable 23 for statistics on foreign reserves.)
An essential element of the 1995 stabilisation programme was a one-offdevaluation of the forint, followed by the introduction of a crawling-pegregime utilising narrow fluctuation bands. The policy was designed to stabilisethe currency and serve as a nominal anchor, protecting it against speculativeattack. Successive reductions in the crawling-peg devaluation rate, from itsinitial 1.8% per month to 0.2% on April 1st 2001, maintained a gradual realappreciation of the currency, helping to discipline inflation withoutendangering trade-sector competitiveness.
The narrow-band policy was relaxed in May 2001, when the forint’s permittedvariation around its central euro rate was widened to ±15% from ±2.25%.Recognising that it cannot fine-tune the exchange rate now that monetarypolicy is targeted at inflation, the NBH abandoned the crawling-peg currencysystem from October 1st 2001. The NBH is now to indicate a rough exchange-rate goal compatible with its overriding inflation target (see Economic policy).
The forint has been convertible in current-account transactions since January1st 1996. Inbound long-term capital-account transactions are basically
Reserves have been falling
The crawling-peg regime
Fluctuation bands widenbefore forint is floated
Hungary 55
© The Economist Intelligence Unit Limited 2002 EIU Country Profile 2002
unrestricted. Hungary undertook to phase out remaining restrictions on capitalflows when it joined the OECD in March 1996. Further steps towards fullconvertibility were taken at the beginning of 1998, when trade in investment-grade securities from OECD countries, including participation in investmentfunds, was liberalised. Foreigners were allowed to invest without limit inHungarian open-ended funds. Hungarians were given the right to buy realestate abroad without restriction (barring a reporting requirement). Greaterrestrictions apply to outbound capital-account transactions and to short-terminflows. Remaining capital controls were removed with the flotation of theforint in 2001.

56 Hungary
EIU Country Profile 2002 © The Economist Intelligence Unit Limited 2002
Appendices
Regional organisations
The Central European Free-Trade Agreement (CEFTA) was signed in December1992 by Hungary, Poland, the Czech Republic and Slovakia. They were joinedby Slovenia in 1996, Romania in 1997, and Bulgaria in 1998. The Baltic states,Croatia, Macedonia and even Russia and Ukraine have expressed interest inCEFTA membership. The initial impetus for setting up CEFTA was to counteractthe collapse in inter-regional trade after the Council for Mutual EconomicAssistance (CMEA, or Comecon) trading system was abolished. The signatoriescommitted themselves to the “gradual introduction of a free-trade area”.
Trade in industrial products among CEFTA members, now a market of almost90m people, was fully liberalised on January 1st 2000, with the exception ofthe export of cars to Poland, which was liberalised on January 1st 2002.However, trade in agricultural goods remains subject to barriers, which in somecases have been increased. Nonetheless, CEFTA has enabled its members torestore trade links severed in the early 1990s. CEFTA membership also hassignificant symbolic political features. As all the members are candidates for EUmembership, CEFTA membership has become a symbol of belonging to theadvance guard of the transition. CEFTA members must already have anassociation agreement with the EU.
The Central European Initiative (CEI), originally known as the Quadragonale,was established in 1989 by Austria, Hungary, Italy and the Socialist FederalRepublic of Yugoslavia (SFRY). Membership has since risen to 16 and from1992 the organisation has been known under its present name. The currentmembers are: Austria (1989), Italy (1989), Hungary (1989), Poland (1991),Croatia (1992), Slovenia (1992), Bosnia and Herzegovina (1992), Macedonia(1992), the Czech Republic (1993), Slovakia (1993), Albania (1996), Belarus(1996), Bulgaria (1996), Moldova (1996), Romania (1996) and Ukraine (1996).The CEI, which aims to promote pan-European integration and co-operation,provides its members with a flexible and not overly institutionalised forum todiscuss important regional issues.
CEI activities are agreed at annual meetings of prime ministers and foreignministers. The activities of the organisation have evolved over the past tenyears. Initial goals included improving regional co-operation between theformer communist bloc and western Europe, supporting the transition process,and assistance in preparing infrastructure and commercial developmentprojects. In recent years the CEI’s focus has shifted to assisting EU enlargement,in co-operation with the European Bank for Reconstruction and Development(EBRD) and the EU.
The European Bank for Reconstruction and Development (EBRD) was set up in1991 to help finance the development of central and eastern Europe after thefall of communism. By contrast with most other multilateral organisations
Central European Free-Trade Agreement
Central European Initiative
EBRD

Hungary 57
© The Economist Intelligence Unit Limited 2002 EIU Country Profile 2002
involved in the region, the EBRD’s mandate compelled it to focus on the privatesector, as it was allowed to commit no more than 40% of its funds to public-sector projects. It received an initial capital of Ecu10bn (US$12bn at 1991average exchange rates), which was doubled in 1997. The EBRD initially foundit difficult to carve out a niche for itself, and was in its early years beset byscandals and a leadership crisis. Although it recovered from these, in 1998 theRussian financial crisis resulted in heavy losses for the Bank. Russia has been theEBRD’s largest client, accounting for one-fifth of all funding in 1991-2000.
Nevertheless, over the past decade the EBRD has invested substantial sums inthe region and has helped to encourage private-sector investors. By 2000 it hadrecovered from its 1998 losses, and by the end of 2000 had disbursed €12.1bn(US$11.5bn) of its €20bn capital, of which €1.2bn went to Hungary. If co-financing from other lenders and the private sector is added, the EBRD hasbeen responsible for investment worth US$3.5bn into Hungary. The Bank’sclientele has grown from just a handful of transition countries in the early1990s to 27 countries today, with Yugoslavia (Serbia-Montenegro) being themost recent addition to the Bank’s list of potential beneficiaries. The EBRD hasfunded hundreds of projects, ranging from bank privatisation to roadbuilding.
The US has long wanted the Bank to shift its focus further east from the moreadvanced countries of east-central Europe to the Commonwealth ofIndependent States (CIS) and the Balkans. The east-central European countriesare seen to have “graduated”, to be able to rely on private-sector finance and tono longer need the EBRD’s support. However, west European governmentswant the Bank to stay engaged in central Europe and help these countries toprepare for EU accession. The EBRD is to boost its annual lending from €2.7bnin 2000 to €3.5bn in 2001 and thereafter. Whereas funding of the advancedEU accession candidates is to remain constant, at around €1bn per year, mostnew business will be directed to the CIS and the Balkans, where the Bank hashad trouble in the past in finding viable investment projects.
Initially a non-institutionalised multilateral forum for Cold War east-westdialogue, the Conference for Security and Co-operation in Europe (CSCE)gradually expanded in aim and strengthened its organisational structure in the1990s. Established in 1972, the CSCE served for almost twenty years as aconvenient and flexible arrangement for easing Cold War tensions. After theend of the Cold War the role of the CSCE started to change quickly, and inDecember 1994 the conference was officially renamed the Organisation forSecurity and Co-operation in Europe (OSCE). With 55 member states, theOSCE is the only inclusive pan-European security organisation. Canada andthe US are also members of the organisation.
The OSCE has played a key role in conflict prevention and resolution, as wellas post-conflict reconstruction in Europe. Its activities embrace threedimensions: security, economy, and human rights. The OSCE is engaged inpreventive diplomacy, arms control and confidence-building activities. Itundertakes fact-finding and conciliation missions and crisis management. TheOSCE is a component of the European security architecture. It is a “regionalarrangement” in the sense of Chapter VIII of the UN Charter, which gives it
Organisation for Securityand Co-operation in Europe

58 Hungary
EIU Country Profile 2002 © The Economist Intelligence Unit Limited 2002
authority to try to resolve a conflict in the region before referring it to the UNSecurity Council. In the course of the 1990s the OSCE has been heavilyinvolved in the Balkans and the Transcaucasus.
The activities of the OSCE are performed by a web of specialised agencies. TheHigh Commissioner on National Minorities, based in The Hague, is the primarysource of “early warning”, with responsibility for identifying ethnic tensions thatmight endanger peace. The Office for Democratic Institutions and Human Rights(ODIHR), based in Warsaw, focuses on promoting human rights, democracy andthe rule of law. It monitors elections, assists at developing national electoral andlegal institutions, promotes the development of non-governmentalorganisations (NGOs) and civil society, and conducts meetings, seminars andspecial projects. The Office of the Representative on Freedom of the Media, basedin Vienna, assesses the implementation of the member states’ commitmentsconcerning freedom of journalism, broadcasting and access to information.
Sources of information
The Hungarian Central Statistical Office (CSO) has a deserved reputation as aprofessional organisation producing quality statistics and data. It is the mainsource of non-monetary statistics on the Hungarian economy. The CSOproduces a number of quality products, including the Statistical Yearbook andthe Monthly Bulletin of Statistics. These are produced in Hungarian and English.The yearbook is a 600-page volume with detailed economic data on most areas;however, its timeliness could be improved.
The National Bank of Hungary (NBH, the central bank) publishes annual andmonthly reports that provide timely macroeconomic data and detailedfinancial statistics, as well as a commentary on domestic and external trends.
Budapest Business Journal is an English-language weekly providing businessnews and limited statistical data. A Hungarian-language newspaper, Figyelo,provides a comprehensive weekly review of economic activities. A daily,Vilaggazdasag, provides the best economics coverage.
The IMF, the World Bank and the OECD are the main international sources ofstatistics on the Hungarian economy.
Energy Data Associates, Bishops Walk House, 19-23 High Street, Pinner,Middlesex HA5 5PJ
IMF, International Financial Statistics (monthly)
OECD, Main Economic Indicators; Economic Survey of Hungary 1996-97 and1999-2000
World Bank, World Development Indicators; Trends in Developing Economies;Global Development Finance (formerly World Debt Tables)
David L Bartlett, The Political Economy of Dual Transformation: Market Reform andDemocratisation in Hungary, University of Michigan Press, Ann Arbor, 1997. Adetailed account of the economic and political transition in Hungary
National statistics sources
International statisticalsources
Select bibliography

Hungary 59
© The Economist Intelligence Unit Limited 2002 EIU Country Profile 2002
Andras Gero, Modern Hungarian Society in the Making, Central EuropeanUniversity Press, Budapest and London, 1995. A historical insight into Hungaryin the 20th century
Nigel Swain, Hungary: the Rise and Fall of Feasible Socialism, Verso, London andNew York, 1992. An assessment of the failures of the socialist economic project,with a good historical overview of socialist economic policy
Rudolf Tokes, Hungary’s Negotiated Revolution: Economic Reform, Social Change,and Political Succession, 1957-1990, Cambridge University Press, Cambridge andNew York, 1996. An overview of the economic and political changes inHungary from the aftermath of the 1956 revolution to the end of communism
Andras Torok, Budapest: A Critical Guide, Corvin, Budapest, 1997. This secondrevised edition of the best guidebook to the city is full of valuable culturalinsights
The Hungarian government website provides information on governmentprocedures and responsibilities, and links to government ministries,departments and agencies: http//www.meh.hu (available in Hungarian andEnglish)
The Hungarian CSO website provides latest monthly and quarterly datareleases. Historical and annual data is available in a searchable database on asubscription basis. There is little accompanying analysis, access is sometimesslow and navigation sometimes difficult: http//www.ksh.hu (available inHungarian and English)
The National Bank of Hungary website has a range of up-to-date statisticaldata, publications and commentary, although it tends to be factual rather thananalytical in nature. Navigation is sometimes difficult: http//www.mnb.hu(available in Hungarian and English)
Reference tables
These reference tables provide the most up-to-date statistics available at the date ofpublication.
Reference table 1
Population(end-period)
1996 1997 1998 1999 2000
Population (m) 10.17 10.14 10.09 10.04 10.01
Annual growth (%) –0.4 –0.4 –0.4 –0.5 –0.4
Birth rate (per 1,000 population) 10.3 9.9 9.6 9.4 9.7
Death rate (per 1,000 population) 14.0 13.7 13.9 14.2 13.5
Rate of natural increase (per 1,000 population) –3.7 –3.8 –4.3 –4.8 –3.8
Source: Central Statistical Office (CSO), Monthly Bulletin of Statistics.

60 Hungary
EIU Country Profile 2002 © The Economist Intelligence Unit Limited 2002
Reference table 2
Labour force
1996 1997 1998 1999 2000% of % of % of % of % of
‘000 total ‘000 total ‘000 total ‘000 total ‘000 total
Agriculture & forestry 302 8.3 288 7.9 279 7.5 270 7.1 252 6.5
Industry 972 26.7 989 27.1 1,034 28.0 1,043 27.4 1,031 26.8
Construction 218 6.0 219 6.0 230 6.2 253 6.6 268 7.0
Transport & communications 321 8.8 310 8.5 302 8.2 308 8.1 312 8.1
Distributive trades 601 16.5 618 16.9 594 16.1 651 17.1 674 17.5
Finance, real estate & business services 212 5.8 230 6.3 245 6.6 265 7.0 288 7.5
Others 1,022 28.0 993 27.3 1,014 27.4 1,021 26.8 1,025 26.6
Total 3,648 100.0 3,646 100.0 3,698 100.0 3,811 100.0 3,849 100.0
Note. Data refer to employment.
Source: CSO, Statistical Yearbook.
Reference table 3
Transport statistics
1996 1997 1998 1999 2000
Freight (bn tonne-km)Rail 7.6 8.1 8.1 7.7 7.8Road 10.2 10.4 12.6 13.1 13.3Waterways 2.5 1.6 1.6 1.0 0.9Pipelines 4.5 4.5 4.8 4.5 4.0
Passengers (bn passenger-km; excl private cars)Rail 8.6 8.7 8.9 9.5 9.8Road 9.8 10.2 10.6 11.3 12.2Air 2.8 3.1 3.0 3.5 3.5
Sources: CSO, Statistical Yearbook, Monthly Bulletin of Statistics.
Reference table 4
Structure of energy sources (production plus imports)(% of total)
1996 1997 1998 1999 2000
Coal 15.2 15.0 13.9 14.3 13.9
Hydrocarbons 69.2 69.0 71.5 70.3 68.6 Crude oil & petroleum 30.9 33.1 34.9 33.2 32.1 Natural gas 38.3 35.9 36.6 37.1 36.5
Electricity from nuclear power 11.9 12.1 12.1 12.6 12.6
Imported electricity 1.9 1.9 0.6 0.9 3.1
Other energy (firewood, charcoal, hydroenergy, etc) 1.8 2.0 1.9 1.9 1.8
Total 100.0 100.0 100.0 100.0 100.0 of which: ratio of imports 54.8 54.7 57.4 57.9 59.3
Sources: CSO, Statistical Yearbook.

Hungary 61
© The Economist Intelligence Unit Limited 2002 EIU Country Profile 2002
Reference table 5
Central state budget(Ft bn)
1997 1998 1999 2000 2001
Total revenue 2,364.6 2,624.4 3,227.6 3,679.3 4,083.6 Revenue from enterprises 352.0 377.2 444.1 468.3 508.1 Consumption taxes 942.3 1,117.5 1,405.5 1,659.7 1,783.6 Payments by households 460.6 520.5 626.0 755.2 896.4 Revenue of central & local government & extra-budgetary funds 333.7 394.4 566.7 607.7 730.4 Revenue related to internal debt service 193.5 123.5a 88.2 108.6 87.8 Revenue from international financial relations 45.7 – – – – Profit tax & dividends from financial institutions 19.8 67.1 44.3 39.6 32.4 Other revenue 17.0 24.2 52.8 40.2 44.9
Total expenditure 2,703.1 3,176.6 3,565.8 4,048.7 4,496.8 Subsidies to economic organisations 103.7 134.8 176.8 176.5 215.3 Consumer price subsidies 55.2 66.6 74.8 82.8 90.9 Capital formation expenditure 147.8 140.8 151.1 – – Benefits paid out through social security 221.2 274.2 378.8 431.1 549.5 Transfers to central government institutions 908.4 1,111.5 1,426.1 1,921.5b 2,218.9a
Transfers to local governments 348.7 405.7 449.0 428.8 508.9 Transfers to extra-budgetary funds 0.1 0.0 0.2 1.1 – Expenditure on international financial transactions 36.4 2.3 1.9 2.3 2.5 Debt service & interest payments 835.0 787.5 850.3 796.9 724.0 Other expenditure 47.1 253.2 56.8 207.7 186.8
Balance –338.5 –552.2 –338.2 –369.4 –413.2
a Includes capital formation expenditure. b Includes guarantees and contributions to social security.
Sources: National Bank of Hungary (NBH), Annual Report; Monthly Bulletin, Ministry of Finance, Monthly Report.
Reference table 6
Money supply(Ft bn unless otherwise indicated; end-period)
1997 1998 1999 2000 2001
Currency in circulation 562.6 667.0 846.2 876.2 1,138.4
Demand deposits 965.7 1,122.2 1,280.3 1,502.4 1,733.6
Money (M1) incl others 1,528 1,791 2,136 2,378 2,771
M1 growth (%) 23.5 17.2 19.2 11.4 16.5
Quasi-money 2,444 2,804 3,184 3,603 4,187
Money (M2) 3,972 4,595 5,320 5,981 6,958
M2 growth (%) 19.8 15.7 15.8 12.4 16.3
Source: IMF, International Financial Statistics; NBH, Monthly Bulletin.
Reference table 7
Gross domestic product(market prices)
1996 1997 1998 1999 2000
Total (Ft bn)At current prices 6,894 8,541 10,087 11,393 12,877At constant (1998) prices 9,199 9,620 10,087 10,508 11,050Real change (%) 1.3 4.6 4.9 4.2 5.2
Per head (Ft ‘000)At current prices 677 841 997 1,132 1,284At constant (1998) prices 903 948 997 1,044 1,101Real change (%) 1.7 5.0 5.2 4.7 5.5
Source: EIU.

62 Hungary
EIU Country Profile 2002 © The Economist Intelligence Unit Limited 2002
Reference table 8
Gross domestic product by expenditure(Ft bn; constant 1998 prices; % change year on year in brackets unless otherwise indicated)
1996 1997 1998 1999 2000
Private consumption 5,890 5,990 6,283 6,574 6,793(–3.4) (1.7) (4.9) (4.6) (3.3)
Government consumption 973 1,028 1,025 1,043 1,060(–4.2) (5.7) (–0.3) (1.8) (1.6)
Gross fixed investment 1,928 2,105 2,385 2,525 2,693(6.7) (9.2) (13.3) (5.9) (6.6)
Stockbuilding 423 453 608 567 704(2.0)a (0.3)a (1.6)a (–0.4)a (1.3)a
Exports of goods & services 3,461 4,375 5,106 5,773 7,033(8.4) (26.4) (16.7) (13.1) (21.8)
Imports of goods & services –3,476 –4,332 –5,318 –5,973 –7,232(6.2) (24.6) (22.8) (12.3) (21.1)
GDP 9,199 9,620 10,087 10,508 11,050(1.3) (4.6) (4.9) (4.2) (5.2)
a Change as a percentage of GDP in the previous year.
Sources: National sources; EIU.
Reference table 9
Gross domestic product by sector(% of GDP)
1995 1996 1997 1998 1999
Agriculture and forestry 7.1 6.9 6.1 5.7 5.0
Industry 32.3 31.7 33.8 33.7 33.5 Mining & quarrying 0.5 0.4 0.5 0.3 0.3 Manufacturing 23.6 23.3 24.7 24.7 24.5 Electricity, gas % water supply 3.4 3.5 3.9 4.0 4.0 Construction 4.8 4.5 4.7 4.7 4.7
Services (incl others) 60.6 61.4 60.2 60.6 61.5 of which: Real estate, renting & business activities 15.0 16.5 15.1 15.3 16.0 Wholesale & retail trade, repair of motor vehicles & household goods 11.8 11.7 11.9 11.9 11.9 Transport, storage & communications 9.4 9.5 10.1 10.1 10.5 Public administration & defence; compulsory social security 7.4 7.1 7.2 7.4 7.4 Education 5.4 4.8 4.8 4.8 4.9 Health & social work 4.8 4.7 4.6 4.5 4.6
Total 100.0 100.0 100.0 100.0 100.0
Source: National sources.
Reference table 10
Prices1997 1998 1999 2000 2001
Consumer prices (1991=100) 335.5 383.9 422.3 463.7 506.4 % change, year on year (18.3) (14.3) (10.0) (9.8) (9.2)
Producer prices: industry (1991=100) 261.8 291.4 306.3 341.8 359.6 % change, year on year (20.4) (11.3) (5.1) (11.6) (5.2)
Source: NBH, Monthly Report.

Hungary 63
© The Economist Intelligence Unit Limited 2002 EIU Country Profile 2002
Reference table 11
Volume indices of sales of agricultural products(% change, year on year)
1996 1997 1998 1999 2000
Plant cultivationa –5.1 –7.5 –6.0 19.0 –24.6
Vegetables –5.2 0.1 37.7 –21.4 –2.9
Fruit 73.7 –11.3 5.0 –19.3 34.3
Grapes & wine 0.6 31.9 –1.9 –6.4 20.7
Live animals & animal products 7.6 –3.3 –1.5 5.4 –1.3
Total 3.9 –4.2 –0.7 6.3 –7.5
a Includes cereals, legumes, industrial plants, potatoes, rough fodder and seeds.
Sources: CSO, Statistical Yearbook; Monthly Bulletin of Statistics.
Reference table 12
Livestock numbers
(‘000 head; year-end)a
1996 1997 1998 1999 2000
Cattle 909 871 873 857 805
Pigs 5,289 4,931 5,479 5,335 4,834
Sheep 872 858 909 934 1,129
Chickens 27,692 30,983 30,557 25,890 30,716
a Since 1996 data are from December 1st.
Sources: CSO, Statistical Yearbook; Monthly Bulletin of Statistics.
Reference table 13
Output of energy, minerals and mineral products(m tonnes unless otherwise indicated)
1996 1997 1998 1999 2000
Coal 15.0 15.6 14.6 14.6 14.1
Crude oil 1.5 1.4 1.3 1.2 1.2
Bauxite 1.1 0.7 0.9 0.9 1.0
Crude steel 2.1 1.8 1.9 2.0 2.1
Cement 2.7 2.8 3.0 3.0 3.4
Natural gas (m cu metres) 5.1 4.7 4.3 3.7 3.5
Electrical energy (m kwh) 35.0 35.3 37.0 37.0 34.3
Source: CSO, Statistical Yearbook.

64 Hungary
EIU Country Profile 2002 © The Economist Intelligence Unit Limited 2002
Reference table 14
Industrial production by sector(% change, year on year; volume indices)
1997 1998 1999 2000 2001
Food, beverages & tobacco –7.2 0.8 2.6 5.9 0.5
Textiles & apparel 2.4 10.6 9.8 12.6 1.8
Wood, paper & printing 15.4 5.4 6.1 21.6 4.1
Chemicals 4.6 3.2 –10.2 10.7 –4.1
Other non-metallic minerals 4.4 12.6 –3.1 9.6 6.3
Basic & fabricated metals 8.1 2.8 –0.5 21.0 2.9
Machinery & equipment 54.9 41.4 5.9 10.7 10.2
Other manufacturing –0.7 24.1 2.1 28.4 16.6
Manufacturing total 14.8 16.2 12.4 20.7 4.9
Mining –8.5 –18.2 0.5 –8.0 12.2
Energy supply 1.2 –0.4 –1.6 –1.8 –0.5
Industry total 11.1 12.5 10.5 18.3 4.4
Source: CSO, Statistical Yearbook.
Reference table 15
Construction(% change year on year unless otherwise indicated; volume indices)
1997 1998 1999 2000 2001
Building installation – – 17.9 8.2 1.2
Building completion – – 20.6 8.6 31.6
Total commercial construction 8.1 15.3 9.0 5.8 9.9
Private dwellings built (‘000) 28.1 20.3 19.3 21.6 14.4
Sources: CSO, Statistical Yearbook, Monthly Bulletin of Statistics.
Reference table 16
Budapest Stock Exchange(Ft bn unless otherwise indicated; end-period)
1997 1998 1999 2000 2001
Listed companies (no.) 49 55 66 60 57
Market capitalisation 3,058.4 3,020.1 4,145.0 3,393.9 2,848.8
Trading value 218.4 331.8 310.4 304.7 119.5
BUX indexa 7,999.1 6,307.7 8,819.5 7,849.8 7,125.2
% change 93.5 –21.1 39.8 –11.0 –9.2
a The BUX index (January 2nd 1992=1,000) replaced the BSE index in January 1995.
Source: International Finance Corporation, Monthly Review of Emerging Stockmarkets.

Hungary 65
© The Economist Intelligence Unit Limited 2002 EIU Country Profile 2002
Reference table 17
Retail sales
% change Ft bn (current prices) (constant prices)
1998 1999 2000 1999 2000
Total 3,683 4,330 4,822 7.9 2.0 Food, beverages & tobacco in specialised & non-specialised stores 1,287 1,451 1,515 7.0 –7.6 Textiles, clothing, footwear & leather goods 194 237 226 11.1 –9.6 Furniture, electrical household appliances & hardware 657 695 887 –1.9 21.1 Motor vehicles & motor vehicle parts & accessories 494 624 703 17.3 10.2 Automotive fuel 427 549 698 7.5 –0.3 Books, newspapers, stationery & other specialised stores 372 452 434 12.2 –9.8 Other goods in non-specialised stores 122 166 186 25.3 5.7 Pharmaceutical & medical goods, cosmetics & toilet articles 108 132 150 –3.6 –5.3 Second hand goods in stores 12 16 12 16.5 –24.2 Mail order 9 9 10 –1.3 6.4
Sources: CSO, Statistical Yearbook; Monthly Bulletin of Statistics.
Reference table 18
Exports(% of total)
1997 1998 1999 2000 2001
Fuels & energy 2.7 1.9 1.6 1.8 1.9
Raw materials 3.8 2.9 2.5 2.4 2.0
Machinery & equipment 45.1 51.9 57.3 59.8 57.6
Manufactures 35.5 32.7 30.6 29.1 31.0
Food, beverages & tobacco 12.9 10.5 8.0 6.9 7.5
Note. Totals may not sum to 100% owing to rounding.
Source: CSO, Monthly Bulletin.
Reference table 19
Imports(% of total)
1997 1998 1999 2000 2001
Fuels & energy 9.7 6.6 6.1 8.4 8.2
Raw materials 3.3 3.0 2.2 2.2 2.0
Machinery & equipment 41.8 46.5 50.2 51.4 51.6
Manufactures 41.0 40.2 38.4 35.3 35.3
Food, beverages & tobacco 4.2 3.7 3.0 2.7 2.9
Note. Totals may not sum to 100% owing to rounding.
Source: CSO, Monthly Bulletin.

66 Hungary
EIU Country Profile 2002 © The Economist Intelligence Unit Limited 2002
Reference table 20
Main trading partners(US$ m; % of total in brackets)
1998 1999 2000 2001
Exports to:Germany 8,420 9,600 10,471 10,860
(36.6) (38.4) (37.3) (35.6)Austria 2,445 2,399 2,443 2,417
(10.6) (9.6) (8.7) (7.9)Italy 1,323 1,477 1,654 1,905
(5.8) (5.9) (5.9) (6.2)Netherlands 1,086 1,297 1,522 1,402
(4.7) (5.2) (5.4) (4.6)US 1,045 1,297 1,475 1,525
(4.5) (5.2) (5.3) (5.0)France 876 1,123 1,470 1,818
(3.8) (4.5) (5.2) (6.0)UK 819 1,120 1,156 1,314
(3.6) (4.5) (4.1) (4.3)Belgium 604 754 878 997
(2.6) (3.0) (3.1) (3.3)Poland 529 519 605 609
(2.3) (2.1) (2.2) (2.0)Romania 564 468 574 764
(2.5) (1.9) (2.0) (2.5)Total incl others 23,005 25,013 28,092 30,498
Imports from:Germany 7,249 8,189 8,213 8,393
(28.2) (29.2) (25.6) (24.9)Russia 1,666 1,631 2,589 2,369
(6.5) (5.8) (8.1) (7.0)Italy 1,941 2,159 2,407 2,647
(7.6) (7.7) (7.5) (7.9)Austria 2,469 2,503 2,366 2,488
(9.6) (8.9) (7.4) (7.4)Japan 988 1,148 1,701 1,555
(3.8) (4.1) (5.3) (4.6)France 1,248 1,313 1,401 1,579
(4.9) (4.7) (4.4) (4.7)US 993 968 1,224 1,424
(3.9) (3.5) (3.8) (4.2)UK 876 853 1,017 993
(3.4) (3.0) (3.2) (2.9)Chinaa 435 610 939 1,334
(1.7) (2.2) (2.9) (4.0)Belgium 637 728 721 767
(2.5) (2.6) (2.2) (2.3)Total (incl others) 25,706 28,008 32,080 33,682
a Excluding Hong Kong
Source: CSO, Statistical Yearbook; Monthly Bulletin.

Hungary 67
© The Economist Intelligence Unit Limited 2002 EIU Country Profile 2002
Reference table 21
Balance of payments, IMF series(US$ m)
1997 1998 1999 2000 2001
Goods: exports fob 19,640 20,747 21,848 25,366 28,050
Goods: imports fob –21,602 –23,101 –24,037 –27,472 –30,071
Trade balance –1,962 –2,354 –2,189 –2,106 –2,021
Services: credit 5,733 5,921 5,649 6,252 7,702
Services: debit –3,465 –4,141 –4,263 –4,476 –5,545
Income: credit 1,382 1,111 775 942 1,113
Income: debit –2,808 –2,990 –2,417 –2,516 –2,600
Net transfers 138 148 339 410 246
Current-account balance –982 –2,304 –2,106 –1,494 –1,104
Direct investment abroad –433 –478 –252 –532 –330
Direct investment in Hungary 2,167 2,037 1,977 1,692 2,432
Portfolio investment assets –134 –93 –75 –316 –151
Portfolio investment liabilities –914 1,925 2,065 –217 1,578
Financial derivatives assets 12 185 852 753 584
Financial derivatives liabilities –4 –38 –899 –660 –456
Other investment assets –584 –507 –1,170 –906 –3,443
Other investment liabilities 549 –13 2,197 2,536 450
Financial-account balance 658 3,017 4,693 2,357 664
Capital-account balance 117 189 29 269 322
Net errors & omissions 32 49 –282 –79 65
Overall balance –175 951 2,335 1,052 –53
Financing (– indicates inflow)
Movement of reserves 175 –790 –2,335 –1,054 53
Use of IMF credit & loans 0 –160 0 0 0
Exceptional financing 0 0 0 0 0
Note. Current-account data for 2001 are from the National Bank of Hungary, Monthly Report.Monthly data are converted from euro to US dollars using an average monthly exchange rate, thensummed to obtain the annual figures. Capital-account data for 2001 use annual figures from theNBH, which are converted from euro to US dollars using the average yearly exchange rate.
Source: IMF, International Financial Statistics.

68 Hungary
EIU Country Profile 2002 © The Economist Intelligence Unit Limited 2002
Reference table 22
External debt, World Bank estimates(US$ m unless otherwise indicated; debt stocks as at year-end)
1995 1996 1997 1998 1999
Public medium- & long-term 23,914 18,673 15,064 15,741 16,064
Private medium- & long-term 4,088 5,005 5,915 7,788 9,436
Total medium- & long-term debt 28,003 23,678 20,979 23,530 25,499 Official creditors 4,457 3,503 3,123 2,291 2,241 Bilateral 947 736 661 787 685 Multilateral 3,510 2,767 2,461 1,504 1,555 Private creditors 23,545 20,176 17,856 21,239 23,259
Short-term debt 3,203 3,359 3,357 4,780 3,543 of which: interest arrears 0 0 0 0 0
Use of IMF credit 385 171 160 0 0
Total external debt 31,590 27,208 24,496 28,310 29,042
Principal repayments 4,938 6,573 6,024 5,811 6,081
Interest payments 2,109 1,815 1,685 1,494 1,446 of which: short-term debt 174 180 161 195 145
Total debt service paid 7,046 8,389 7,708 7,305 7,528
Ratios (%)Total external debt/GNP 73.7 62.2 55.3 62.7 62.0Debt-service ratio, paida 37.4 39.2 28.8 26.3 26.6Short-term debt/total external debt 10.1 12.3 13.7 16.9 12.2Concessional long-term debt/total long-term debt 1.3 1.7 1.8 1.9 1.7Variable interest long-term debt/total long-term debt 39.4 40.5 45.1 48.5 51.6
Note. Long-term debt is defined as having original maturity of more than one year.a Debt service as a percentage of earnings from exports of goods and services.
Source: World Bank, Global Development Finance.
Reference table 23
Foreign reserves(US$ m unless otherwise indicated; end-period)
1997 1998 1999 2000 2001
Foreign exchange 8,332 9,239 10,707 10,915 10,302
SDRs – 1 4 12 21
Reserve position in the IMF 75.7 79.0 243.0 263.0 405.0
Total reserves excl gold 8,408 9,319 10,954 11,190 10,727
Golda 28.50 28.50 28.50 28.50 28.50
Memorandum itemsGoldb 37 29 29 29 28Gold (m fine troy oz) 0.101 0.101 0.101 0.101 0.101
a Valued at 75% of the fourth-quarter London price. b National valuation.
Source: IMF, International Financial Statistics.

Hungary 69
© The Economist Intelligence Unit Limited 2002 EIU Country Profile 2002
Reference table 24
Exchange rates(Ft per unit of currency unless otherwise indicated; annual averages)
1997 1998 1999 2000 2001
US$ 186.75 214.45 237.31 282.27 286.54
DM 107.68 122.15 129.25 132.96 131.24
FFr 31.99 36.44 38.54 39.64 39.13
£ 305.96 355.37 383.85 426.66 412.57
Ecua 210.93 240.98 252.80 260.04 256.68
¥ (100) 154.69 164.64 209.59 261.93 236.23
a Euro from January 1st 2000.
Source: NBH, Monthly Report.
Editors: Matthew Sherwood (editor); Joan Hoey (consulting editor)Editorial closing date: March 19th 2002
All queries: Tel: (44.20) 7830 1007 E-mail: [email protected]