humor and inclination to laugh: emotional reactions to stimuli of different divergence from a range...
TRANSCRIPT
H U M O R A N D I N C L I N A T I O N T O LAUGH: E M O T I O N A L R E A C T I O N S T O S T I M U L I
O F EXPECTANCY O F D I F F E R E N T D I V E R G E N C E F R O M A RANGE
GORAN NERHARDT
Psychological Laboratories, University of Stockholm, Sweden
NERHARDT, G. Humor and inclination to laugh: emotional reactions to stimuli of different divergence from a range of expectancy. Scand. J. Psychol., 1970, 11, 185-195. -An experiment was conducted to test the general hypothesis, derived from the incongruity theory of humor, that the experience of humor or of the inclination to laugh is a function of the divergence of a perceived state of affairs from the expected state. The hypothesis was tested with weights as stimuli in two designs. In the first the range of expectancy was defined in terms of the proportion of “heavy” ratings in the subject group at various initial weights. In the second the range of expectancy among subjects was assumed to move with experience with various ranges of weights. The results of both designs supported the hypothesis.
Most experiments on laughter and humor have been devoted to the explication of relation- ships between personality variables and the appreciation of different kinds of humorous material (for a bibliography of experiments see Treadwell, 1967).
How then is it possible to pick out experimental material which has the character of being humorous? Since an infinite range of themes is represented in material which is generally agreed to be humorous, the theme cannot be the chief ground for selection. Indeed, most theories of humor recognize the probability of a structural property being responsible for the stimulus being humorous at all (for a treatment of theories see Piddington, 1963). This property is usually referred to as incongruity. Briefly, the incongruity theory says that the bringing together of incongruous elements in perception or ideation is what elicits the experience of humor or an inclination to laugh. Surprisingly few adequate experiments have been conducted to test hypotheses derived from this theory.
First, the range of incongruity should not be restricted in the stimulus material. If the incongruity theory holds, it is obvious that by using only humor material in experiments on humor, one usually restricts the range of incongruity in the stimulus material. Flugel (1954) remarks that in view of the cognitive demands which the perception of incongruity obviously poses upon the individual, it is curious that the exact relationship between meas- ures of intelligence and sense of humor has still to be established. The explanation may be that the incongruity in experimental material unanimously defined as humorous probably lies well above the threshold of perception of incongruity in a normal and fairly homogeneous population. Consequently it can not be expected to differentiate between individuals with different IQ’s. However, experiments on heterogeneous groups, e.g. on children of different age (Zigler, Levine & Gould, 1967), suggest that the appreciation of humor increases with intelligence-and emotional maturity-up to a certain point and then decreases.
It should be noted that the perception of incongruity may involve not only intellectual
185 Scand. 1. PJychol., Vol. XI, 1970
186 GORAN NERHARDT
capacity but also an awareness of norms and values. Incongruity may occur, for instance, between what a person does and what society on moral grounds expects him to do.
A second demand to be met in testing the incongruity theory is that effects by structure be distinguished from effects by theme dimensions. The latter effects must be controlled. In this context it should be remembered that many apparently nonsymbolic stimuli, e.g. music, tend to take on theme properties (Mull, 1949). Bergson, in his theory of the comic ( I~OO), held that to be comic, stimuli had to be either human beings or objects reminiscent of something human.
The concept of incongruity as an explanatory principle for humor has been critisized on the ground that it is so wide as to cover practically any conceivable stimulus situation. It therefore seems relevant to test whether variation in incongruity alone, even with a very simple form of incongruity, is capable of eliciting the experience of humor or an inclination to laugh.
The simple instances of incongruity employed in the present study were situations where the subjects, when lifting weights, got weights that deviated by different amounts from what they expected.
As a measure of the experience of humor or of the inclination to laugh was taken the fre- quency of observed laughter in the experimental groups.
It was hypothesized that the frequency of laughter is a function of the discrepancy between expectations and actual states, a higher frequency being connected with greater discrepancy up to a certain point.
The hypothesis was tested in two designs. In the first the expectancy range was defined as follows. A weight was selected by interpolation from the proportions of “heavy” ratings at the experimental initial weights. The weight was chosen so as to give 0.5 “heavy” ratings. A small range around this theoretical weight was defined as the expectancy range.
It was predicted that the frequency of laughter at the initial weights would be higher with growing distance from this expectancy range.
In the second design the range of expectancy was assumed to move with experience. I t was predicted that the farther from a preceding range of experience the last weight was located the greater would be the distance of the weight to the expectancy range and the higher the frequency of laughter associated with it.
METHOD Pilot study
It was desirable, before the main experiment, approximately to establish the range of expectancy.
Apparatus. The apparatus (Fig. I) consisted of a box with the opening turned away from the subjects. The weights in the box were small plastic buckets loaded with lead. Fastened to the weights were strings with handles which lay on top of the box. The weights could not be seen by the subjects when they entered the room and sat down before the experimenter.
Subjects andprocedure. The subjects were students of education at the university of Uppsala. One subject at a time entered the experimental situation, was told to sit down, close his eyes, reach out his hand and wait for the weight. The experimenter handed him the handle from which hung the string with the weight and asked him to say whether the thought the weight was light or heavy (heavy or light). The subject rated one weight only. Ratings for weights of
Scand. 1. PJychol., Vol. 11,1970
HUMOR AND INCLINATION TO LAUGH 187
100, zoo, 300, I 100, I 900, z 500, and 3 ooo g were received from respectively 7, 11, 10, 10, 20, 19, and 5 male subjects and from 19, 39,40, 40, 30, 31, and 20 female subjects.
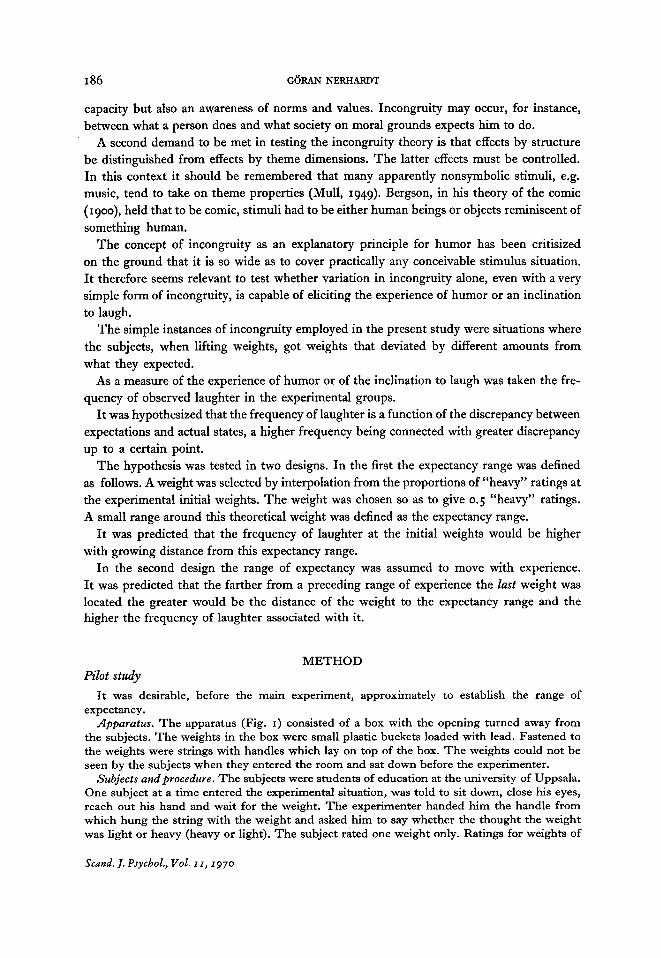
Results. The results are shown in Fig. 2, the proportion of “heavy” ratings within each group of subjects being plotted against the weights. The proportions for IOO and 200 g have been pooled to one proportion at 167 g because of low frequency of observations at the former weight.
1.0
0.0 300 1100 1900 2500 3000
167 Welghl in grams
Fig. I Fig. 2
FIG. I. Apparatus for the ratings of weight. FIG. 2. Diagram for men and women showing the proportion of “heavy” among the judgments heavy and light for different weights. A curve has been fitted to the proportions for women (see text). 0, men; 0, women.
The values for women could be fitted with the Gompertz curve, p=1 .o2-0 .013~~~* (Lewis, 1948, pp. 80-88). There were too few men to allow any conclusions as to the ap- pearance of the curve based on their data. Clearly, however, the curve must be considered to lie as a whole at higher x-values than the curve based on the values for women.
Main experiment Apparatus. The apparatus and other experimental arrangements were the same as in the
pilot study. Subjects and procedure. Subjects were students of psychology at the university of Stockholm.
When the subject entered the experimental situation he was told to close his eyes and wait for the weight. He was asked to tell, on receiving the weight, whether he judged it to be light or heavy (heavy or light). He was further asked, if classifying the weight as light, to tell whether he would call it very light, quite light or actually neither light nor heavy. Correspondingly if he found the weight heavy, he was required to tell whether he found it very heavy, quite heavy or actually neither heavy nor light. It was observed at each weight whether the subject laughed or not.
The subject was never told the ultimate purpose of the study and he was asked not to talk with his fellow students about the design of the trials in the “weight experiment”, only that he had been lifting weights. Stimulus material and experimental design. The stimulus weights were selected on the basis
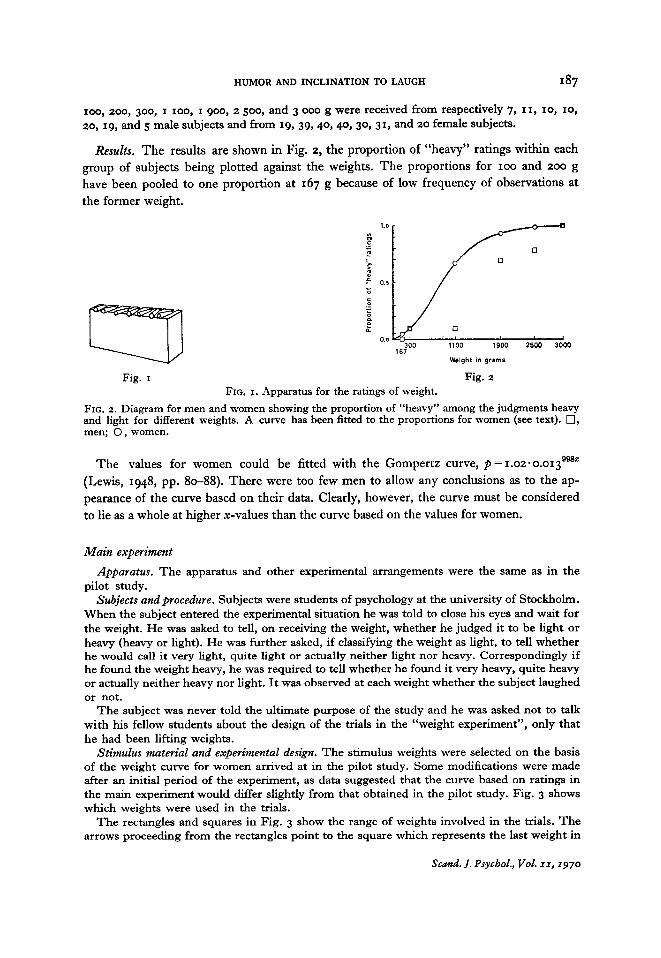
of the weight curve for women arrived at in the pilot study. Some modifications were made after an initial period of the experiment, as data suggested that the curve based on ratings in the main experiment would differ slightly from that obtained in the pilot study. Fig. 3 shows which weights were used in the trials.
The rectangles and squares in Fig. 3 show the range of weights involved in the trials. The arrows proceeding from the rectangles point to the square which represents the last weight in
Scand. 1. Psychol., Vol. XI, 1970
188 GORAN NERHARDT
that kind of trial. The subjects went through the ranges of weights indicated by the rectangles one, two, three, four of five times, the number of times being equally distributed in the dif- ferent experimental conditions. He was then given the last weight. No subject was used for more than one trial.
Grams 225229 360 455 540 620 700 755 850 940 1030 1135 1250 1400 1600 1930
FIG. 3. The trials in the main experiment. See the text for explanation.
The first weight given to the subjects is indicated by a number under it in the rectangle, the number itself denoting how many subjects participated in trials at that particular range. If the first weight was not always the same in trials with the same range of weights, the num- bers are accompanied by a and b. The first weight was followed by the rest in that range, indicated by circles, in individual random order for each subject.
The column of numbers on the right in the figure identifies the trials in the series. An example may help to clarify the figure. The trial carried out as number 13 in the series
was performed by 21 subjects, 10 of whom had I 070 g as the first weight, while the other 11 had z 700 g. The five weights making up the range of experience were 740, 890, I 070, I 570, and z 700 g. After the subjects had gone through this range one, two, three, four or five times they were finally given the 70 g weight. They judged the weights to belong to one of the six verbal categories given in the instruction.
Ratings of laughter. The experimenter’s ratings of laughter by a subject were used as a measure of the subject’s experiencing of humor or an inclination to laugh. The ratings were made each time the subject got a weight in his hand, the experimenter observing whether the subject laughed or smiled at any time during the interval from the moment he got the weight until he handed it back.
So as to be able to estimate the reliability of the experimenter’s ratings and analyse syste- matic errors, TV scenes were taken of 50 subjects during ratings in the experimental setting. In order to avoid influencing the subjects by filming, this was performed without their knowl- edge.
The scenes were played back to four judges-students of psychology-who estimated at each scene whether the subject laughed or not.
RESULTS
Ratings of weight in verbal categories Frequencies from the verbal categories were combined to yield cumulative frequencies
of lightness and heaviness. The scheme below shows how this was done and also gives the designation of the categories. This designation is used in Table I and Figs. 4 and 5 .
Sca.nd. 1. Psychol., Vol. XI, 1970
HUMOR AND INCLINATION TO LAUGH
Very light Quite light Light but somewhere in between light and heavy Ll
H, Very heavy [ H2 { Quite heavy HI Heavy but somewhere in between heavy and light
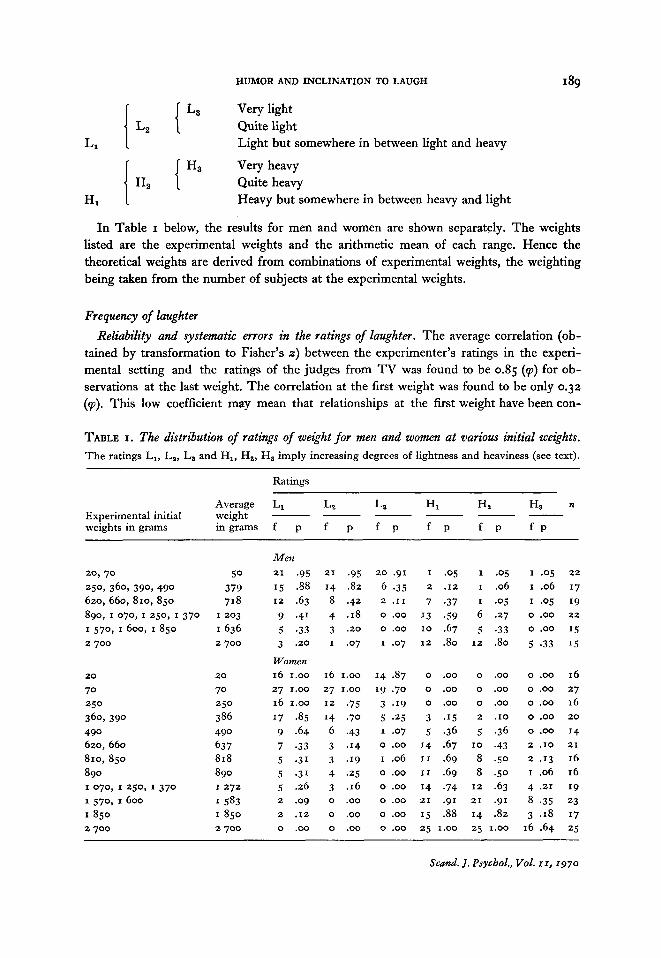
In Table I below, the results for men and women are shown separately. The weights listed are the experimental weights and the arithmetic mean of each range. Hence the theoretical weights are derived from combinations of experimental weights, the weighting being taken from the number of subjects at the experimental weights.
Frequency of laughter Reliability and systematic errors in the ratings of laughter. The average correlation (ob-
tained by transformation to Fisher's z) between the experimenter's ratings in the experi- mental setting and the ratings of the judges from TV was found to be 0.85 (pl) for ob- servations at the last weight. The correlation at the first weight was found to be only 0.32 (pl). This low coefficient may mean that relationships at the first weight have been con-
TABLE I . The distribution of ratings of weight for men and women at various initial weights. The ratings L,, L,, L, and H,, H,, H, imply increasing degrees of lightness and heaviness (see text).
Ratings
Average L, L, La H I H, H, 11
Experimental initial weight - - - - - - weights in grams ingrams f p f p f p f p f p f p
20970
620, 660, 810, 850 890, I 070, I 250, I 370
250, 360, 390,490
1570, 1600, I850 2 700
20
70 250 360, 390 490 620, 660 810,850 890 I 070, I 250, I 370
I 8 5 0 2 700
1570, I600
50 379
I 203 I 636 2 700
718
20
70 250 386 490 637 818 890 I 272 I583 I 8 5 0 2 700
Men 21 .95 15 .88 12 .63 9 .4' 5 .33 3 .20
Women 16 1.00
27 1.00
16 1.00 17 .85 9 .64 7 .33 5 .31 5 .31 5 2 6 2 .09 2 .I2 0 .oo
21 .95 14 .82 8 .42 4 .I8 3 .20
I .07
16 1.00
27 1.00
1 2 .75 '4 a70 6 .43 3 -14 3 .I9 4 .25 3 .16 0 .oo 0 .oo 0 .oo
20 .91 6 .35 2 .I1
0 .oo 0 .oo I .07
14 3 7 19 7 0
3 .I9 5 .25 I .07
I .06 0 .oo
0 .oo 0 .oo 0 .oo 0 .oo 0 .oo
I
2
7 13 I 0
12
0
0
0
3 5
14 I 1
I1
14 2 1
15 25
a 0 5
.37
.59
.67
.so
.I2
.oo
.oo
.oo
.I5
.36
.67
.69
.69
.74
.91
.88 I .oo
I
I
I
6 5
I 2
0
0
0
2
5
8 8
I0
12
21
I4 25
-05 .06 a05 a27 .33 .so
.oo
.oo
.oo
.I0
.36
.43
.50
.50
.9I
.63
.82 I .oo
I ,05 22
I .06 17 I .05 19
o .oo 15 5 .33 15
0 .oo 22
o .oo 16 o .oo 27 o .oo 16
o .oo 14
z .13 16 I .06 16 4 .21 19 8 .35 23 3 .IS 17
16 .64 25
0 .oo 20
2 .I0 21
Scand. I. PsychoX, VoL XI, 1970
190 GORAh’ NERHARDT
ceded which might otherwise have shown up in the results. However, the kind of estima- tion probably gives a low estimate of reliability.
In the same manner the reliability of the ratings at all weights except the first and the last one was estimated to 0.66 (v). At these middle weights, however, the same weight could appear more than once in a trial. As an independent measure then had to be chosen not the frequency of laughter at a specific weight but the freguency of persons who laughed some time at the weight. We will refer to such persons as laughers. Because the basis for com- parisons of frequencies at the middle weights was the frequency of laughers, the coefficient of reliability is not directly applicable.
The experimenter’s ratings in the experimental situation display a tendency to judge a person as not laughing or smiling as compared to the judges’ (and in fact even the experi- menter’s) ratings of the same behavior from TV film. A systematic analysis of the variation in this tendency showed that it could not have added to the differences in frequencies in the results obtained.
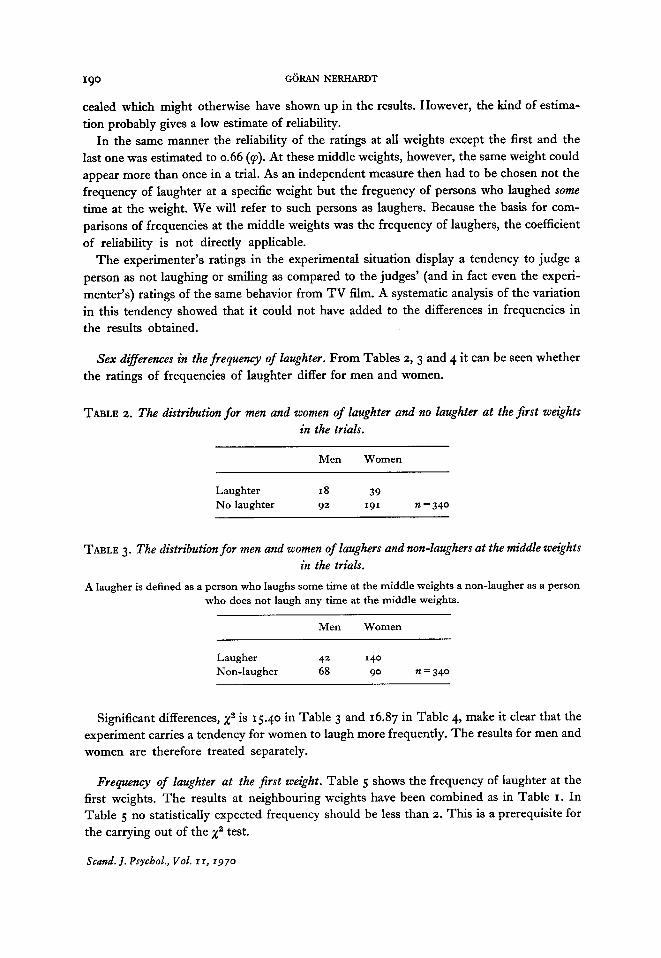
Sex differences in the frequency of laughter. From Tables 2, 3 and 4 it can be seen whether the ratings of frequencies of laughter differ for men and women.
TABLE 2. The distribution for men and women of laughter and no laughter at the first weights in the trials.
Men Women
Laughter I8 39 No laughter 92 191 n = 340
TABLE 3 . The distribution for men and women of laughers and non-laughers at the middle weights in the trials.
A laugher is defined as a person who laughs some time at the middle weights a non-laugher as a person who does not laugh any time at the middle weights.
Men Women
Laugher 42 140
Non-laugher 68 90 n = 340
Significant differences, x2 is 15.40 in Table 3 and 16.87 in Table 4, make it clear that the experiment carries a tendency for women to laugh more frequently. The results for men and women are therefore treated separately.
Frequency of laughter at the first weight. Table 5 shows the frequency of laughter at the first weights. The results at neighbouring weights have been combined as in Table I . In Table 5 no statistically expected frequency should be less than 2. This is a prerequisite for the carrying out of the x2 test.
Scad. 1. Psychol., Vol. XI, 1970
HUMOR AND INCLINATION TO LAUGH 191
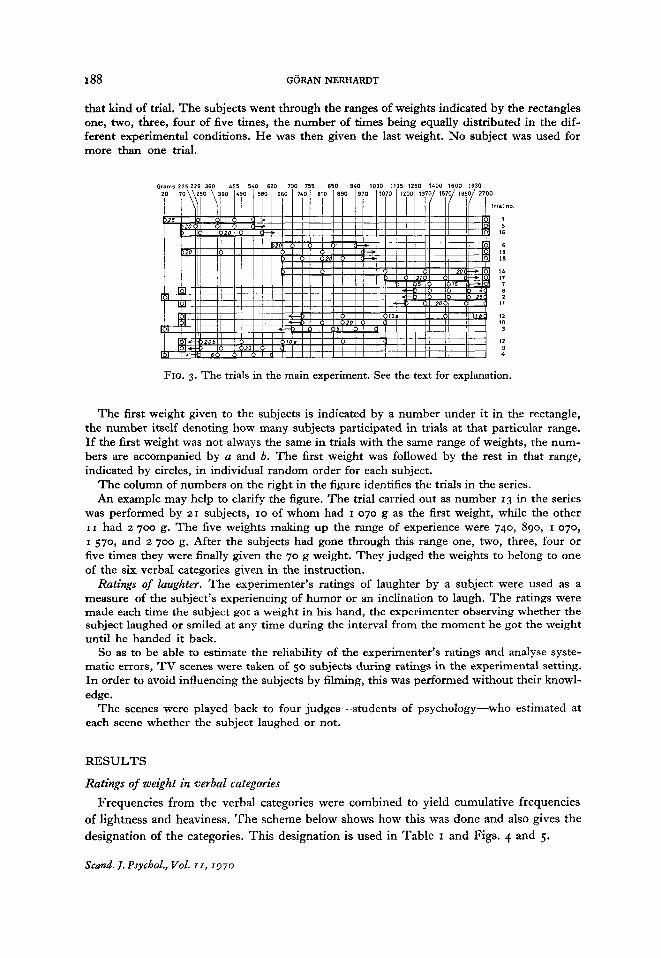
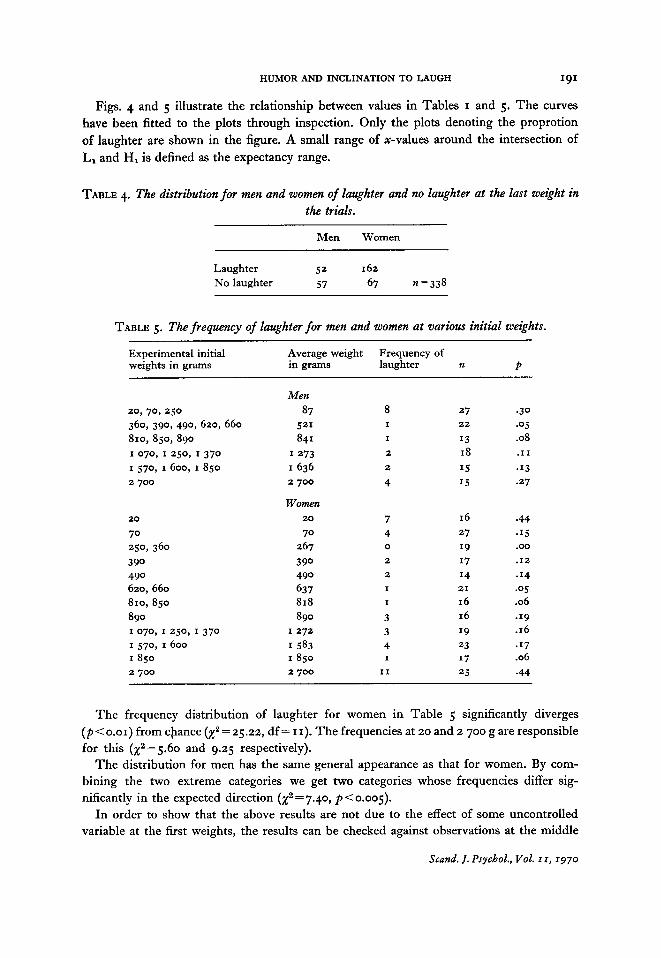
Figs. 4 and 5 illustrate the relationship between values in Tables I and 5. The curves have been fitted to the plots through inspection. Only the plots denoting the proprotion of laughter are shown in the figure. A small range of x-values around the intersection of L, and H, is defined as the expectancy range.
TABLE 4. The distribution for men and women of laughter and no laughter at the last weight in the trials.
Men Women
Laughter 52 I 62 No laughter 57 67 n=338
TABLE 5. The frequency of laughter for men and women at various initial weights.
Experimental initial Average weight Frequency of weights in grams in grams laughter n P
20
70
3 90 490 620, 660 810,850 890 I 070, I 250,
I 8 5 0 2 700
250, 360
1570, I600 I370
20
70 267 390 490 637 818 890
I 272 1583 I 8 5 0 2 700
7 4 0
2 2
I
I
3 3 4 I
I 1
16 27 19 17 14 21
16 16 I9 23 17 25
.44
.I5
.oo
.I2
.I4 a 0 5
.06
.I9
.16
.I7
.06
.44
The frequency distribution of laughter for women in Table 5 significantly diverges ( p < 0.01) from chance (xz = 25.22, df = I I). The frequencies at 20 and 2 700 g are responsible for this (x2 = 5.60 and 9.25 respectively).
The distribution for men has the same general appearance as that for women. By com- bining the two extreme categories we get two categories whose frequencies differ sig- nificantly in the expected direction (xz = 7.40, p < 0.005).
In order to show that the above results are not due to the effect of some uncontrolled variable at the first weights, the results can be checked against observations at the middle
Scand. J . Psychol., Vol. XI, 1970
192 GORAN NERHARDT
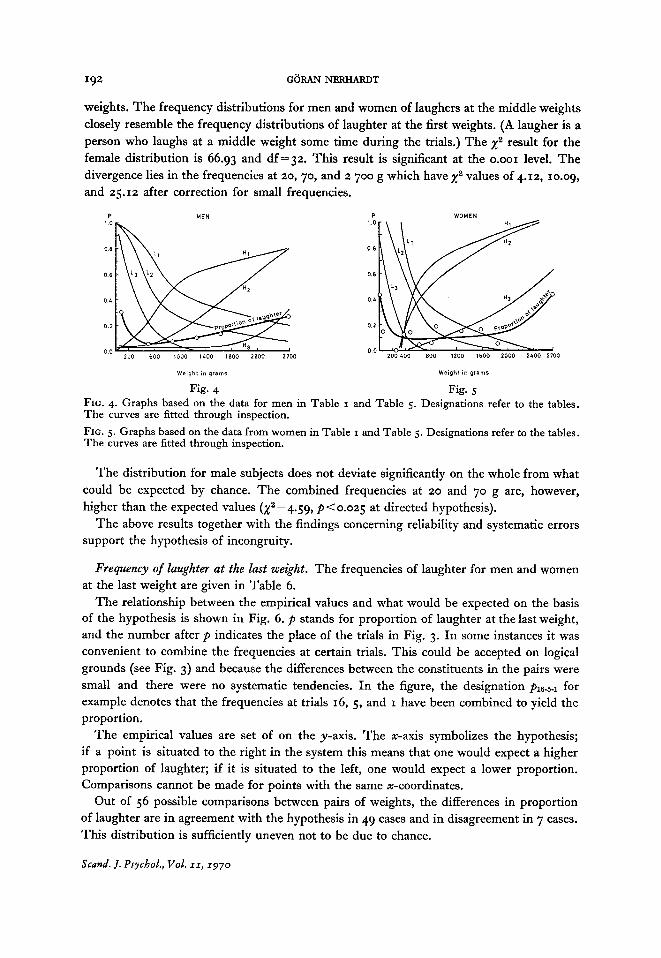
weights. The frequency distributions for men and women of laughers at the middle weights closely resemble the frequency distributions of laughter at the first weights. (A laugher is a person who laughs at a middle weight some time during the trials.) The x2 result for the female distribution is 66.93 and df=32. This result is significant at the 0.001 level. The divergence lies in the frequencies at 20, 70, and 2 700 g which have x2 values of 4.12, 10.09, and 25.12 after correction for small frequencies.
P MEN I0
0 8
0 6
0 4
0 2
200 600 1000 1400 I800 2200 2700 0 0
P WOMEN 1.0
0.8
0.6
0.4
0.2
2 0 0 4 0 0 800 1200 1600 2000 2400 2700 0.0
Weight an grams Weigh1 in grams
Fig. 4 Fig. 5 FIG. 4. Graphs based on the data for men in Table I and Table 5 . Designations refer to the tables. The curves are fitted through inspection. FIG. 5. Graphs based on the data from women in Table I and Table 5. Designations refer to the tables. The curves are fitted through inspection.
The distribution for male subjects does not deviate significantly on the whole from what could be expected by chance. The combined frequencies at 20 and 70 g are, however, higher than the expected values (x2 '4.59, p <0.025 at directed hypothesis).
The above results together with the findings concerning reliability and systematic errors support the hypothesis of incongruity.
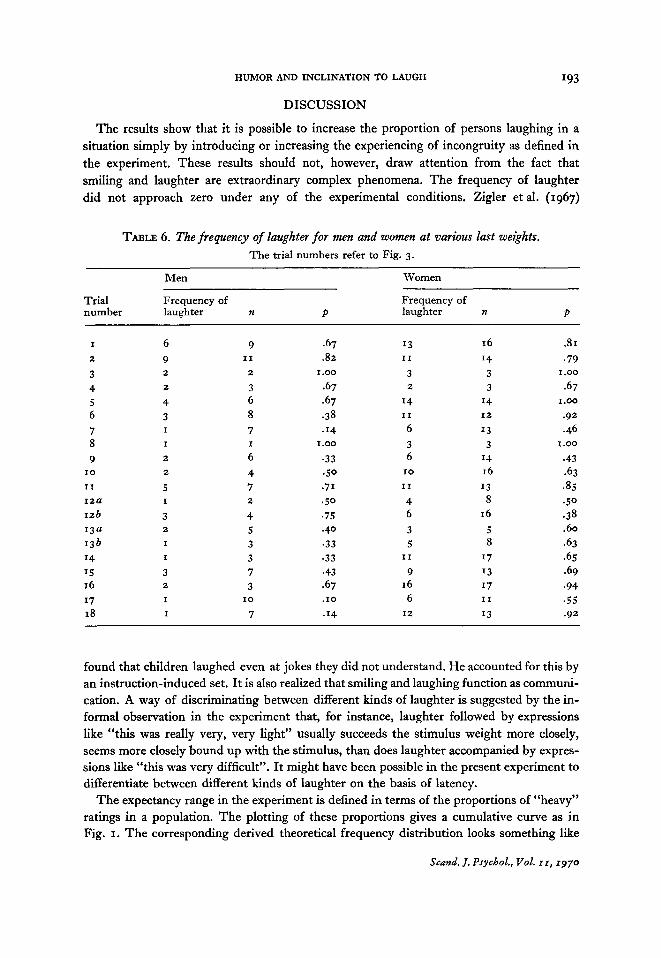
Frequency of laughter at the last weight. The frequencies of laughter for men and women at the last weight are given in Table 6.
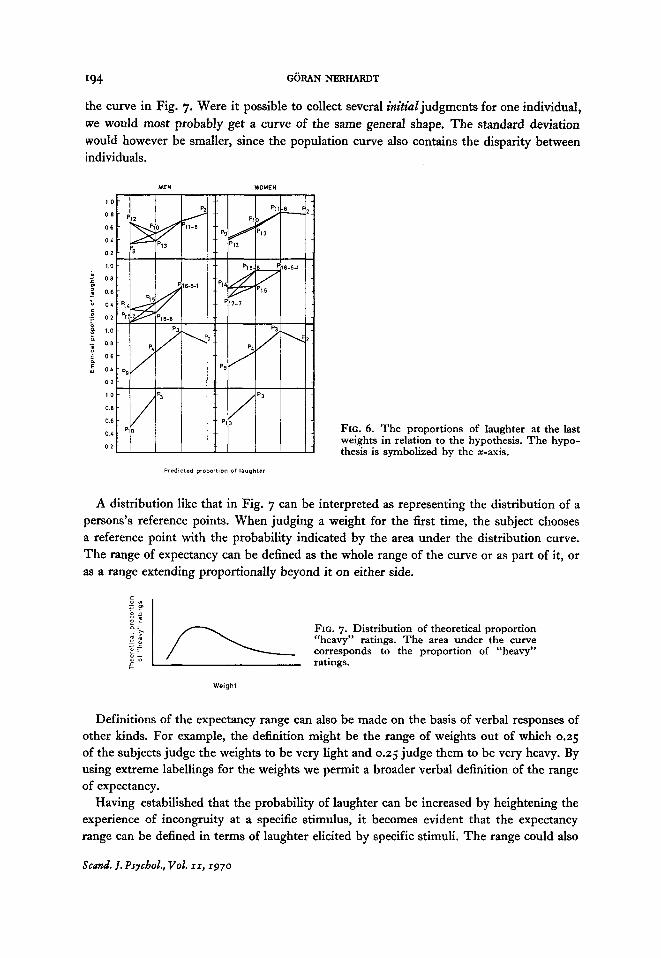
The relationship between the empirical values and what would be expected on the basis of the hypothesis is shown in Fig. 6. p stands for proportion of laughter at the last weight, and the number after p indicates the place of the trials in Fig. 3. In some instances it was convenient to combine the frequencies at certain trials. This could be accepted on logical grounds (see Fig. 3) and because the differences between the constituents in the pairs were small and there were no systematic tendencies. In the figure, the designation plss.l for example denotes that the frequencies at trials 16, 5 , and I have been combined to yield the proportion.
The empirical values are set of on the y-axis. The x-axis symbolizes the hypothesis; if a point is situated to the right in the system this means that one would expect a higher proportion of laughter; if it is situated to the left, one would expect a lower proportion. Comparisons cannot be made for points with the same x-coordinates.
Out of 56 possible comparisons between pairs of weights, the differences in proportion of laughter are in agreement with the hypothesis in 49 cases and in disagreement in 7 cases. This distribution is sufficiently uneven not to be due to chance.
Scand. J. Psychol., Vol. 11, I970
HUMOR AND INCLINATION TO LAUGH I93
DISCUSSION
The results show that it is possible to increase the proportion of persons laughing in a situation simply by introducing or increasing the experiencing of incongruity as defined in the experiment. These results should not, however, draw attention from the fact that smiling and laughter are extraordinary complex phenomena. The frequency of laughter did not approach zero under any of the experimental conditions. Zigler et al. (1967)
TABLE 6. The frequency of laughter for men and women at various last weights. The trial numbers refer to Fig. 3.
Men Women
Trial Frequency of Frequency of number laughter n P laughter n P
I 6 9 .67 I3 16 .8 I
2 9 I1 .82 I 1 14 .79 3 2 2 I .oo 3 3 I .oo 4 2 3 .67 2 3 .67 5 4 6 .67 14 I4 I .oo 6 3 8 .38 11 I 2 -92
7 I 7 -14 6 1 3 .46 8 I I I .oo 3 3 I .oo 9 2 6 .33 6 1 1 .43
I 0 2 4 .50 I 0 16 .63 I1 5 7 *71 I 1 13 . 8 j n a I 2 .SO 4 8 .so n b 3 4 .75 6 16 .38 13a 2 5 .40 3 5 .60 I 3 b I 3 .33 5 8 .63 14 I 3 .33 1 1 17 .65 15 3 7 .43 9 13 .69 16 2 3 .67 16 17 .94 17 I I 0 .I0 6 I 1 -55 18 I 7 . I4 I 2 13 .92
found that children laughed even at jokes they did not understand. He accounted for this by an instruction-induced set. It is also realized that smiling and laughing function as communi- cation. A way of discriminating between different kinds of laughter is suggested by the in- formal observation in the experiment that, for instance, laughter followed by expressions like “this was really very, very light” usually succeeds the stimulus weight more closely, seems more closely bound up with the stimulus, than does laughter accompanied by expres- sions like (‘this was very difficult”. It might have been possible in the present experiment to differentiate between different kinds of laughter on the basis of latency.
The expectancy range in the experiment is defined in terms of the proportions of “heavy” ratings in a population. The plotting of these proportions gives a cumulative curve as in Fig. I. The corresponding derived theoretical frequency distribution looks something like
Scand. 1. Psychol., VoL I I, 1970
[94 GORAN NERHARDT
the curve in Fig. 7. Were it possible to collect several initial judgments for one individual, we would most probably get a curve of the same general shape. The standard deviation would however be smaller, since the population curve also contains the disparity between individuals.
MEN WOMEN
FIG. 6. The proportions of laughter at the last weights in relation to the hypothesis. The hypo- thesis is symbolized by the x-axis.
Predicted proportion o f laughter
A distribution like that in Fig. 7 can be interpreted as representing the distribution of a persons’s reference points. When judging a weight for the first time, the subject chooses a reference point with the probability indicated by the area under the distribution curve. The range of expectancy can be defined as the whole range of the curve or as part of it, or as a range extending proportionally beyond it on either side.
_ _ FIG. 7. Distribution of theoretical proportion “heavy” ratings. The area under the curve
0 - r : corresponds to the proportion of “heavy” ratings.
- L
Y O
c
Weight
Definitions of the expectancy range can also be made on the basis of verbal responses of other kinds. For example, the definition might be the range of weights out of which 0.25
of the subjects judge the weights to be very light and 0.25 judge them to be very heavy. By using extreme labellings for the weights we permit a broader verbal definition of the range of expectancy.
Having estabilished that the probability of laughter can be increased by heightening the experience of incongruity at a specific stimulus, it becomes evident that the expectancy range can be defined in terms of laughter elicited by specific stimuli. The range could also
Scand. 1, Psychol., Vo’o2. 11, 1970
HUMOR AND INCLINATION TO LAUGH I95
be defined on the basis of more general observations of emotional reactions at stimuli elements. The advantage of defining the range of expectancy in terms of emotional reactions rather than in terms of verbal labellings lies in the indirectness of the former. Speech is more adaptaed to the function of “lying” than are emotional reactions.
In the psychology of personality, to which belongs most of what has been done in the psychology of humor, extensive work has been devoted to the description of personality traits and differences without due regard to what is to be considered normal in a population. One way of really achieving a definition of the range of expectancy for a population in some subject area is suggested by the method of observing or otherwise registering emotional reactions following predetermined variation in a stimulus constellation.
This study was made possible through a grant from the University of Stockholm. I wish to thank especially Dr Gunnar Goude and D r Hannes Eisler at the Psychological
Laboratories, University of Stockholm, for advice and support.
REFERENCES
BERGSON, H. (1900). Le rire. Revue de Park. (Laughter. [I~II]. New York McMillan.)
FLUGEL, J. C. (1954). Humor and laughter. In G. Lindzey (Ed,), Handbook of socialpsycho- logy. Cambridge, Mass.: Addison-Wesley,
LEWIS, D. (1948). Quantitatiwe methods inpsycho-
Mull, H. K. (1949). A study of humor in music.
VOl. 11, pp. 709-734.
logy. Iowa City, Iowa: Lewis.
A m . J. Psychol., 62 , 560-566.
PIDDINGTON, R. (1963). Thepsychology of laughter: A study in social adaptation. NYC: Gamut Press.
TREADWELL, Y. (1967). Bibliography of empirical studies of wit and humor. Psychol. Rep., 20, 1079-1083.
ZIGLER, E., LEVINE, J. & GOULD, L. (1967). Cognitive challenge as a factor in children’s humor appreciation. J. Personality SOC. Psy- chol., 6 , 332-336.
S d . I. PsycboX, Vol. XI, 1970