human occupation of northern india spans the toba super
TRANSCRIPT

University of Wollongong University of Wollongong
Research Online Research Online
Faculty of Science, Medicine and Health - Papers: Part B Faculty of Science, Medicine and Health
1-1-2020
Human occupation of northern India spans the Toba super-Human occupation of northern India spans the Toba super-
eruption ~74,000 years ago eruption ~74,000 years ago
Christopher J. Clarkson University of Wollongong
Clair Harris
Bo Li University of Wollongong, [email protected]
Christina Neudorf
Richard G. Roberts University of Wollongong, [email protected]
See next page for additional authors
Follow this and additional works at: https://ro.uow.edu.au/smhpapers1
Publication Details Citation Publication Details Citation Clarkson, C. J., Harris, C., Li, B., Neudorf, C., Roberts, R. G., Lane, C., Norman, K., Pal, J., Jones, S., Shipton, C., Koshy, J., Gupta, M., Mishra, D., Dubey, A., Boivin, N., & Petraglia, M. (2020). Human occupation of northern India spans the Toba super-eruption ~74,000 years ago. Faculty of Science, Medicine and Health - Papers: Part B. Retrieved from https://ro.uow.edu.au/smhpapers1/1210
Research Online is the open access institutional repository for the University of Wollongong. For further information contact the UOW Library: [email protected]

Human occupation of northern India spans the Toba super-eruption ~74,000 Human occupation of northern India spans the Toba super-eruption ~74,000 years ago years ago
Abstract Abstract © 2020, Crown. India is located at a critical geographic crossroads for understanding the dispersal of Homo sapiens out of Africa and into Asia and Oceania. Here we report evidence for long-term human occupation, spanning the last ~80 thousand years, at the site of Dhaba in the Middle Son River Valley of Central India. An unchanging stone tool industry is found at Dhaba spanning the Toba eruption of ~74 ka (i.e., the Youngest Toba Tuff, YTT) bracketed between ages of 79.6 ± 3.2 and 65.2 ± 3.1 ka, with the introduction of microlithic technology ~48 ka. The lithic industry from Dhaba strongly resembles stone tool assemblages from the African Middle Stone Age (MSA) and Arabia, and the earliest artefacts from Australia, suggesting that it is likely the product of Homo sapiens as they dispersed eastward out of Africa.
Publication Details Publication Details Clarkson, C., Harris, C., Li, B., Neudorf, C., Roberts, R., Lane, C., Norman, K., Pal, J., Jones, S., Shipton, C., Koshy, J., Gupta, M., Mishra, D., Dubey, A., Boivin, N. & Petraglia, M. (2020). Human occupation of northern India spans the Toba super-eruption ~74,000 years ago. Nature Communications, 11 (1),
Authors Authors Christopher J. Clarkson, Clair Harris, Bo Li, Christina Neudorf, Richard G. Roberts, Christine Lane, Kasih Norman, Jagannath Pal, Sacha Jones, Ceri Shipton, Jinu Koshy, M Gupta, D Mishra, A Dubey, Nicole Boivin, and Michael Petraglia
This journal article is available at Research Online: https://ro.uow.edu.au/smhpapers1/1210

ARTICLE
Human occupation of northern India spans theToba super-eruption ~74,000 years agoChris Clarkson 1,2,3✉, Clair Harris1, Bo Li2,4, Christina M. Neudorf 5, Richard G. Roberts 2,4,
Christine Lane6, Kasih Norman2, Jagannath Pal7, Sacha Jones 8,9, Ceri Shipton 10, Jinu Koshy11, M.C. Gupta7,
D.P. Mishra7, A.K. Dubey12, Nicole Boivin1,3,13,14 & Michael Petraglia 1,3,13✉
India is located at a critical geographic crossroads for understanding the dispersal of Homo
sapiens out of Africa and into Asia and Oceania. Here we report evidence for long-term
human occupation, spanning the last ~80 thousand years, at the site of Dhaba in the Middle
Son River Valley of Central India. An unchanging stone tool industry is found at Dhaba
spanning the Toba eruption of ~74 ka (i.e., the Youngest Toba Tuff, YTT) bracketed between
ages of 79.6 ± 3.2 and 65.2 ± 3.1 ka, with the introduction of microlithic technology ~48 ka.
The lithic industry from Dhaba strongly resembles stone tool assemblages from the African
Middle Stone Age (MSA) and Arabia, and the earliest artefacts from Australia, suggesting
that it is likely the product of Homo sapiens as they dispersed eastward out of Africa.
https://doi.org/10.1038/s41467-020-14668-4 OPEN
1 School of Social Science, University of Queensland, St Lucia, QLD 4072, Australia. 2 Australian Research Council (ARC) Centre of Excellence for AustralianBiodiversity and Heritage, University of Wollongong, Wollongong, NSW 2522, Australia. 3 Department of Archaeology, Max Planck Institute for the Scienceof Human History, Kahlaische Strasse 10, Jena 07745, Germany. 4 Centre for Archaeological Science, School of Earth, Atmospheric and Life Sciences,University of Wollongong, Wollongong, NSW 2522, Australia. 5 Desert Research Institute, Reno, Nevada 89512, USA. 6Department of Geography, Universityof Cambridge, Downing Place Cambridge, Cambridge CB2 3EN, UK. 7 Department of Ancient History, Culture and Archaeology, University of Allahabad,Allahabad 211 002 Uttar Pradesh, India. 8McDonald Institute for Archaeological Research, University of Cambridge, Downing Street, Cambridge CB2 3ER,UK. 9Office of Scholarly Communication, Cambridge University Library, West Road, Cambridge CB3 9DR, UK. 10 Australian Research Council (ARC) Centreof Excellence for Australian Biodiversity and Heritage, Australian National University, College of Asia and the Pacific, Canberra, ACT 0200, Australia.11 Department of Ancient History and Archaeology, University of Madras, Chepauk, Chennai 600 005, India. 12 Department of Ancient Indian History, Cultureand Archaeology, Banaras Hindu University, Varanasi, India. 13 Department of Anthropology, National Museum of Natural History, Smithsonian Institution,Washington, DC 20560, USA. 14Department of Anthropology and Archaeology, University of Calgary, Calgary, Canada. ✉email: [email protected];[email protected]
NATURE COMMUNICATIONS | (2020) 11:961 | https://doi.org/10.1038/s41467-020-14668-4 | www.nature.com/naturecommunications 1
1234
5678
90():,;

India is a focus of intense debate concerning the timing of thearrival of Homo sapiens, the material culture signature ofmodern human occupation, the nature of replacement of
archaic populations, and the impact of the ~74 ka YTT volcaniceruption on hominin populations. While the Indian fossilhominin record is non-existent for this key time period, analysisof mitochondrial DNA of contemporary populations of Indiaindicates that the region was an important geographic steppingstone in the colonisation of Australasia by Homo sapiens1. Atthe heart of this debate is the issue of whether Homo sapiensarrived in India prior to the YTT event (dated by 40Ar/36Ar to73.88 ± 0.32 ka1 and 75.0 ± 0.9 ka2)2–10 with a non-microlithicAfrican MSA technology comprised of Levallois and pointtechnology10–12, or entered the subcontinent around 50–60 kawith Howiesons Poort microlithic technology13. While thisdebate is pivotal to understanding the archaeological signature ofmodern humans throughout the region, the reality is that veryfew sites in India are dated to the crucial time period between 80and 50 ka, hence reliable evidence with which to test competinghypotheses is scarce. Due to the sparse Pleistocene human skeletalrecord between Africa and South Asia14,15, the debate over theSouth Asian record is largely focussed on stone tools and theDNA of modern populations, as well as rare finds such asengraved ostrich egg shell and worked osseous tools from ahandful of sites13.
Here we report detailed descriptions of a rich collection oflithic artefacts from the Dhaba locality, situated on the banks ofthe Middle Son River in Madhya Pradesh, northern India andcomprised of three nearby localities (Dhaba 1, 2 and 3)16, toge-ther with the associated luminescence age estimates. The Dhabalocality provides a detailed archaeological sequence for the Mid-dle Son Valley in a crucial time range of c.80–40 ka, and ispositioned chronologically between the early Middle Palaeolithic/Late Acheulean sites of Patpara, Nakjhar Khurd, Sihawal andBamburi 1, dated to c.140–>104 ka17,18, and the blade-based‘Upper Palaeolithic’ technologies recovered from Baghor forma-tion deposits, previously dated from c.39 ka, although the latterage is problematic19,20 (see Supplementary Discussion for moredetailed discussion and Supplementary Fig. 8 for site locations).In this study, we report infrared stimulated luminescence (IRSL)ages for potassium-rich feldspar (K-feldspar) grains collectedfrom excavated cultural sequences at Dhaba. We use the IRSLages to frame chronological changes in lithic technology at thissite and to place the evidence within the context of the SouthAsian Palaeolithic and the dispersal of modern humans morebroadly21.
The Dhaba locality is composed of three archaeologicalexcavations (Dhaba 1, 2 and 3) on the north banks of the SonRiver and west of its confluence with the Rehi River (Figs. 1and 2)16. Each of the three archaeological excavations consistedof a step trench placed into hill slope sediments (Table 1; Figs. 2and 3). Dhaba 1 (N 24°29′57.6″, E 82°00′35.0″) was selected asthe location of densest Middle Palaeolithic surface artefactconcentration, with artefacts visibly eroding from sediments atseveral points up the slope. Dhaba 2 (N 24°29′55.4″, E 82°00′24.5″) and Dhaba 3 (N 24°29′56.1″, E 82°00′22.5″) wereselected for excavation due to the existence of eroding accu-mulations of Middle Palaeolithic artefacts, and a dense con-centration of cryptocrystalline microblade and small flakeartefacts higher up the slope at Dhaba 3. Excavations at Dhaba1 and Dhaba 2 are ~600 and ~900 m west of the Rehi-Son Riverconfluence, respectively. The trenches were excavated intocolluvial and alluvial sediments overlying Proterozoic sand-stone and shale bedrock of the Vindhyan Supergroup22,23.Substantial deposits of chemically identified YTT are exposed~700 m to the east of Dhaba: at Ghogara, on the northern bank
of the Son River24,25, and in cliff sections on the east bank ofthe Rehi River26–28.
The step trenches expose pedogenically altered alluvial sands,silts and clays (Fig. 3, Supplementary Table 1). The tops of thestep trenches at Dhaba 1 and 2 are ~16 m above river level. Thetrench at Dhaba 1 reveals a coarsening-upward sequence offloodplain clays, silts and sands with angular sandstone and shalepebbles, carbonate nodules and rhizoliths. These floodplainsediments overlie angular limestone, sandstone and shaleboulders derived from the underlying bedrock (Fig. 3). Thetrench at Dhaba 2 exposes floodplain clays, silts and sands con-taining carbonate nodules and a few angular pebbles that overlieshale bedrock. Dhaba 3 is ~1 km west of the Rehi-Son Riverconfluence and consists of a ~3-m-deep trench ~21 m above riverlevel that is dug into the southeastern facing slope of a hillcomposed of colluvial silts, sands and gravels overlying decom-posing sandstone and shale bedrock. The estimated thickness ofthe colluvial sediments at the top of the hillock is ~5 m. Thetrench exposes silty sands and pebble gravel with angular sand-stone and shale clasts. The hillock is separated from a neigh-bouring sandstone and shale bedrock ridge, which rises to thewest to over 40 m above river level, by south- and southeast-draining gullies that feed into a channel, which, in turn, drainsinto the Son River. An ~10-m high Holocene terrace composed ofsands and silts abuts the north bank of the Son River16,28. Thisterrace overlies large, angular quartzite boulders that are inter-mittently exposed for ~100 m along the riverfront. Some of theseboulders show the removal of large flakes using hard hammerpercussion; possibly for the manufacture of quartzite Acheuleancleavers that have been recovered from some sites in the region.
The Dhaba localities together provide evidence of long-termhuman occupation spanning the last ~80 thousand years. Occu-pation spans the Toba eruption and the stone tool industry showsno significant change in technology until the introduction ofmicrolithic technology ~48 ka. The lithic industry from Dhabastrongly resembles Middle Stone Age stone tool assemblages fromAfrica, Arabia and Australia, here interpreted as the product ofHomo sapiens as they dispersed eastward out of Africa.
ResultsIRSL chronology. Thirteen sediment samples from the Dhabalocality were dated using a multiple-elevated-temperature post-infrared IRSL (MET-pIRIR) method29, described in Methodsbelow. The oldest ages are for Dhaba 1 (Supplementary Table 2)and are stratigraphically consistent with an upper and lowerdeposit, which mantle the steep slope. The lower unit has IRSLages of 78.0 ± 2.9 and 79.6 ± 3.2 ka (Fig. 3a), while the upper unithas IRSL ages of 70.6 ± 3.9 and 65.2 ± 3.1 ka (SupplementaryTable 2). Dhaba 2 was deposited between 55.0 ± 2.7 and 37.1 ±2.1 ka (Fig. 3c), while Dhaba 3 has ages of between 55.1 ± 2.4 and26.9 ± 3.8 ka (Fig. 3d). The Dhaba sequence, therefore, beganaccumulating just prior to the YTT event, with only a smalllikelihood of occuring later, taking the age uncertainties intoconsideration (p-values of <0.08 and <0.15 assuming a true agefor the eruption of 73.88 or 75.0 ka, respectively). Sedimentdeposition continued until close to the time of the Last GlacialMaximum, making this a unique locality in South Asia with anindustrial sequence that stretches from before the YTT event tothe microlithic transition.
Interestingly, six glass shards were found at Dhaba 1 indeposits dated to between 79.6 ± 3.2 and 65.2 ± 3.1 ka (Fig. 3a, seeSupplementary Note 1 and Supplementary Table 4), which isconsistent with the known date of the YTT event and thewidespread presence of YTT in India and the Middle SonValley2–10,30. However, we cannot rule out contamination by
ARTICLE NATURE COMMUNICATIONS | https://doi.org/10.1038/s41467-020-14668-4
2 NATURE COMMUNICATIONS | (2020) 11:961 | https://doi.org/10.1038/s41467-020-14668-4 | www.nature.com/naturecommunications

human agency as a possible source of these few shards at Dhaba1, given the presence of thick YTT deposits at nearby sites thatwere visited by some of the same researchers.
Stone artefacts. The stone artefact sequence at the three Dhabaexcavations spans 55 thousand years, from about 80 to 25 ka, withseveral distinct pulses in artefact discard (SupplementaryTable 1). The sequence is characterised by three major techno-logical phases (Table 1).
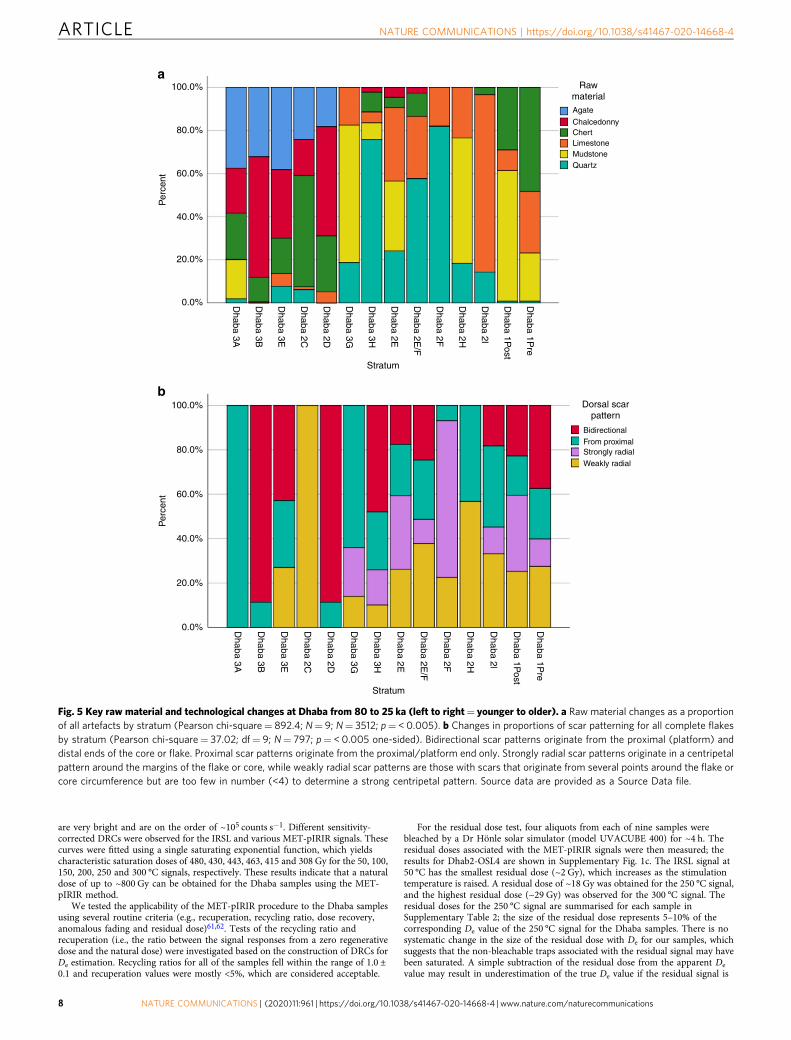
The Dhaba 1 assemblage accumulated between around 80 and65 ka, and contains a predominantly recurrent Levallois coreassemblage that includes centripetal, bidirectional and unidirec-tional recurrent Levallois cores, Levallois flakes, Levallois points,Levallois blades, notches and scrapers (Fig. 4, SupplementaryFigs. 5, 7); these tools are made almost exclusively on chert,mudstone and silicified limestone (Fig. 5a). Multiplatform andbidirectional cores and redirecting flakes are also present. Flakesshow predominantly strongly radial and weakly radial flake scarpatterning, consistent with centripetal core reduction (Fig. 5b,
Fig. 1 Archaeological sites mentioned in the text overlaid on a digitial elevation model of the Eurasian and South Asian landmasses at −60-m sea levelconsistent with MIS3/4. Topographic and bathymetric data was obtained from GEBCO 2014 Grid, version 20150318, http://www.gebco.net. Top:Archaeological sites associated with modern humans between Africa and Australia dated >50 ka. 1. Panga ya Saidi; 2. Mumba; 3. Porc Epic; 4. NazletKhater; 5. Al Wusta; 6. Jubbah; 7. Qafzeh; 8. Skhul; 9. Dhofar; 10. Jebel Faya; 11. Katoati; 12. Mehtakheri; 13. Dhaba; 14. Jwalapuram; 15. Denisova Cave; 16.Tam Pa Ling; 17. Fuyan Cave; 18. Lida Ajer; 19. Madjedbebe. Bottom: Location of key sites in India and modelled routes of dispersal (dashed orange lines andarrows) from west to east, after Field and colleagues21.
NATURE COMMUNICATIONS | https://doi.org/10.1038/s41467-020-14668-4 ARTICLE
NATURE COMMUNICATIONS | (2020) 11:961 | https://doi.org/10.1038/s41467-020-14668-4 | www.nature.com/naturecommunications 3

Supplementary Figs. 5, 7). Red ochre is also present in the Dhaba1 assemblage (Fig. 4f, g).
Levallois technology continues to dominate the Dhaba 2 and 3assemblages between about 55 and 47 ka (strata K and J at Dhaba
3, and strata I to E at Dhaba 2) when artefact deposition peaks.Levallois technology is absent from Dhaba above stratum E,dated to 47.5 ± 2.0 ka. Microlithic technology appears at c.48 kain stratum D at Dhaba 2 and stratum J in Dhaba 3, with
Fig. 2 Dhaba site location and excavation sections. a Satellite image of the Son River showing the Rehi confluence and location of the Dhaba excavations(image courtesy of GoogleEarth, image date 11/26/2015, Image © 2019 CNES/Airbus). b View of the Dhaba locality from the Middle Son river bed (photoCourtesy of Michael Haslam). c Dhaba 1 trench (below), Dhaba 1A trench (above), and locations of IRSL samples. d Dhaba 2 trench showing IRSL samplelocations. e Dhaba 3 section showing IRSL sample locations. f View of Dhaba 3 trench during excavation.
ARTICLE NATURE COMMUNICATIONS | https://doi.org/10.1038/s41467-020-14668-4
4 NATURE COMMUNICATIONS | (2020) 11:961 | https://doi.org/10.1038/s41467-020-14668-4 | www.nature.com/naturecommunications

microblades, backed artefacts and unidirectional and bidirectionalmicroblade cores all appearing in these strata (Fig. 4h, i, n, o, t u,Supplementary Fig. 6). Quartz is the dominant raw materialthroughout this microlithic phase, followed by agate (Fig. 5a).Flakes continue to show predominantly centripetal flake scarpatterning until the microlithic change (strata 2D and 3G and3H), when proximal and bidirectional scar patterning becomesthe dominant dorsal morphology (Fig. 5b).
By c.37 ka, artefact discard drops dramatically at Dhaba 2 and3, and very few microlithic artefacts are found after this time(above strata 3C and 2D). Agate and chalcedony are the mostcommon raw materials throughout this final period of siteoccupation, and flakes show mainly bidirectional and proximalflaking orientations (Fig. 5b).
The broad changes in the proportions of key types throughtime shown in Table 1 are statistically significant (Pearson chi-square= 2109; N= 864; p= < 0.0005 one-sided).
DiscussionThe luminescence ages of the Dhaba locality contribute a keymissing component in the Middle Son valley chronologicalsequence, as well as a rare glimpse into the nature of technologicalchange in India between about 80 and 24 ka. The sequence closelymirrors that at Jwalapuram in southern India31–33, showing achange from recurrent Levallois technology to increasing use ofsingle and multiplatform technology and, then, the manufactureof microlithic assemblages. The technological changes in both theMiddle Son and Jurreru River valleys appear to be stepwise andinvolve broad and statistically significant changes in raw materialselection, changing retouch strategies (from scrapers and pointsto backed artefacts), systematic shifts in core reduction technol-ogy, and the introduction of new retouched artefact forms such asbacked microliths as Levallois technology disappears31,32. Someoverlap between Levallois and microlithic technology is alsopresent at Dhaba, with both microlithic and Levallois technologyoccurring together in stratum J of Dhaba 3 (48.6 ± 2.7 ka) andstratum E of Dhaba 2 (47.5 ± 2.0 ka). The Dhaba sequence pre-sents stratified assemblages spanning the YTT event, and thetransition from Levallois to microlithic industries. Other key sitesin India also document gradual changes from the MiddlePalaeolithic through to the microlithic, such as Bhimbetka34 andPatne35, though neither of these sites has been well-dated usingmodern geochronological techniques and are not known tocontain any traces of YTT.
We find that the sequence offered by Dhaba further cementsthe notion that MSA-like technologies were present in Indiabefore and after the YTT eruption10,31,36. Lithic technologyevolved away from Levallois towards lamellar core reductionsystems, and finally saw the introduction of the microlithic (in theform of backed microblades) most likely long after Homo sapiensfirst appeared in the region31,32.
Recent genetic analyses point to a modern human exit fromAfrica around 70–52 ka37,38, in which all contemporary non-African peoples branched off from the same ancestral populationthat left Africa, possibly with minor genetic contributions from anearlier modern human migration wave37,39. Fossil evidence sup-ports earlier dispersals of Homo sapiens, with our species presentin Greece and the Levant by 200–185 ka40,41, Arabia by ~85 ka42,China before ~80 ka43 and Southeast Asia by 73–63 ka44, inassociation with MSA/Middle Palaeolithic technology (wherestone artefacts are present). Recent finds from Madjedbebe innorthern Australia also document a modern human presence atthe eastern end of the ‘southern arc’ dispersal route by 65 ±6 ka45, indicating that groups of Homo sapiens likely colonisedSouth Asia prior to this time. The strong connections betweenT
able
1Com
posite
stratigrap
hicsequ
ence
ofcoun
tsan
dprop
ortion
sof
keytype
sthroug
htimeba
sedon
cores,
flak
esan
dretouche
dflak
es.
Locality
Stratum
IRSLag
e(ka)
Levallo
is%
Microlithic
%Notches
%Scrap
ers
%Multiplatform
%Total
Artefacts
3A
00.00
00.00
00.00
18.33
00.00
122
A0
0.00
00.00
00.00
00.00
00.00
42
B0
0.00
00.00
00.00
00.00
00.00
53
B26
.9±3.8
00.00
00.00
00.00
00.00
133
.33
33
E23
.2±2.4
00.00
00.00
11.41
11.41
00.00
712
C37
.1±2.1
00.00
00.00
00.00
00.00
00.00
82
D0
0.00
211.76
00.00
00.00
317.65
173
G0
0.00
1523
.81
23.17
11.59
23.17
63
3H
00.00
40
10.95
00.00
30.82
92.47
365
2E
47.5±2.0
222.74
00.00
00.00
20.25
81.00
804
3J
48.6±2.7
52.02
52.02
10.40
00.00
10.40
247
2E/
F8
2.36
00.00
20.59
00.00
00.00
339
2F
53.9±2.9
00.00
00.00
00.00
00.00
00.00
212
H50
.8±5.5
00.00
00.00
00.00
00.00
00.00
392
I55
.0±2.7
10.16
00.00
30.47
10.16
30.47
641
3K
55.1±2.4
10.61
00.00
10.61
00.00
10.61
197
1Po
st-YTT
65.2±3.1,70
.6±3.9
43.03
00.00
21.52
10.76
00.00
132
1Pre-YTT
78.0
±2.9,79
.6±3.2
212.92
00.00
152.09
91.25
60.83
719
Microlithicpe
rtains
tocoun
tsandpe
rcen
tagesof
blades
andmicroblades
andcoresas
wellas
backed
microliths.P
ercentages
areby
stratum
ineach
locality.
TotalsforDhaba
3arefrom
squares9–13.
NATURE COMMUNICATIONS | https://doi.org/10.1038/s41467-020-14668-4 ARTICLE
NATURE COMMUNICATIONS | (2020) 11:961 | https://doi.org/10.1038/s41467-020-14668-4 | www.nature.com/naturecommunications 5

Aboriginal and South Asian modern human genomes is con-sistent with dispersal through South Asia1,46–48 and admixturewith Denisovans somewhere along this route49,50. The presenceof centripetal core and retouched point technology—and theabsence of microlithic technology—in northern Australia atc.65 ka makes connections to Southeast Asia, India and EastAfrica much stronger than previously proposed11,42. Thesetechnologies co-occur in sites east of Africa dated to betweenabout 100 and 47 ka, suggesting they were likely stepping stonesalong the southern arc dispersal route11. This hypothesis is fur-ther supported by quantitative comparisons of core technologiesfrom along this route that point to technological continuitybetween Africa and Australia10,11,31. Modern human dispersalout of Africa, and more importantly east of Arabia, must there-fore have taken place before ~65 ka, so cultural and fossil evi-dence from sites dating to this period will be important for futuretests of this hypothesis, notwithstanding the fact that populationcontractions and turnovers may have also occurred. The Dhaba
locality serves as an important bridge linking regions with similararchaeology to the east and west.
MethodsExcavation. Dhabas 1–3 were excavated under permit from the ArchaeologicalSurvey of India (No. F.1/36/2008-EE). All trenches was excavated simultaneouslyby several teams in 1 × 1m pits arranged as step trenches down the slope at eachlocality. Excavation trenches were placed in areas where artefacts were erodingfrom the slope in high density. Dhaba 1 was excavated in 4 lower steps and 1a wasexcavated in 12 upper steps covering a total elevation of 9–22 m above river level.Dhaba 2 was excavated in six steps covering a total elevation of 21–28 m aboveriver level. The Dhaba 3 trench is located 25–30 m above river level and was 18-mlong. Each pit was excavated in spits of ~10-cm depth, with levels taken after eachspit using a line level. All excavated sediments were passed through a 5 mm sieveand all artefacts recovered. The weight of the matrix removed during excavationwas recorded and all finds were placed in clip seal plastic bags and labelled withprovenance details.
Artefact analysis. All artefacts were washed and taken to the archaeologylaboratory in the Department of Ancient History, Culture and Archaeology at the
Dhab1 OSL 4 65.2 ± 3.1 ka
Dhab1 OSL 3 79.6 ± 3.2 ka
Dhab2 OSL1 37.1 ± 2.1
Dhab2 OSL2 47.5 ± 2.0
Dhab2 OSL4 53.9 ± 2.9
Dhab2 OSL5 50.8 ± 5.5
Dhab2 OSL6 55.0 ± 2.7
Dhab3 OSL6 26.9 ± 3.8Dhab3 OSL5 23.2 ± 2.4
Dhab3 OSL2 48.6 ± 2.7
Dhab3 OSL1 55.1 ± 2.4 ka
Dhab1 OSL 2 70.6 ± 3.9 ka
Dhab1 OSL 1 78.0 ± 2.9
Dhaba 1a steps above this point
Two shards
Two shards
Key
Angular pebblesRhizolithsCarbonate nodulesSand pocket
One shardOne shard
Bedrock
Bedrock
mbs
a
b c
d
mbs
mbs
A/B
G/H
Cl Si F M C Gr Cl Si F M C Gr
Cl Si F M C Gr
Sa Sa
Sa
Shale
C
A
B
C
D
mbsA
EFG
H/IJ
K
B (C,D)
EF
D
EFG
H
I
Unexcavated
Fig. 3 Dhaba stratigraphy and chronology. a Dhaba 1 profile showing location of IRSL ages and cryptotephra shards. The upper 7.88m of Dhaba 1a are notshown. Note all glass shards are found at or below the boundary between the yellow-brown clay-rich layer and the overlying light yellowish brown silt layerand are bracketed by ages of 78 and 71 ka. b Dhaba 1 sediment log. c Dhaba 2 sediment log and IRSL ages. d Dhaba 3 sediment log and IRSL ages. Cl= clay,Si= silt, Sa= sand (F, M and C are fine, medium and coarse, respectively), Gr= gravel, mbs=metres below surface. Alphabetial references are tostratigraphic layers. Refer to Supplementary Table 1 for detailed sedimentary descriptions.
ARTICLE NATURE COMMUNICATIONS | https://doi.org/10.1038/s41467-020-14668-4
6 NATURE COMMUNICATIONS | (2020) 11:961 | https://doi.org/10.1038/s41467-020-14668-4 | www.nature.com/naturecommunications

University of Allahabad for analysis. Each artefact was first classified into tech-nological categories such as core, flake, flaked piece and retouched flake andascribed typological categories where appropriate. All artefacts were assignedindividual specimen numbers, weighed, measured with digital callipers and pho-tographed. All information was entered into a relational database along withdetailed provenance information for each artefact. Artefact measurement protocolsfollow those described in Clarkson et al.31. All cores were scanned in threedimensions using a NextEngine laser scanner and a select set of core measurementstaken for each31. Select artefacts were illustrated using conventional archaeologicalillustration techniques and protocols.
IRSL dating. Sediment samples were collected by hammering opaque plastic tubes(5 cm in diameter) into the cleaned section face. The tubes were removed andwrapped in light-proof plastic for transport to the Luminescence Dating Laboratoryat the University of Wollongong. Under dim red laboratory illumination, eachsample was treated using standard procedures to extract sand-sized grains of K-feldspar51,52. The samples were routinely treated with solutions of HCl acid andH2O2 to remove carbonates and organic matter, respectively, and then dried.Different grain size fractions in the range of 90–212 µm were obtained by drysieving, and the K-rich feldspar grains separated using a heavy liquid solution ofsodium polytungstate with a density of 2.58 g/cm3. The separated grains wereetched using 10% HF acid for ~40 min to clean the surfaces of the grains andreduce the thickness of the alpha-irradiated layer around the grain surface. IRSLmeasurements of the K-feldspar grains were made on an automated Risø TL-DA-20 reader equipped with IR diodes (875 nm) for stimulation, which delivered~135 mW/cm2 total power to the sample position53. Irradiations were carried outwithin the reader using a 90Sr/90Y beta source. The IRSL signals were detectedusing a photomultiplier tube with the stimulated luminescence passing through afilter pack containing Schott BG-39 and Corning 7–59 filters, which provides a bluetransmission window (320–480 nm). Aliquots containing several hundred grains(~5 mm in diameter) were prepared by mounting the grains as a monolayer on a9.8-mm-diameter aluminium disc using “Silkospray” silicone oil as an adhesive.
The dose rates were determined from field measurements of the gamma doserate, laboratory measurements of the beta dose rate using the sediment samplesrecovered from each tube hole, and published estimates of the cosmic-ray dose rateand the internal dose rate (due to 40K and 87Rb contained within the K-feldspargrains). The dosimetry data for all samples are summarised in SupplementaryTable 2. The gamma dose rates were measured using an Exploranium GR-320portable gamma-ray spectrometer, which is equipped with a 3-inch diameter NaI(Tl) crystal calibrated for U, Th and K concentrations using the CSIRO facility atNorth Ryde. At each sample location, 3–4 measurements of 900 s duration weremade of the gamma dose rate at field water content. The external beta dose rate wasmeasured by low-level beta counting using a Risø GM-25-5 multicounter system54
and referenced to the Nussloch Loess (Nussi) standard55. These externalcomponents of the total dose rate were adjusted for sample water content,assuming a value of 7 ± 2% for all samples (based on the measured (field) watercontent of each sample, which ranged from 2 to 5%, and making an allowance forcollection of samples during the dry season and partial drying out of the exposedsections prior to sample collection); the assigned uncertainty captures the likelyrange of time-averaged values for the entire period of sample burial. The minorcontribution from cosmic rays was estimated from the burial depth and watercontent of each sample, and the latitude, longitude and altitude of the Dhabasites56. The internal dose rate was estimated by assuming 40K and 87Rbconcentrations of 13 ± 1% and 400 ± 100 p.p.m., respectively57–59.
The MET-pIRIR procedure29,60–62 was applied to determine equivalent dose(De) of our samples. The IRSL signals of both regenerative and test doses weremeasured by increasing the stimulation temperature from 50 to 300 °C in steps of50 °C. A preheat at 320 °C for 60 s was applied after both regenerative and testdoses. At the end of the IRSL measurements for each test dose, a ‘hot’ IR bleach at325 °C for 100 s was conducted to minimise the residual signal preceding the nextmeasurement cycle. The full experimental procedure is summarised inSupplementary Table 3.
Typical IRSL and MET-pIRIR decay curves and dose response curves (DRCs)for one aliquot of sample Dhab1-OSL4 are shown in Supplementary Fig. 1a, b,respectively. The intensities of the IRSL and MET-pIRIR signals for all the samples
a
j
p q r s t u
k l m n o
b c d e g
f
h i
Fig. 4 Key artefact types at Dhaba from 80 to 25 ka. a–c Levallois flakes, Dhaba 1 and 2. d, e Levallois blades, Dhaba 1. f, g Ochre, Dhaba 1. h, iMicrobladecores, Dhaba 3. j Notched scraper, Dhaba 1. k–m Levallois points, Dhaba 1 and 2. n, o Agate and chert microblades, Dhaba 3. p–s Recurrent Levallois cores,Dhaba 1–3. t, u Backed microliths, Dhaba 3. White arrows indicate scar directions. Black arrows with circles indicate impact points.
NATURE COMMUNICATIONS | https://doi.org/10.1038/s41467-020-14668-4 ARTICLE
NATURE COMMUNICATIONS | (2020) 11:961 | https://doi.org/10.1038/s41467-020-14668-4 | www.nature.com/naturecommunications 7
are very bright and are on the order of ~105 counts s−1. Different sensitivity-corrected DRCs were observed for the IRSL and various MET-pIRIR signals. Thesecurves were fitted using a single saturating exponential function, which yieldscharacteristic saturation doses of 480, 430, 443, 463, 415 and 308 Gy for the 50, 100,150, 200, 250 and 300 °C signals, respectively. These results indicate that a naturaldose of up to ~800 Gy can be obtained for the Dhaba samples using the MET-pIRIR method.
We tested the applicability of the MET-pIRIR procedure to the Dhaba samplesusing several routine criteria (e.g., recuperation, recycling ratio, dose recovery,anomalous fading and residual dose)61,62. Tests of the recycling ratio andrecuperation (i.e., the ratio between the signal responses from a zero regenerativedose and the natural dose) were investigated based on the construction of DRCs forDe estimation. Recycling ratios for all of the samples fell within the range of 1.0 ±0.1 and recuperation values were mostly <5%, which are considered acceptable.
For the residual dose test, four aliquots from each of nine samples werebleached by a Dr Hönle solar simulator (model UVACUBE 400) for ~4 h. Theresidual doses associated with the MET-pIRIR signals were then measured; theresults for Dhab2-OSL4 are shown in Supplementary Fig. 1c. The IRSL signal at50 °C has the smallest residual dose (~2 Gy), which increases as the stimulationtemperature is raised. A residual dose of ~18 Gy was obtained for the 250 °C signal,and the highest residual dose (~29 Gy) was observed for the 300 °C signal. Theresidual doses for the 250 °C signal are summarised for each sample inSupplementary Table 2; the size of the residual dose represents 5–10% of thecorresponding De value of the 250 °C signal for the Dhaba samples. There is nosystematic change in the size of the residual dose with De for our samples, whichsuggests that the non-bleachable traps associated with the residual signal may havebeen saturated. A simple subtraction of the residual dose from the apparent De
value may result in underestimation of the true De value if the residual signal is
100.0%a
b
Rawmaterial
Dorsal scarpattern
Agate
ChalcedonnyChertLimestoneMudstoneQuartz
BidirectionalFrom proximalStrongly radial
Weakly radial
80.0%
60.0%P
erce
nt
40.0%
20.0%
0.0%
100.0%
80.0%
60.0%
Per
cent
40.0%
20.0%
0.0%
Stratum
Dhaba 3A
Dhaba 3B
Dhaba 3E
Dhaba 2C
Dhaba 2D
Dhaba 3G
Dhaba 3H
Dhaba 2E
Dhaba 2E
/F
Dhaba 2F
Dhaba 2H
Dhaba 2l
Dhaba 1P
ost
Dhaba 1P
re
Stratum
Dhaba 3A
Dhaba 3B
Dhaba 3E
Dhaba 2C
Dhaba 2D
Dhaba 3G
Dhaba 3H
Dhaba 2E
Dhaba 2E
/F
Dhaba 2F
Dhaba 2H
Dhaba 2l
Dhaba 1P
ost
Dhaba 1P
re
Fig. 5 Key raw material and technological changes at Dhaba from 80 to 25 ka (left to right= younger to older). a Raw material changes as a proportionof all artefacts by stratum (Pearson chi-square= 892.4; N= 9; N= 3512; p= < 0.005). b Changes in proportions of scar patterning for all complete flakesby stratum (Pearson chi-square= 37.02; df= 9; N= 797; p= < 0.005 one-sided). Bidirectional scar patterns originate from the proximal (platform) anddistal ends of the core or flake. Proximal scar patterns originate from the proximal/platform end only. Strongly radial scar patterns originate in a centripetalpattern around the margins of the flake or core, while weakly radial scar patterns are those with scars that originate from several points around the flake orcore circumference but are too few in number (<4) to determine a strong centripetal pattern. Source data are provided as a Source Data file.
ARTICLE NATURE COMMUNICATIONS | https://doi.org/10.1038/s41467-020-14668-4
8 NATURE COMMUNICATIONS | (2020) 11:961 | https://doi.org/10.1038/s41467-020-14668-4 | www.nature.com/naturecommunications

relatively large compared with the bleachable signal63. To estimate the proportionof residual signal to bleachable signal for our samples, 12 aliquots of Dhab1-OSL2,Dhab1-OSL3 and Dhab2-OSL1 were heated to 450 °C to empty the source trapsassociated with the residual and bleachable signals. These aliquots weresubsequently given different regenerative doses (165, 330 and 496 Gy) and thenbleached using the solar simulator for 4 h before measuring the residual signalusing the MET-pIRIR procedure. The measured residual signals from the differentregenerative doses were compared with the total regenerative signals at the samedoses. The residual signal corresponds to only ~5% of the total signal, which iscomparable to the residual dose as a proportion of the measured De. Given thesmall size of the residual signal relative to the bleachable signal, the simple dose-subtraction approach should give satisfactory results.
We also tested the validity of the dose-subtraction correction and performanceof the MET-pIRIR procedure using a dose recovery test. Four aliquots of sampleDhab2-OSL4 were first bleached by the solar simulator for 4 h and then given adose of 220 Gy, which was measured as an ‘unknown’ dose using the MET-pIRIRprocedure. The ratios of measured dose to given dose for the IRSL and MET-pIRIRsignals are shown in Supplementary Fig. 1d. After correcting for the residual dosesshown in Supplementary Fig. 1c, dose recovery ratios of ~0.9 were obtained for the50 and 100 °C signals, and ratios of 1.02 ± 0.02, 1.03 ± 0.02, 1.02 ± 0.02 and 1.01 ±0.03 for the 150, 200, 250 and 300 °C MET-pIRIR signals, respectively. The resultsof this dose recovery test suggest, therefore, that the combination of MET-pIRIRand simple dose-subtraction procedures can recover a dose consistent with theknown dose given to our samples, so we adopted these procedures to estimate thefinal De values and ages for the Dhaba samples.
Previous studies of pIRIR signals have shown that the anomalous fading rate (g-value) depends on the stimulation temperature, with negligible fading rates observedfor MET-pIRIR signals at 200 °C and above29,60–62. No fading correction is thereforerequired for ages estimated from the high-temperature MET-pIRIR signals. Todirectly test the absence of significant fading for the samples studied here, weconducted anomalous fading tests on K-feldspar grains from samples Dhab2-OSL1and Dhab3-OSL1 using a single-aliquot measurement procedure similar to thatdescribed by Auclair et al.64, but based on the MET-pIRIR measurement procedurein Supplementary Table 3. The g-values calculated for the IRSL and MET-pIRIRsignals (Supplementary Fig. 1e) show that the fading rate is highest for the 50 °CIRSL signal (3.2 ± 0.4 and 4.1 ± 0.7% per decade for Dhab2-OSL1 and Dhab3-OSL1,respectively) and decreases as the stimulation temperature is raised. The fading ratesfor the 200 °C signal are <1% per decade and are consistent with zero for the signalsmeasured at 250 and 300 °C, suggesting that negligible fading or non-fading isachieved at the two highest stimulation temperatures.
Based on the above performance tests, the MET-pIRIR procedure was used tomeasure the De values for all samples. The De values obtained for each of the MET-pIRIR signals are plotted against stimulation temperature (De–T plots) for eachof the samples from Dhaba 1, 2 and 3 in Supplementary Figs. 2–4, respectively.We also applied a fading correction65 to the De values based on the g-values inFig. 1e. The fading-corrected De values are shown as red squares in SupplementaryFigs. 2–4. After applying the fading correction, the fading-corrected De valuesfor the 150 and 200 °C signals are consistent with those obtained at highertemperatures (>200 °C), which have negligible fading rates. This further supportsour proposition that the MET-pIRIR procedure can access a non-fading signal forthe samples studied here and, hence, the De values and ages obtained from theelevated temperature signals should be reliable. More importantly, since the signalsmeasured at different temperatures are bleached at significantly different rates(Supplementary Fig. 1c), the consistency in De values across a wide range ofstimulation temperatures (i.e., 150–300 °C) indicates that our samples had beensufficiently bleached prior to deposition. At lower stimulation temperatures (50and 100 °C), the De values are underestimated, even after correcting for fading,which is consistent with the dose underestimation observed at 50 and 100 °C in thedose recovery test (Supplementary Fig. 1d).
Given the much lower residual dose of the 250 °C signal compared with the300 °C signal (Supplementary Fig. 1c), we consider the De values obtained using the250 °C signal as the most reliable for the Dhaba samples. The final ages were,therefore, based on the De values and associated uncertainties estimated from the250 °C MET-pIRIR signal (Supplementary Table 2).
Reporting summary. Further information on research design is available inthe Nature Research Reporting Summary linked to this article.
Data availabilityAll relevant data used in this paper are available from the authors. Soil and IRSL datingsamples are held in the School of Earth and Environmental Sciences at the University ofWollongong, Australia, and in the Department of Archaeology at the Max PlanckInstitute for the Science of Human History, Germany. All stone artefacts are held in theDepartment of Ancient History, Culture and Archaeology at the University of Allahabad,India. The source data underlying Fig. 5 are provided as a Source Data file.
Received: 25 March 2019; Accepted: 19 December 2019;
References1. Atkinson, Q. D., Gray, R. D. & Drummond, A. J. mtDNA variation predicts
population size in humans and reveals a major Southern Asian chapter inhuman prehistory. Mol. Biol. Evolution 25, 468–474 (2007).
2. Storey, M., Roberts, R. G. & Saidin, M. Astronomically calibrated 40Ar/39Arage for the Toba supereruption and global synchronization of late Quaternaryrecords. Proc. Natl Acad. Sci. USA 109, 18684–18688 (2012).
3. Mark, D. F. et al. A high-precision 40Ar/39Ar age for the Young Toba Tuff anddating of ultra-distal tephra: forcing of Quaternary climate and implicationsfor hominin occupation of India. Quat. Geochronol. 21, 90–103 (2014).
4. Rose, W. I. & Chesner, C. A. Dispersal of ash in the great Toba eruption, 75 ka.Geology 15, 913–917 (1987).
5. Acharyya, S. K. & Basu, P. K. Toba ash on the Indian subcontinent and itsimplications for correlation of Late Pleistocene alluvium. Quat. Res. 40, 10–19(1993).
6. Shane, P., Westgate, J., Williams, M. & Korisettar, R. New geochemicalevidence for the Youngest Toba Tuff in India. Quat. Res. 44, 200–204 (1995).
7. Westgate, J. A. et al. All Toba tephra occurrences across peninsular Indiabelong to the 75,000 yr BP eruption. Quat. Res. 50, 107–112 (1998).
8. Pearce, N. J. et al. Individual glass shard trace element analyses confirm that allknown Toba tephra reported from India is from the c. 75‐ka Youngest Tobaeruption. J. Quat. Sci. 29, 729–734 (2014).
9. Pearce, N. J., Westgate, J. A., Gualda, G. A., Gatti, E. & Muhammad, R. F.Tephra glass chemistry provides storage and discharge details of five magmareservoirs which fed the 75 ka Youngest Toba Tuff eruption, northernSumatra. J. Quaternary Sci. 256–271 (2019).
10. Petraglia, M. et al. Middle Paleolithic assemblages from the Indiansubcontinent before and after the Toba super-eruption. Science 317, 114–116(2007).
11. Clarkson, C. in Southern Asia, Australia and the Search for Human Origins76–89 (Cambridge University Press, Cambridge, 2014).
12. Groucutt, H. S. et al. Rethinking the dispersal of Homo sapiens out of Africa.Evolut. Anthropol.: Issues, N., Rev. 24, 149–164 (2015).
13. Mellars, P., Gori, K. C., Carr, M., Soares, P. A. & Richards, M. B. Genetic andarchaeological perspectives on the initial modern human colonization ofsouthern Asia. Proc. Natl Acad. Sci. USA 110, 10699–10704 (2013).
14. Dennell, R. & Petraglia, M. D. The dispersal of Homo sapiens across southernAsia: how early, how often, how complex? Quat. Sci. Rev. 47, 15–22 (2012).
15. Rabett, R. J. The success of failed Homo sapiens dispersals out of Africa andinto Asia. Nat. Ecol. Evol. 2, 212–219 (2018).
16. Haslam, M. et al. Dhaba: an initial report on an Acheulean, MiddlePalaeolithic and microlithic locality in the Middle Son Valley, north-centralIndia. Quat. Int. 258, 191–199 (2012).
17. Haslam, M. et al. Late Acheulean hominins at the Marine Isotope Stage 6/5etransition in north-central India. Quat. Res. 75, 670–682 (2011).
18. Shipton, C. et al. Generativity, hierarchical action and recursion in thetechnology of the Acheulean to Middle Palaeolithic transition: a perspectivefrom Patpara, the Son Valley, India. J. Hum. Evolution 65, 93–108 (2013).
19. Jones, S. C. & Pal, J. N. The Palaeolithic of the Middle Son valley, north-central India: changes in hominin lithic technology and behaviour during theUpper Pleistocene. J. Anthropological Archaeol. 28, 323–341 (2009).
20. Petraglia, M. D., Ditchfield, P., Jones, S., Korisettar, R. & Pal, J. N. TheToba volcanic super-eruption, environmental change, and homininoccupation history in India over the last 140,000 years. Quat. Int. 258,119–134 (2012).
21. Field, J. S., Petraglia, M. D. & Lahr, M. M. The southern dispersal hypothesisand the South Asian archaeological record: examination of dispersal routesthrough GIS analysis. J. Anthropological Archaeol. 26, 88–108 (2007).
22. Ray, J. S., Veizer, J. & Davis, W. J. C, O, Sr and Pb isotope systematics ofcarbonate sequences of the Vindhyan Supergroup, India: age, diagenesis,correlations and implications for global events. Precambrian Res. 121,103–140 (2003).
23. Korisettar, R. in The Evolution and History of Human Populations in SouthAsia 69–96 (Springer, Dordrecht, 2007).
24. Jones, S. C. Palaeoenvironmental response to the ∼74 ka Toba ash-fall in theJurreru and Middle Son valleys in southern and north-central India. Quat.Res. 73, 336–350 (2010).
25. Gatti, E., Durant, A. J., Gibbard, P. L. & Oppenheimer, C. Youngest Toba Tuffin the Son Valley, India: a weak and discontinuous stratigraphic marker. Quat.Sci. Rev. 30, 3925–3934 (2011).
26. Lewis, L., Ditchfield, P., Pal, J. N. & Petraglia, M. Grain size distributionanalysis of sediments containing Younger Toba tephra from Ghoghara,Middle Son valley, India. Quat. Int. 258, 180–190 (2012).
27. Neudorf, C. M., Roberts, R. G. & Jacobs, Z. Assessing the time of finaldeposition of Youngest Toba Tuff deposits in the Middle Son Valley, northernIndia. Palaeogeogr., Palaeoclimatol., Palaeoecol. 399, 127–139 (2014a).
28. Neudorf, C. M., Roberts, R. G. & Jacobs, Z. Testing a model of alluvialdeposition in the Middle Son Valley, Madhya Pradesh, India—IRSL dating of
NATURE COMMUNICATIONS | https://doi.org/10.1038/s41467-020-14668-4 ARTICLE
NATURE COMMUNICATIONS | (2020) 11:961 | https://doi.org/10.1038/s41467-020-14668-4 | www.nature.com/naturecommunications 9

terraced alluvial sediments and implications for archaeological surveys andpalaeoclimatic reconstructions. Quat. Sci. Rev. 89, 56–69 (2014b).
29. Li, B. & Li, S. H. Luminescence dating of K-feldspar from sediments: a protocolwithout anomalous fading correction. Quat. Geochronol. 6, 468–479 (2011).
30. Smith, V. C. et al. Geochemical fingerprinting of the widespread Toba tephrausing biotite compositions. Quat. Int. 246, 97–104 (2011).
31. Clarkson, C., Jones, S. & Harris, C. Continuity and change in the lithicindustries of the Jurreru Valley, India, before and after the Toba eruption.Quat. Int. 258, 165–179 (2012).
32. Clarkson, C., Petraglia, M., Harris, C., Shipton, C. & Norman, K. in LithicTechnological Organization and Paleoenvironmental Change 37–61 (Springer,Cham, 2018).
33. Petraglia, M. et al. Population increase and environmental deteriorationcorrespond with microlithic innovations in South Asia ca. 35,000 years ago.Proc. Natl Acad. Sci. USA 106, 12261–12266 (2009).
34. Misra, V. N. Prehistoric Culture Sequence of Bhimbetka. Pre-historic Man andHis Art in Central India, Pune, 10–16 (1970).
35. Sali, S. A. The Upper Palaeolithic and Mesolithic Cultures of Maharashtra(Deccan College, Pune, 1989).
36. Blinkhorn, J. & Petraglia, M. D. Environments and cultural change in theIndian Subcontinent: implications for the dispersal of Homo sapiens in theLate Pleistocene. Curr. Anthropol. 58(S17), S463–S479 (2017).
37. Pagani, L. et al. Genomic analyses inform on migration events during thepeopling of Eurasia. Nature 538, 238 (2016).
38. Kuhlwilm, M. et al. Ancient gene flow from early modern humans intoEastern Neanderthals. Nature 530, 429–433 (2016).
39. Nielsen, R. et al. Tracing the peopling of the world through genomics. Nature541, 302 (2017).
40. Harvati, K. et al. Apidima Cave fossils provide earliest evidence of Homosapiens in Eurasia. Nature 571, 500–504 (2019).
41. Hershkovitz, I. et al. Response to Comment on “The earliest modern humansoutside Africa”. Science 362, eaat8964 (2018).
42. Groucutt, H. S. et al. Homo sapiens in Arabia by 85,000 years ago. Nat. Ecol.evolution 2, 800 (2018).
43. Liu, W. et al. The earliest unequivocally modern humans in southern China.Nature 526, 696 (2015).
44. Westaway, K. E. et al. An early modern human presence in Sumatra73,000–63,000 years ago. Nature 548, 322 (2017).
45. Clarkson, C. et al. Human occupation of northern Australia by 65,000 yearsago. Nature 547, 306 (2017).
46. Mondal, M., Casals, F., Majumder, P. P. & Bertranpetit, J. Furtherconfirmation for unknown archaic ancestry in Andaman and South Asia.bioRxiv https://doi.org/10.1101/071175 (2016).
47. Rasmussen, M. et al. An Aboriginal Australian genome reveals separatehuman dispersals into Asia. Science 334, 94–98 (2011).
48. Reich, D. et al. Denisova admixture and the first modern human dispersalsinto Southeast Asia and Oceania. Am. J. Hum. Genet. 89, 516–528 (2011).
49. Vernot, B. & Pääbo, S. The predecessors within. Cell 173, 6–7 (2018).50. Jacobs, G. S. et al. Multiple deeply divergent Denisovan ancestries in Papuans.
Cell 177, 1010–1021 (2019).51. Wintle, A. G. Luminescence dating: laboratory protocols and procedures.
Radiat. Meas. 27, 769–817 (1997).52. Aitken, M. J. An Introduction to Optical Dating (Oxford University Press,
1998).53. Bøtter-Jensen, L., Andersen, C. E., Duller, G. A. T. & Murray, A. S.
Developments in radiation, stimulation and observation facilities inluminescence measurements. Radiat. Meas. 37, 535–541 (2003).
54. Bøtter-Jensen, L. & Mejdahl, V. Assessment of beta dose-rate using a GMmulticounter system. Int. J. Radiat. Appl. Instrum. Part D. Nucl. TracksRadiat. Meas. 14, 187–191 (1988).
55. Jacobs, Z. & Roberts, R. G. An improved single grain OSL chronology for thesedimentary deposits from Diepkloof Rockshelter, Western Cape, SouthAfrica. J. Archaeological Sci. 63, 175–192 (2015).
56. Prescott, J. R. & Hutton, J. T. Cosmic-ray contributions to dose-rates forluminescence and ESR dating—large depths and long-term time variations.Radiat. Meas. 23, 497–500 (1994).
57. Huntley, D. J. & Baril, M. R. The K content of the K-feldspars being measuredin optical dating or in thermoluminescence dating. Anc. TL 15, 11–13 (1997).
58. Huntley, D. J. & Hancock, R. G. V. The Rb contents of the K-feldspars beingmeasured in optical dating. Anc. TL 19, 43–46 (2001).
59. Zhao, H. & Li, S.-H. Internal dose rate to K-feldspar grains from radioactiveelements other than potassium. Radiat. Meas. 40, 84–93 (2005).
60. Li, B. & Li, S.-H. Luminescence dating of Chinese loess beyond 130 ka usingthe non-fading signal from K-feldspar. Quat. Geochronol. 10, 24–31 (2012).
61. Li, B., Jacobs, Z., Roberts, R. G. & Li, S.-H. Review and assessment of thepotential of post-IR IRSL dating methods to circumvent the problem ofanomalous fading in feldspar luminescence. Geochronometria 41, 178–201(2014).
62. Roberts, R. G. et al. Optical dating in archaeology: thirty years in retrospectand grand challenges for the future. J. Archaeological Sci. 56, 41–60 (2015).
63. Li, B., Roberts, R. G. & Jacobs, Z. On the dose dependency of the bleachableand non-bleachable components of IRSL from K-feldspar: improvedprocedures for luminescence dating of Quaternary sediments. Quat.Geochronol. 17, 1–13 (2013).
64. Auclair, M., Lamothe, M. & Huot, S. Measurement of anomalous fading forfeldspar IRSL using SAR. Radiat. Meas. 37, 487–492 (2013).
65. Huntley, D. J. & Lamothe, M. Ubiquity of anomalous fading in K-feldsparsand the measurement and correction for it in optical dating. Can. J. Earth Sci.38, 1093–1106 (2001).
AcknowledgementsWe thank the Archaeological Survey of India for permission to conduct the fieldwork,the American Institute of Indian Studies for facilitating this research, and the interna-tional team for their contributions to the excavations, especially M. Haslam, A. Crowtherand J. Bora. We thank K. Douka for providing comments on a draft of this paper andL. Lewis for conducting cryptotephra lab work. This research was supported by grantsfrom the British Academy (M.P., N.B.), the Leverhulme Trust (M.P., N.B.), the Universityof Wollongong (B.L.), the European Research Council (M.P.); the Australian ResearchCouncil (B.L., C.C., R.G.R.); the McDonald Institute for Archaeological Research (M.P.,M. Haslam); and the Max Planck Society (N.B., M.P.).
Author contributionsJ.P., M.P., N.B. and C.C. designed the study. J.P., M.P., C.C., C.H., C.S., J.K., M.C.G., D.P.M.,A.K.D. and C.M.N. conducted the fieldwork. C.C., K.N., S.J., B.L., R.G.R. and C.L. wrotethe paper. C.C., M.P., N.B. and R.G.R. obtained funding for the study. C.M.N. performedsedimentary analyses. B.L. and R.G.R. carried out IRSL dating. C.L. performed cryptotephraanalyses. C.C., C.S. and C.H. analysed the lithic assemblage. C.C., K.N., C.M.N., L.B. andC.H. produced the figures.
Competing interestsThe authors declare no competing interests.
Additional informationSupplementary information is available for this paper at https://doi.org/10.1038/s41467-020-14668-4.
Correspondence and requests for materials should be addressed to C.C. or M.P.
Peer review information Nature Communications thanks the anonymous reviewers fortheir contribution to the peer review of this work. Peer reviewer reports are available.
Reprints and permission information is available at http://www.nature.com/reprints
Publisher’s note Springer Nature remains neutral with regard to jurisdictional claims inpublished maps and institutional affiliations.
Open Access This article is licensed under a Creative CommonsAttribution 4.0 International License, which permits use, sharing,
adaptation, distribution and reproduction in any medium or format, as long as you giveappropriate credit to the original author(s) and the source, provide a link to the CreativeCommons license, and indicate if changes were made. The images or other third partymaterial in this article are included in the article’s Creative Commons license, unlessindicated otherwise in a credit line to the material. If material is not included in thearticle’s Creative Commons license and your intended use is not permitted by statutoryregulation or exceeds the permitted use, you will need to obtain permission directly fromthe copyright holder. To view a copy of this license, visit http://creativecommons.org/licenses/by/4.0/.
© Crown 2020
ARTICLE NATURE COMMUNICATIONS | https://doi.org/10.1038/s41467-020-14668-4
10 NATURE COMMUNICATIONS | (2020) 11:961 | https://doi.org/10.1038/s41467-020-14668-4 | www.nature.com/naturecommunications