human health risk characterization: a state's perspective
TRANSCRIPT

Human Health Risk Characterization: A States Perspective
Gloria B. Post, Ph.D., D.A.B.T.NJ Department of Environmental Protection
Environmental Risk Assessment of PFAS SETAC North America Focused Topic Meeting
Durham, NCAugust 14, 2019
State Human Health Criteria for Environmental Contaminants
• States may develop human health criteria (standards and guidance values) for several environmental media.
• Human health criteria are based on:
– Toxicity factors
• Same factor used for human health criteria for all environmental media (unless there is a policy reason for difference).
• Non-cancer Reference Dose (ng/kg/day) or Cancer Slope (Potency) Factor (ng/kg/day)-1.
– Exposure assumptions
• Specific to exposure routes for each type of criterion.

Environmental Medium
Exposure Routes & Assumptions Comments
Drinking Water Drinking water ingestion
L water/kg body wt/day
*For ground water that is potentially potable.Ground Water*
Surface Water
Fresh waterDrinking water + Fish consumption
Exposure from fish consumption is determined bioaccumulation factor (BAF).
Saline water
Fish consumption
kg fish/kg body wt/day
BAF: L water/kg fish
Soil
Residential: ChildIncidental soil ingestion
kg soil/kg body wt/dayNon-residential:
Worker
Fish Consumption Advisories
Recreationally caught fish
Frequency of 227 g (8 ounce) fish meal
Exposure Pathways Considered in Human Health Criteria

Section 4 Tables Excel file (updated June 2019)
• Table 4-1 presents the available PFAS water values established by the
USEPA, each pertinent state, or country (Australia, Canada and Western
European countries).
• Table 4-2 presents the available PFAS soil values established by the USEPA,
each pertinent state, or country (Australia, Canada and Western European
countries).
Section 5 Tables Excel file (updated January 2019)
• Table 5-1 summarizes the differences in the PFOA values for drinking water
in the United States.
• Table 5-2 summarizes the differences in the PFOS values for drinking water
in the United States.
Posted at: https://pfas-1.itrcweb.org/fact-sheets/
Interstate Technology & Regulatory Council (ITRC)Tables of PFAS Standards & Guidance Values

Standards versus Guidance for Drinking Water Contaminants
• Standards: – State and federal Maximum Contaminant Levels (MCLs)– Enforceable– Require monitoring of all public water systems.
• Water systems with contamination are expected to be identified.
• Guidance:– USEPA Health Advisories; state guidance values– Not enforceable – voluntary action is often taken.– Monitoring of public water systems is not required.
• Water systems with contamination may not be identified.

State PFAS MCLs & Guidance Values
• In general, state MCLs and guidance values: – May address contaminants with no federal MCLs such as PFAS.– May be more stringent than federal MCLs.
• Some states have developed MCLs for many years, including for PFAS.
• Additional states never previously developed MCLs, but have developed PFAS MCLs or plan to do so.– Due to nationwide concerns about PFAS in drinking water.
• Other states do not currently plan to develop PFAS MCLs. – They are generally using the USEPA Health Advisories for PFOA and
PFOS as guidance.

USEPA & State PFAS Drinking Water Guidelines (ng/L; ppt)(Includes Standards & Guidance Values - Proposed, Recommended & Final )
PFOA PFOS PFNA PFHxS PFHpA PFDA Total? PFBA PFHxA PFBS GenX
EPA 70 70 --- --- --- --- Yes (2) --- --- --- ---
CA* 14 13 --- --- --- --- No (2) --- --- --- ---
CT 70 70 70 70 70 --- Yes (5) --- --- --- ---
MA** 20 20 20 20 20 20 Yes (6) --- --- 2000 ---
MI** 8 16 6 51 --- --- No --- 400,000 420 370
MN 35 15 --- 47 --- --- No 7000 --- 2000 ---
NH 12 15 11 18 --- --- No --- --- --- ---
NJ 14** 13** 13 --- --- --- No --- --- --- ---
NY** 10 10 --- --- --- --- No --- --- --- ---
NC --- --- --- --- --- --- --- --- --- --- 140
VT 20 20 20 20 20 --- Yes (5) --- --- --- ---
States not listed generally use USEPA Health Advisories of 70 ng/L for PFOA and PFOS as guidance.
*CA accepted NJ PFOA and PFOS MCLs for use as notification levels. **Proposed, recommended, or draft.

State & USEPA PFOA Drinking Water Guidelines: 2002-2019(Note Logarithmic Scale)
MN
MN
MN
NJ
MN
US EPA
US EPA
MN
NJVT
NH
NH
NY MI
1
10
100
1000
10000
100000
1000000
2000 2005 2010 2015 2020
WV
.
.CA .MA
.
Year
ng
/L (
pp
t)

MN
MI
MN
MN
US EPA
US EPA
MN
NJ
NH
NH
NYMN
1
10
100
1000
2000 2005 2010 2015 2020
..
ng
/L (
pp
t)
Year
State & USEPA PFOS Drinking Water Guidelines: 2002-2019(Note Logarithmic Scale)
.CA
.VT .MA

Numerical Ranges of State Drinking Water Guidelines for PFOA & PFOS
• 8 states have developed PFOA & PFOS guidelines below USEPA Health Advisories (70 ng/L) since 2016.
• Range of state values:
• PFOA: 8 to 35 ng/L (ppt)
• PFOS: 10 to 20 ng/L (ppt)
• In general, states follow USEPA risk assessment guidance. However….• Risk assessment is not a “cookbook” – involves scientific judgement.
• Scientists who review the same data and use the same risk assessment guidelines may come to different conclusions.
• Numerical differences among state values are not large (2 - 4 fold range):
• In the context of independently derived risk-based values.
• Especially as compared to older values that were generally 100s to 1000s of ppt, and up to 150,000 ppt…

Toxicity Basis of State Guidelines: Consideration of Human Epidemiology Data
• Animal toxicology data is the primary basis of all state guidelines.
• States generally conclude that there is substantial evidence for multiple human health effects at low exposures.
• However, states have generally concluded that limitations preclude human data as quantitative basis for risk assessment.
• Exposures to multiple PFAS are often correlated, preventing determination of dose-response for individual PFAS.
• Several states compare serum PFAS levels associated with human health effects to serum PFAS levels predicted from exposure at the drinking water guideline.

Toxicity Basis of State Guidelines: Consideration of Carcinogenic Effects
• Non-cancer effects (e.g. Reference Dose) are the primary basis of all current state PFAS guidelines.
• PFOA and PFOS (and GenX) are classified by USEPA as having “Suggestive Evidence of Carcinogenic Potential.”
• States that evaluated cancer risk concluded that guidelines based on non-cancer effects are protective for cancer risk at the 1-in-1 million risk level.
• For example, NJ PFOA drinking water values are identical (14 ng/L) for non-cancer and cancer endpoints.
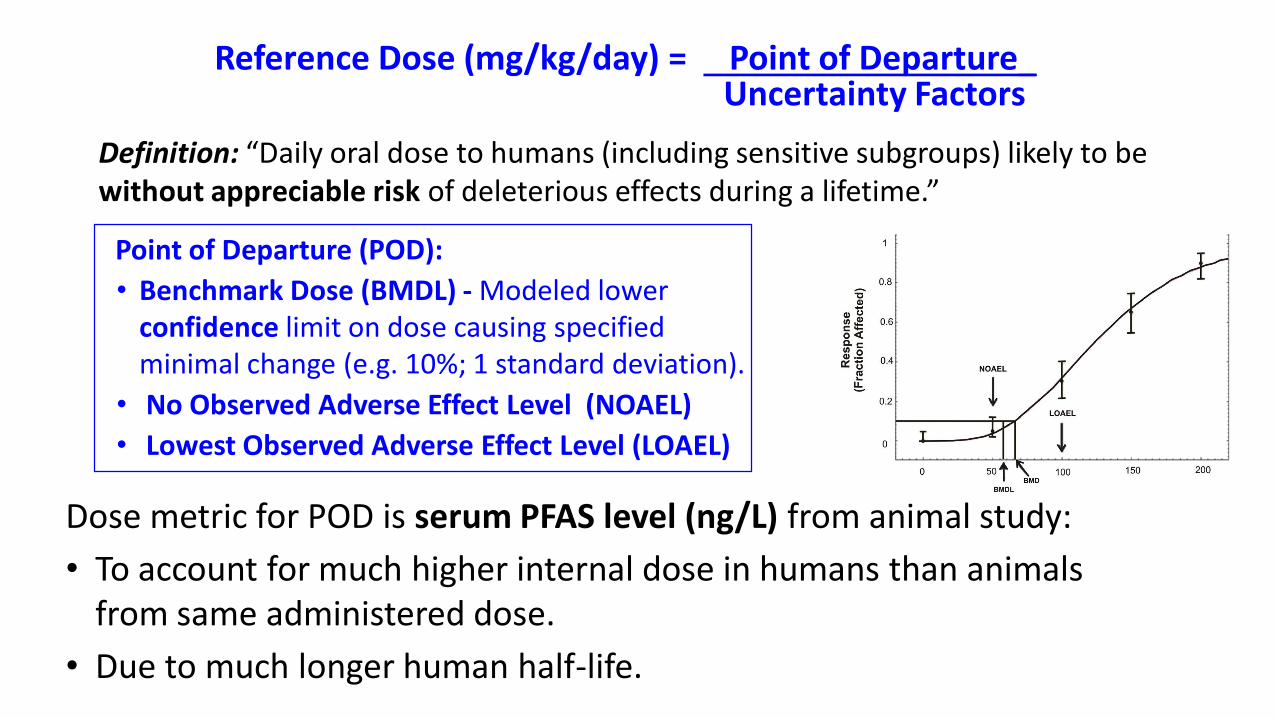
Reference Dose (mg/kg/day) = Point of Departure_Uncertainty Factors
Point of Departure (POD):
• Benchmark Dose (BMDL) - Modeled lower confidence limit on dose causing specified minimal change (e.g. 10%; 1 standard deviation).
• No Observed Adverse Effect Level (NOAEL)
• Lowest Observed Adverse Effect Level (LOAEL)
Dose metric for POD is serum PFAS level (ng/L) from animal study:
• To account for much higher internal dose in humans than animals from same administered dose.
• Due to much longer human half-life.
Definition: “Daily oral dose to humans (including sensitive subgroups) likely to be without appreciable risk of deleterious effects during a lifetime.”

PFAS Reference Dose (RfD) Development Process*
Serum Level Point of Departure (POD) for critical toxicological effect from animal study (ng/ml; BMDL, NOAEL, or LOAEL)
Target Human Serum Level (ng/L)
Apply Clearance Factor** (relates serum level to human dose)
Target Human Serum Level (ng/L) x Clearance Factor (L/kg/day) = Reference Dose (ng/kg/day)
Reference Dose (ng/kg/day)
Apply Uncertainty Factors
**CL (L/kg/day) = Volume of Distribution (L) x (ln 2 ÷ t1/2 [days])
*Order of application of Uncertainty Factors and Clearance Factors may be reversed in some states’ processes -Does not affect resulting Reference Dose.

Toxicity Basis of State Guidelines: Sensitive Effects Not Considered by USEPA
• 7 states consider more sensitive (or appropriate) toxicity endpoints than USEPA (2016).• One state uses USEPA Reference Doses.
• PFOA: USEPA endpoints - Developmental effects (delayed ossification; accelerated puberty in males) in mice. ➢More sensitive critical effect: Mouse neurobehavioral & skeletal effects from
developmental exposure (ATSDR endpoints; 1 state).• ↑ liver weight – not necessarily more sensitive than USEPA endpoints, but
dose-response more appropriate for use in RfD (4 states).
➢Database Uncertainty Factor of 3 or 10: More sensitive mouse developmental effects such as delayed mammary gland development (7 states).
• PFOS: USEPA endpoints - ↓ offspring body weight in rats.➢More sensitive critical effect: Immune suppression (↓ antibody response) in mice
(6 states).
➢Database Uncertainty Factor of 3: More sensitive developmental thyroid effects in rats (2 states); more sensitive immune effects (1 state).

PFOA: Dose-Response for Developmental Endpoints (USEPA) & Increased Liver Weight (4 States)
4
6
8
10
12
14
16
18
20
0 50 100 150 200 250
Me
an
R
esp
on
se
dose
Exponential 4 Model, with BMR of 0.1 Rel. Dev. for the BMD and 0.95 Lower Confidence Limit for the BMDL
11:27 03/24 2016
BMDBMDL
Exponential 4
BMD Modeling for Increased Liver Weight(Loveless et al., 2006)

Toxicity Basis of State Guidelines: Toxicokinetic Considerations
• Point of Departure is serum PFAS level from animal study (all states):
• Measured at end of dosing period (PFOA: 4 states; PFOS: 6 states)
• Modeled average (PFOA: 4 states; PFOS: 2 states)
Serum Level (ng/L) x Clearance Factor (L/kg/day) = Human Dose (ng/kg/day)
Clearance Factor (L/kg/day) = Volume of Distribution (L) x (ln 2 ÷ Half-life [days])
• Clearance Factor to convert serum PFAS level from animal study to human external dose (all states).
• PFOA: USEPA Clearance Factor using 2.3 year half-life from community with drinking water exposure (all states)
• PFOS:
• USEPA Clearance Factor with 5.4 year half-life from retired workers (5 states).
• Clearance Factor with 3.4 year half-life from community with drinking water exposure (3 states).

Uncertainty Factors (UFs) Used in State PFOA & PFOS RfDs
UF PFOA PFOS Comments
Human Variability
10 (all 8 states)
Default for RfDs based on animal data
Animal-to-human
3 (all 8 states)
Full factor of 10 not used. Toxicokinetic differences accounted for by serum PFAS level as dose metric.
LOAEL-to-NOAEL
3 (2 states)10 (2 states)1 (4 states)
1(all 8 states)
UF of 1 used for RfDs based on BMDL or NOAEL
Less than chronic
duration
1(all 8 states)
• Not used for developmental effects • States concluded that this UF is not
appropriate for other critical effects of PFOA & PFOS from shorter studies.
Database3 (6 states)
10 (1 state)1 (1 state)
3 (3 states)1 (5 states)
For potentially more sensitive toxicological effects
TOTAL 100 - 1000 30 - 100
NOTE: UF of “1” means UF was not applied

Toxicological Basis: State Reference Doses for PFOANJ/CA NH NY MI MN VT/USEPA MA
CriticalEffect
Increased liver weight
Developmental
Neurobehavioral; Skeletal*
Accelerated puberty (males); Delayed ossification
Species Mouse
Study Loveless 2006
Macon 2011
Onishchenko 2011; Koskela 2006*
Lau, 2006
Serum PFOA Metric Measured Modeled average
Point of Departure BMDL LOAEL
Clearance Factor
From USEPA Health Advisory (to convert serum PFOA level to human administered dose)
Intraspecies UF 10
Interspecies UF 3
LOAEL-NOAEL UF 1 3 3 10
Database UF 10 3 3 3 3 1 3
TOTAL UF 300 100 100 300 300 300 1000
RfD (ng/kg/day) 2 6.1 1.5 3.9 18 20 5
*Studies and endpoints used in draft ATSDR (2018) Minimal Risk Level

Toxicological Basis: State Reference Doses for PFOS
NJ/CA/NY MI MN/NH MA VT/USEPA
Critical Effect antibody response to foreign antigenDevelopmental:
body weight in offspring
Species Mouse Rat
Study Dong 2009 Dong 2011 Luebker 2005
Serum PFOA Metric Measured Modeled average
Point of Departure NOAEL
Clearance Factor
From USEPA HA; based on t1/2 of 5.4 years
(Olsen 2007)
Based on t1/2 of 3.4 years (Li et al., 2017)
From USEPA HA;based on t1/2 of 5.4 years
(Olsen 2007)
Intraspecies UF 10
Interspecies UF 3
Database UF 1 3 1
TOTAL UF 30 100 30
RfD (ng/kg/day) 1.8 or 2* 2.9 3 5 20
*Difference due to rounding

Comparison of State, ATSDR (Draft) & EFSA Toxicity Factors with USEPA Reference Doses for PFOA & PFOS
AgencyPFOA PFOS
Primary Difference in Basisng/kg/day
USEPA RfD (2016) 20 20 ----
State RfDs(2016-2019)
2 – 6.1 (6 states)
USEPA (2 states)
1.8 – 5 (7 states)
USEPA (1 state)
Consider more sensitive toxicity endpoints as Critical Effect and/or with Database Uncertainty Factor.
ATSDR Minimal Risk Levels (draft, 2018)*
3 2
European Food Safety Authority Tolerable Daily
Intakes (provisional, 2018)**
0.8 2
Based on human epidemiology data:• PFOA: cholesterol ( liver enzyme ALT; birth wt.)
• PFOS: cholesterol, vaccine response ( birth wt.)
*ATSDR (Draft) MRLs are for Intermediate exposure (15 days – 1 year). ** Tolerable Weekly Intakes 7

Exposure Assumptions in State Guidelines: Drinking Water Ingestion
• ↑ Ingestion rate (L/kg body wt./day) ↓ Drinking water guideline.
• Target populations and approaches (constant ingestion rate or toxicokinetic model).
• Default adult (upper percentile) - 0.029 L/kg/day (2 states).
• Lactating woman (80th percentile) - 0.054 L/kg/day (2 states).
• Infant, 0-1 years old (95th percentile) - 0.175 L/kg/day (1 state).
• Higher exposure of breast-fed infant – MN Dept. of Health toxicokinetic model (3 states).
Drinking Water Guideline (ng/L) =
Reference Dose (ng/kg/day) x Relative Source Contribution (%)Water Ingestion Rate (L/kg/day)

Minnesota Dept. of Health Model for Early Life PFAS Drinking Water Exposure (Goeden et al., 2019)
• Infant exposures higher than in older individuals.
• From breast milk or formula:
• Higher PFAS levels in breast milk than in mother’s drinking water.
• Infants ingest much more fluid per body weight.
• Sensitive subpopulation for developmental & other short-term effects.
• Model considers: • Prenatal exposure from maternal
drinking water consumption.
• Breast milk for 1 year.
• Followed by lifetime drinking water exposure.

• Percent of total exposure assumed to come from drinking water.• Accounts for non-drinking water exposures (e.g. food, consumer products).
• Total exposure from drinking water + other sources should not exceed Reference Dose.
• ↑ RSC ↑ drinking water guideline.
• Default RSC: 20% (4 states).
• Chemical-specific RSC:o Can be developed if data are available.
o 20% to 80% (per USEPA guidelines).
o NHANES serum PFAS data (95th percentile)
o Has been used to represent non-drinking water exposures in general population.
o 50% (3 states); 60% (1 state).
Drinking Water Guideline (ng/L) =
Reference Dose (ng/kg/day) x Relative Source Contribution (%)Water Ingestion Rate (L/kg/day)
Exposure Assumptions in State Guidelines: Relative Source Contribution (RSC)

PFOA: USEPA & State Reference Doses, Exposure Assumptions & Drinking Water Guidelines
EPA MA VT NJ / CA MN MI NH NY
Reference Dose
(ng/kg/day)20 5 20 2 18 3.9 6.1 1.5
Ingestion Rate or
Exposure Model
0.054 L/kg/day
Lactating woman (80th %)
0.175 L/kg/day
Infant (0-1 yr; 95th %)
0.029 L/kg/day
Default adult
(upper %)
Modeled: • Prenatal exposure.• Breast milk - 1 yr.• Followed by lifetime
drinking water exposure.
Not specified
(0.029 -0.175
L/kg/day considered)
Relative Source
Contribution20% 50% 60%
Guideline (ng/L)
70 20 20 14 35 8 12 10

PFOS: USEPA & State Reference Doses, Exposure Assumptions & Drinking Water Guidelines
EPA MA VT NJ / CA MI MN/NH NY
Reference Dose
(ng/kg/day)20 5 20 1.8 2.9 3 2
Ingestion Rate or
Exposure Model
0.054 L/kg/day
Lactating woman (80th %)
0.175 L/kg/day
Infant (0-1 yr; 95th %)
0.029 L/kg/day
Default adult
(upper %)
Modeled: • Prenatal exposure.• Breast milk - 1 yr.• Followed by lifetime
drinking water exposure.
Not specified
(0.029 -0.175
L/kg/day considered)
Relative Source
Contribution20% 50% 60%
Guideline (ng/L)
70 20 20 13 16 15 10

State Guidelines: Consideration of Increase in Serum PFAS Levels
• At least 5 states compare serum PFAS levels associated with human health effects to serum levels predicted from d drinking water exposure.
• Increase in serum PFAS level:o Can be predicted from
Clearance Factor and drinking water ingestion rate.
o Consistent with empirical data from exposed communities.
• These 5 states conclude that serum PFAS levels predicted from USEPA Health Advisory (70 ng/L) are well above those associated with several health endpoints in human epidemiology studies.

State Guidelines: Application to Individual or Total Long-Chain PFAS
• 6 states apply guidelines to long-chain PFAS individually.
• 3 states apply guidelines to total of 5 or 6 long-chain PFAS based on:• Similar structures; Long human half-lives; Generally similar toxic effects.
PFOA PFOS PFNA PFHxS PFHpA PFDA Total? PFBA PFHxA PFBS GenX
EPA 70 70 --- --- --- --- Yes (2) --- --- --- ---
CA 14 13 --- --- --- --- No (2) --- --- --- ---
CT 70 70 70 70 70 --- Yes (5) --- --- --- ---
MA 20 20 20 20 20 20 Yes (6) --- --- 2000 ---
MI 8 16 6 51 --- --- No --- 400,000 420 370
MN 35 15 --- 47 --- --- No 7000 --- 2000 ---
NH 12 15 11 18 --- --- No --- --- --- ---
NJ 14 13 13 --- --- --- No --- --- --- ---
NY 10 10 --- --- --- --- No --- --- --- ---
NC --- --- --- --- --- --- --- --- --- --- 140
VT 20 20 20 20 20 --- Yes (5) --- --- --- ---

Summary & Conclusions• Since 2016, 8 states have developed drinking water guidelines for PFOA & PFOS below
the USEPA (2016) Health Advisories of 70 ng/L.
• The state guideline values range from 8 – 35 ng/L for PFOA and 10 – 20 ng/L for PFOS.
• These recent state guidelines are 1 to 4 orders of magnitude lower than almost all
pre-2016 USEPA and state PFOA and PFOS guidelines.
• Both toxicity and exposure considerations are important in determining the guideline
values.
• Almost all of the state guidelines consider toxicological effects that are more sensitive
than those used by USEPA.
• All of the state guidelines use serum PFAS level as the dose metric, and all use a
Clearance Factor to relate serum PFAS level to human administered dose.
• Application of drinking water guidelines to individual long-chain PFAS vs. total long
chain PFAS is a major difference among states.

Thank you!
This PowerPoint will be posted on the conference website.
For questions or additional information:
(609) 292-8497
30

EXTRA SLIDES

Relationship Between Drinking Water and Increased in Blood Serum Concentrations for Long-Chain PFAAs
• Clearance factor (CL) - relates external dose to blood serum level. • PFOA (Lorber & Egeghy, 2011): PFOS (USEPA, 2016). • CL (L/kg/day) = Volume of Distribution (L) x (ln 2 ÷ Half-life [days])
• Combine clearance factor with average water ingestion rate (USEPA Exposure Factors Handbook) to relate drinking water concentration to increase in serum level.
Dose (µg/kg/day) = Serum Conc. (µg/L) x CL (L/kg/day)
Dose (µg/kg/day) = Drinking Water Conc. (μg/L) x Ingestion Rate (L/kg/day)
Serum:Drinking Water Ratio = Serum Conc. (μg/L) = Ingestion Rate (L/day)Drinking Water Conc. (μg/L) CL (L/kg/day)
• PFOA - Predicted serum:drinking water ratios for increase in serum levels:• 114:1 - average water consumption.• 200:1 - upper percentile water consumption.
• Ratio of >100:1 supported by empirical data from several studies over a wide range of drinking water levels (<10 ng/L to >10,000 ng/L).• Several locations – Little Hocking, Ohio; other Ohio & West Virginia C8 Study sites;
Minnesota; Hoosick Falls, NY.
• Higher ratios predicted for PFOS, PFNA & other PFAAs with longer half-lives.
PFOA - Delayed Mammary Gland Development as Basis for NJ RfD
• Sensitive – Occurs in offspring at doses/serum levels below those that increase offspring liver weight.
• Well established - 9 mouse studies; from gestational and/or lactational exposure.
– Only one negative study, which has problematic issues.
– Differing mouse strain susceptibility consistent with toxicokinetic differences.
• Adverse - Structural changes persist until adulthood.
• Human relevance – No reason to discount based on mode of action.
• Insufficient data to make conclusions about effects on lactational function.
– Evaluated in only one study.
– Several human studies associate PFOA with duration of breastfeeding.

PFOA: Increased Liver Weight as Basis for NJ RfD
• Well established effect in non-human primates and rodents.
• Most sensitive effect with serum data needed for dose-response analysis, except mammary gland delay.
• Increased liver weight and/or hepatocellular hypertrophy co-occurred with and/or progressed to more severe hepatic effects:
Example: Chronic rat study suggests “progression of lesions… from hepatocellular hypertrophy to fatty degeneration to necrosis followed by regenerative hyperplasia” (Butenhoff et al., 2012).
• From Hall et al. (2012) criteria (cited by USEPA):
“[Increased liver weight and hepatocellular hypertrophy] may be reversible if the anticipated duration of exposure is short, while progression to more severe hepatic effects may occur from longer exposures to the same dose…. In this case, the combination of dose level and duration of exposure….. would now be considered adverse.”
• Reversibility is not relevant to chronic exposure duration of MCLs.

PFOA: Mode of Action for Hepatic Effects
• Primary issues:
– Human relevance of rodent effects.
– Role of PPAR-α in non-carcinogenic hepatic effects.
• Extensive review of data from:
– Non-human primates (monkeys),
– Standard rodent strains.
– PPAR-alpha null (“knockout”) mice.
– Mice with humanized PPAR-alpha.
– Human tissues.
– In vitro studies.
• Overall conclusion: Non-carcinogenic hepatic effects of PFOA are relevant to humans for the purposes of risk assessment.

• NJ Reference Dose (RfD) of 1.8 ng/kg/day based on decreased plaque forming cell response in male mice exposed for 60 days (Dong et al., 2009).– Measures antibody response to foreign antigen. – More sensitive than rat pup weight used for USEPA RfD (20 ng/kg/day).
• Well established – 4 positive studies; only 1 negative study.– Study with lowest LOAEL was not used for RfD.
• No reason to discount human relevance.
• Supported by human associations:
PFOS: Decreased Plaque Forming Cell Response as Basis for NJ RfD (Pachkowski et al., Env. Research, 2019)
– Decreased antibody response to vaccines:analogous human effect.
– Increased incidence of infectious disease.
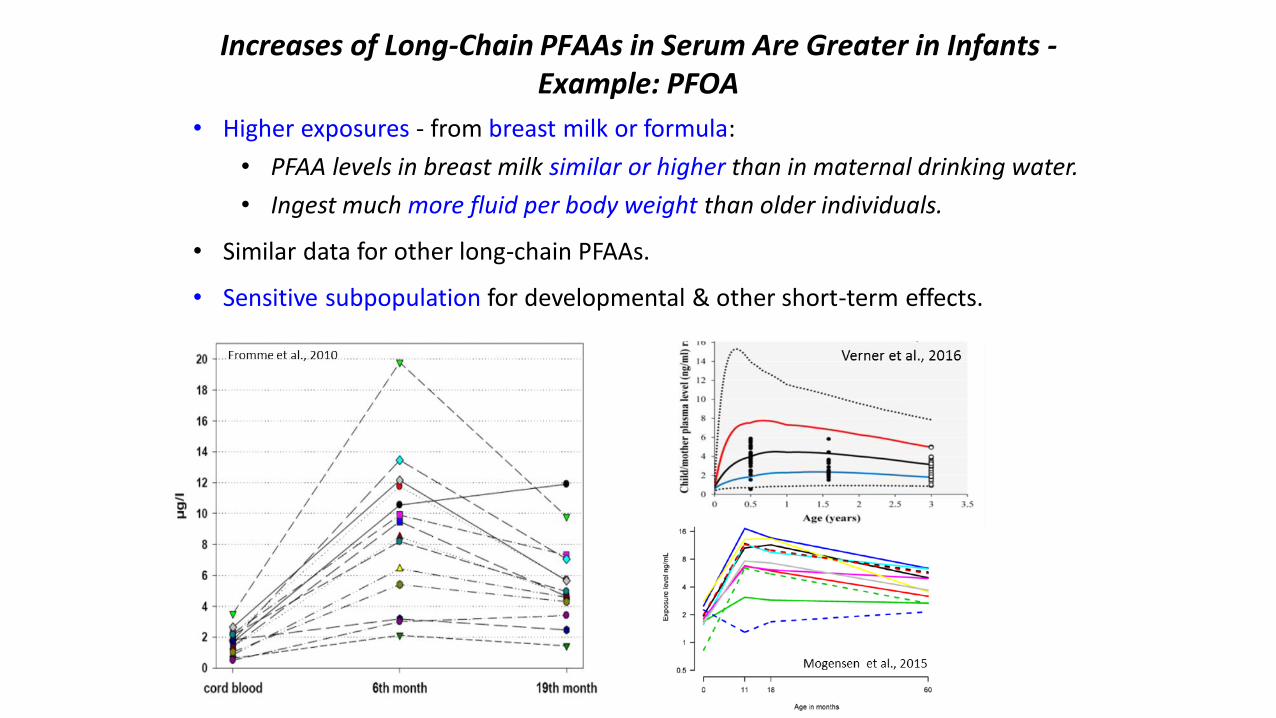
Increases of Long-Chain PFAAs in Serum Are Greater in Infants -Example: PFOA
• Higher exposures - from breast milk or formula:
• PFAA levels in breast milk similar or higher than in maternal drinking water.
• Ingest much more fluid per body weight than older individuals.
• Similar data for other long-chain PFAAs.
• Sensitive subpopulation for developmental & other short-term effects.