human emotional response to energy visualisations … · human emotional response to energy...
TRANSCRIPT
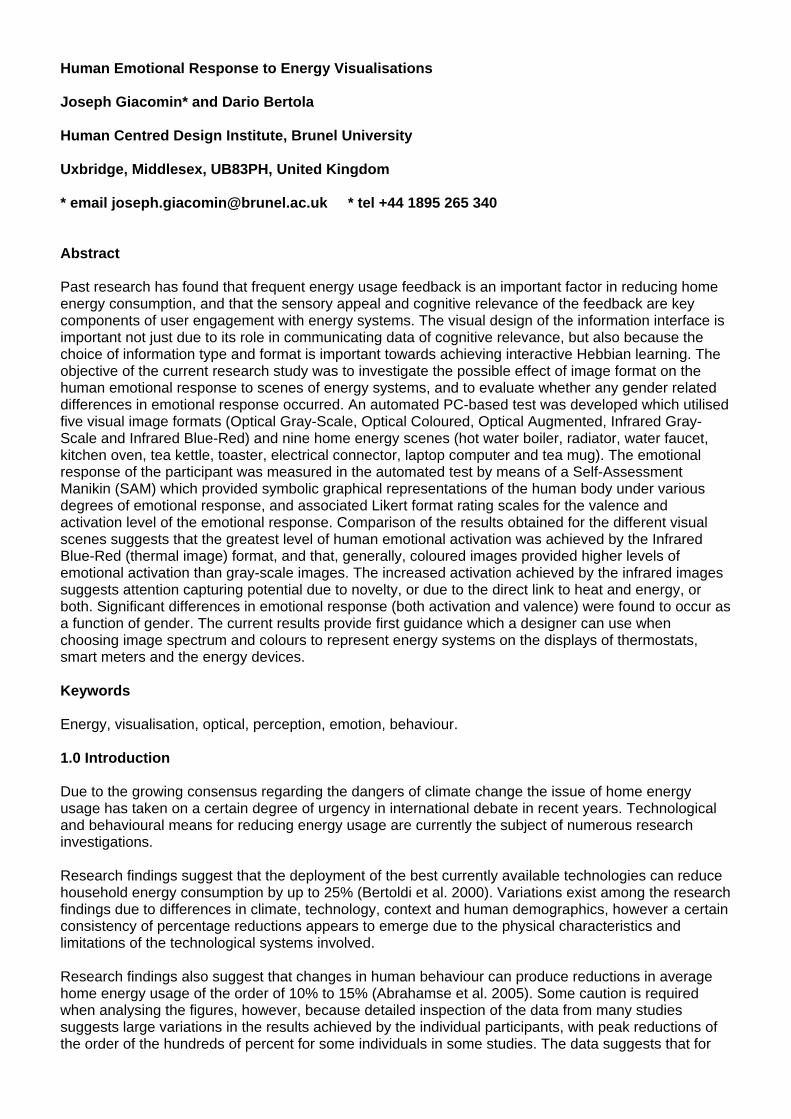
Human Emotional Response to Energy Visualisations Joseph Giacomin* and Dario Bertola Human Centred Design Institute, Brunel University Uxbridge, Middlesex, UB83PH, United Kingdom * email [email protected] * tel +44 1895 265 340 Abstract Past research has found that frequent energy usage feedback is an important factor in reducing home energy consumption, and that the sensory appeal and cognitive relevance of the feedback are key components of user engagement with energy systems. The visual design of the information interface is important not just due to its role in communicating data of cognitive relevance, but also because the choice of information type and format is important towards achieving interactive Hebbian learning. The objective of the current research study was to investigate the possible effect of image format on the human emotional response to scenes of energy systems, and to evaluate whether any gender related differences in emotional response occurred. An automated PC-based test was developed which utilised five visual image formats (Optical Gray-Scale, Optical Coloured, Optical Augmented, Infrared Gray-Scale and Infrared Blue-Red) and nine home energy scenes (hot water boiler, radiator, water faucet, kitchen oven, tea kettle, toaster, electrical connector, laptop computer and tea mug). The emotional response of the participant was measured in the automated test by means of a Self-Assessment Manikin (SAM) which provided symbolic graphical representations of the human body under various degrees of emotional response, and associated Likert format rating scales for the valence and activation level of the emotional response. Comparison of the results obtained for the different visual scenes suggests that the greatest level of human emotional activation was achieved by the Infrared Blue-Red (thermal image) format, and that, generally, coloured images provided higher levels of emotional activation than gray-scale images. The increased activation achieved by the infrared images suggests attention capturing potential due to novelty, or due to the direct link to heat and energy, or both. Significant differences in emotional response (both activation and valence) were found to occur as a function of gender. The current results provide first guidance which a designer can use when choosing image spectrum and colours to represent energy systems on the displays of thermostats, smart meters and the energy devices. Keywords Energy, visualisation, optical, perception, emotion, behaviour. 1.0 Introduction Due to the growing consensus regarding the dangers of climate change the issue of home energy usage has taken on a certain degree of urgency in international debate in recent years. Technological and behavioural means for reducing energy usage are currently the subject of numerous research investigations. Research findings suggest that the deployment of the best currently available technologies can reduce household energy consumption by up to 25% (Bertoldi et al. 2000). Variations exist among the research findings due to differences in climate, technology, context and human demographics, however a certain consistency of percentage reductions appears to emerge due to the physical characteristics and limitations of the technological systems involved. Research findings also suggest that changes in human behaviour can produce reductions in average home energy usage of the order of 10% to 15% (Abrahamse et al. 2005). Some caution is required when analysing the figures, however, because detailed inspection of the data from many studies suggests large variations in the results achieved by the individual participants, with peak reductions of the order of the hundreds of percent for some individuals in some studies. The data suggests that for
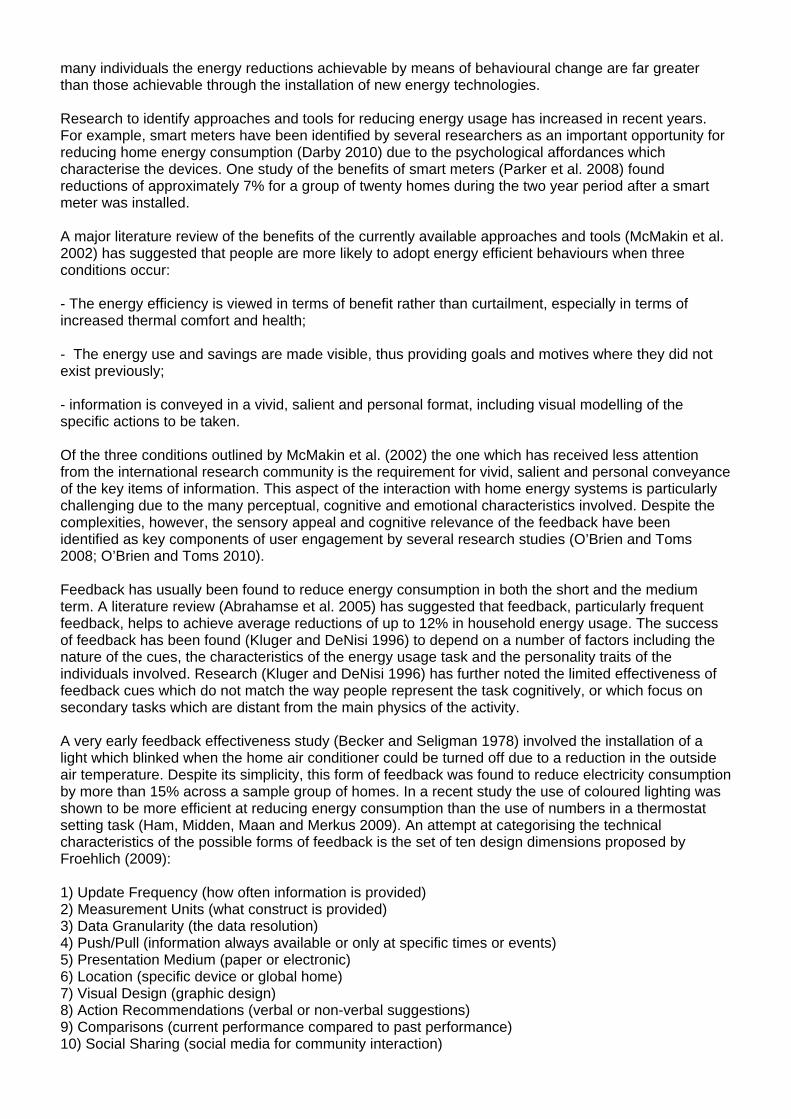
many individuals the energy reductions achievable by means of behavioural change are far greater than those achievable through the installation of new energy technologies. Research to identify approaches and tools for reducing energy usage has increased in recent years. For example, smart meters have been identified by several researchers as an important opportunity for reducing home energy consumption (Darby 2010) due to the psychological affordances which characterise the devices. One study of the benefits of smart meters (Parker et al. 2008) found reductions of approximately 7% for a group of twenty homes during the two year period after a smart meter was installed. A major literature review of the benefits of the currently available approaches and tools (McMakin et al. 2002) has suggested that people are more likely to adopt energy efficient behaviours when three conditions occur: - The energy efficiency is viewed in terms of benefit rather than curtailment, especially in terms of increased thermal comfort and health; - The energy use and savings are made visible, thus providing goals and motives where they did not exist previously; - information is conveyed in a vivid, salient and personal format, including visual modelling of the specific actions to be taken. Of the three conditions outlined by McMakin et al. (2002) the one which has received less attention from the international research community is the requirement for vivid, salient and personal conveyance of the key items of information. This aspect of the interaction with home energy systems is particularly challenging due to the many perceptual, cognitive and emotional characteristics involved. Despite the complexities, however, the sensory appeal and cognitive relevance of the feedback have been identified as key components of user engagement by several research studies (O’Brien and Toms 2008; O’Brien and Toms 2010). Feedback has usually been found to reduce energy consumption in both the short and the medium term. A literature review (Abrahamse et al. 2005) has suggested that feedback, particularly frequent feedback, helps to achieve average reductions of up to 12% in household energy usage. The success of feedback has been found (Kluger and DeNisi 1996) to depend on a number of factors including the nature of the cues, the characteristics of the energy usage task and the personality traits of the individuals involved. Research (Kluger and DeNisi 1996) has further noted the limited effectiveness of feedback cues which do not match the way people represent the task cognitively, or which focus on secondary tasks which are distant from the main physics of the activity. A very early feedback effectiveness study (Becker and Seligman 1978) involved the installation of a light which blinked when the home air conditioner could be turned off due to a reduction in the outside air temperature. Despite its simplicity, this form of feedback was found to reduce electricity consumption by more than 15% across a sample group of homes. In a recent study the use of coloured lighting was shown to be more efficient at reducing energy consumption than the use of numbers in a thermostat setting task (Ham, Midden, Maan and Merkus 2009). An attempt at categorising the technical characteristics of the possible forms of feedback is the set of ten design dimensions proposed by Froehlich (2009): 1) Update Frequency (how often information is provided) 2) Measurement Units (what construct is provided) 3) Data Granularity (the data resolution) 4) Push/Pull (information always available or only at specific times or events) 5) Presentation Medium (paper or electronic) 6) Location (specific device or global home) 7) Visual Design (graphic design) 8) Action Recommendations (verbal or non-verbal suggestions) 9) Comparisons (current performance compared to past performance) 10) Social Sharing (social media for community interaction)
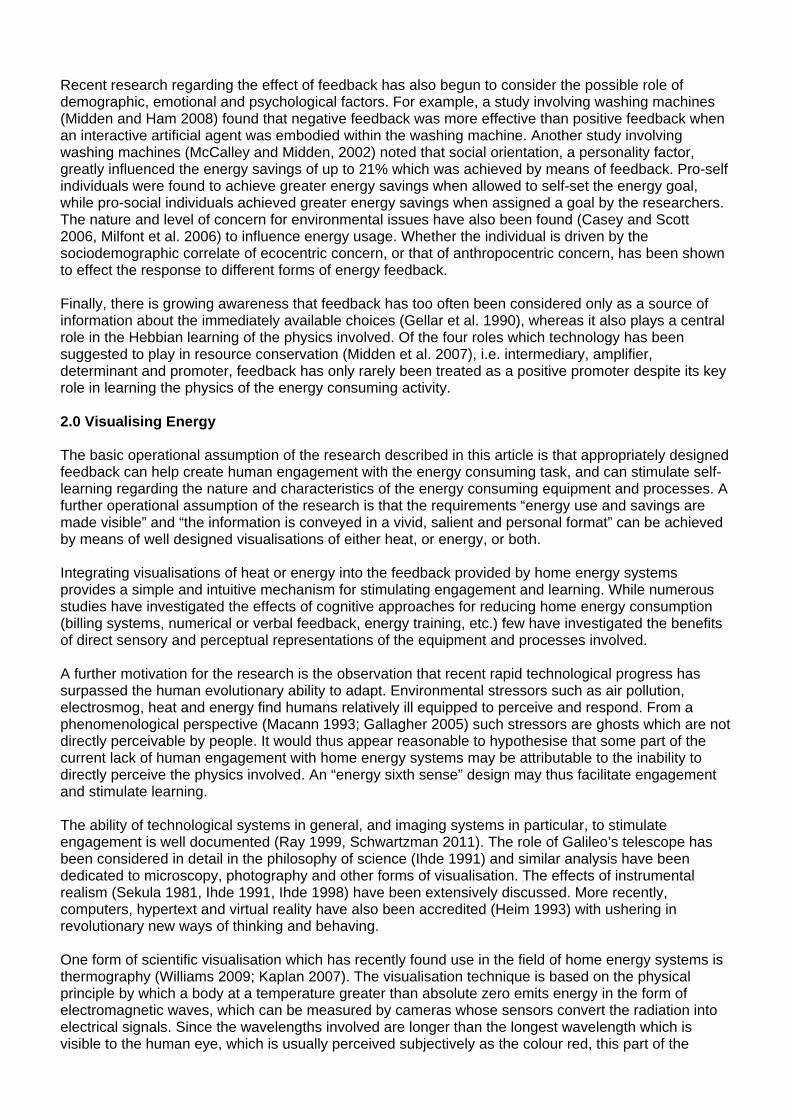
Recent research regarding the effect of feedback has also begun to consider the possible role of demographic, emotional and psychological factors. For example, a study involving washing machines (Midden and Ham 2008) found that negative feedback was more effective than positive feedback when an interactive artificial agent was embodied within the washing machine. Another study involving washing machines (McCalley and Midden, 2002) noted that social orientation, a personality factor, greatly influenced the energy savings of up to 21% which was achieved by means of feedback. Pro-self individuals were found to achieve greater energy savings when allowed to self-set the energy goal, while pro-social individuals achieved greater energy savings when assigned a goal by the researchers. The nature and level of concern for environmental issues have also been found (Casey and Scott 2006, Milfont et al. 2006) to influence energy usage. Whether the individual is driven by the sociodemographic correlate of ecocentric concern, or that of anthropocentric concern, has been shown to effect the response to different forms of energy feedback. Finally, there is growing awareness that feedback has too often been considered only as a source of information about the immediately available choices (Gellar et al. 1990), whereas it also plays a central role in the Hebbian learning of the physics involved. Of the four roles which technology has been suggested to play in resource conservation (Midden et al. 2007), i.e. intermediary, amplifier, determinant and promoter, feedback has only rarely been treated as a positive promoter despite its key role in learning the physics of the energy consuming activity. 2.0 Visualising Energy The basic operational assumption of the research described in this article is that appropriately designed feedback can help create human engagement with the energy consuming task, and can stimulate self-learning regarding the nature and characteristics of the energy consuming equipment and processes. A further operational assumption of the research is that the requirements “energy use and savings are made visible” and “the information is conveyed in a vivid, salient and personal format” can be achieved by means of well designed visualisations of either heat, or energy, or both. Integrating visualisations of heat or energy into the feedback provided by home energy systems provides a simple and intuitive mechanism for stimulating engagement and learning. While numerous studies have investigated the effects of cognitive approaches for reducing home energy consumption (billing systems, numerical or verbal feedback, energy training, etc.) few have investigated the benefits of direct sensory and perceptual representations of the equipment and processes involved. A further motivation for the research is the observation that recent rapid technological progress has surpassed the human evolutionary ability to adapt. Environmental stressors such as air pollution, electrosmog, heat and energy find humans relatively ill equipped to perceive and respond. From a phenomenological perspective (Macann 1993; Gallagher 2005) such stressors are ghosts which are not directly perceivable by people. It would thus appear reasonable to hypothesise that some part of the current lack of human engagement with home energy systems may be attributable to the inability to directly perceive the physics involved. An “energy sixth sense” design may thus facilitate engagement and stimulate learning. The ability of technological systems in general, and imaging systems in particular, to stimulate engagement is well documented (Ray 1999, Schwartzman 2011). The role of Galileo’s telescope has been considered in detail in the philosophy of science (Ihde 1991) and similar analysis have been dedicated to microscopy, photography and other forms of visualisation. The effects of instrumental realism (Sekula 1981, Ihde 1991, Ihde 1998) have been extensively discussed. More recently, computers, hypertext and virtual reality have also been accredited (Heim 1993) with ushering in revolutionary new ways of thinking and behaving. One form of scientific visualisation which has recently found use in the field of home energy systems is thermography (Williams 2009; Kaplan 2007). The visualisation technique is based on the physical principle by which a body at a temperature greater than absolute zero emits energy in the form of electromagnetic waves, which can be measured by cameras whose sensors convert the radiation into electrical signals. Since the wavelengths involved are longer than the longest wavelength which is visible to the human eye, which is usually perceived subjectively as the colour red, this part of the
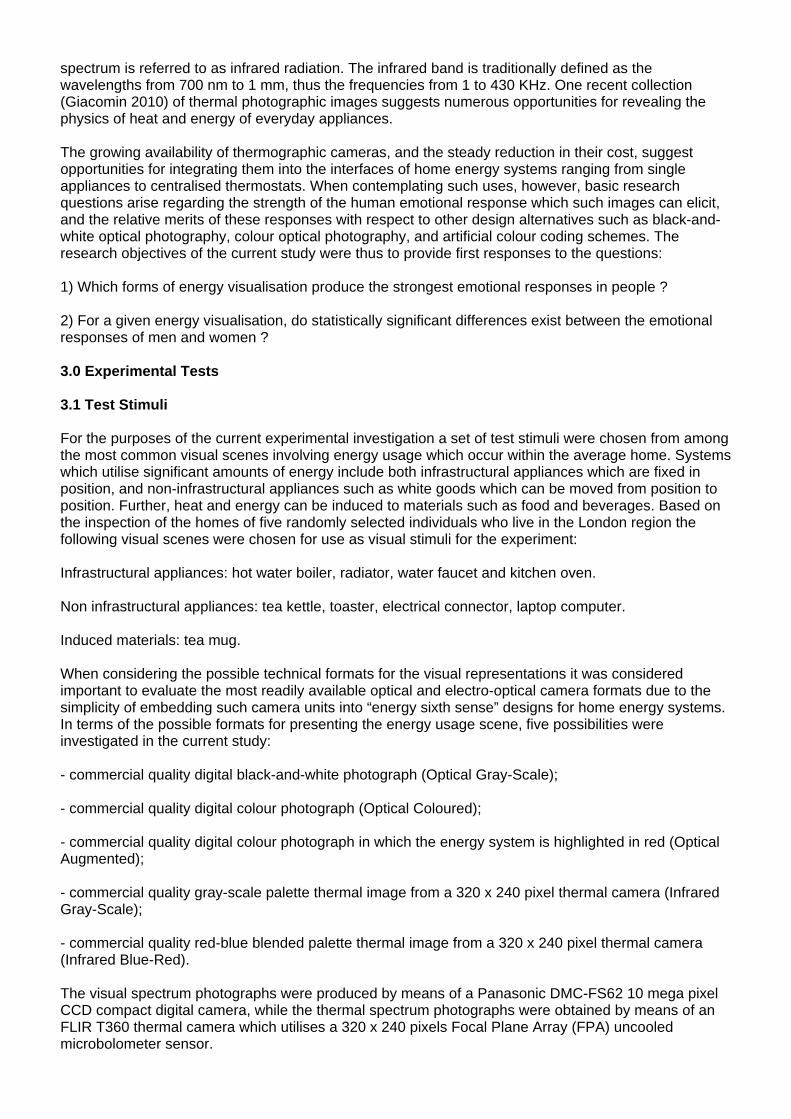
spectrum is referred to as infrared radiation. The infrared band is traditionally defined as the wavelengths from 700 nm to 1 mm, thus the frequencies from 1 to 430 KHz. One recent collection (Giacomin 2010) of thermal photographic images suggests numerous opportunities for revealing the physics of heat and energy of everyday appliances. The growing availability of thermographic cameras, and the steady reduction in their cost, suggest opportunities for integrating them into the interfaces of home energy systems ranging from single appliances to centralised thermostats. When contemplating such uses, however, basic research questions arise regarding the strength of the human emotional response which such images can elicit, and the relative merits of these responses with respect to other design alternatives such as black-and-white optical photography, colour optical photography, and artificial colour coding schemes. The research objectives of the current study were thus to provide first responses to the questions: 1) Which forms of energy visualisation produce the strongest emotional responses in people ? 2) For a given energy visualisation, do statistically significant differences exist between the emotional responses of men and women ? 3.0 Experimental Tests 3.1 Test Stimuli For the purposes of the current experimental investigation a set of test stimuli were chosen from among the most common visual scenes involving energy usage which occur within the average home. Systems which utilise significant amounts of energy include both infrastructural appliances which are fixed in position, and non-infrastructural appliances such as white goods which can be moved from position to position. Further, heat and energy can be induced to materials such as food and beverages. Based on the inspection of the homes of five randomly selected individuals who live in the London region the following visual scenes were chosen for use as visual stimuli for the experiment: Infrastructural appliances: hot water boiler, radiator, water faucet and kitchen oven. Non infrastructural appliances: tea kettle, toaster, electrical connector, laptop computer. Induced materials: tea mug. When considering the possible technical formats for the visual representations it was considered important to evaluate the most readily available optical and electro-optical camera formats due to the simplicity of embedding such camera units into “energy sixth sense” designs for home energy systems. In terms of the possible formats for presenting the energy usage scene, five possibilities were investigated in the current study: - commercial quality digital black-and-white photograph (Optical Gray-Scale); - commercial quality digital colour photograph (Optical Coloured); - commercial quality digital colour photograph in which the energy system is highlighted in red (Optical Augmented); - commercial quality gray-scale palette thermal image from a 320 x 240 pixel thermal camera (Infrared Gray-Scale); - commercial quality red-blue blended palette thermal image from a 320 x 240 pixel thermal camera (Infrared Blue-Red). The visual spectrum photographs were produced by means of a Panasonic DMC-FS62 10 mega pixel CCD compact digital camera, while the thermal spectrum photographs were obtained by means of an FLIR T360 thermal camera which utilises a 320 x 240 pixels Focal Plane Array (FPA) uncooled microbolometer sensor.
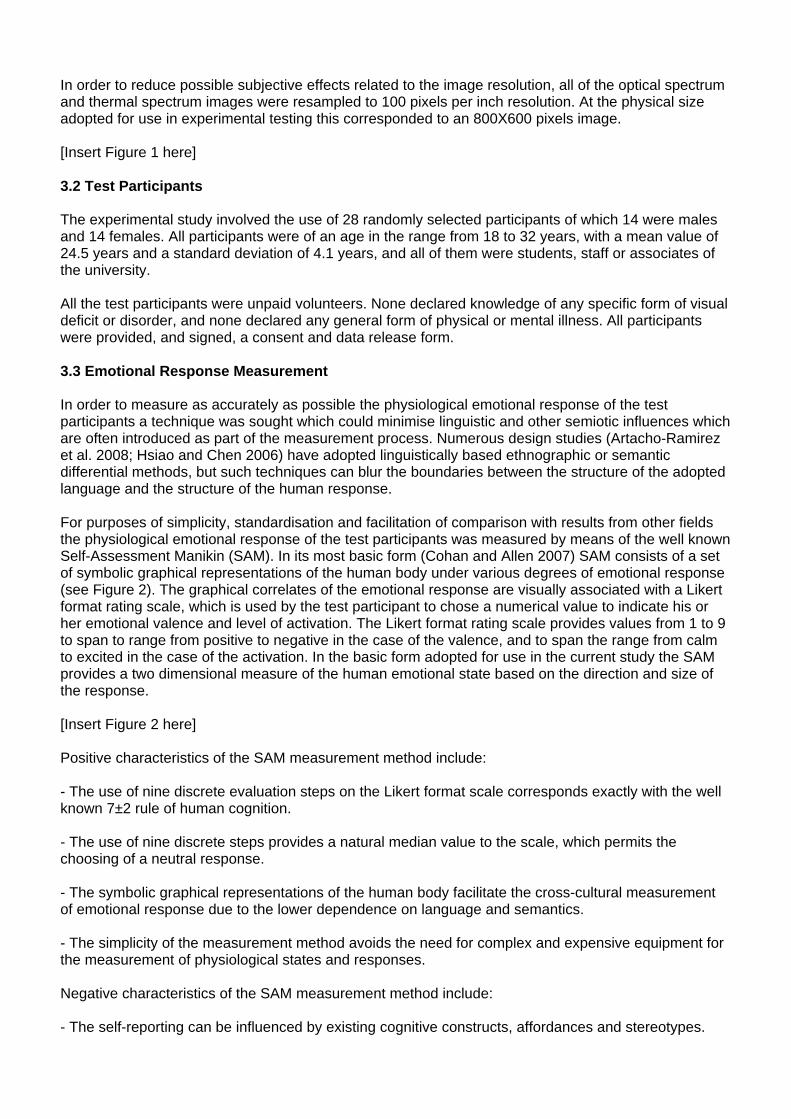
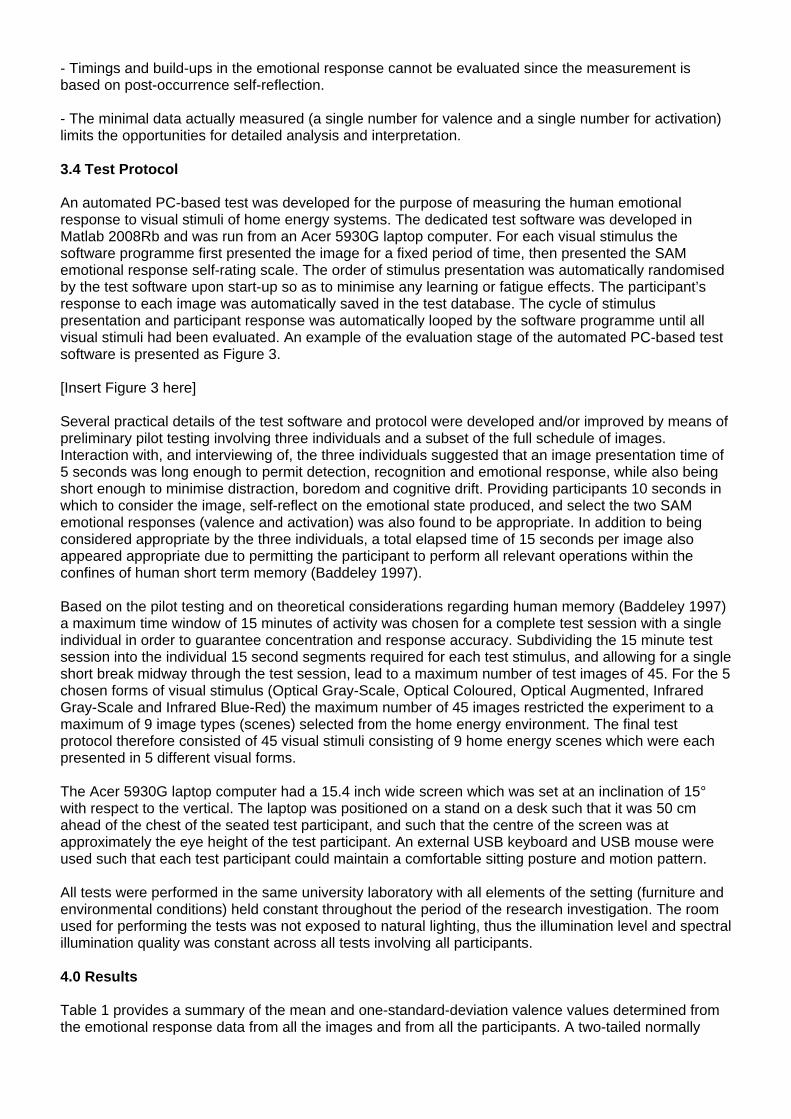
In order to reduce possible subjective effects related to the image resolution, all of the optical spectrum and thermal spectrum images were resampled to 100 pixels per inch resolution. At the physical size adopted for use in experimental testing this corresponded to an 800X600 pixels image. [Insert Figure 1 here] 3.2 Test Participants The experimental study involved the use of 28 randomly selected participants of which 14 were males and 14 females. All participants were of an age in the range from 18 to 32 years, with a mean value of 24.5 years and a standard deviation of 4.1 years, and all of them were students, staff or associates of the university. All the test participants were unpaid volunteers. None declared knowledge of any specific form of visual deficit or disorder, and none declared any general form of physical or mental illness. All participants were provided, and signed, a consent and data release form. 3.3 Emotional Response Measurement In order to measure as accurately as possible the physiological emotional response of the test participants a technique was sought which could minimise linguistic and other semiotic influences which are often introduced as part of the measurement process. Numerous design studies (Artacho-Ramirez et al. 2008; Hsiao and Chen 2006) have adopted linguistically based ethnographic or semantic differential methods, but such techniques can blur the boundaries between the structure of the adopted language and the structure of the human response. For purposes of simplicity, standardisation and facilitation of comparison with results from other fields the physiological emotional response of the test participants was measured by means of the well known Self-Assessment Manikin (SAM). In its most basic form (Cohan and Allen 2007) SAM consists of a set of symbolic graphical representations of the human body under various degrees of emotional response (see Figure 2). The graphical correlates of the emotional response are visually associated with a Likert format rating scale, which is used by the test participant to chose a numerical value to indicate his or her emotional valence and level of activation. The Likert format rating scale provides values from 1 to 9 to span to range from positive to negative in the case of the valence, and to span the range from calm to excited in the case of the activation. In the basic form adopted for use in the current study the SAM provides a two dimensional measure of the human emotional state based on the direction and size of the response. [Insert Figure 2 here] Positive characteristics of the SAM measurement method include: - The use of nine discrete evaluation steps on the Likert format scale corresponds exactly with the well known 7±2 rule of human cognition. - The use of nine discrete steps provides a natural median value to the scale, which permits the choosing of a neutral response. - The symbolic graphical representations of the human body facilitate the cross-cultural measurement of emotional response due to the lower dependence on language and semantics. - The simplicity of the measurement method avoids the need for complex and expensive equipment for the measurement of physiological states and responses. Negative characteristics of the SAM measurement method include: - The self-reporting can be influenced by existing cognitive constructs, affordances and stereotypes.
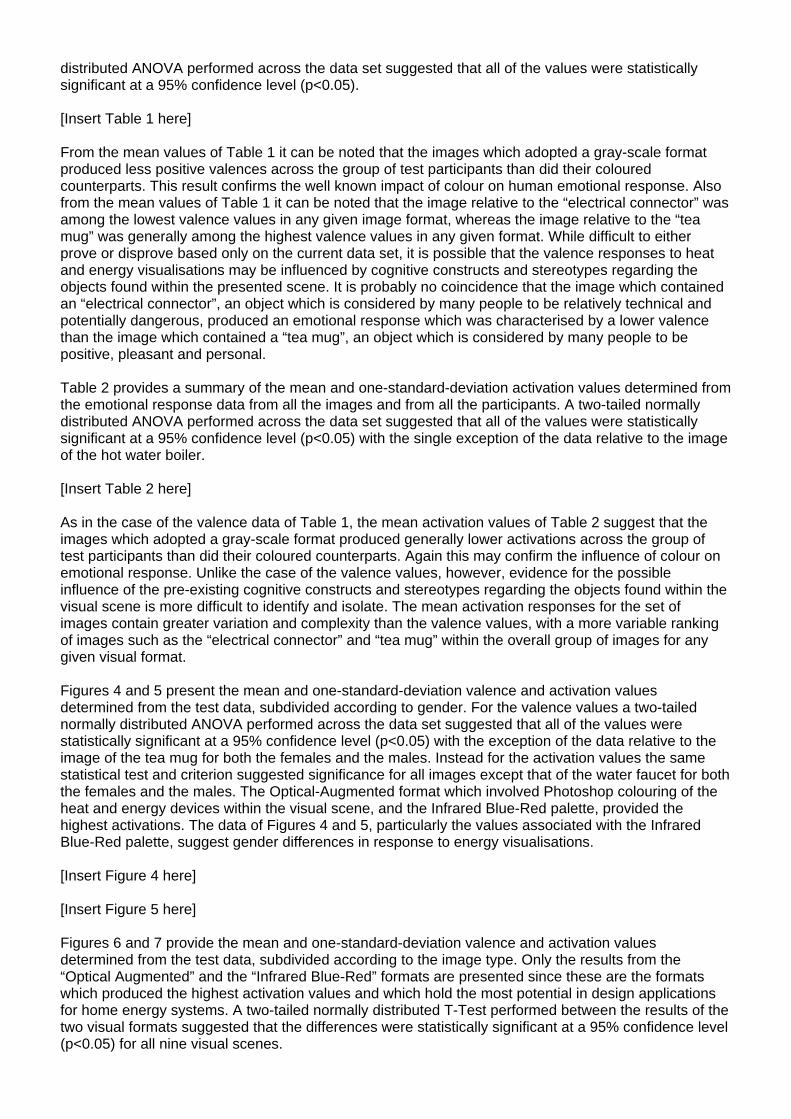
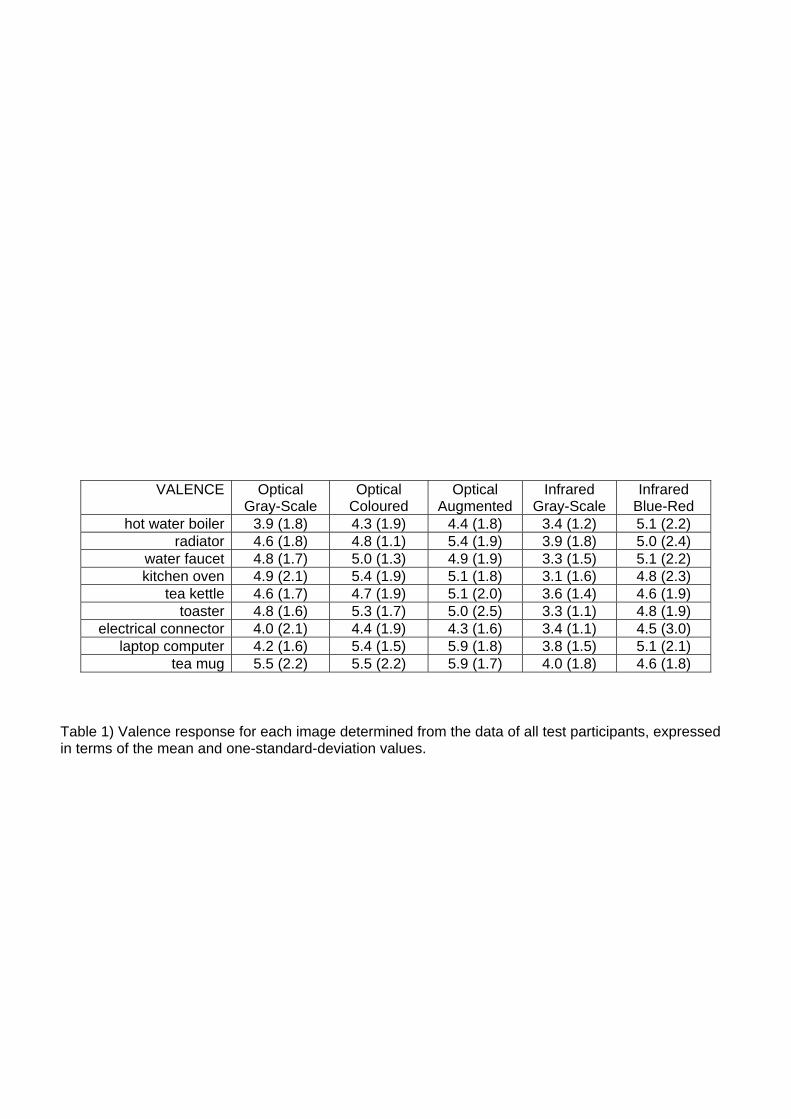
- Timings and build-ups in the emotional response cannot be evaluated since the measurement is based on post-occurrence self-reflection. - The minimal data actually measured (a single number for valence and a single number for activation) limits the opportunities for detailed analysis and interpretation. 3.4 Test Protocol An automated PC-based test was developed for the purpose of measuring the human emotional response to visual stimuli of home energy systems. The dedicated test software was developed in Matlab 2008Rb and was run from an Acer 5930G laptop computer. For each visual stimulus the software programme first presented the image for a fixed period of time, then presented the SAM emotional response self-rating scale. The order of stimulus presentation was automatically randomised by the test software upon start-up so as to minimise any learning or fatigue effects. The participant’s response to each image was automatically saved in the test database. The cycle of stimulus presentation and participant response was automatically looped by the software programme until all visual stimuli had been evaluated. An example of the evaluation stage of the automated PC-based test software is presented as Figure 3. [Insert Figure 3 here] Several practical details of the test software and protocol were developed and/or improved by means of preliminary pilot testing involving three individuals and a subset of the full schedule of images. Interaction with, and interviewing of, the three individuals suggested that an image presentation time of 5 seconds was long enough to permit detection, recognition and emotional response, while also being short enough to minimise distraction, boredom and cognitive drift. Providing participants 10 seconds in which to consider the image, self-reflect on the emotional state produced, and select the two SAM emotional responses (valence and activation) was also found to be appropriate. In addition to being considered appropriate by the three individuals, a total elapsed time of 15 seconds per image also appeared appropriate due to permitting the participant to perform all relevant operations within the confines of human short term memory (Baddeley 1997). Based on the pilot testing and on theoretical considerations regarding human memory (Baddeley 1997) a maximum time window of 15 minutes of activity was chosen for a complete test session with a single individual in order to guarantee concentration and response accuracy. Subdividing the 15 minute test session into the individual 15 second segments required for each test stimulus, and allowing for a single short break midway through the test session, lead to a maximum number of test images of 45. For the 5 chosen forms of visual stimulus (Optical Gray-Scale, Optical Coloured, Optical Augmented, Infrared Gray-Scale and Infrared Blue-Red) the maximum number of 45 images restricted the experiment to a maximum of 9 image types (scenes) selected from the home energy environment. The final test protocol therefore consisted of 45 visual stimuli consisting of 9 home energy scenes which were each presented in 5 different visual forms. The Acer 5930G laptop computer had a 15.4 inch wide screen which was set at an inclination of 15° with respect to the vertical. The laptop was positioned on a stand on a desk such that it was 50 cm ahead of the chest of the seated test participant, and such that the centre of the screen was at approximately the eye height of the test participant. An external USB keyboard and USB mouse were used such that each test participant could maintain a comfortable sitting posture and motion pattern. All tests were performed in the same university laboratory with all elements of the setting (furniture and environmental conditions) held constant throughout the period of the research investigation. The room used for performing the tests was not exposed to natural lighting, thus the illumination level and spectral illumination quality was constant across all tests involving all participants. 4.0 Results Table 1 provides a summary of the mean and one-standard-deviation valence values determined from the emotional response data from all the images and from all the participants. A two-tailed normally
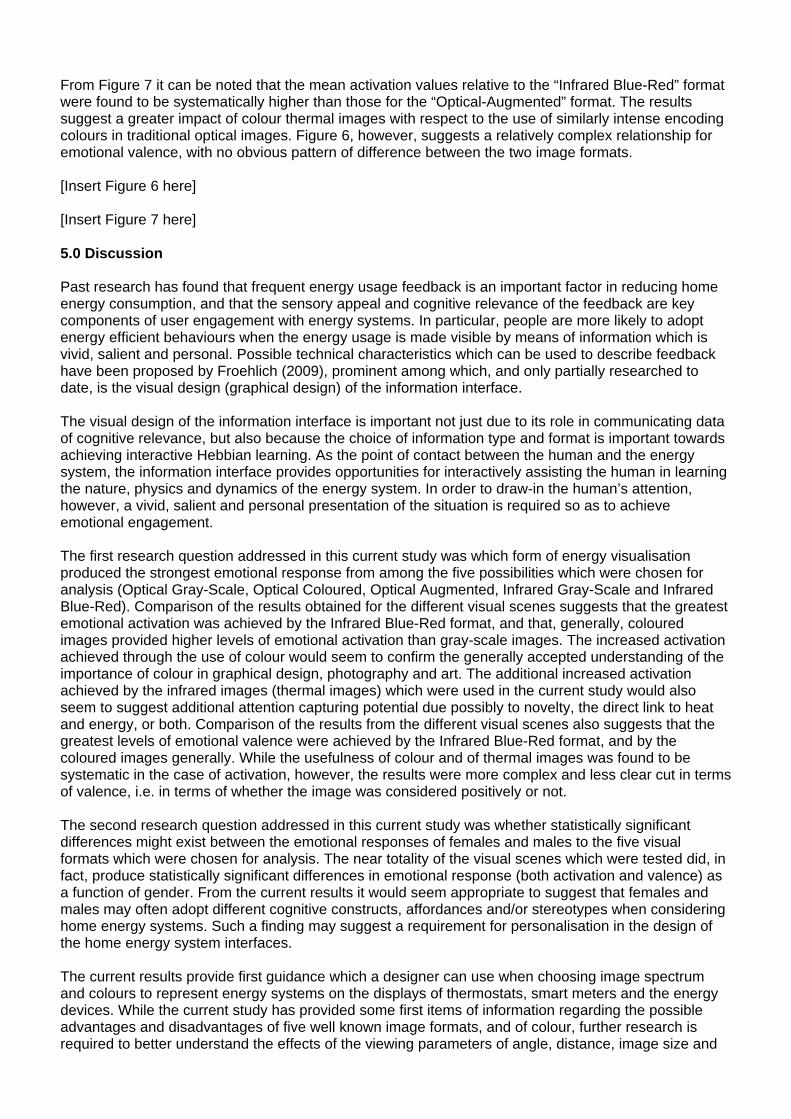
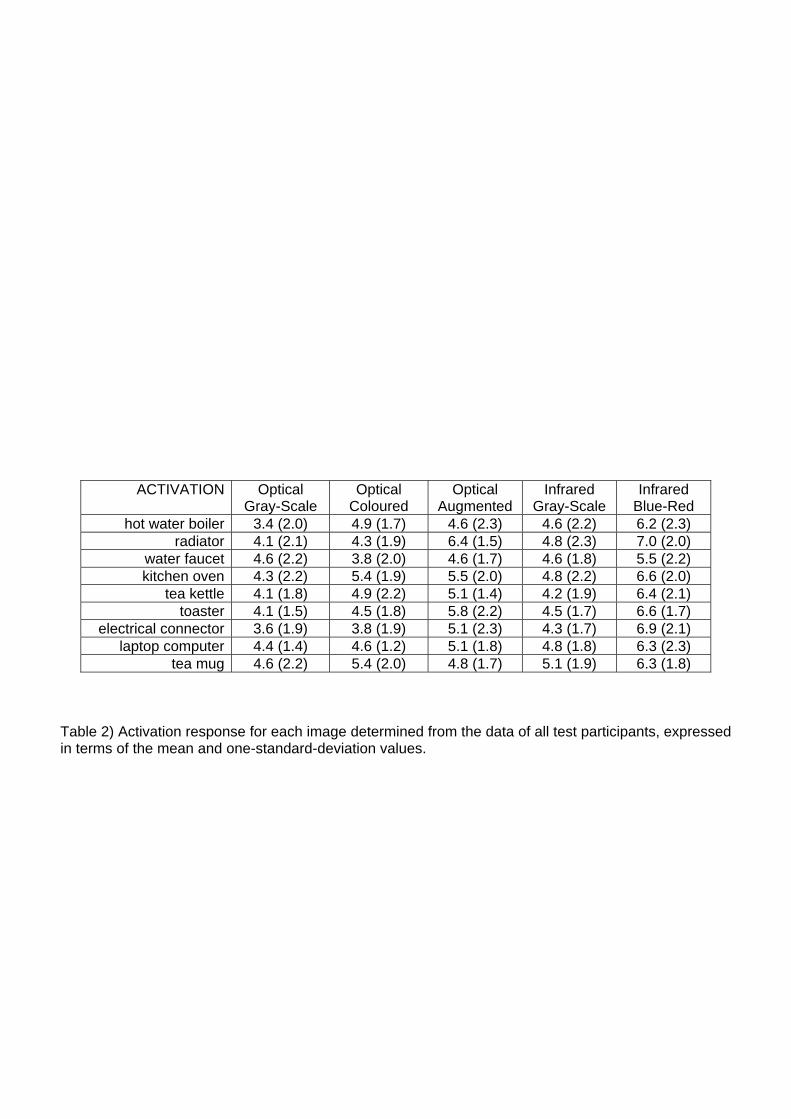
distributed ANOVA performed across the data set suggested that all of the values were statistically significant at a 95% confidence level (p<0.05). [Insert Table 1 here] From the mean values of Table 1 it can be noted that the images which adopted a gray-scale format produced less positive valences across the group of test participants than did their coloured counterparts. This result confirms the well known impact of colour on human emotional response. Also from the mean values of Table 1 it can be noted that the image relative to the “electrical connector” was among the lowest valence values in any given image format, whereas the image relative to the “tea mug” was generally among the highest valence values in any given format. While difficult to either prove or disprove based only on the current data set, it is possible that the valence responses to heat and energy visualisations may be influenced by cognitive constructs and stereotypes regarding the objects found within the presented scene. It is probably no coincidence that the image which contained an “electrical connector”, an object which is considered by many people to be relatively technical and potentially dangerous, produced an emotional response which was characterised by a lower valence than the image which contained a “tea mug”, an object which is considered by many people to be positive, pleasant and personal. Table 2 provides a summary of the mean and one-standard-deviation activation values determined from the emotional response data from all the images and from all the participants. A two-tailed normally distributed ANOVA performed across the data set suggested that all of the values were statistically significant at a 95% confidence level (p<0.05) with the single exception of the data relative to the image of the hot water boiler. [Insert Table 2 here] As in the case of the valence data of Table 1, the mean activation values of Table 2 suggest that the images which adopted a gray-scale format produced generally lower activations across the group of test participants than did their coloured counterparts. Again this may confirm the influence of colour on emotional response. Unlike the case of the valence values, however, evidence for the possible influence of the pre-existing cognitive constructs and stereotypes regarding the objects found within the visual scene is more difficult to identify and isolate. The mean activation responses for the set of images contain greater variation and complexity than the valence values, with a more variable ranking of images such as the “electrical connector” and “tea mug” within the overall group of images for any given visual format. Figures 4 and 5 present the mean and one-standard-deviation valence and activation values determined from the test data, subdivided according to gender. For the valence values a two-tailed normally distributed ANOVA performed across the data set suggested that all of the values were statistically significant at a 95% confidence level (p<0.05) with the exception of the data relative to the image of the tea mug for both the females and the males. Instead for the activation values the same statistical test and criterion suggested significance for all images except that of the water faucet for both the females and the males. The Optical-Augmented format which involved Photoshop colouring of the heat and energy devices within the visual scene, and the Infrared Blue-Red palette, provided the highest activations. The data of Figures 4 and 5, particularly the values associated with the Infrared Blue-Red palette, suggest gender differences in response to energy visualisations. [Insert Figure 4 here] [Insert Figure 5 here] Figures 6 and 7 provide the mean and one-standard-deviation valence and activation values determined from the test data, subdivided according to the image type. Only the results from the “Optical Augmented” and the “Infrared Blue-Red” formats are presented since these are the formats which produced the highest activation values and which hold the most potential in design applications for home energy systems. A two-tailed normally distributed T-Test performed between the results of the two visual formats suggested that the differences were statistically significant at a 95% confidence level (p<0.05) for all nine visual scenes.
From Figure 7 it can be noted that the mean activation values relative to the “Infrared Blue-Red” format were found to be systematically higher than those for the “Optical-Augmented” format. The results suggest a greater impact of colour thermal images with respect to the use of similarly intense encoding colours in traditional optical images. Figure 6, however, suggests a relatively complex relationship for emotional valence, with no obvious pattern of difference between the two image formats. [Insert Figure 6 here] [Insert Figure 7 here] 5.0 Discussion Past research has found that frequent energy usage feedback is an important factor in reducing home energy consumption, and that the sensory appeal and cognitive relevance of the feedback are key components of user engagement with energy systems. In particular, people are more likely to adopt energy efficient behaviours when the energy usage is made visible by means of information which is vivid, salient and personal. Possible technical characteristics which can be used to describe feedback have been proposed by Froehlich (2009), prominent among which, and only partially researched to date, is the visual design (graphical design) of the information interface. The visual design of the information interface is important not just due to its role in communicating data of cognitive relevance, but also because the choice of information type and format is important towards achieving interactive Hebbian learning. As the point of contact between the human and the energy system, the information interface provides opportunities for interactively assisting the human in learning the nature, physics and dynamics of the energy system. In order to draw-in the human’s attention, however, a vivid, salient and personal presentation of the situation is required so as to achieve emotional engagement. The first research question addressed in this current study was which form of energy visualisation produced the strongest emotional response from among the five possibilities which were chosen for analysis (Optical Gray-Scale, Optical Coloured, Optical Augmented, Infrared Gray-Scale and Infrared Blue-Red). Comparison of the results obtained for the different visual scenes suggests that the greatest emotional activation was achieved by the Infrared Blue-Red format, and that, generally, coloured images provided higher levels of emotional activation than gray-scale images. The increased activation achieved through the use of colour would seem to confirm the generally accepted understanding of the importance of colour in graphical design, photography and art. The additional increased activation achieved by the infrared images (thermal images) which were used in the current study would also seem to suggest additional attention capturing potential due possibly to novelty, the direct link to heat and energy, or both. Comparison of the results from the different visual scenes also suggests that the greatest levels of emotional valence were achieved by the Infrared Blue-Red format, and by the coloured images generally. While the usefulness of colour and of thermal images was found to be systematic in the case of activation, however, the results were more complex and less clear cut in terms of valence, i.e. in terms of whether the image was considered positively or not. The second research question addressed in this current study was whether statistically significant differences might exist between the emotional responses of females and males to the five visual formats which were chosen for analysis. The near totality of the visual scenes which were tested did, in fact, produce statistically significant differences in emotional response (both activation and valence) as a function of gender. From the current results it would seem appropriate to suggest that females and males may often adopt different cognitive constructs, affordances and/or stereotypes when considering home energy systems. Such a finding may suggest a requirement for personalisation in the design of the home energy system interfaces. The current results provide first guidance which a designer can use when choosing image spectrum and colours to represent energy systems on the displays of thermostats, smart meters and the energy devices. While the current study has provided some first items of information regarding the possible advantages and disadvantages of five well known image formats, and of colour, further research is required to better understand the effects of the viewing parameters of angle, distance, image size and
a-priori system stereotype in order to fully identify the technical characteristics which influence the human emotional response. Bibliography Abrahamse, W., Steg, L., Vlek, C. And Rothengatter, T. 2005, A review of intervention studies aimed at household energy conservation, Journal of Environmental Psychology, Vol. 25, pp 273-291. Artacho-Ramirez, M.A., Diego-Mas, J.A. and Alcaide-Marzal, J. 2008, Influence of the mode of graphical representation on the perception of product aesthetic and emotional features: an exploratory study, International Journal of Industrial Ergonomics, Vol. 38, pp. 942–952. Baddeley, A.D. 1997, Human memory: theory and practice, Psychology Press, Hove, East Sussex, UK. Becker, L. J. and Seligman, C. 1978, Reducing air conditioning waste by signalling it is cool outside, Personality and Social Psychology Bulletin, Vol. 4, No. 3, pp. 412-415. Bertoldi, P., Ricci, A. and de Almeida, A. 2000, Energy efficiency in household appliances and lighting, Springer, New York, New York. Casey, P.J. and Scott, K. 2006, Environmental concern and behavior in an Australian sample within an ecocentric-anthropocentric framework, Australian Journal of Psychology, Vol. 58., No. 2, pp. 57-67. Cohan, J.A. and Allen, J.B. (Editors) 2007, Handbook of emotion elicitation and assessment, Oxford University Press, Oxford, UK. Darby, S. 2010, Smart metering: what potential for householder engagement ?, Building Research & Information, Vol. 38, No. 5, pp. 442-457. Froehlich, J. 2009, Promoting Energy Efficient Behaviors in the Home through Feedback: the role of human-computer interaction, Proceedings of HCIC 2009 Winter Workshop, Snow Mountain Ranch, Fraser, Colorado, 4-8 February. Gallagher, S. 2005, How the Body Shapes the Mind, Oxford University Press, New York, New York, USA. Geller, E.S., Berry, T.D., Ludwig, T.D, Evans, R.E., Gilmore, M.R. and Clarke, S.W. 1990, A conceptual framework for developing and evaluating behavior change interventions for injury control, Health Education Research: Theory and Practice, Vol. 5, No. 2, pp.125-137. Giacomin, J. 2010, Thermal: seeing the world through 21st century eyes, Papadakis Publishers, Winterbourne, Berkshire, UK. Ham, J.R.C., Midden, C.J.H., Maan, S. And Merkus, B. 2009, Persuasive lighting: the influence of feedback through lighting on energy conservation behavior, Experiencing Light 2009 international conference on the effects of light on wellbeing, Eindhoven, the Netherlands, 26-27 October, pp. 122-128. Heim, M. 1993, The metaphysics of virtual reality, Oxford University Press, Oxford, UK. Hsiao, K.A., Chen, L.L., 2006, Fundamental dimensions of affective responses to product shapes, International Journal of Industrial Ergonomics, Vol. 36, No. 6, pp. 553–564. Ihde, D. 1991, Instrumental realism: the interface between philosophy of science and philosophy of technology, Indiana University Press, Bloomington, Indiana, USA. Ihde, D. 1998, Expanding hermeneutics: visualism in science, Northwestern University Press, Evanston, Illinois, USA.
Kaplan, H. 2007, Practical applications of infrared thermal sensing and imaging equipment, third edition, SPIE Press, Bellingham, Washington, USA. Kluger, A.N. and DeNisi, A. 1996, The effects of feedback interventions on performance: A historical review, a meta-analysis, and a preliminary feedback intervention theory, Psychological Bulletin, Vol. 119, No. 2, pp. 254-284. Macann, C. 1993, Four phenomenological philosophers: Husserl, Heidegger, Sartre, Merleau-Ponty, Routledge, New York, New York, USA. McCalley, L.T. and Midden, C.J.H. 2002, Energy conservation through product-integrated feedback: the roles of goal-setting and social orientation, Journal of Economic Psychology, Vol. 23, pp. 589-603. McMakin, A.H., Malone, E.L. and Lundgren, R.E. 2002, Motivating Residents to Conserve Energy without Financial Incentives, Environment And Behavior, Vol. 34, Issue: 6, pp 848-863. Midden, C.J.H. and Ham, J.R.C. 2008, The persuasive effects of positive and negative social feedback from an embodied agent on energy conservation behaviour, Persuasive 2008, Oulu, Finland, June 4-6. Midden, C.J.H., Kaiser, F.G. and McCalley, L.T. 2007, Technology's Four Roles in Understanding Individuals' Conservation of Natural Resources, Journal of Social Issues, Vol. 63, No. 1, pp. 155–174. Milfont, T.L., Duckitt, J. and Cameron, L.D. 2006, A cross-cultural study of environmental motive concerns and their implications for proenvironmental behavior, Environment and Behavior, Vol. 38, No. 6, pp 745-767. O’Brien, H.L. and Toms, E.G. 2010, The development and evaluation of a survey to measure user engagement, Journal of the American Society for Information Science and Technology, Vol. 61, No. 1, pp 50-69. O’Brien, H.L. and Toms, E.G. 2008, What is user engagement ? A conceptual framework for defining user engagement with technology, Journal of the American Society for Information Science and Technology, Vol. 59, No. 6, pp 938-955. Parker, D.S., Hoak, D. and Cummings, J. 2008, Pilot Evaluation of Energy Savings from Residential Energy Demand Feedback Devices, Final Report by the Florida Solar Energy Center to the U.S. Department of Energy, FSEC-CR-1742-08. Ray, S. F. 1999, Scientific photography and applied imaging, Focal Press, Oxford, UK. Sekula, A. 1981, The traffic in photographs, Art Journal, Vol. 41, No. 1, pp 15-25. Schwartzman, M. 2011, See yourself sensing: redefining human perception, Black Dog Publishing Ltd., London, UK. Williams, T.L. 2009, Thermal Imaging Cameras: characteristics and performance, CRC Press, Boca Raton, Florida, USA.
VALENCE Optical Gray-Scale
Optical Coloured
Optical Augmented
Infrared Gray-Scale
Infrared Blue-Red
hot water boiler 3.9 (1.8) 4.3 (1.9) 4.4 (1.8) 3.4 (1.2) 5.1 (2.2) radiator 4.6 (1.8) 4.8 (1.1) 5.4 (1.9) 3.9 (1.8) 5.0 (2.4)
water faucet 4.8 (1.7) 5.0 (1.3) 4.9 (1.9) 3.3 (1.5) 5.1 (2.2) kitchen oven 4.9 (2.1) 5.4 (1.9) 5.1 (1.8) 3.1 (1.6) 4.8 (2.3)
tea kettle 4.6 (1.7) 4.7 (1.9) 5.1 (2.0) 3.6 (1.4) 4.6 (1.9) toaster 4.8 (1.6) 5.3 (1.7) 5.0 (2.5) 3.3 (1.1) 4.8 (1.9)
electrical connector 4.0 (2.1) 4.4 (1.9) 4.3 (1.6) 3.4 (1.1) 4.5 (3.0) laptop computer 4.2 (1.6) 5.4 (1.5) 5.9 (1.8) 3.8 (1.5) 5.1 (2.1)
tea mug 5.5 (2.2) 5.5 (2.2) 5.9 (1.7) 4.0 (1.8) 4.6 (1.8) Table 1) Valence response for each image determined from the data of all test participants, expressed in terms of the mean and one-standard-deviation values.
ACTIVATION Optical Gray-Scale
Optical Coloured
Optical Augmented
Infrared Gray-Scale
Infrared Blue-Red
hot water boiler 3.4 (2.0) 4.9 (1.7) 4.6 (2.3) 4.6 (2.2) 6.2 (2.3) radiator 4.1 (2.1) 4.3 (1.9) 6.4 (1.5) 4.8 (2.3) 7.0 (2.0)
water faucet 4.6 (2.2) 3.8 (2.0) 4.6 (1.7) 4.6 (1.8) 5.5 (2.2) kitchen oven 4.3 (2.2) 5.4 (1.9) 5.5 (2.0) 4.8 (2.2) 6.6 (2.0)
tea kettle 4.1 (1.8) 4.9 (2.2) 5.1 (1.4) 4.2 (1.9) 6.4 (2.1) toaster 4.1 (1.5) 4.5 (1.8) 5.8 (2.2) 4.5 (1.7) 6.6 (1.7)
electrical connector 3.6 (1.9) 3.8 (1.9) 5.1 (2.3) 4.3 (1.7) 6.9 (2.1) laptop computer 4.4 (1.4) 4.6 (1.2) 5.1 (1.8) 4.8 (1.8) 6.3 (2.3)
tea mug 4.6 (2.2) 5.4 (2.0) 4.8 (1.7) 5.1 (1.9) 6.3 (1.8) Table 2) Activation response for each image determined from the data of all test participants, expressed in terms of the mean and one-standard-deviation values.
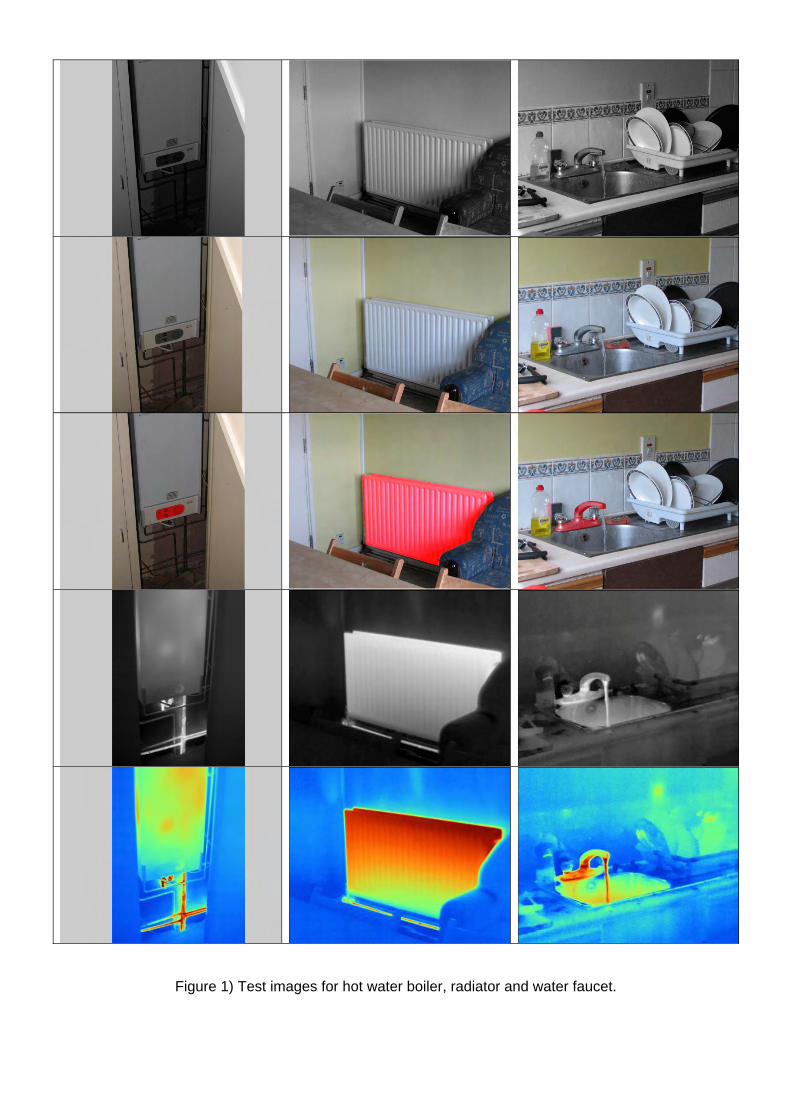
Figure 1) Test images for hot water boiler, radiator and water faucet.
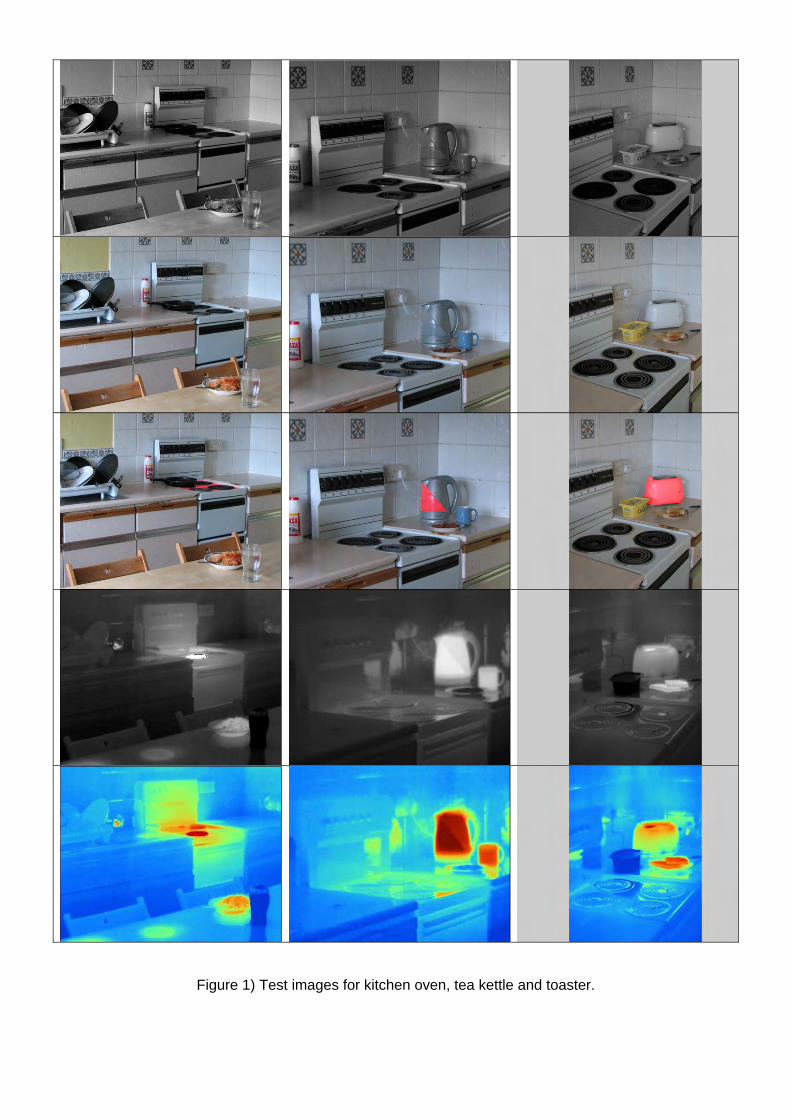
Figure 1) Test images for kitchen oven, tea kettle and toaster.
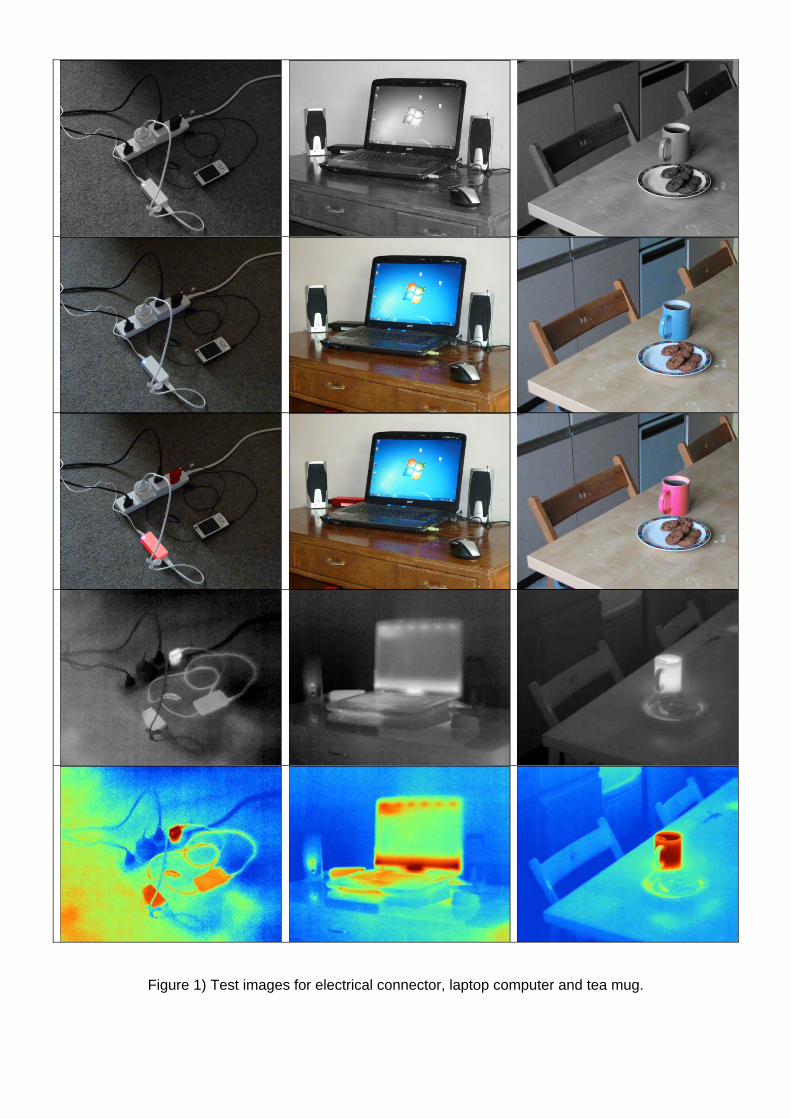
Figure 1) Test images for electrical connector, laptop computer and tea mug.
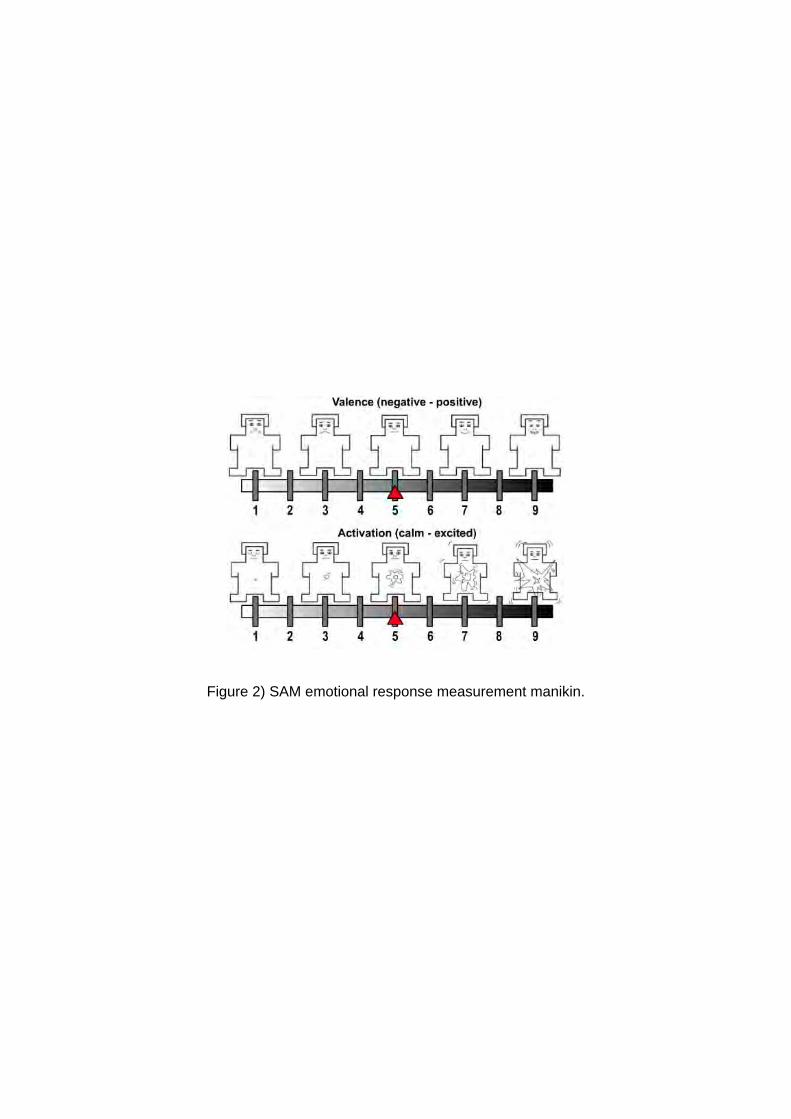
Figure 2) SAM emotional response measurement manikin.
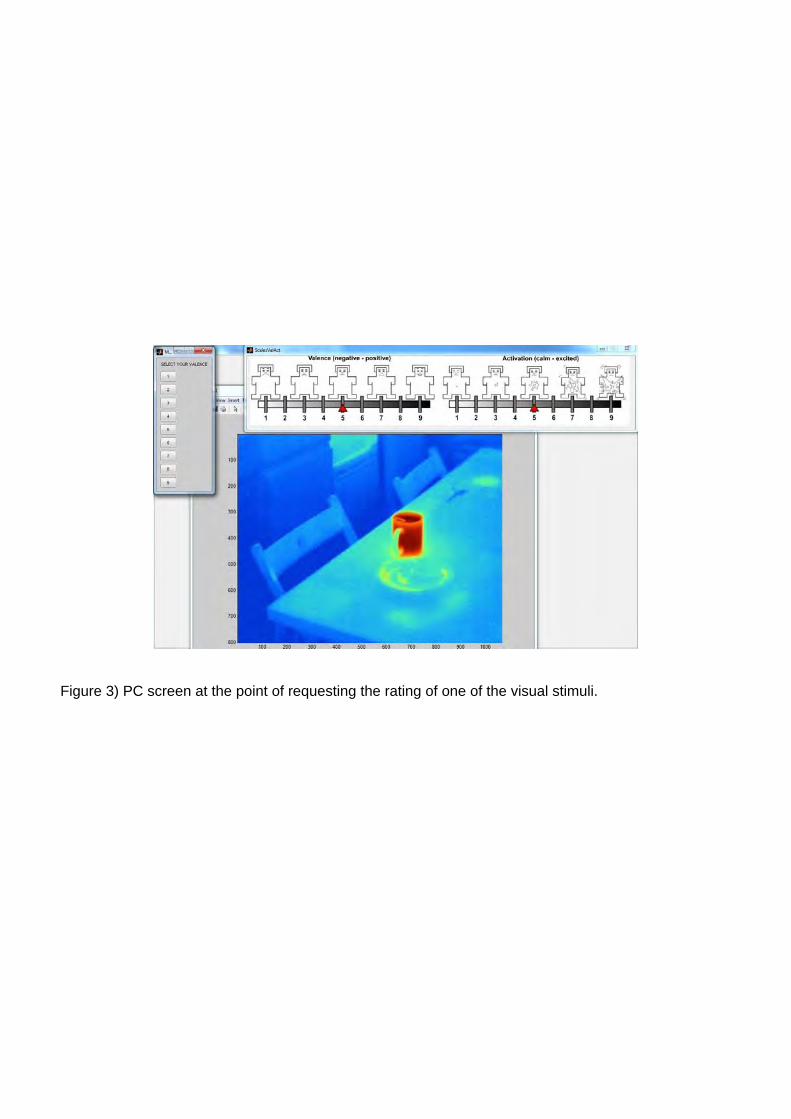
Figure 3) PC screen at the point of requesting the rating of one of the visual stimuli.
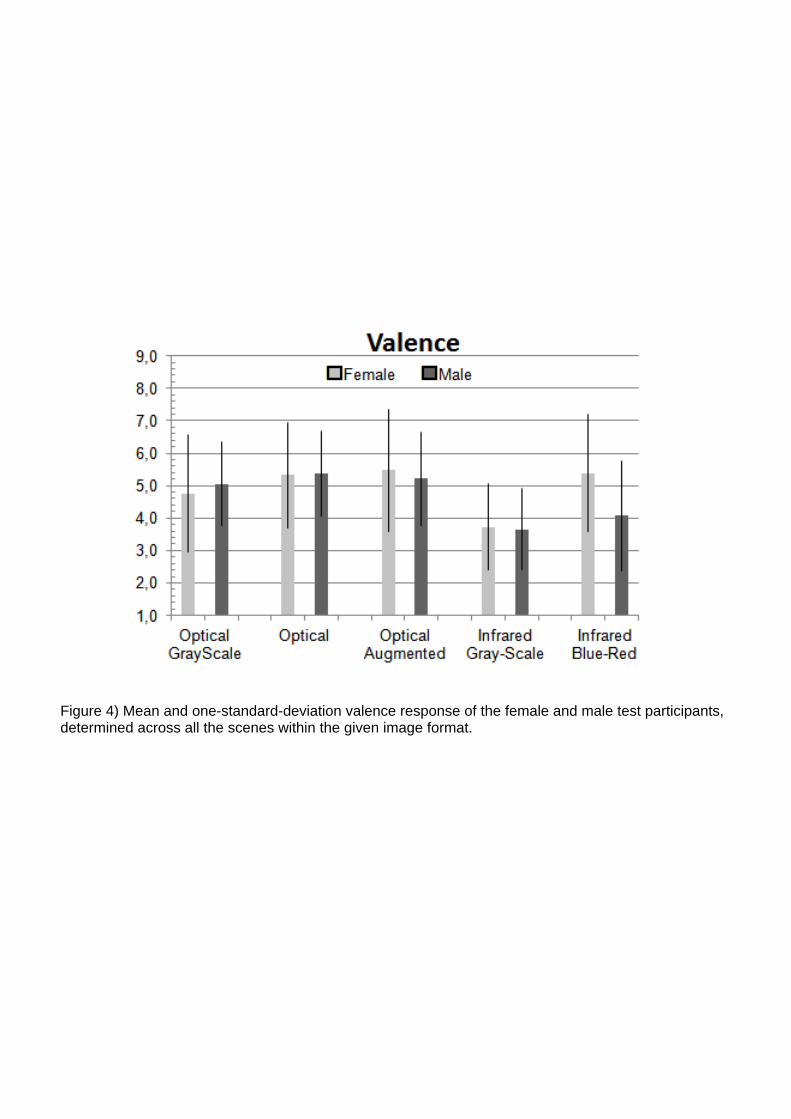
Figure 4) Mean and one-standard-deviation valence response of the female and male test participants, determined across all the scenes within the given image format.
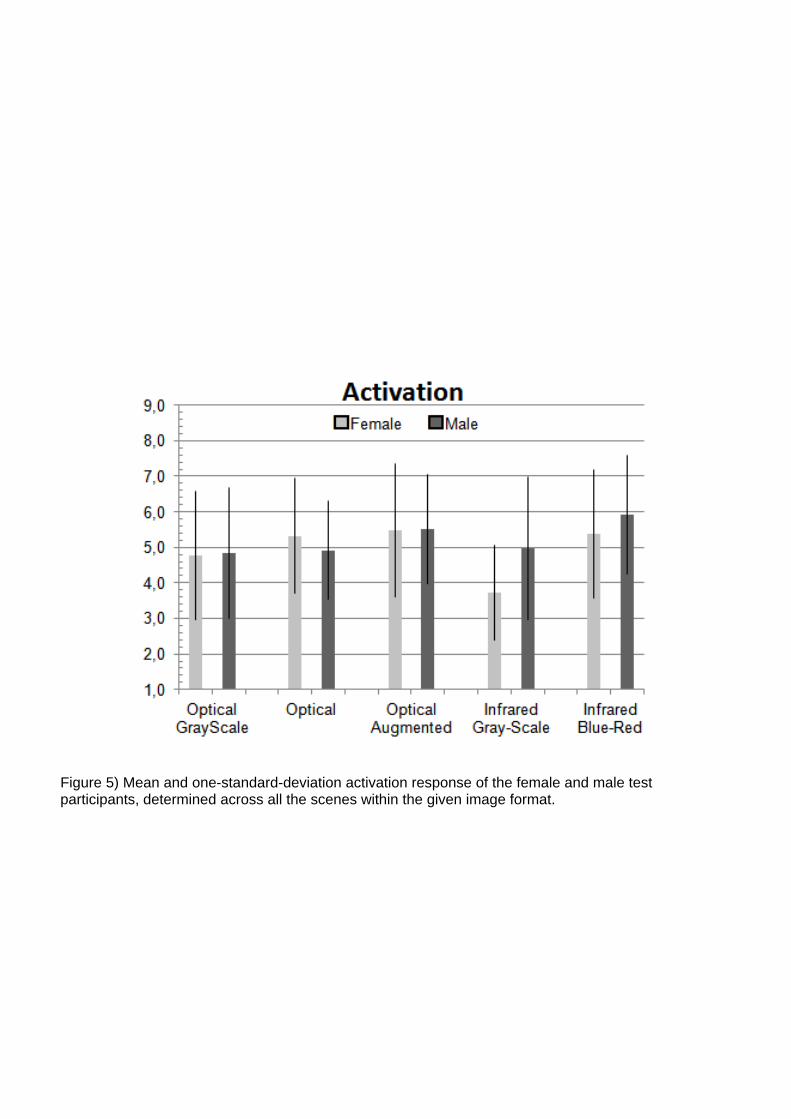
Figure 5) Mean and one-standard-deviation activation response of the female and male test participants, determined across all the scenes within the given image format.
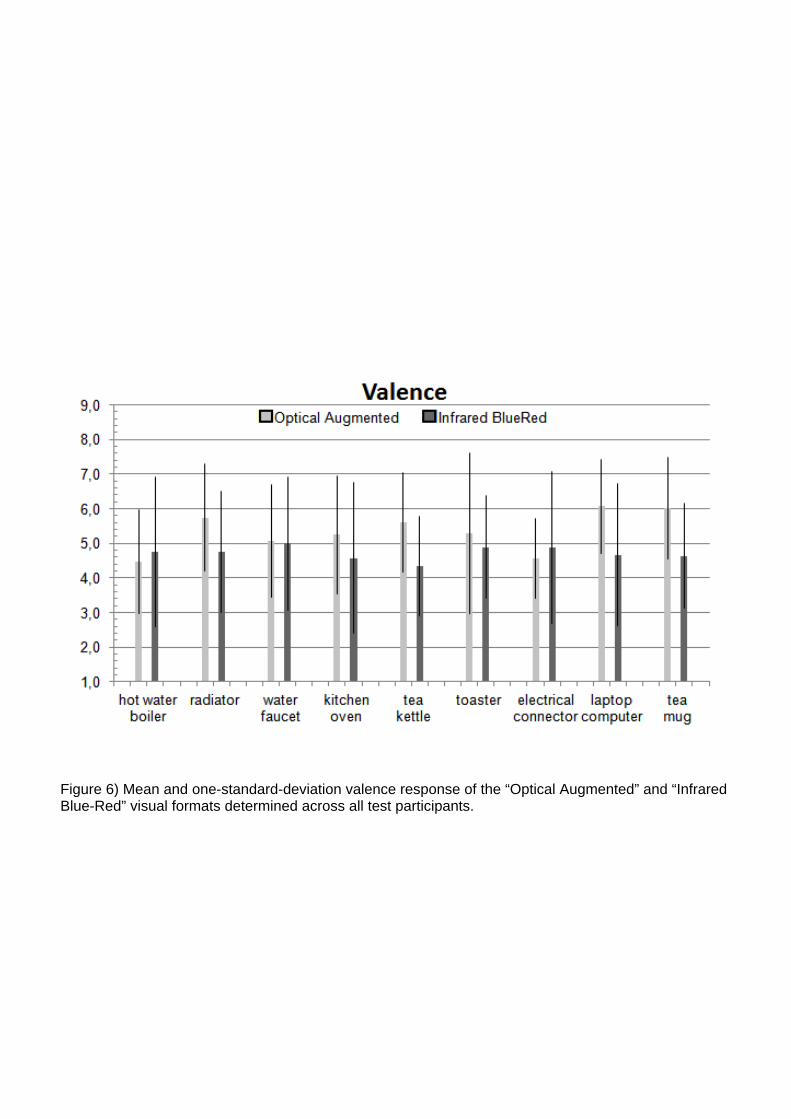
Figure 6) Mean and one-standard-deviation valence response of the “Optical Augmented” and “Infrared Blue-Red” visual formats determined across all test participants.
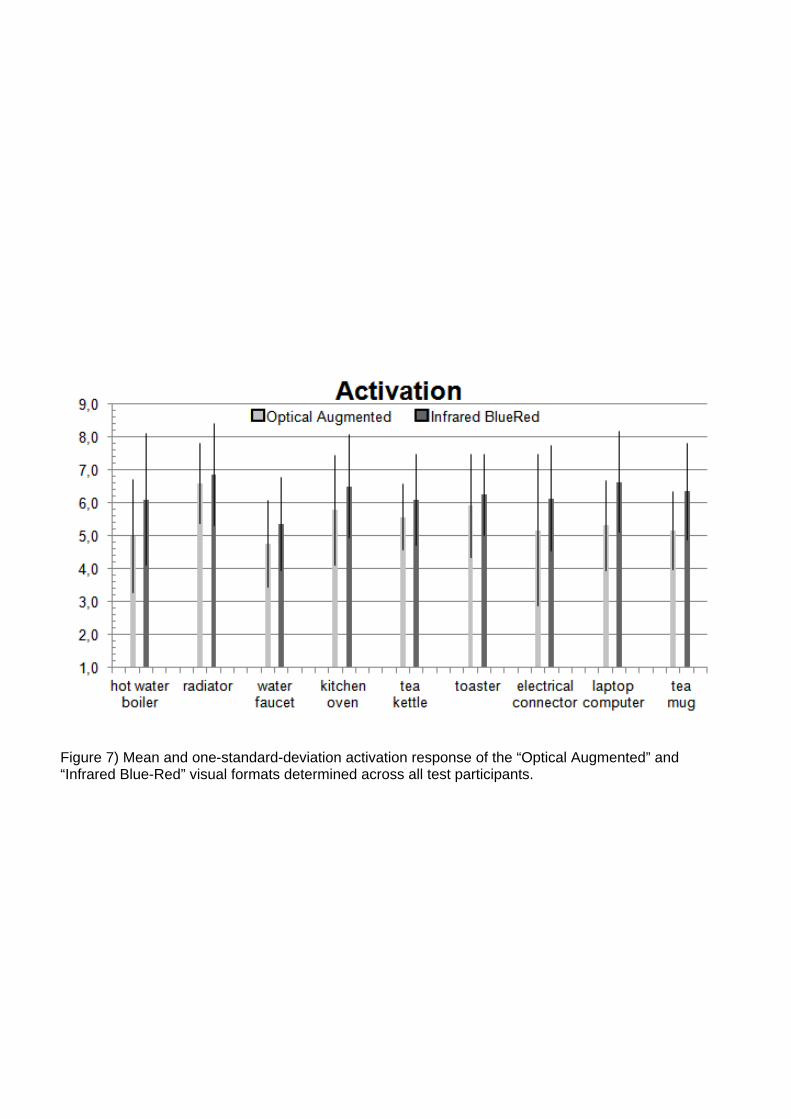
Figure 7) Mean and one-standard-deviation activation response of the “Optical Augmented” and “Infrared Blue-Red” visual formats determined across all test participants.