human capital, the structure of production, and growth · non-technical summary we contribute to...
TRANSCRIPT

ISSN 1561081-0
9 7 7 1 5 6 1 0 8 1 0 0 5
WORKING PAPER SER IESNO 623 / MAY 2006
HUMAN CAPITAL, THE STRUCTURE OF PRODUCTION, AND GROWTH
by Antonio Cicconeand Elias Papaioannou

In 2006 all ECB publications will feature
a motif taken from the
€5 banknote.
WORK ING PAPER SER IE SNO 623 / MAY 2006
This paper can be downloaded without charge from http://www.ecb.int or from the Social Science Research Network
1 We thank Joshua Angrist, Francesco Caselli, Helmut Forstner, Christos Genakos, Victor Lavy, Greg Siourounis, Jaume Ventura, and David Weil for comments, Stijn Claessens, Raymond Fisman, Luc Laeven, and Inessa Love for kindly making their data available to us, and Pablo Fleiss and Giovanni Peri for helping us with the UNIDO and the Integrated Public Use Microdata Series databases
respectively. We also thank seminar participants at CRETE, ESSIM, Hebrew University, UNIDO, IIES Stockholm and Vienna IHS. Part of the paper was written while Papaioannou was a doctoral student at the Economics Department of the London
Business School. Partial financial support from the CREI research institute, the European Fund for Regional Development and the Fundación Caixa Galicia, the FBBVA, and the UNIDO research project on growth and productivity performance is gratefully acknowledged. The opinions expressed herein are those of the authors and do not necessarily represent those of the European
Central Bank or the Eurosystem. All remaining errors are our responsibility.2 ICREA and Universitat Pompeu Fabra, Department of Economics and Business, Ramon Trias Fargas 25-27, 08005 Barcelona,
Spain. E-mail: [email protected] 3 European Central Bank, Financial Research Division, Postfach 160319, D-60066, Frankfurt am Main, Germany.
E-mail: [email protected]
HUMAN CAPITAL, THE STRUCTURE OF PRODUCTION,
AND GROWTH 1
by Antonio Ciccone 2
and Elias Papaioannou 3
electronic library at http://ssrn.com/abstract_id=899270

© European Central Bank, 2006
AddressKaiserstrasse 2960311 Frankfurt am Main, Germany
Postal addressPostfach 16 03 1960066 Frankfurt am Main, Germany
Telephone+49 69 1344 0
Internethttp://www.ecb.int
Fax+49 69 1344 6000
Telex411 144 ecb d
All rights reserved.
Any reproduction, publication andreprint in the form of a differentpublication, whether printed orproduced electronically, in whole or inpart, is permitted only with the explicitwritten authorisation of the ECB or theauthor(s).
The views expressed in this paper do notnecessarily reflect those of the EuropeanCentral Bank.
The statement of purpose for the ECBWorking Paper Series is available fromthe ECB website, http://www.ecb.int.
ISSN 1561-0810 (print)ISSN 1725-2806 (online)

3ECB
Working Paper Series No 623May 2006
CONTENTS
Abstract 4
Non-technical summary 5
1 Introduction 7
2 Theoretical framework 10
3 Data 14
4 Main results 17
4.1 Human capital levels and industrygrowth 17
4.2 Human capital accumulation andindustry growth 19
4.3 Joint human capital accumulationand level effects 22
5 Further evidence 23
5.1 Financial development, human capitaland industry growth 23
5.2 Human capital and industryemployment growth 25
5.3 Openness 26
6 Sensitivity analysis 27
6.1 Measurement of schoolingimprovements 27
6.2 Alternative functional form 28
6.3 Further sensitivity checks 29
7 Conclusion 31
Appendix 33References 37
Figures and tables 43
European Central Bank Working Paper Series 57

4ECBWorking Paper Series No 623May 2006
Abstract Do high levels of human capital foster economic growth by facilitating technology adoption? If
so, countries with more human capital should have adopted more rapidly the skilled-labor
augmenting technologies becoming available since the 1970’s. High human capital levels should
therefore have translated into fast growth in more compared to less human-capital-intensive
industries in the 1980’s. Theories of international specialization point to human capital
accumulation as another important determinant of growth in human-capital-intensive industries.
Using data for a large sample of countries, we find significant positive effects of human capital
levels and human capital accumulation on output and employment growth in human-capital-
intensive industries.
Keywords: Human Capital, growth, structure of production
JEL Classifications: E13, F11, O11

Non-Technical Summary
We contribute to the literature examining the impact of human capital on output growth
by investigating channels through which such effects could work. If high levels of human
capital facilitate technology adoption (as advocated by technology-frontier growth
models following Nelson and Phelps (1966)), then countries with a more educated work-
force should have adopted more rapidly the skilled-labor augmenting technologies
becoming available since the 1970's. These countries should therefore have experienced
faster output growth in more compared to less schooling-intensive industries in the
1980's. Second, neoclassical theories of international specialization (that view human
capital as an input in the production) predict that fast human capital accumulation should
move productive resources to schooling-intensive sectors and thus foster growth in
human-capital-intensive industries.
We employ data for 37 manufacturing industries in around 40 countries in the eighties to
examine whether higher levels of education and faster human capital accumulation were
associated with faster growth in schooling-intensive industries.
Our cross-country cross-industry analysis reveals that output growth in schooling-
intensive industries was significantly faster in economies with both higher education
levels and greater education improvements. Our estimates control for country-specific
and industry-specific fixed effects that capture movements in prices, technological
innovation and policies that foster growth at the country level (e.g. economic policy,
social norms, political stability). In addition these results are robust to controlling for the
growth effects of well-functioning financial markets and good property rights protection
in external-finance-dependent and intangible-asset-intensive industries respectively
(Rajan and Zingales, 1998; Claessens and Laeven, 2003). The results are also robust to
controlling for additional effects of domestic capital markets on industry growth (Fisman
and Love, 2003, 2004). The magnitude of the differential industry growth effects of
education levels and improvements is similar and if anything larger than the differential
growth effects of financial development on industry growth (Rajan and Zingales, 1998).
5ECB
Working Paper Series No 623May 2006

Our analysis yields interesting additional insights.
First, we are able to reassess the importance of financial development for industry growth
to controls for human capital and vice versa. We find that financial development and
property rights protection continue to have disproportionate growth effects in industries
that depend on external finance (Rajan and Zingales, 1998) and use intangible assets
intensively (Claessens and Laeven, 2003) respectively. The magnitude of such effects
drops by 15%-40% however. Thus part of the attributed to finance effect is actually
stemming from human capital.
Second, the international specialization framework underlying our analysis is further
strengthened when we examine the differential industry growth effects of human capital
using employment data. Specifically we find even stronger evidence for positive effects
of education levels and improvements on growth in schooling-intensive industries when
we examine employment growth.
Third, when we examine the effects high human capital (level and accumulation) on
industry growth separately in countries with low and countries with high tariffs, we find
that in countries with high tariffs, the effects of education levels and improvements on
output growth in schooling-intensive industries are often statistically insignificant.
Protectionist trade policies therefore appear to break the link between country-level
human capital and specialization in human-capital-intensive industries.
Fourth, when we proxy human capital by schooling (labor-force) quality the impact of
average schooling drops. Thus our cross-country cross-industry growth analysis therefore
adds to the micro and cross-country evidence on the importance of human capital quality
(e.g. Hanushek, 2004).
6ECBWorking Paper Series No 623May 2006

1 Introduction
Following Barro (1991) and Mankiw, Romer, and Weil (1992), there has been an upsurge
of empirical research on the effects of human capital on economic growth. The main is-
sues analyzed are whether higher levels of education or greater improvements in education
are associated with faster output growth. Overall, the cross-country evidence is mixed on
both counts (notwithstanding the emphasis on human capital in new growth theories and
recent neoclassical growth theories).1 This could be because of difficulties when specifying
cross-country growth regressions (Temple, 1999; Durlauf, Johnson, and Temple, 2005). For
example, the limited number of countries forces researchers to use parsimonious specifica-
tions to avoid the degrees of freedom problem. Another reason could be attenuation bias
due to mismeasured schooling data (Krueger and Lindahl, 2001; Cohen and Soto, 2001; de
la Fuente and Domenech, 2001, 2005). Such attenuation bias could be magnified by multi-
collinearity, often present in cross-country growth regressions, as high-growth countries tend
to have higher rates of human capital accumulation, deeper financial markets, stronger prop-
erty rights protection, higher savings and investment rates etc. (Mankiw, 1995; Rajan and
Zingales, 1998). Mixed results could also be due to schooling indicators used in empirical
work often missing cross-country differences in educational quality (Hanushek and Kimko,
2000; Barro, 2001). In any case, a significantly positive correlation between schooling and
output growth does not imply that schooling affects growth. Instead, both schooling and
output growth could be driven by an omitted variable, total-factor-productivity growth for
example (Bils and Klenow, 2000).
One way to progress in our understanding of the effects of human capital on growth is
to focus on channels through which such effects could work. It is often argued that high
levels of human capital facilitate technology adoption (e.g. Nelson and Phelps, 1966; Barro,
1991; Benhabib and Spiegel, 1994, 2002; Acemoglu, 2003a; Caselli and Coleman, 2005).
There is a consensus that new technologies becoming available since the 1970’s tended to be
1The empirical studies of Romer (1990a), Barro (1991), and Benhabib and Spiegel (1994) find a signifi-cantly positive effect of schooling levels on output growth, while Cohen and Soto (2001) find no link. Temple(1999), Cohen and Soto (2001), and de la Fuente and Domenech (2001, 2005) find a significantly positivecorrelation between improvements in education and growth, while Benhabib and Spiegel (1994), Barro andSala-i-Martin (1995), Caselli, Esquivel, and Lefort (1996), and Pritchett (1997) find no effect of schoolingimprovements on growth. Topel (1999) and Krueger and Lindahl (2001) find both education level and im-provement effects on growth. Examples of endogenous growth theories emphasizing human capital are Lucas(1988) and Romer (1990b). Mankiw, Romer, and Weil (1992) incorporate human capital into a neoclassicalgrowth model.
7ECB
Working Paper Series No 623May 2006

more skilled-labor augmenting than the technologies of the 1950’s and 1960’s (e.g. Autor,
Katz, and Krueger, 1998; Berman, Bound, and Machin, 1998; Berman and Machin, 2000;
Caselli and Coleman, 2002). The defining characteristic of skilled-labor augmenting tech-
nologies is that they increase the productive efficiency of skilled relative to unskilled work-
ers. Skilled-labor augmenting technologies therefore result in faster total-factor-productivity
(TFP) growth in human-capital-intensive industries (e.g. Kahn and Lim, 1998; Klenow,
1998). As a result, countries adopting new technologies quickly should experience fast out-
put growth in human-capital-intensive industries once other factors affecting growth are
controlled for. If high levels of human capital facilitate technology adoption, output growth
in human-capital-intensive industries should be faster in economies with high levels of human
capital. We therefore test whether countries with higher education levels experienced faster
growth in more compared to less schooling-intensive industries in the 1980’s. Theories of
international specialization point to human capital accumulation as another important deter-
minant of growth in human-capital-intensive industries (e.g. Ventura, 1997, 2005; Romalis,
2004). Hence, we also examine the link between improvements in education and growth in
schooling-intensive industries.
We investigate such human capital level and accumulation effects using data for 37 man-
ufacturing industries in around 40 countries. Our empirical analysis builds on the framework
and data of Rajan and Zingales (1998) and subsequent contributions to the finance and in-
dustry growth literature (e.g. Claessens and Laeven, 2003; Fisman and Love, 2003, 2004).
We follow this literature in using U.S. data to obtain the industry-characteristics necessary
for the empirical analysis. In particular, we use detailed 1980 U.S. Census data to calculate
indicators of cross-industry differences in human capital intensity. These indicators allow
us to test whether high levels of human capital and rapid human capital accumulation were
associated with fast growth in human-capital-intensive industries.
We find statistically robust and economically significant support for the human capital
level effect. To get a sense for its size, consider the annual output growth differential between
an industry with a schooling intensity at the 75th percentile (Chemicals) and an industry
at the 25th percentile (Pottery). When we measure levels of human capital using schooling
quality indicators, our estimates imply that this growth differential is 1.3% − 2.1% higher
in a country with schooling quality at the 75th percentile (e.g. Malaysia) than a country
with schooling quality at the 25th percentile (e.g. Philippines). For comparison, the average
growth rate of value added in our sample is 3.4% and the median growth rate is 2.9%.
8ECBWorking Paper Series No 623May 2006

When we proxy human capital levels using average years of schooling, the implied Chemicals-
Pottery growth differential is 1.1%−1.8% greater in countries with average schooling in 1980at the 75th percentile (e.g. Japan with 8.2 years of schooling) than countries with average
schooling at the 25th percentile (e.g. Portugal with 3.3 years). In line with recent findings
in the cross-country growth literature (Hanushek and Kimko, 2000; Barro, 2001; Hanushek,
2004), schooling quantity levels often become only marginally significant or insignificant
when schooling quality is accounted for.
We also find statistically robust and economically significant support for the human capi-
tal accumulation effect. For example, our estimates imply that the annual Chemicals-Pottery
growth differential is 1%−1.2% greater in countries with improvements in average schoolingover the 1970-1990 period at the 75th percentile (e.g. Philippines with an improvement of
2.3 years) than countries with improvements at the 25th percentile (e.g. Sri Lanka with 1.1
years).
Our estimates of the impact of human capital on growth in human-capital-intensive
industries control for country-specific and industry-specific effects. Industry effects capture
movements in prices and technological innovation at the industry level. Country effects
capture factors that determine growth at the country level (e.g. economic policy, social
norms, political stability). Such factors are likely to also impact human capital accumulation.
For example, economic reform may combine measures that stimulate economic growth with
policies that foster education (Krueger and Lindahl, 2001). Moreover, as shown by Bils
and Klenow (2000), all factors causing rapid TFP growth raise the return to human capital
accumulation and therefore lead to education investments. Omitting country-specific effects
may therefore result in upward biased estimates of the impact of human capital on growth.
Our empirical analysis jointly considers the growth effects of human capital and those
of financial markets and property rights protection emphasized in the finance and industry
growth literature. This allows us to check the robustness of industry growth effects of finan-
cial development and property rights protection to controls for human capital and vice versa.
We find that financial development and property rights protection continue to have dispro-
portionate growth effects in industries that depend on external finance (Rajan and Zingales,
1998) and use intangible assets intensively (Claessens and Laeven, 2003) respectively. The
magnitude of such effects drops by 15% − 40% however. Industry growth effects of finan-
cial development working through dependence on trade credit and inter-industry resource
9ECB
Working Paper Series No 623May 2006
reallocation (Fisman and Love, 2003, 2004) remain nearly unchanged.

The international specialization implication of the human capital level-technology adop-
tion connection that we test is: high human capital —> rapid (skilled-labor augmenting) tech-
nology adoption —> fast output growth in schooling-intensive industries. To test whether
faster output growth in human-capital-intensive industries coincides with the reallocation
of production factors, we add country-industry level employment growth statistics to the
finance and industry growth database. This data yield very robust support for a positive
link between employment shifts to schooling-intensive industries and initial levels of human
capital.
We also examine the effects of high human capital levels and rapid human capital accumu-
lation on growth in human-capital-intensive industries separately in countries with low and
countries with high tariffs. In countries with low tariffs, we find positive and statistically sig-
nificant effects of education levels and improvements on output growth in schooling-intensive
industries. As pointed out by Ventura (1997), it is such shifts in the production structure that
allow open economies to avoid falling returns to human capital. In countries with high tar-
iffs, the effects of education levels and improvements on output growth in schooling-intensive
industries are often statistically insignificant.
The remainder of the paper is structured as follows. Section 2 presents a model that
illustrates the effects of human capital on growth in more compared to less human-capital-
intensive industries. Section 3 explains the sources and main features of our data. Section
4 presents our main empirical results. Section 5 contains additional evidence. In Section 6,
we consider additional robustness checks. Section 7 concludes.
2 Theoretical Framework
We now explain how a country’s capacity to adopt world technologies, which following Nelson
and Phelps (1966) we assume depends on its human capital, may affect production in human-
capital-intensive industries. Our theoretical framework links human capital and industry
production both in steady state and during the transition to a new steady state triggered by
an acceleration of skilled-labor augmenting technical change. This allows us to illustrate the
positive effect of initial human capital on output growth in human-capital-intensive industries
during such a transition.
10ECBWorking Paper Series No 623May 2006

The world consists of many open economies, indexed by c, that can produce in two indus-
tries, indexed by s = 0, 1. There are two types of labor, high and low human capital, and we
denote their supply in country c at time t byMc,t and Lc,t respectively. The efficiency levels
ALc,t and A
Mc,t of the two types of labor evolve over time and depend on each country’s capac-
ity to adopt world technologies. Following Nelson and Phelps (1966), we assume efficiency
growth Afc,t =
³∂Af
c,t/∂t´/Af
c,t of labor of type f = L,M (hats indicate growth rates) to be
increasing in the gap between country efficiency Afc,t and world-frontier efficiency Af,W
t (W
indicates the world frontier),
(1) Afc,t = φf (Hc,t)
ÃAf,Wt −Af
c,t
Afc,t
!where φf (H) captures the country’s capacity of technology adoption, which is increasing in
its human capital H ≡M/L. The only difference between this framework and that of Nelson
and Phelps is that we distinguish between technologies augmenting the efficiency of high and
low human capital workers, as in the literature on skill-biased and directed technical change
(e.g. Acemoglu, 1998, 2003a; Acemoglu and Zilibotti, 2001; Caselli and Coleman, 2002,
2005).2
Output Xs,c,t in industry s and country c at time t is produced according to Xs,c,t =
Dc,tEs,t(Ac,tL)1−s(Ac,tM)
s where D captures country-level efficiency and E industry-specific
technology. Hence, industry 1 uses only high human capital labor, while industry 0 uses only
low human capital labor. This extreme assumption regarding factor intensities simplifies our
analysis, but is not necessary for the implications that follow.
To examine how steady-state production levels depend on a country’s capacity to adopt
technologies we suppose constant efficiency growth at the world-frontier, AL,Wt = gL and
AM,Wt = gM . Each country’s human capital Hc, and hence its capacity to adopt technologies
(φLc and φMc ), are assumed to be constant in time. In steady state, efficiency in each country
grows at the same rate as at the world-frontier. Equation (1) therefore implies that the
steady-state level of efficiency of labor of type f = L,M in country c is Af∗c,t =
φfcgf+φfc
Af,Wt
(asterisks denote steady-state values). Hence, the greater the capacity of countries to adopt
technologies, the closer their steady-state efficiency levels to the world-frontier. It is now
immediate to determine steady-state output in sector s in country c as2Acemoglu (2003b) discusses the relationship between the Nelson and Phelps model and the literature
on directed technical change.
11ECB
Working Paper Series No 623May 2006

(2) X∗s,c,t = Dc,tEs,tLc,t
µφLc
gL + φLcAL,Wt
¶1−sµφMc
gM + φMcAM,Wt Hc
¶s
where we have assumed that competitive labor markets ensure full employment. Steady-
state production in the high relative to the low human capital industry, Z∗c,t ≡ X∗1,c,t/X
∗0,c,t,
in country c as compared to q is therefore
(3)Z∗cZ∗q
=
∙Hc
Hq
¸⎡⎣¡φMc /φLc¢ ³ gL+φLc
gM+φMc
´¡φMq /φLq
¢ ³ gL+φLqgM+φMq
´⎤⎦ .
This expression does not depend on country-level efficiency because we are comparing two
industries within each country; it does not depend on industry-level technology because we
are comparing the same industries in different countries.
Equation (3) implies that country c’s human capital Hc has a factor supply effect and a
technology adoption effect on its steady-state production structure as compared to country
q. The factor supply effect (captured by the first square bracket) is straightforward. An
increase in human capital means an increase in the relative supply of the factor used by the
human-capital-intensive industry and therefore relatively greater production in the human-
capital-intensive industry. The focus of our theoretical framework is on the technology
adoption effect (captured by the second square bracket). This effect can reinforce the factor
supply effect or work in the opposite direction, depending on whether it is skilled or unskilled-
labor-augmenting technology that is progressing faster at the world frontier. For example,
consider the case where human capital has the same impact on the capacity to adopt skilled
and unskilled-labor augmenting technologies, φM(H) = φL(H) for all H. Suppose first
that skilled-labor augmenting technical progress at the world frontier exceeds unskilled-
labor augmenting technical progress, gM>gL. In this case, a higher level of human capital
Hc will translate into more human-capital-intensive production in the long run through the
technology adoption effect. This is because human capital facilitates the adoption of all
technologies equally and it is skill-augmenting technology that is advancing more rapidly
at the frontier. Now suppose instead that gL>gM . In this scenario it is unskilled-labor
augmenting technology that is progressing faster at the frontier. The technology adoption
effect of higher human capital levels will therefore shift production towards the low human
capital industry.
12ECBWorking Paper Series No 623May 2006

We now suppose that skilled-labor augmenting efficiency growth gM at the world fron-
tier increases at some time T .3 Equation (3) implies that this acceleration of skilled-labor
augmenting technical change translates into an increase in Z∗c /Z∗q if and only if Hc > Hq.
Countries with high levels of human capital will therefore experience an increase in steady-
state production levels in the human-capital-intensive industry relative to countries with
low human capital. As a result, they will see relatively faster growth in the human-capital-
intensive industry during the transition to the new steady state.4 Formally, using lower-case
variables to denote logs of upper-case variables,
(4) ∆zc −∆zq ≡ [zc,t − zc,T ]− [zq,t − zq,T ] = g(hc,T+
)− g(hq,T+
)
for t > T , where g(h) is strictly increasing in h. Value added in each industry is Ys,c,t ≡Ps,tXs,c,t where Ps,t denotes international prices. The production function implies that growth
of value added between T and t equals ∆ys,c,t ≡ ys,c,t − ys,c,T = ∆dc +∆lc +∆ps +∆es +
s∆aMc + (1− s)∆aMc . Combined with (4) this yields
(5) ∆ys,c = [∆dc +∆lc]| {z }λc
+ [∆ps +∆es]| {z }µs
+ η + g(hc,T+
)s.
The country-specific effect λc captures country-level labor-force and total-factor-productivity
growth, while the industry-specific growth effect µs is the sum of price changes and industry-
specific technical progress. η captures unskilled-labor augmenting technical change. Accord-
ing to (5), the impact of initial human capital on growth during the transition is greater in
the human-capital-intensive industry.5 This is what we refer to as the human capital level
effect on output growth in human-capital-intensive industries.3For evidence that there was such an acceleration sometime around the early 1970’s, see Autor, Katz, and
Krueger (1998), Berman, Bound, and Machin (1998), Berman and Machin (2000), and Caselli and Coleman(2002). We take this acceleration to be exogenous. See Acemoglu (1998, 2002) and Acemoglu and Zilibotti(2001) for models that endogenize the rate of directed technical change at the technology frontier.
4This is because they adopt new skill-augmenting technologies more rapidly. Many of the new technologiesbecoming available since the 1970’s were embodied in computers. Faster technology adoption in countrieswith high human capital levels should therefore have been accompanied by greater computer imports. Thisis what Caselli and Coleman (2001) find for the 1970-1990 period.
5During the transition, the TFP growth differential between the high and the low human capital industryis greater in a country with high than a country with low human capital. Our framework does not makepredictions about whether this TFP growth differential is positive or negative. The evidence on the linkbetween human capital intensity and TFP growth across U.S. industries is mixed. While there appears tobe a positive link in the late 1970’s and early 1980’s (Kahn and Lim, 1998), there is no such relationshipover longer periods (Klenow, 1998).
13ECB
Working Paper Series No 623May 2006

So far we have assumed that human capital in each country is constant in time. As a
result, human capital affects industry output growth only through technology adoption in
(5). When human capital levels increase in time there is also a factor supply effect.6 As
industries are assumed to be at opposite extremes in terms of their human capital intensity,
this effect takes a particularly simple form in our framework. A one percent increase in
human capital leads to a one-point output growth differential between the high and the low
human capital industry over the same time period. With non-extreme factor intensities, the
implied output growth differential would be larger (e.g. Ventura, 1997). This is because
an increase in human capital would lead to labor moving from the less to the more human
capital intensive industry (assuming the economy is not fully specialized). We refer to the
positive effect of factor supply on output growth in human-capital-intensive industries as the
human capital accumulation effect.
The factor supply effect linking human capital and relative production levels in the
human-capital-intensive industry in (3) does not carry through to single industry pairs in a
neoclassical multi-industry model. It can be shown, however, that human capital abundant
countries will still specialize in human-capital-intensive industries on average (e.g. Dear-
dorff, 1982; Forstner, 1985). Furthermore, as shown by Romalis (2004), the positive effect of
human capital abundance on relative production levels in human-capital-intensive industries
reemerges for single industry pairs once monopolistic competition and transport costs are
incorporated into an otherwise standard neoclassical multi-industry model.7
3 Data
Data on real growth of value added during the 1980’s at the country-industry level (GROWTHs,c)
come from the finance and industry growth literature (e.g. Rajan and Zingales, 1998;
Claessens and Laeven, 2003; Fisman and Love, 2003, 2004) and have originally been put
together by Rajan and Zingales (henceforth RZ) using the Industrial Statistics of the United
Nations Industrial Development Organization. The data refer to 37 industries in 42 coun-
6Increases in human capital could also affect industry output growth through technology adoption. Sucheffects are likely to be small in our empirical application because it takes time for additional human capitalto translate into new technologies.
7Romalis (2004) integrates the Dornbusch, Fischer, and Samuelson (1980) two-factor multi-industryHeckscher-Ohlin model with Krugman’s (1980) trade model with monopolistic competition and trade costs.He shows that this yields cogent theoretical foundation for cross-country cross-industry comparisons.
14ECBWorking Paper Series No 623May 2006

tries.8 We match this data with country-industry employment growth during the 1980’s
(EMPGRs,c) using the latest update of the Industrial Statistics (UNIDO, 2004).9 The Data
Appendix contains a list of the countries in the sample and also provides detailed definitions
and sources for all variables.
The finance and growth literature is also the source of the industry-level data needed
to account for the effects of financial development and property rights protection on indus-
try growth. RZ argue that financial development should matter most for external-finance-
dependent industries. To test this hypothesis they develop an industry-level measure of
external-finance dependence (EXTFIN) using COMPUSTAT financial statement data for
U.S. firms in the 1980’s. Claessens and Laeven (2003) use the same data source to obtain a
measure of the intangible asset intensity of industries (INTANG) and show that intangible-
asset-intensive industries grow faster in countries with better property rights protection.
Additional industry characteristics will be discussed as we use them.
Our industry-level measure of human capital intensity is also based on U.S. data. The
main reason is the detail and quality of U.S. industry statistics. Another reason is that
U.S. labor markets are less regulated than those of other high-income countries for which
some industry data are available (Djankov et al., 2004). Observed differences in human cap-
ital intensities across industries are therefore likely to better reflect underlying technological
characteristics of industries. Moreover, as we examine the role of human capital for industry
growth jointly with that of finance and property rights, it is natural to maintain the same
benchmark country for industry-level measures as the finance and industry growth litera-
ture. Using U.S. data to proxy for differences in human capital intensities across industries
in all other countries does have drawbacks. Most importantly, it could lead us to reject
our hypotheses linking country-level human capital to growth in human-capital-intensive
industries not because they are false but because U.S. data does not yield good proxies for
cross-industry differences in human capital intensities in other countries. What matters for
avoiding such a false negative is that differences in the human capital intensity across U.S.
industries reflect inter-industry differences in human capital intensities in other countries.
It is not necessary for industries to use human capital with the same intensity in different
countries.8The data is at the 3 and 4-digit International Standard Industrial Classification level. RZ do not include
the U.S. in their sample because all necessary industry characteristics are obtained using U.S. data.9Employment growth refers to the 1981-1990 period (while the output growth data refers to the 1980-1989
period), because the UNIDO database does not contain much employment data before 1980.
15ECB
Working Paper Series No 623May 2006

The data source for our industry-level measure of human capital intensity is the 1980
Integrated Public Use Microdata Series. This database contains individual-level data on
hours worked by 4-digit industry classifications and years of education. This allows us
to calculate average years of employee schooling (HCINT ) for all industries in the RZ
sample.10 Table I reports the schooling intensity for all industries. The two most schooling-
intensive industries are Drugs and Computing and the two least schooling intensive are
Leather and Apparel.11 Table II, Panel A gives the correlation between HCINT and the
industry-level rankings used in studies on finance and industry growth. It can be seen
that schooling-intensive industries also tend to rely more on external finance (the correlation
betweenHCINT and EXTFIN is 0.56). Hence, controlling for industry schooling intensity
may be important to precisely quantify the differential growth effect of deeper financial
markets on external-finance-dependent industries.
Average years of schooling at the country level (SCH) is taken from the Barro and Lee
(2001) database. For completeness and to address issues related to measurement error we
also employ the schooling dataset of Cohen and Soto (2001). Starting with Hanushek and
Kimko (2000), recent work (e.g. Barro, 2001; Bosworth and Collins, 2003) has found that
schooling quality is an important determinant of economic growth. Hanushek and Kimko
collect data on the results of internationally administered tests in mathematics and sciences
and process the data to make them comparable across years and countries. This data is then
used to obtain a measure of country schooling quality. We use this schooling quality measure
as extended and updated by Bosworth and Collins (2003). Following Hanushek and Kimko,
we refer to this human capital measure as labor-force quality (LFQUAL).
Country-level financial development measured as private credit over GDP (PRIV ) and
the indicator of property rights protection (PROP ) are taken from Fisman and Love (2003)
and Claessens and Laeven (2003) respectively.12 Other country-level variables come from
standard sources. Table II, Panel B gives the correlation between the main country-level
variables. It can be seen that higher education levels go together with deeper financial
10We also calculate the share of employees with at least 12 years of education (necessary for complet-ing secondary school) and at least 16 years of education (college), HCINT (SEC) and HCINT (COLL)respectively. Table II, Panel A shows that the correlations with average schooling are above 0.92.11An often used measure of industry human capital intensity is the share of non-production workers in
total employment (NONPROD). Table II, Panel A shows that the correlation between NONPROD andHCINT is high (0.87).12Private credit to GDP is an often used proxy of financial depth (e.g. Djankov, McLiesh, and Shleifer,
2005). We also try other proxies like stock market capitalization to GDP and domestic credit to GDP. Allour results are robust to using these alternative indicators.
16ECBWorking Paper Series No 623May 2006

markets (the correlation between SCH and PRIV is 0.41). This is another reason why
controlling for education may be important to precisely quantify the differential effect of
financial development on industry growth. Education levels are also significantly positively
correlated with property rights protection (the correlation between SCH and PROP is 0.61).
4 Main Results
We start by examining whether countries with high levels of human capital experienced fast
output growth in more compared to less human-capital-intensive industries in the 1980’s.
Then we turn to the hypothesis that growth in human-capital-intensive industries was posi-
tively related to human capital accumulation. We conclude by examining the two hypotheses
jointly.
4.1 Human Capital Levels and Industry Growth
We test for the effect of human capital levels on growth in human-capital-intensive industries
using the following estimating equation:
(6) ∆ys,c,1990−1980 = λc + µs + δ (hc,1980 ∗HCINTs) +OtherControls
where the dependent variable is real valued added growth in industry s in country c (GROWTHs,c).
HCINTs denotes the human capital intensity of industries and hc the human capital level of
countries. λc and µs are country and industry-specific growth effects respectively. OtherControls
comprises interactions between industry and country-characteristics used to capture the dif-
ferential industry growth effects of finance and property rights protection. It also includes
the share of industry s in total manufacturing value added of country c at the beginning of
the sample (FRACTs,c), which RZ and subsequent contributions to the finance and industry
growth literature use to account for initial conditions. There is a human capital level effect
on output growth in human-capital-intensive industries in (6) if δ > 0.
The results of estimating (6) are reported in Table III. t-statistics adjusted for het-
eroskedasticity are reported in parentheses and italics below the point estimates. In columns
(1)-(4) human capital levels are proxied with Barro-Lee average years of schooling (SCH)
in 1980. The estimate of δ in column (1) is 0.0034 and highly statistically significant. This
17ECB
Working Paper Series No 623May 2006

coefficient implies an annual growth differential of 1.77% between the industry at the 75th
percentile (Chemicals) and the 25th percentile (Pottery) of human capital intensity in a coun-
try with average schooling years at the 75th percentile (e.g. Japan) compared to a country
at the 25th percentile (e.g. Portugal). This implied growth differential is tabulated for all
specifications in the bottom row of the Table. The education level effect is somewhat larger
in magnitude than the (analogously calculated) unconditional effect of financial development
on growth in external-finance-dependent industries documented by RZ (0.9%-1.3%). It is
also somewhat larger than Claessens and Laeven’s (2003) unconditional effect of property
rights protection on growth in industries that use intangible assets intensively (1%-1.4%).
In columns (2)-(4) we estimate the effect of high levels of schooling on growth in schooling-
intensive industries controlling for the role of financial development and property rights pro-
tection for growth in external-finance-dependent and intangible-asset-intensive industries re-
spectively. The positive impact of human capital levels on growth in human-capital-intensive
industries is robust to the inclusion of the RZ finance interaction (PRIVc ∗ EXTFINs) in
column (2) and the inclusion of the Claessens and Laeven (2003) property rights interaction
(PROPc∗INTANGs) in column (3). When we control for both the finance and the property
rights interactions in column (4) however, the human capital level effect drops by a third
and becomes (marginally) insignificant.
To investigate the link between the effect of human capital levels on industry growth and
industry human capital intensity in a more flexible way we implement the following two-step
approach. In the first step we estimate the marginal effect of average years of schooling
in 1980 on industry output growth separately for each industry. This is done by replacing
δhc ∗HCINTs in (6) withPi
δihc ∗ I[i = s], where I[i = s] is an indicator variable that is
unity when i equals s and zero otherwise. In the second step we plot the estimated industry-
specific marginal growth effects δs against industry schooling intensity (HCINTs). The
positive correlation between the two in Figure 1a indicates that high education levels were
more important for growth in industries that employ schooling intensively. This relationship
does not appear to be driven by a few industries only. The link is weaker in Figure 1b where
we use estimates of marginal growth effects δs that control for the differential industry growth
effects of financial development and property rights protection.
In columns (5)-(8), we proxy human capital levels with schooling quality. Columns (5)
and (6) show that the schooling quality interaction with industry human capital inten-
18ECBWorking Paper Series No 623May 2006

sity (LFQUALc ∗ HCINTs) enters positively and significantly at the 1% level, whether
or not the differential industry growth effects of finance and property rights are accounted
for. Hence, countries with a high quality labor force experienced relatively faster growth
in human-capital-intensive industries. According to the estimate in column (6), the an-
nual output-growth differential between an industry with a human capital intensity at the
75th percentile (Chemicals) and an industry with a human capital intensity at the 25th
percentile (Pottery) is around 2% higher in a country with educational quality at the 75th
percentile (e.g. Malaysia) than a country with educational quality at the 25th percentile
(e.g. Philippines). Columns (7) and (8) show that the schooling quantity interaction be-
comes insignificant when human capital quality is taken into account. Our cross-country
cross-industry growth results therefore add to the micro and cross-country evidence on the
importance of human capital quality (e.g. Hanushek, 2004).
To examine the link between the marginal growth effect of schooling quality and industry
schooling intensity in a more flexible way, we return to the two-step approach. We first
estimate the effect of schooling quality on industry output growth allowing for different
effects in each industry. In the second step we plot the estimated industry-specific effects
against industry human capital intensity. The strong positive correlation between the two
is evident in Figure 2a and also in Figure 2b where we control for the differential industry
growth effects of financial development and property rights protection. Hence, schooling
quality matters more for growth in industries that use schooling intensively. Moreover, the
link does not seem to be driven by a few industries only.
4.2 Human Capital Accumulation and Industry Growth
To analyze the effect of human capital accumulation on growth in human-capital-intensive
industries, we use an appropriately modified version of the two-step approach. We first
estimate
(7) ∆ys,c,t = λc + µs +Xi
θi∆hc,1970−1990 ∗ I[i = s] +OtherControls
where ∆hc,1970−1990 stands for the increase in average years of schooling at the country
level between 1970 and 1990 and I[i = s] takes the value one when i equals s and zero
19ECB
Working Paper Series No 623May 2006

otherwise.13 This estimating equation yields the effect of schooling improvements on growth
for each industry (θs).14 These effects can then be compared to the schooling intensity of
industries to examine whether there is a (positive) relationship.
In Figure 3a, we plot each industry’s human capital intensity (HCINTs) against our
estimates of the effect of improvements in country-level schooling on output growth in that
industry. Figure 3b repeats the exercise using estimates of θs that control for the differential
role of financial development and property rights protection for external-finance-dependent
and intangible-asset-intensive industries respectively. Both figures show a clear positive rela-
tionship between the effect of human capital accumulation on output growth in an industry
and that industry’s human capital intensity. Hence, improvements in education were more
important for growth in industries that employ schooling intensively.
To test the hypothesis of a positive link between human capital accumulation and growth
in human-capital-intensive industries we estimate
(8) ∆ys,c,t = λc + µs + θ (∆hc,1970−1990 ∗HCINTs) +OtherControls.
Table IV reports the results for different sets of controls. The positive and highly statistically
significant estimate of θ in columns (1)-(4) indicates that growth of more compared to less
schooling-intensive industries was faster in countries with greater improvements in education.
To get a sense for the size of this effect, consider the comparison between a country with an
improvement in schooling over the 1970-1990 period at the 75th percentile (e.g. Philippines
with an improvement of 2.3 years) and a country at the 25th percentile (e.g. Sri Lanka with
an improvement of 1.1 years). According to the estimate of θ in column (4), the associated
gap in annual output growth between Chemicals (with a schooling intensity at the 75th
percentile) and Pottery (at the 25th percentile) is 1.11%. This implied growth differential is
tabulated for all specifications in the bottom row of the Table.
The cross-country growth literature finds that the effect of human capital accumulation
on output growth is sensitive to controlling for physical capital accumulation (e.g. Benhabib
and Spiegel, 1994; Krueger and Lindahl, 2001). This has been attributed to measurement
13We use schooling improvements over the 1970-1990 period because of the evidence indicating that mea-surement error increases as shorter time-intervals are considered (e.g. Krueger and Lindahl, 2001). Wepresent results for the 1980-1990 period in Section 6.14For a survey of work estimating such unconstrained industry growth effects for several production factors
see Harrigan (2001).
20ECBWorking Paper Series No 623May 2006

error in schooling data combined with human capital accumulation being highly positively
correlated with physical capital accumulation (e.g. Mankiw, 1995; Krueger and Lindahl,
2001). We now examine whether the positive effect of human capital accumulation on growth
in human-capital-intensive industries is sensitive to controls for the impact of physical capital
accumulation. Country-level growth effects of physical capital accumulation are captured by
country fixed effects in our framework. Physical capital accumulation could still affect our
findings however, because it may interact with physical capital requirements of industries. In
columns (5) and (6), we check on this possibility by adding an interaction between industry
investment intensity (INV INTs) and the increase in physical capital per worker at the
country-level between 1970 and 1990 (∆Kc/Lc).15 INV INT comes from RZ and is defined
as the ratio of capital expenditure to property plant and equipment of U.S. firms in the 1980’s.
In column (5), INV INTs∗∆Kc/Lc enters positively and statistically significantly. In column
(6), the investment interaction is rendered statistically insignificant by the inclusion of the
RZ financial development and the Claessens and Laeven (2003) property rights protection
interactions. Columns (5) and (6) show that the positive effect of schooling improvements
on growth in schooling-intensive industries remains statistically significant at the 1% level
and of the same magnitude as in previous specifications. This result is robust to using
other measures of industry physical capital intensity or using country-level investment rates
instead of changes in physical capital.16
Our results on the effect of human capital accumulation on the pattern of specialization in
production fit nicely with Romalis’ (2004) work. Romalis’ theoretical framework yields that
the impact of human capital accumulation on industry output and export growth is increasing
in the industry’s human capital intensity (a result he refers to as the quasi-Rybczynski pre-
diction). He examines the export growth prediction using data on U.S. imports by industry
and country of origin for the 1972-1998 period and finds that imports from countries experi-
encing rapid human capital accumulation did in fact grow most in human-capital-intensive
industries.17
15We calculate the capital stock of countries using Penn World Table data and following the perpetualinventory method as implemented by Hall and Jones (1999) and Caselli (2005). The dates are chosen tomake the treatment of physical capital symmetric to that of schooling.16We experiment with three measures obtained from the latest update of the NBER-CES U.S. manufac-
turing industries database (Bartelsman and Gray, 1996). Capital stock over value added, capital stock overemployment, and one minus the labor share in value added.17Romalis’ model also yields that human capital abundant countries specialize in human-capital-intensive
industries (the quasi-Heckscher-Ohlin prediction). He finds that this prediction is also supported by U.S.import data. Fitzgerald and Hallack (2004) find support for the quasi-Heckscher-Ohlin prediction usingproduction data for 21 OECD countries in 1988.
21ECB
Working Paper Series No 623May 2006

4.3 Joint Human Capital Accumulation and Level Effects
In Table V, we present the results of estimating jointly the human capital level effect and
the human capital accumulation effect using
(9) ∆ys,c,t = λc+µs+δ (hc,1970 ∗HCINTs)+θ (∆hc,1970−1990 ∗HCINTs)+OtherControls.
The results in columns (1) and (2) confirm our previous findings that growth in schooling-
intensive industries is increasing in both initial years of schooling and improvements in
schooling.18 Point estimates are similar to those obtained in our previous analysis (and of
higher statistical significance). For example, controlling for finance and property rights, the
industry at the 75th percentile of human capital intensity is predicted to grow by 1.22% faster
annually than the industry at the 25th percentile in a country with schooling improvements at
the 75th percentile compared to a country at the 25th percentile. The analogously calculated
growth differential for the schooling level effect is 1.27%.
In columns (3) and (4), we repeat the analysis using schooling quality instead of schooling
years to measure human capital levels. The schooling quality and the schooling improve-
ment interactions with industry human capital intensity are both positive and statistically
significant. Point estimates are again similar to those obtained earlier.
In columns (5) and (6), we reexamine whether growth in human-capital-intensive indus-
tries is more closely related to human capital levels proxied with years of schooling or with
schooling quality. The results confirm our previous finding that initial years of schooling
turns insignificant when schooling quality is taken into account.
In columns (7) and (8), we add two interactions to capture possible differential effects of
high physical capital levels and rapid physical capital accumulation on growth in investment-
intensive industries. The first interaction, between the RZ industry-level investment inten-
sity and the increase in physical capital per worker between 1970 and 1990, captures growth
effects of physical capital accumulation on investment-intensive industries. The second inter-
action, between the RZ industry-level investment intensity and physical capital per worker
in 1970, accounts for possible industry growth effects of high initial levels of physical capital.
Both interactions are statistically insignificant. Most importantly from our point of view,
18As improvements in schooling refer to the 1970-1990 period, initial years of schooling is measured in1970.
22ECBWorking Paper Series No 623May 2006

the human capital accumulation and the human capital level effects retain their statistical
and economic significance. This is the case when human capital levels are proxied with years
of schooling in column (7) and when they are proxied with schooling quality in column (8).19
The results in Table V confirm RZ’s and Claessens and Laeven’s (2003) argument that
deep financial markets foster growth in external-finance-dependent industries and that good
property rights protection generates growth in industries using intangible assets intensively.
The two corresponding interactions are always positive and significant at conventional con-
fidence levels. But the magnitude of these effects is smaller than in the previous literature.
The estimate of the RZ finance interaction in Table V implies an annual output growth differ-
ential between an industry at the 75th percentile of external-finance dependence and one at
the 25th percentile that is 0.85% higher in a country with financial development at the 75th
percentile than a country at the 25th percentile. This effect is 60%− 65% of that reported
by RZ and Claessens and Laeven. Regarding the role of property rights protection, our esti-
mates predict that the output growth differential between an industry at the 75th percentile
of intangible asset intensity and an industry at the 25th percentile is 0.85%− 0.95% higher
in a country with a property rights protection index at the 75 percentile than a country at
the 25th percentile. This growth differential is approximately 75% − 85% of that reported
by Claessens and Laeven.
5 Further Evidence
We start by taking into account additional effects of financial development on industry
growth. Then we examine the role of human capital using industry-level employment growth
to measure changes in the pattern of specialization. We conclude by analyzing the effect of
human capital on growth in human-capital-intensive industries separately in countries with
low and high tariffs.
5.1 Financial Development, Human Capital and Industry Growth
In their recent contributions to the finance and industry growth literature, Fisman and Love
(2003, 2004) identify additional effects of financial depth on growth. Fisman and Love (2003)
19These results are robust to using the three alternative measures of physical capital intensity at theindustry level discussed in Footnote 16.
23ECB
Working Paper Series No 623May 2006

show that industries with easier access to trade credit grow relatively faster in countries with
underdeveloped financial markets.20 To check how their finding affects our estimates of the
human capital level and accumulation effect, we include an interaction between country-
level financial development and industry-level trade-credit affinity among the controls in (9).
Industry trade-credit affinity (TRADEINT ) is taken from Fisman and Love and is defined
as the ratio of accounts payable to total assets of U.S. firms in the 1980’s. The results are
reported in Table VI, columns (1) and (2). The effects of education levels and improvements
on growth in schooling-intensive industries remain statistically significant and of a similar
magnitude as in previous specifications. This is the case whether human capital levels are
proxied with years of schooling or schooling quality. The finance-trade credit interaction
enters with a statistically significant negative coefficient; the magnitude of the effect is very
close to that documented by Fisman and Love.
Fisman and Love (2004) show that deeper financial markets lead to rapid growth in
industries with good prospects. To check the robustness of our findings to this additional
link between financial development and industry growth, we add an interaction between
financial development and industry growth opportunities to our regressions. The growth
opportunities variable (OPPORT ) is taken from Fisman and Love and is constructed using
U.S. data on industry-level sales growth in the 1980’s. Columns (3) and (4) show that the
effects of human capital levels and human capital accumulation on growth in human-capital-
intensive industries remain positive, statistically significant, and of a similar magnitude as in
earlier specifications. Financial development has a significant positive effect on the growth of
industries with good prospects and the magnitude of this effect is very close to that found by
Fisman and Love. Like Fisman and Love, we find that accounting for the growth prospects
channel linking financial development and industry growth renders the interaction between
industry external-finance dependence and financial development statistically insignificant.
Columns (5) and (6) jointly account for the trade-credit and growth-opportunities interaction
with financial development. Both the human capital level and accumulation effect on growth
in human-capital-intensive industries continue to be highly significant.21
20Theoretical work suggests that this is because trade credit and external finance are substitutes (e.g.Petersen and Rajan, 1997).21Following RZ and Fisman and Love (2004), we also examine the sensitivity of our results to extreme
observations by dropping the top and bottom one percent of output growth observations and using a ro-bust regression approach. The coefficients on the human capital level and the human capital accumulationinteractions remain positive and significant at the 1% level in both cases.
24ECBWorking Paper Series No 623May 2006

5.2 Human Capital and Industry Employment Growth
Did faster output growth in human-capital-intensive industries due to human capital level
and accumulation effects coincide with the reallocation of employment? To address this
question, we repeat our previous empirical analysis using employment growth (EMPGRs,c)
as the dependent variable. This allows us to test whether high levels of human capital and
fast human capital accumulation were associated with rapid employment growth in human-
capital-intensive industries.
There is an additional reason for checking our results using employment data to measure
changes in international specialization. As shown by Krueger and Lindahl (2001), a positive
effect of human capital levels on subsequent output growth in cross-country regressions could
be due to a world-wide increase in the individual return to human capital (whatever its
cause). Our results linking human capital levels to output growth in human-capital-intensive
industries could therefore be partly driven by rising individual returns to education.22
Table VII presents the results of our employment growth regressions. The main finding
is that the effects of human capital levels and human capital accumulation on employment
growth in human-capital-intensive industries are positive and always significant at the 1%
level. This is the case whether we proxy human capital levels with years of schooling in
columns (1)-(4) or schooling quality in columns (5)-(8). The effect of human capital levels
on employment growth is larger than on output growth. For example, consider the annual
employment growth differential between an industry with a schooling intensity at the 75th
percentile (Chemicals) and an industry at the 25th percentile (Pottery). When we proxy
human capital levels with years of schooling, our estimates imply that this growth differen-
tial is around 1.7% higher in a country with schooling at the 75th percentile (e.g. Japan)
compared to a country with schooling at the 25th percentile (e.g. Portugal). When we proxy
human capital levels with schooling quality, the implied annual Chemicals-Pottery growth
differential is 2% greater in countries with schooling quality at the 75th percentile (e.g.
Malaysia) than countries with schooling quality at the 25th percentile (e.g. Philippines).23
When included jointly in our regressions, both years of schooling and schooling quality are
now significantly positively related to growth in schooling-intensive industries (results not
in the Table). Interestingly, the employment growth regressions have a markedly higher
22We are grateful to Joshua Angrist and David Weil for discussions that clarified these points.23The finance effects are usually weaker than in previous tables. This is not surprising as the finance-
industry growth connection works through investment and capital deepening.
25ECB
Working Paper Series No 623May 2006

adjusted R2 (around 43%) than the output growth regressions (around 26%, see Table VI).
One explanation for this difference is that value added data are recorded with greater error
than employment.24
5.3 Openness
We now examine the effects of high human capital levels and rapid human capital accumu-
lation on growth in human-capital-intensive industries separately in countries with low and
countries with high tariffs during the 1980’s. The tariff data come from Sachs and Warner
(1995) and the World Bank (the only two sources available). The World Bank data con-
sist of an unweighted average of tariffs on all goods and the Sachs and Warner data of an
import-weighted average of tariffs on intermediates and capital goods. Both average tariff
series are therefore only very rough proxies for effective tariffs. In Table VIII, Panel A, we
split economies into those with average tariffs during the 1980’s below and above the median.
Splitting the data this way results in the same number of low and high tariff countries. These
tariff thresholds turn out to be rather low however. The median Sachs and Warner tariff is
11% and the median World Bank tariff is 15%. In Panel B, we therefore also split economies
into those with average tariffs below and above 40%.25
In countries with low tariffs, we find that the effect of human capital accumulation on
growth in human-capital-intensive industries is positive and significant at the 1% level in all
specifications. The human capital level effect in low-tariff countries is also highly significant
when we proxy human capital levels with schooling quality. Proxying human capital levels
with schooling years yields a statistically significant human capital level effect at the 10%
level in 3 out of 4 cases (the weaker human capital level effect using schooling years mirrors
previous findings).
Our estimates of the human capital level and accumulation effect for high-tariff countries
are noisier than for low-tariff countries, especially when we use the 40% tariff threshold.26
As a result, such effects are often statistically insignificant. For example, the effect of human
24Both RZ and Fisman and Love (2004) note that the distribution of value added growth has ratherlong tails. For example, annual output growth at the 1st and 99th percentile is −30% and +27%. Thedistribution of employment growth is more compact. For example, its standard deviation is only half thatof output growth. Greater noise in the value added data could, for example, be due to the difficulties indeflating nominal value added, see RZ.25Sachs and Warner use such 40% tariff threshold to classify economies into open and closed.26This could be due to domestic industry demand shocks playing a bigger role for industry output growth
in high-tariff countries.
26ECBWorking Paper Series No 623May 2006

capital accumulation on growth in human-capital-intensive industries is always insignificant
in economies with tariffs above 40%.27 In economies with tariffs above the median, the human
capital accumulation effect is positive but insignificant at the 5% level in 3 out of 4 cases.28
The human capital level effect is also statistically insignificant in high-tariff economies. We
find similar results when we use employment growth to measure changes in the pattern of
specialization (results not in the Table).
6 Sensitivity Analysis
We first examine the sensitivity of our results to the measurement of schooling improvements.
Then we present estimates using an alternative specification for the link between human
capital and years of schooling. We conclude by putting our output and employment growth
results through further sensitivity checks.
6.1 Measurement of Schooling Improvements
We start by investigating the robustness of our results to using improvements in education
between 1980 and 1990 as an explanatory variable. Then we examine whether our findings
are sensitive to using the schooling series of Cohen and Soto (2001).29 We also implement
Krueger and Lindahl’s (2001) approach to measurement error in schooling data.
Our results are summarized in Table IX. Estimates are conditional on the impact of
financial development on growth in trade-credit-intensive industries, the impact of financial
development on growth in industries with good prospects, and the impact of property rights
protection on growth in intangible-asset-intensive industries.30 In column (1), we measure
27Point estimates of the education level and improvement effect in countries with tariffs above 40% turnout to be very sensitive to the specification and/or estimation method used. For example, using a robustregression approach turns the (imprecise) positive effect of schooling quality on growth in schooling-intensiveindustries into a (imprecise) negative effect.28The effect of human capital accumulation on the production of human-capital-intensive goods in closed
economies can be positive, negative, or zero, depending on the price elasticities of demand (e.g. Ventura,1997). None of the countries in our sample is closed to international trade. For example, trade over GDPin the 1980’s in the 6 countries with highest tariffs is above 20% for all except India (the average includingIndia is 34%; the Penn World Table average is 73%).29The main differences between the Cohen-Soto and Barro-Lee datasets are that Cohen and Soto use
more census observations, employ a different approach to extrapolate missing data, and change values theyconsider implausible.30Results are not reported. The three corresponding interactions are significant at standard levels in nearly
all specifications in Tables IX and X, Panel A. Our results are not sensitive to the inclusion of the interaction
27ECB
Working Paper Series No 623May 2006

human capital accumulation as schooling improvements over the 1980-1990 period instead
of the 1970-1990 period. Accordingly we now use years of schooling in 1980 as initial human
capital. Both the human capital level and accumulation effect remain highly statistically
significant. In column (2), we report the results of estimating the same specification with
the Cohen-Soto data. The human capital level and accumulation effect continue to be
highly significant. In column (3), we follow the instrumental-variables strategy of Krueger
and Lindahl (2001) to deal with measurement error. Krueger and Lindahl propose using one
mismeasured schooling series as an instrument for another mismeasured series, since this
eliminates attenuation bias when measurement errors are orthogonal. We use the Cohen-
Soto schooling data as an instrument for the Barro-Lee data. In line with the findings of
Krueger and Lindahl, instrumenting leads to larger human capital level and accumulation
effects. Using employment growth to measure changes in the pattern of specialization yields
similar results (not in the Table).
6.2 Alternative Functional Form
In the cross-country growth literature there is no consensus on how aggregate schooling
measures should enter empirical analysis. In empirical labor economics it has been found
that a log-linear earnings-schooling relationship performs well (see Card, 1999, for a review).
Several macro-econometric studies have therefore adopted a log-linear model of the aggre-
gate output-schooling relationship (e.g. Heckman and Klenow, 1998; Krueger and Lindahl,
2001).31 Other macro studies use a log-log specification (e.g. Mankiw, Romer, and Weil,
1992; de la Fuente and Domenech, 2001). In Table VIII, columns (4)-(6), we reestimate
the previous three columns using log years of schooling in 1980 as a proxy of initial human
capital levels and the change in log schooling over the 1980-1990 period as a measure of
human capital accumulation (we continue to control for interactions between financial devel-
opment and trade-credit affinity, between financial development and growth opportunities,
and between property rights protection and intangible-asset intensity). These specifications
also yield support for both the human capital level and accumulation effect. We find similar
results using the log schooling specification to explain employment growth across industries
with different human capital intensities (not reported in the Table).
between financial development and industry external-finance dependence (which enters insignificantly oncethe growth prospects channel is accounted for).31Our regressions so far assumed that log human capital h is linear in SCH and LFQUAL. Caselli (2005)
uses and motivates this functional form in the (very different) context of development accounting.
28ECBWorking Paper Series No 623May 2006

6.3 Further Sensitivity Checks
Table X reports on a series of further sensitivity checks using both output growth (in Panel
A) and employment growth (in Panel B) to measure changes in the pattern of specialization.
All results continue to be conditional on the effect of financial development on growth in
trade-credit-intensive industries, the effect of financial development on growth in industries
with good prospects, and the effect of property rights protection on growth in intangible-
asset-intensive industries.
In Panel A, columns (1)-(6), we investigate to what extent growth in human-capital-
intensive industries is affected by high levels of economic development due to factors other
than human capital. An important factor of development is investment in physical capital.
Mankiw, Romer, and Weil (1992) and Klenow and Rodriguez-Clare (1997) demonstrate that
the physical capital-output ratio isolates the role of investment for long-run productivity from
that of TFP and human capital. In columns (1) and (2), we therefore include an interaction
between the physical capital-output ratio and industry human capital intensity (Kc/Yc ∗HCINTs) in our regressions. In column (1), the interaction between years of schooling
and industry schooling intensity turns statistically insignificant, while Kc/Yc ∗HCINTs is
significant at the 10% level. When human capital levels are proxied with schooling quality
in column (2), it is Kc/Yc ∗HCINTs that becomes insignificant, while the schooling quality
interaction with industry schooling intensity is significant at the 5% level. The human capital
accumulation effect is statistically significant at the 1% level in both specifications.
Acemoglu, Johnson, and Robinson (2001) show that property rights protection is key
for economic development. The specifications in columns (3) and (4) therefore include an
interaction between the degree of property rights protection and industry human capital
intensity (PROPc ∗ HCINTs). When we proxy human capital with years of schooling in
column (3), both the property rights and the human capital level interaction with industry
human capital intensity are insignificant.32 But when human capital levels are proxied with
schooling quality in column (4), the human capital level effect is significant at the 1% level,
32Average years of schooling is the country-level variable most strongly correlated with property rightsprotection in our dataset. This is not surprising as good property rights protection increases the incentivesfor (human) capital accumulation (Hall and Jones, 1999; Acemoglu, Johnson, and Robinson, 2001) and highhuman capital levels lead to institutional improvements (Glaeser et al., 2004). Note that both propertyrights protection and human capital levels are significant when interacted with industry intangible assetintensity and human capital intensity respectively (Table V, column (2)). This is an example of how focusingon possible theoretical channels can help in advancing our understanding of the growth effects of highlycorrelated country characteristics (Rajan and Zingales, 1998).
29ECB
Working Paper Series No 623May 2006

while PROPc ∗ HCINTs remains insignificant. The human capital accumulation effect
remains statistically significant at the 1% level in both cases.
In columns (5) and (6), we include an interaction between GDP per worker and industry
human capital intensity (Yc ∗ HCINTs) in our regressions. As human capital is a major
determinant of aggregate productivity, GDP per worker could actually be a better proxy
for human capital than our indicators of schooling (both because human capital is broader
than formal schooling and because formal schooling is observed with error).33 Hence, the
interaction between industry human capital intensity and aggregate productivity could cap-
ture the human capital level effect instead of the effect of high levels of development due to
factors other than human capital. In column (5), Yc ∗HCINTs enters positively and signifi-
cantly, while the coefficient on the interaction between years of schooling and industry human
capital intensity drops markedly relative to the same specification without Yc ∗HCINTs (in
column (5) of Table VI) and becomes insignificant. The interaction between industry human
capital intensity and aggregate productivity also enters positively and significantly when we
proxy the level of human capital with schooling quality in column (6). In this case, the hu-
man capital level effect only decreases by a third relative to the same specification without
Yc ∗ HCINTs (see column (6) of Table VI). As the estimate also becomes somewhat less
precise, the effect turns just insignificant. The human capital accumulation effect continues
to be statistically significant at the 1% level.
In addition to being highly statistically significant, the human capital accumulation effect
is also stable across specifications and similar to that reported earlier. This effect could,
however, partly be capturing that countries experiencing fast aggregate growth demand
more human-capital-intensive goods. It could also be capturing that rapid productivity
growth always leads to shifts towards human-capital-intensive industries because rapidly
growing countries are "modernizers". In columns (7) and (8), we therefore add an interaction
between aggregate productivity growth and industry human capital intensity (GROWTHc ∗HCINTs) to our regressions. The effect of education improvements on growth in schooling-
intensive industries remains positive and significant at the 1% level.
The specifications in Panel B use employment growth to capture changes in the pattern
33Human capital comprises education (quantity and quality) in and out of the classroom, on-the-job-learning and training, and health (Kartini Shastry and Weil, 2003). Manuelli and Seshadri (2005) show in acalibrated model that aggregate productivity is very closely related to properly measured aggregate humancapital.
30ECBWorking Paper Series No 623May 2006

of specialization but are otherwise analogous to Panel A. The employment growth regres-
sions continue to display a better fit (with an adjusted R2 around 44%) than the output
growth regressions (with an adjusted R2 around 26%, see Panel A). In columns (1) and (2),
we include the interaction between the physical capital-output ratio and industry human
capital intensity in our regressions. Both Kc/Yc ∗ HCINTs and the human capital level
interaction with industry human capital intensity enter positively and are significant at the
5% level. This is the case whether human capital levels are proxied with average years of
schooling or schooling quality. The specifications in columns (3) and (4) include the interac-
tion between the degree of property rights protection and industry human capital intensity.
PROPc ∗HCINTs enters insignificantly, while the interaction between human capital levels
and industry human capital intensity is positive and significant at the 1% level, indepen-
dently of the proxy for human capital levels used. The effect of high human capital levels on
growth in human-capital-intensive industries is significant at the 5% level in columns (5) and
(6), where we include an interaction between output per worker and industry human capital
intensity in our employment regressions. Yc∗HCINTs is positive but just insignificant when
we use schooling quality to proxy for human capital levels and positive and significant at the
5% level when we use the years-of-schooling proxy.
The specifications in columns (1)-(6) also confirm that human capital accumulation is a
highly significant determinant of employment growth in human-capital-intensive industries.
The interaction between education improvements and industry schooling intensity is always
significant at the 1% level. Moreover, as shown in columns (7) and (8), the effect of educa-
tion improvements on growth in schooling-intensive industries continues to be robust to the
inclusion of an interaction between aggregate productivity growth and industry schooling
intensity.
7 Conclusion
One way to progress in our understanding of the effects of human capital on growth is to
examine channels through which such effects could work. If high levels of human capital facil-
itate technology adoption, better-educated countries should have adopted more rapidly the
skilled-labor augmenting technologies becoming available since the 1970’s. These countries
should therefore have experienced faster output growth in more compared to less schooling-
intensive industries in the 1980’s. Theories of international specialization point to human
31ECB
Working Paper Series No 623May 2006

capital accumulation as another important determinant of growth in human-capital-intensive
industries. We therefore use data for 37 manufacturing industries in around 40 countries to
examine whether higher levels of education and greater improvements in education were
associated with faster growth in schooling-intensive industries in the 1980’s.
We find that output growth in schooling-intensive industries was significantly faster in
economies with higher education levels and greater education improvements. These results
are robust to controlling for the growth effects of well-functioning financial markets and
good property rights protection in external-finance-dependent and intangible-asset-intensive
industries respectively (Rajan and Zingales, 1998; Claessens and Laeven, 2003). They are
also robust to controlling for additional effects of domestic capital markets on industry growth
(Fisman and Love, 2003, 2004). The magnitude of the differential industry growth effects
of education levels and improvements is similar or larger than the differential growth effects
of financial development and property rights protection. Furthermore, when we examine
the differential industry growth effects of human capital using employment data, we find
even stronger evidence for positive effects of education levels and improvements on growth
in schooling-intensive industries.
32ECBWorking Paper Series No 623May 2006

A Appendix
A.1 Country Sample
Australia, Austria, Bangladesh, Belgium, Brazil, Canada, Chile, Colombia, Costa Rica, Denmark,
Egypt, Finland, France, Germany, Greece, India, Indonesia, Israel, Italy, Jamaica, Japan, Jordan,
Kenya, South Korea, Malaysia, Mexico, Morocco, Netherlands, New Zealand, Nigeria, Norway,
Pakistan, Peru, Philippines, Portugal, Singapore, South Africa, Spain, Sri Lanka, Sweden, Turkey,
United Kingdom, Venezuela, Zimbabwe.
A.2 Variable Definitions and Sources
Country-Industry Specific
• GROWTHs,c : Annual growth rate of real value added in industry s in country c over the
1980-1989 period. No data is available for Indonesia and Jamaica. Source: Rajan and Zin-
gales (1998). Original source: United Nations Industrial Development Organization (UNIDO)
Industrial Statistics, 1993.
• FRACTs,c : Share of industry s in total value added in manufacturing in country c in 1980.
Source: Rajan and Zingales (1998). Original source: UNIDO Industrial Statistics.
• EMPGRs,c : Annual growth rate of employment in industry s in country c over the 1981-
1990 period. No data is available for Costa Rica, Jamaica, and Nigeria. Source: UNIDO
Industrial Statistics. Not all International Standard Industrial Classification sectors for which
the UNIDO Industrial Statistics report data are mutually exclusive. RZ therefore calculate
the values of broader sectors net of the values of subsectors that are separately reported by
the Industrial Statistics. We follow their approach for the employment data.
Industry-Specific
• HCINT : Average years of schooling at the industry level. This variable is based on data
from the 1980 Integrated Public Use Microdata Series. We extract two series: i) hours worked
33ECB
Working Paper Series No 623May 2006

by industry and years of education; ii) number of employees by industry and education. Our
calculations are based on eight groups of educational attainment: i) 0 years of schooling; ii)
1-4 years of schooling; iii) 5-8 years of schooling; iv) 9-11 years of schooling; v) 12 years of
schooling; vi) 13-15 years of schooling; vii) 16 years of schooling; viii) more than 16 years of
schooling. Average years of schooling in each industry is obtained by multiplying the share of
employees in each educational attainment group by 0, 1, 6, 10, 12, 14, 16 and 18 respectively.
We also calculate two additional industry-level human capital intensity indicators. The ratio
of hours worked by employees with at least 12 years of schooling to total hours worked by all
employees in each industry, HCINT (SEC). And the ratio of hours worked by employees
with at least 16 years of education to total hours worked in each industry, HCINT (COLL).
We calculate the values of broader sectors net of the values of subsectors that are separately
reported by the Industrial Statistics (for details on why this is necessary see the explanation
under EMPGR). Source: Integrated Public Use Microdata Series.
• EXTFIN : Industry dependence on external financing. Defined as the industry-level me-
dian of the ratio of capital expenditure minus cash flow to capital expenditure for U.S. firms
averaged over the 1980-1989 period. Source: Rajan and Zingales (1998). Original source:
COMPUSTAT.
• OPPORT : Industry growth opportunities. Defined as the industry-level median growth
rate of sales for U.S. firms averaged over the 1980-1989 period. Source: Fisman and Love
(2004). Original source: COMPUSTAT.
• TRADEINT : Industry dependence on trade credit. Defined as the industry-median of the
ratio of accounts payable to total assets for U.S. firms averaged over the 1980-1989 period.
Source: Fisman and Love (2003). Original source: COMPUSTAT.
• INTANG : Industry dependence on intangible assets. Defined as the industry-median of
the ratio of intangible assets to net fixed assets for U.S. firms averaged over the 1980-1989
period. Source: Claessens and Laeven (2003). Original source: COMPUSTAT.
• INV INT : Industry (physical capital) investment intensity. Defined as the ratio of capital
expenditure to property plant and equipment for U.S. firms averaged over the 1980-1989
period. Source: Rajan and Zingales (1998). Original source: COMPUSTAT. We also use
three additional measures of industry physical capital intensity. One minus the share of
wages in value added, capital stock over value added, and capital stock over employment,
34ECBWorking Paper Series No 623May 2006

all for U.S. industries before 1980. Source: NBER-CES Manufacturing Industry Database
(Bartelsman and Gray, 1996).
• NONPROD : Defined as the ratio of non-production workers to total employment in U.S.
manufacturing industries in 1980. Source: NBER-CES Manufacturing Industry Database
(Bartelsman and Gray, 1996).
Country-Specific:
• PRIV : Private credit to GDP in 1980. Private credit is defined as private domestic credit
held by monetary authorities and depositary institutions (excluding interbank deposit). No
data is available for Nigeria. Source: Fisman and Love (2003). Original source: IMF Inter-
national Financial Statistics.
• PROP : Index of property rights protection on a scale from 1 to 5; higher values indicate
higher protection. The index refers to the 1995-1999 period. Source: Claessens and Laeven
(2003). Original source: The Index of Economic Freedom (The Heritage Foundation).
• K/Y : Log physical capital-GDP ratio in 1980. The physical capital stock is calculated
using the perpetual inventory method as implemented by Hall and Jones (1999) and Caselli
(2005). Source: Penn World Table, 5.6 (downloadable from: http://pwt.econ.upenn.edu).
• SCHBL : Average years of schooling of the population aged 25 and over. No data is available
for Nigeria and Morocco. There is also no data for Egypt before 1980. Source: Barro and
Lee (2001).
• SCHCS : Average years of schooling of the population aged 25 and over. No data is available
for Sri Lanka, Israel, and Pakistan. Source: Cohen and Soto (2001).
• Y : Log of real GDP per worker. Source: Penn World Table 5.6.
• GROWTH : Logarithmic growth rate of real GDP per worker. Source: Penn World Table
5.6.
• LFQUAL : Labor force quality measure on a 0-100 scale. The index is based on results in
mathematics and science tests administrated by the International Association for the Eval-
uation of Educational Achievement and International Assessment of Educational Progress
35ECB
Working Paper Series No 623May 2006

between 1965 and 1991. Test results were originally collected and processed to ensure inter-
national and intertemporal comparability by Hanushek and Kimko (2000). Hanushek and
Kimko use this data to obtain a measure of labor-force quality for 39 countries. They expand
the country coverage of their measure by estimating a model of labor-force quality determi-
nation. This model is based on 31 countries due to data unavailability for some explanatory
variables. Bosworth and Collins (2003) follow the Hanushek and Kimko approach but use
updated and additional primary data. Source: Bosworth and Collins (2003).
• TARSW : Average import-weighted tariff rate over the 1980’s on intermediates and capital
goods. Source: Sachs and Warner (1995). Original source: UNCTAD.
• TARWB : Average unweighted tariff rate over the 1980’s for all goods. Source: World Bank.
(http://siteresources.worldbank.org/INTRANETTRADE/Resources/tar2002.xls)
36ECBWorking Paper Series No 623May 2006

References
Acemoglu, Daron. "Why Do New Technologies Complement Skills? Directed Technical
Change and Wage Inequality." Quarterly Journal of Economics, November 1998, 113 (4),
pp. 1055-1090.
Acemoglu, Daron. "Directed Technical Change." Review of Economic Studies, October
2002, 69 (4), pp. 781-810.
Acemoglu, Daron. "Patterns of Skill Premia." Review of Economic Studies, April
2003a, 70 (1), pp. 199-230.
Acemoglu, Daron. "Factor Prices and Technical Change: from Induced Innovations
to Recent Debates." In Philippe Aghion (ed.) Knowledge, Information and Expectations
in Modern Macroeconomics: In Honor of Edmund Phelps, Princeton, NJ: Princeton Uni-
versity Press, 2003b.
Acemoglu, Daron; Johnson, Simon and Robinson, James A. "The Colonial Ori-
gins of Comparative Development: An Empirical Investigation." American Economic
Review, December 2001, 91 (5), pp. 1369-1401.
Acemoglu, Daron and Zilibotti, Fabrizio. "Productivity Differences." Quarterly
Journal of Economics, May 2001, 116 (2), pp. 1055-1090.
Autor, David; Katz, Lawrence F., and Krueger, Alan B. "Computing Inequal-
ity: Have Computers Changed the Labor Market?" Quarterly Journal of Economics,
November 1998, 113 (4), pp. 1169-1214.
Barro, Robert J. "Economic Growth in a Cross-Section of Countries." Quarterly Jour-
nal of Economics, May 1991, 106 (2), pp. 407-443.
Barro, Robert J. "Human Capital and Growth." American Economic Review Papers
and Proceedings, May 2001, 113 (2), pp. 12-17.
Barro, Robert J. and Lee, Jong-Wha. "International Data on Educational Attain-
ment: Updates and Implications." Oxford Economic Papers, 2001, 3(3), pp. 541-563.
Barro, Robert J. and Sala-i-Martin, Xavier. Economic Growth. Cambridge, MA:
MIT Press, 1995.
37ECB
Working Paper Series No 623May 2006

Bartelsman, Eric J and Gray, Wayne. The NBER Productivity Man-
ufacturing Database. National Bureau of Economic Research (Cambridge,
MA) Technical Working Paper No. 205, October 1996. (Downloadable from
http://www.nber.org/nberces/nbprod96.htm.)
Benhabib, Jess and Spiegel, Mark M. "The Role of Human Capital in Economic
Development." Journal of Monetary Economics, October 1994, 34(2), pp. 143-174.
Benhabib, Jess and Spiegel, Mark M. "Human Capital and Technology Diffusion."
December 2002. Forthcoming in Philippe Aghion and Steven Durlauf (eds.) The Handbook
of Economic Growth, Amsterdam, The Netherlands: North-Holland, 2005
Berman, Eli; Bound, John, and Machin, Stephen. "Implications of Skill-Biased
Technical Change: International Evidence." Quarterly Journal of Economics, November
1998, 113 (4), pp. 1245-1279.
Berman Eli and Machin, Stephen. "Skilled-Biased Technology Transfer: Evidence
of Factor Biased technical Change in Developing Countries." Oxford Review of Economic
Policy, Fall 2000, 16(3), pp. 12-22.
Bils, Mark and Klenow Peter J. "Does Schooling Cause Growth?" American Eco-
nomic Review, December 2000, 90(5), pp. 1160-1183.
Bosworth, Barry P. and Susan M. Collins. "The Empirics of Growth: An Update."
Brookings Papers on Economic Activity, September 2003, 2, pp. 114-206.
Card, David. "The Causal Effect of Schooling on Earnings." In Orley Ashenfelter and
David Card (eds.) Handbook of Labor Economics. Amsterdam, Netherlands: North Hol-
land, 1999.
Caselli, Francesco. "Accounting for Cross-Country Income Differences." Mimeo, Lon-
don School Economics, May 2005. Forthcoming in Philippe Aghion and Steven Durlauf
(eds.) The Handbook of Economic Growth, North Holland, Amsterdam: 2005.
Caselli, Francesco and Coleman, John Wilbur II. "Cross-Country Technology Dif-
fusion: The Case of Computers." American Economic Review Papers and Proceedings,
May 2001, 91(2), pp. 328-335.
Caselli, Francesco and Coleman, John Wilbur II. "The US Technology Frontier."
American Economic Review Papers and Proceedings, May 2002, 92 (2), pp. 148-152.
38ECBWorking Paper Series No 623May 2006

Caselli, Francesco and Coleman, John Wilbur II. "The World Technology Fron-
tier." June 2005, American Economic Review, forthcoming.
Caselli, Francesco; Esquivel, Gerard, and Lefort, Fernando. "Reopening the
Convergence Debate: A New Look at Cross-Country Empirics." Journal of Economic
Growth, September 1996, 1 (3), pp. 363-389.
Claessens, Stijn and Laeven, Luc. "Financial Development, Property Rights, and
Growth." Journal of Finance, December 2003, 58(6), pp. 2401-2436.
Cohen, Daniel and Soto, Marcelo. "Growth and Human capital: Good Data, Good
Results." Centre for Economic Policy Research (London), Discussion Paper No. 3025.
October 2001.
Deardorff, Alan. "The General Validity of the Heckscher-Ohlin Theorem." American
Economic Review, September 1982, 72 (4), pp. 683—694.
de la Fuente, Angel and Domenech, Rafael. "Schooling Data, Technical Diffusion,
and the Neoclassical Model." American Economic Review Papers and Proceedings, May
2001, 90 (5), pp. 323-327.
de la Fuente, Angel and Domenech, Rafael. "Human Capital in Growth Regressions:
How Much Difference Does Data Quality Make." June 2005, Journal of the European
Economic Association, forthcoming.
Djankov, Simeon; La Porta, Rafael; López-de-Silanes, Florencio; Shleifer, An-
drei and Botero, Juan. "The Regulation of Labor." Quarterly Journal of Economics,
November 2004, 119 (4), pp. 1339 - 1382.
Djankov, Simeon; McLiesh, Caralee and Shleifer, Andrei. "Private Credit in 129
Countries." National Bureau of Economic Research (Cambridge, MA), Working Paper
No.11078, January 2005.
Dornbusch, Rudiger; Fischer, Stanley and Samuelson, Paul A. "Heckscher-Ohlin
Trade Theory with a Continuum of Goods." Quarterly Journal of Economics, September
1980, 95 (2), pp. 203-224.
Durlauf, Steven N.; Johnson Paul A., and Temple, Jonathan. "Growth Econo-
metrics." Forthcoming in Philippe Aghion and Steven Durlauf (eds.) The Handbook of
Economic Growth, Amsterdam, The Netherlands: North-Holland, 2005.
39ECB
Working Paper Series No 623May 2006

Fisman, Raymond and Love, Inessa. "Trade Credit, Financial Intermediary Devel-
opment, and Industry Growth." Journal of Finance, February 2003, 58 (1), pp. 353-374.
Fisman, Raymond and Love, Inessa. "Financial Development and Growth in the
Short and Long Run." National Bureau of Economic Research (Cambridge, MA),Working
Paper No. 10236, January 2004.
Fitzgerald, Doireann and Hallak, Juan Carlos. "Specialization, Factor Accumula-
tion and Development." Journal of International Economics, December 2004, 64 (2), pp.
277-302.
Forstner, Helmut. "A Note on the General Validity of the Heckscher-Ohlin Theorem."
American Economic Review, September 1985, 75 (4), pp. 844-849.
Glaeser, Edward L.; La Porta, Rafael; Lopez-de-Silanes, Florencio and
Shleifer, Andrei. "Do Institutions Cause Growth?" Journal of Economic Growth, Feb-
ruary 2004, 9 (1), pp. 271-303.
Hall, Robert E., and Jones, Charles I.. "Why Do Some Countries Produce So Much
More Output per Worker Than Others?"Quarterly Journal of Economics, February 1999,
114 (1), pp. 83-116.
Hanushek, Eric A. "Some Simple Analytics of School Quality." National Bureau of
Economic Research (Cambridge, MA), Working Paper No. 10229, January 2004.
Hanushek, Eric A. and Kimko, Dennis D. "Schooling, Labor-Force Quality, and the
Growth of Nations." American Economic Review. December 2000, 90(5), pp. 1184-1208.
Harrigan, James. "Specialization and the Volume of Trade: Do the Data Obey the
Laws?" National Bureau of Economic Research (Cambridge, MA), Working Paper No.
8675, August 2001.
Heckman, James and Klenow, Peter J. "Human Capital Policy". In Michael Boskin
(ed.) Policies to Promote Capital Formation. Stanford, CA: Hoover Institution, 1998.
Kahn, James A. and Lim, Jong-Soo. "Skilled Labor-Augmenting Technical Progress
in U.S. Manufacturing." Quarterly Journal of Economics, November 1998, 113 (4), pp.
1281-1308.
Kartini Shastry, Gauri and Weil, David N. "How Much of Cross-Country Income
Variation is Explained by Health." Journal of the European Economic Association, April-
May, 2003, 1 (2-3), pp. 387-396.
40ECBWorking Paper Series No 623May 2006

Klenow, Peter J. "Ideas Versus Rival Human Capital: Industry Evidence on Growth
Models." Journal of Monetary Economics, June 1998, 42 (1), pp. 3-23.
Klenow, Peter J. and Rodriguez-Clare Andres. "The Neoclassical Rival in Growth
Economics: Has It Gone Too Far?" In Ben Bernake and Julio Rotemberg (eds.) NBER
Macroeconomics Annual 1997, Cambridge, MA: MIT Press, 1997.
Krueger, Alan B. and Lindahl, Mikael. "Education for Growth: Why and For
Whom?" Journal of Economic Literature, December 2001, 39 (4), pp. 1101-1136.
Krugman, Paul R. "Scale Economies, Product Differentiation, and the Pattern of
Trade." American Economic Review, December 1980, 70 (5), pp. 950-959.
Lucas, Robert. "On the Mechanisms of Economic Development." Journal of Monetary
Economics, July 1988, 22 (1), pp.3-42.
Mankiw, Gregory. "The Growth of Nations." Brookings Papers on Economic Activity,
1995(1), pp. 275-326.
Mankiw, N. Gregory; Romer, David, and Weil, David N. “A Contribution to the
Empirics of Economic Growth." Quarterly Journal of Economics, May 1992, 107 (2), pp.
407-437.
Manuelli, Rodolfo and Seshadri, Ananth. "Human Capital and the Wealth of Na-
tions." Mimeo, University of Wisconsin-Madison, May 2005.
Nelson, Richard R. and Phelps Edmund S. "Investment in Humans, Technical
Diffusion, and Economic Growth." American Economic Review, March 1966, 56 (1/2),
pp. 69-75.
Petersen, Mitchell A. and Rajan, Raghuram G. "Trade Credit: Theories and
Evidence." Review of Financial Studies, Fall 1997, 10 (3), pp. 661-691.
Pritchett, Lant. "Where Has All the Education Gone?"World Bank Economic Review,
2001, 15 (3), pp. 367-391.
Rajan, Raghuram G. and Zingales, Luigi. "Financial Dependence and Growth."
American Economic Review, June 1998, 88 (3), pp. 559-586.
Romalis, John. "Factor Proportions and the Structure of Commodity Trade."American
Economic Review, March 2004, 94 (1), pp. 67-97.
Romer, Paul. "Human Capital and Growth: Theory and Evidence." Carnegie-Rochester
Conference Series on Public Policy, 1990a, 32, pp. 251-286.
41ECB
Working Paper Series No 623May 2006

Romer, Paul. "Endogenous Technical Change." Journal of Political Economy, October
1990b, 98 (5), pp. S71-S102.
Sachs, Jeffrey D. and Warner, Andrew M. "Economic Reform and the Process of
Global Integration." Brookings Paper on Economic Activity, 1995, 1995(1), pp. 1-118.
Temple, Jonathan. "The New Growth Evidence." Journal of Economic Literature,
March 1999, 37(1), pp. 112-156.
Topel, Robert. "Labor Markets and Economic Growth." in Orley Ashenfelter and David
Card (eds.). The Handbook of Labor Economics. Amsterdam, The Netherlands: North
Holland, 1999.
Ventura, Jaume. "Growth and Interdependence." Quarterly Journal of Economics,
February 1997, 112 (1), pp. 57-84.
Ventura, Jaume. "A Global View of Economic Growth." Centre for Economic Pol-
icy Research (London), Discussion Paper No. 5059, May 2005. Forthcoming in Philippe
Aghion and Steven Durlauf (eds.) The Handbook of Economic Growth, North Holland,
Amsterdam: 2005.
United Nations Industrial Development Organization. Industrial Statistics. New
York, NY, 2004.
42ECBWorking Paper Series No 623May 2006
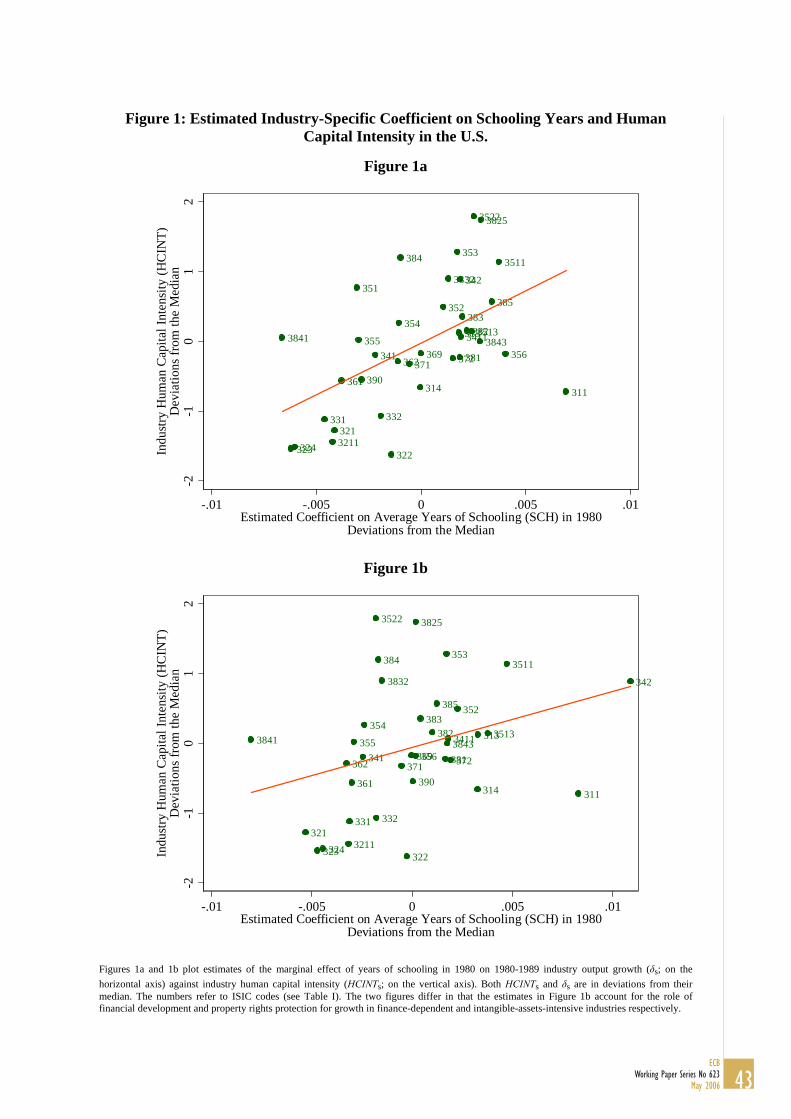
Figure 1: Estimated Industry-Specific Coefficient on Schooling Years and Human Capital Intensity in the U.S.
Figure 1a
311
313
314
321
322323324
331 332
341
342351
352
353
354
355356
361
362369
371 372381
382383
384
385
390
3211
3411
3511
3513
35223825
3832
3841 3843
-2-1
01
2
Indu
stry
Hum
an C
apita
l Int
ensi
ty (H
CIN
T)D
evia
tions
from
the
Med
ian
-.01 -.005 0 .005 .01Estimated Coefficient on Average Years of Schooling (SCH) in 1980
Deviations from the Median
Figure 1b
311
313
314
321
322323324
331 332
341
342
352
353
354
355356
361
362369
371 372381
382383
384
385
390
3211
3411
3511
3513
3522 3825
3832
3841 3843
-2-1
01
2
Indu
stry
Hum
an C
apita
l Int
ensi
ty (H
CIN
T)D
evia
tions
from
the
Med
ian
-.01 -.005 0 .005 .01Estimated Coefficient on Average Years of Schooling (SCH) in 1980
Deviations from the Median
Figures 1a and 1b plot estimates of the marginal effect of years of schooling in 1980 on 1980-1989 industry output growth (δs; on the horizontal axis) against industry human capital intensity (HCINTs; on the vertical axis). Both HCINTs and δs are in deviations from their median. The numbers refer to ISIC codes (see Table I). The two figures differ in that the estimates in Figure 1b account for the role of financial development and property rights protection for growth in finance-dependent and intangible-assets-intensive industries respectively.
43ECB
Working Paper Series No 623May 2006

Figure 2: Estimated Industry-Specific Coefficient on Schooling Quality and Human Capital Intensity in the U.S.
Figure 2a
311
313
314
321
322323324
331 332
341
342
352
353
354
355356
361
362369
371372 381
382383
384
385
390
3211
3411
3511
3513
3522 3825
3832
3841 3843
-2-1
01
2
Indu
stry
Hum
an C
apita
l Int
ensi
ty (H
CIN
T)D
evia
tions
from
the
Med
ian
-.15 -.1 -.05 0 .05 .1Estimated Coefficient on Labor Force Quality (LFQUAL)
Deviations from the Median
Figure 2b
311
313
314
321
322323324
331 332
341
342351
353
354
355356
362369
371 372 381
382383
384
385
390
3211
3411
3511
3513
3522 3825
3832
3841 3843
-2-1
01
2
Indu
stry
Hum
an C
apita
l Int
ensi
ty (H
CIN
T)D
evia
tions
from
the
Med
ian
-.1 -.05 0 .05 .1 .15Estimated Coefficient on Labor Force Quality (LFQUAL)
Deviations from the Median
Figures 2a and 2b plot estimates of the marginal effect of labor-force quality on 1980-1989 industry output growth (on the horizontal axis) against industry human capital intensity (HCINTs; on the vertical axis). Both HCINTs and industry-specific marginal effects are in deviations from their median. The numbers refer to ISIC codes (see Table I). The two figures differ in that the estimates in Figure 2b account for the role of financial development and property rights protection for growth in finance-dependent and intangible-assets-intensive industries respectively.
44ECBWorking Paper Series No 623May 2006

Figure 3: Estimated Industry-Specific Coefficient on Changes in Schooling and Human Capital Intensity in the U.S.
Figure 3a
311
313
314
321
322 323324
331 332
341
342
352
353
355356
361
362369
371372 381
382383
384
385
390
3211
3411
3511
3513
3522 3825
3832
3841 3843
-2-1
01
2
Indu
stry
Hum
an C
apita
l Int
ensi
ty (H
CIN
T)D
evia
tions
from
the
Med
ian
-.04 -.02 0 .02 .04Estimated Coefficient on 1970-1990 Change in Schooling
Deviations from the Median
Figure 3b
311
313
314
321
322 323324
331 332
341
342
352
353
354
355356
361
362369
371372 381
382383
384
385
390
3211
3411
3511
3513
3522 3825
3832
3841 3843
-2-1
01
2
Indu
stry
Hum
an C
apita
l Int
ensi
ty (H
CIN
T)D
evia
tions
from
the
Med
ian
-.04 -.02 0 .02 .04Estimated Coefficient on 1970-1990 Change in Schooling
Deviations from the Median
Figures 3a and 3b plot estimates of the marginal effect of 1970-1990 improvements in schooling on 1980-1989 industry output growth (θs; on the horizontal axis) against industry human capital intensity (HCINTs; on the vertical axis). Both HCINTs and θs are in deviations from their median. The numbers refer to ISIC codes (see Table I). The two figures differ in that the estimates in Figure 3b account for the role of financial development and property rights protection for growth in finance-dependent and intangible-assets-intensive industries respectively.
45ECB
Working Paper Series No 623May 2006

ISIC Code Industry Name HCINT HCINT(SEC) HCINT(COLL)
3522 Drugs 13.45 87.22% 35.14%3825 Office, computing 13.40 90.01% 29.29%353 Petroleum refineries 12.94 87.26% 25.05%384 Transportation equipment 12.86 84.20% 23.42%
3511 Basic chemicals excl. fertilizers 12.79 84.06% 24.54%3832 Radio 12.55 83.29% 18.79%342 Printing and Publishing 12.54 83.89% 19.97%351 Industrial chemicals 12.42 81.60% 20.03%385 Professional goods 12.22 79.31% 18.50%352 Chemicals 12.15 77.08% 18.96%383 Electric machinery 12.01 76.08% 15.29%354 Petroleum and coal products 11.92 69.06% 14.08%382 Machinery 11.81 76.23% 10.23%
3513 Synthetic resins 11.80 75.21% 15.14%313 Beverages 11.78 73.81% 13.09%
3411 Pulp, paper 11.72 75.23% 10.68%3841 Ship building and repairing 11.71 74.78% 9.99%355 Rubber products 11.67 74.39% 10.26%
3843 Motor vehicle 11.65 73.46% 10.95%369 Non-metal products 11.48 67.80% 14.20%356 Plastic products 11.48 71.50% 10.19%341 Paper and Products 11.46 70.51% 11.05%381 Metal products 11.43 69.87% 9.71%372 Non-ferrous metals 11.42 70.31% 9.66%362 Glass 11.37 69.13% 8.68%371 Iron & Steel 11.33 69.61% 8.32%390 Other ind. 11.11 65.12% 11.92%361 Pottery 11.09 65.01% 9.87%314 Tobacco 11.00 66.04% 10.99%311 Food products 10.93 65.55% 9.74%332 Furniture 10.59 58.31% 7.09%331 Wood Products 10.54 59.29% 7.06%321 Textile 10.38 53.83% 6.94%
3211 Spinning 10.21 49.76% 5.49%324 Footwear 10.14 52.07% 3.69%323 Leather 10.12 50.69% 7.06%322 Apparel 10.04 51.09% 5.07%
Mean 11.61 71.13% 13.52%Standard Deviation 0.90 10.87% 7.12%
Median 11.65 71.50% 10.95%0.25 Percentile 11.09 65.55% 9.66%0.75 Percentile 12.15 77.08% 18.50%
Table I -- Industry Measures of Human Capital Intensity (Dependence)
Table I reports average years of schooling of employees (HCINT) for all industries in our sample calculated using U.S. data. We also report two additional measures of industry-level human capital intensity (HCINT(SEC) and HCINT(COLL)). HCINT(SEC) is the ratio of hours worked by employees with at least 12 years of schooling (necessary for completing secondary school) to total hours worked. HCINT(COLL) is the ratio of hours worked by employees with at least 16 years of schooling (college) to total hours worked. The bottom rows give some descriptive statistics. The data comes from the Integrated Public Use Microdata Series and corresponds to 1980. ISIC stands for International Standard Industrial Classification. See the Appendix for details on the construction of the three human capital intensity measures.
46ECBWorking Paper Series No 623May 2006

HCINT 1HCINT(SEC) 0.9780* 1HCINT(COLL) 0.9239* 0.8502* 1NONPROD 0.8665* 0.8193* 0.8660* 1EXTFIN 0.5614* 0.5200* 0.5431* 0.4885* 1INTANG 0.2253 0.2421 0.281 0.3741 0.1443 1INVINT 0.5721* 0.5654* 0.5645* 0.5808* 0.8116* 0.4038 1TRADEINT -0.2018 -0.2135 -0.233 -0.2149 -0.1149 -0.1553 -0.1047 1OPPORT 0.3475 0.3397 0.3684 0.4213 0.6498* 0.3557 0.7666* -0.1927 1
SCH80(BL) 1SCH70(BL) 0.9698* 1∆(SCH(BL)9070) -0.015 -0.1761 1∆(SCH(BL)9080) -0.2837 -0.2424 0.6824* 1LFQUAL 0.6622* 0.6651* 0.1073 0.0825 1PRIV 0.4188* 0.4071* 0.1239 0.0987 0.5884* 1K/Y 0.7284* 0.7650* 0.0661 0.1389 0.7016* 0.5753* 1PROP 0.6123* 0.6241* -0.054 -0.1168 0.5678* 0.3783 0.5879* 1Y 0.7703* 0.7881* -0.1304 -0.1936 0.5091* 0.4251* 0.6088* 0.6342* 1
Panel A reports correlations between the main industry-level variables. The correlations are based on either 36 or 37 industry observations, depending on the variables considered. Panel B reports correlations between the main country-level variables. These correlations are based on 39 to 43 country observations, depending on the variables considered. The Data Appendix gives detailed variable definitions and sources. * denotes that the correlation is significant at the 1% confidence level.
Panel B - Country-level Variables
Table II--Correlation Structure
Panel A - Industry-level Variables
47ECB
Working Paper Series No 623May 2006
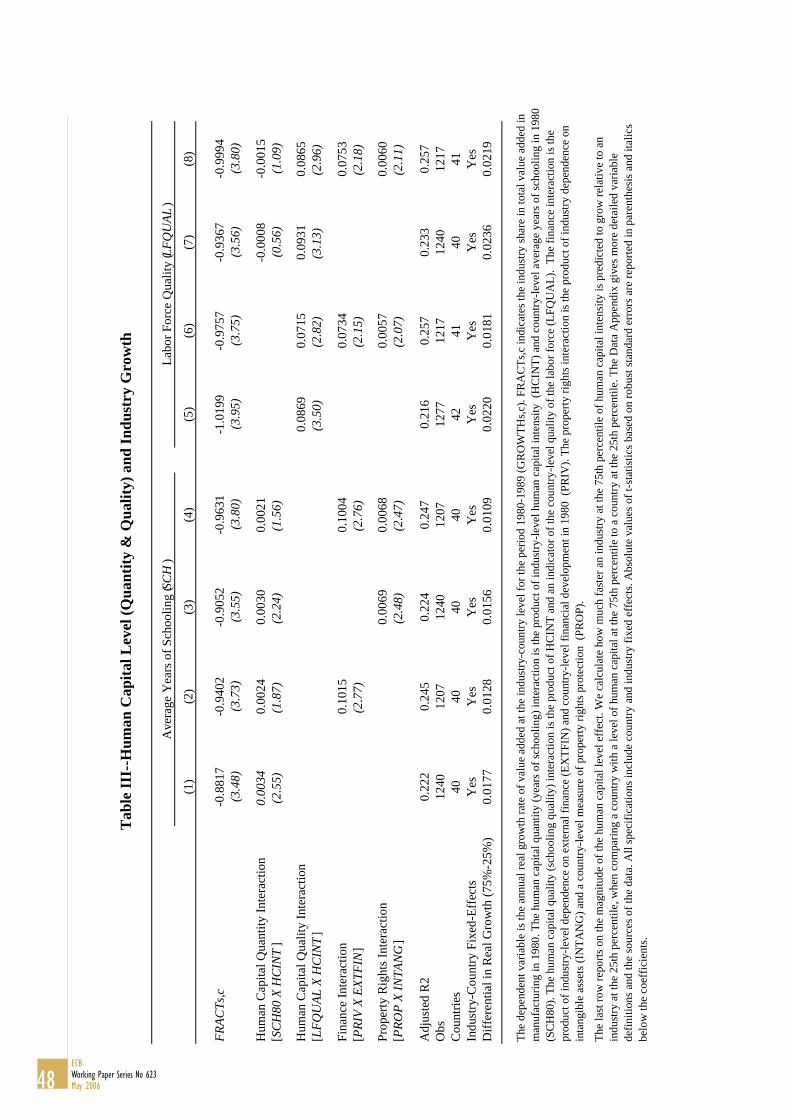
(1)
(2)
(3)
(4)
(5)
(6)
(7)
(8)
FRAC
Ts,c
-0.8
817
-0.9
402
-0.9
052
-0.9
631
-1.0
199
-0.9
757
-0.9
367
-0.9
994
(3.4
8) (3
.73)
(3.5
5) (3
.80)
(3.9
5) (3
.75)
(3.5
6) (3
.80)
Hum
an C
apita
l Qua
ntity
Inte
ract
ion
0.00
340.
0024
0.00
300.
0021
-0.0
008
-0.0
015
[SC
H80
X H
CIN
T]
(2.5
5)(1
.87)
(2.2
4)(1
.56)
(0.5
6)(1
.09)
Hum
an C
apita
l Qua
lity
Inte
ract
ion
0.08
690.
0715
0.09
310.
0865
[ LFQ
UAL
X H
CIN
T]
(3.5
0)(2
.82)
(3.1
3)(2
.96)
Fina
nce
Inte
ract
ion
0.10
150.
1004
0.07
340.
0753
[PRI
V X
EXTF
IN]
(2.7
7)(2
.76)
(2.1
5)(2
.18)
Prop
erty
Rig
hts I
nter
actio
n 0.
0069
0.00
680.
0057
0.00
60[P
ROP
X IN
TAN
G]
(2.4
8)(2
.47)
(2.0
7)(2
.11)
Adj
uste
d R
20.
222
0.24
50.
224
0.24
70.
216
0.25
70.
233
0.25
7O
bs12
4012
0712
4012
0712
7712
1712
4012
17C
ount
ries
4040
4040
4241
4041
Indu
stry
-Cou
ntry
Fix
ed-E
ffec
tsY
esY
esY
esY
esY
esY
esY
esY
esD
iffer
entia
l in
Rea
l Gro
wth
(75%
-25%
)0.
0177
0.01
280.
0156
0.01
090.
0220
0.01
810.
0236
0.02
19
The
last
row
repo
rts o
n th
e m
agni
tude
of t
he h
uman
cap
ital l
evel
eff
ect.
We
calc
ulat
e ho
w m
uch
fast
er a
n in
dust
ry a
t the
75t
h p e
rcen
tile
of h
uman
cap
ital i
nten
sity
is p
redi
cted
to g
row
rela
tive
to a
n in
dust
ry a
t the
25t
h pe
rcen
tile,
whe
n co
mpa
ring
a co
untry
with
a le
vel o
f hum
an c
apita
l at t
he 7
5th
perc
entil
e to
a c
ount
ry a
t the
25t
h pe
rcen
tile.
The
Dat
a A
ppen
dix
give
s mor
e de
taile
d va
riabl
e de
finiti
ons a
nd th
e so
urce
s of t
he d
ata.
All
spec
ifica
tions
incl
ude
coun
try a
nd in
dust
ry fi
xed
effe
cts.
Abs
olut
e va
lues
of t
-st a
tistic
s bas
ed o
n ro
bust
stan
dard
err
ors a
re re
porte
d in
par
enth
esis
and
ital
ics
belo
w th
e co
effic
ient
s.
Tab
le II
I--H
uman
Cap
ital L
evel
(Qua
ntity
& Q
ualit
y) a
nd In
dust
ry G
row
th
Ave
rage
Yea
rs o
f Sch
oolin
g (SC
H)
Labo
r For
ce Q
ualit
y (L
FQU
AL)
The
depe
nden
t var
iabl
e is
the
annu
al re
al g
row
th ra
te o
f val
ue a
dded
at t
he in
dust
ry-c
ount
ry le
vel f
or th
e pe
riod
1980
-198
9 (G
RO
WTH
s,c).
FRA
CTs
,c in
dica
tes t
he in
dust
ry sh
are
in to
tal v
alue
add
ed in
m
anuf
actu
ring
in 1
980.
The
hum
an c
apita
l qua
ntity
(yea
rs o
f sch
oolin
g) in
tera
ctio
n is
the
prod
uct o
f ind
ustry
-leve
l hum
an c
apit a
l int
ensi
ty (
HC
INT)
and
cou
ntry
-leve
l ave
rage
yea
rs o
f sch
oolin
g in
198
0 (S
CH
80).
The
hum
an c
apita
l qua
lity
(sch
oolin
g qu
ality
) int
erac
tion
is th
e pr
oduc
t of H
CIN
T an
d an
indi
cato
r of t
he c
ount
ry-le
vel q
ualit
y of
the
labo
r for
ce (L
FQU
AL)
. Th
e fin
ance
inte
ract
ion
is th
e pr
oduc
t of i
ndus
try-le
vel d
epen
denc
e on
ext
erna
l fin
ance
(EX
TFIN
) and
cou
ntry
-leve
l fin
anci
al d
evel
opm
ent i
n 19
80 (
PRIV
). Th
e pr
oper
ty ri
ghts
inte
ract
ion
is th
e pr
oduc
t of i
ndus
try d
epen
denc
e on
in
tang
ible
ass
ets (
INTA
NG
) and
a c
ount
ry-le
vel m
easu
re o
f pro
perty
righ
ts p
rote
ctio
n (P
RO
P).
48ECBWorking Paper Series No 623May 2006

(1) (2) (3) (4) (5) (6)
FRACTs,c -0.8274 -0.9017 -0.8603 -0.9303 -0.9090 -0.9350 (3.18) (3.46) (3.27) (3.53) (3.46) (3.56)
Human Capital Accumulation Interaction 0.0087 0.0108 0.0086 0.0108 0.0103 0.0107[∆(SCH9070) X HCINT ] (2.37) (3.44) (2.36) (3.44) (3.26) (3.30)
Finance Interaction 0.1081 0.1042 0.0965 [PRIV X EXTFIN ] (2.87) (2.82) (2.05)
Property Rights Interaction 0.0084 0.0078 0.0074[PROP X INTANG ] (2.92) (2.81) (2.45)
Investment Interaction 0.0001 0.0000[∆K/L9070 X INVINT ] (3.11) (0.37)
Adjusted R2 0.263 0.241 0.267 0.245 0.238 0.244Obs 1203 1171 1203 1171 1171 1171Countries 39 39 39 39 39 39Industry-Country Fixed-Effects Yes Yes Yes Yes Yes YesDifferential in Real Growth (75%-25%) 0.0090 0.0112 0.0089 0.0112 0.0107 0.0111
Table IV--Human Capital Accumulation and Industry Growth
The dependent variable is the annual real growth rate of value added at the industry-country level for the period 1980-1989 (GROWTHs,c). FRACTs,c indicates the industry share in total value added in manufacturing in 1980. The human capital accumulation interaction is the product of industry-level human capital intensity (HCINT) and the country-level change in average years of schooling over the 1970-1990 period (∆SCH). The finance interaction is the product of industry-level dependence on external finance (EXTFIN) and country-level financial development in 1980 (PRIV). The property rights interaction is the product of industry dependence on intangible assets (INTANG) and a country-level measure of property rights protection (PROP). The investment interaction is the product of the country-level change in capital per worker over the 1970-1990 period (∆K/L) and the Rajan and Zingales (1998) industry-level investment intensity (INVINT). The last row reports on the magnitude of the human capital accumulation effect. We calculate how much faster an industry at the 75th percentile of human capital intensity is predicted to grow relative to an industry at the 25th percentile, when comparing a country with a rate of human capital accumulation over the 1970-1990 period at the 75th percentile to a country at the 25th percentile. The Data Appendix gives more detailed variable definitions and the sources of the data. All specifications include country and industry fixed effects. Absolute values of t-statistics based on robust standard errors are reported in parenthesis and italics below the coefficients.
49ECB
Working Paper Series No 623May 2006

(1)
(2)
(3)
(4)
(5)
(6)
(7)
(8)
FRAC
Ts,c
-0.8
657
-0.9
424
-0.9
076
-0.9
681
-0.9
075
-0.9
689
-0.9
356
-0.9
578
(3.2
3) (3
.50)
(3.3
1) (3
.52)
(3.3
0) (3
.52)
(3.4
6) (3
.47)
Hum
an C
apita
l Acc
umul
atio
n In
tera
ctio
n0.
0107
0.01
230.
0067
0.00
930.
0068
0.00
890.
0117
0.00
87[∆
(SC
H90
70) X
HC
INT
](2
.77)
(3.7
1)(1
.88)
(3.0
3)(1
.84)
(2.8
3)(3
.48)
(2.9
0)
Hum
an C
apita
l Qua
ntity
Inte
ract
ion
0.00
380.
0026
0.00
01-0
.000
40.
0032
[SC
H70
X H
CIN
T]
(2.5
9)(1
.78)
(0.0
8) (0
.32)
(2.0
1)
Hum
an C
apita
l Qua
lity
Inte
ract
ion
0.07
700.
0621
0.07
590.
0668
0.06
75[L
FQU
AL X
HC
INT
](2
.99)
(2.3
5)(2
.54)
(2.2
6)(2
.32)
Fina
nce
Inte
ract
ion
0.08
870.
0707
0.07
090.
0864
0.07
98[P
RIV
X EX
TFIN
](2
.47)
(2.0
2)(2
.02)
(1.9
0)(1
.83)
Prop
erty
Rig
hts I
nter
actio
n 0.
0065
0.00
610.
0061
0.00
700.
0070
[PRO
P X
INTA
NG
](2
.25)
(2.0
7)(2
.07)
(2.2
8)(2
.26)
Inve
stm
ent I
nter
actio
n0.
0109
-0.0
040
[∆K
/L90
70) X
INVI
NT
](0
.48)
(0.1
6)
Phys
ical
Cap
ital L
evel
Inte
ract
ion
-0.0
211
-0.0
154
[K/L
70 X
INVI
NT
] (1
.51)
(1.1
7)
Adj
uste
d R
20.
220
0.24
80.
271
0.25
30.
226
0.25
30.
248
0.25
3O
bs12
0311
7112
0311
7112
0311
7111
7111
71C
ount
ries
3939
3939
3939
3939
Indu
stry
-Cou
ntry
Fix
ed-E
ffec
tsY
esY
esY
esY
esY
esY
esY
esY
es
The
depe
nden
t var
iabl
e is
the
annu
al re
al g
row
th ra
te o
f val
ue a
dded
at t
he in
dust
ry-c
ount
ry le
vel f
or th
e pe
riod
1980
-198
9 (G
RO
WTH
s,c).
FRA
CTs
,c in
dica
tes t
he in
dust
ry sh
are
in to
tal v
alue
add
ed in
m
anuf
actu
ring
in 1
980.
The
hum
an c
apita
l acc
umul
atio
n in
tera
ctio
n is
the
prod
uct o
f ind
ustry
-leve
l hum
an c
apita
l int
ensi
ty (H
CI N
T) a
nd th
e co
untry
-leve
l cha
nge
in a
vera
ge y
ears
of s
choo
ling
over
the
1970
-19
90 p
erio
d (∆
SCH
). Th
e hu
man
cap
ital q
uant
ity (y
ears
of s
choo
ling)
inte
ract
ion
is th
e pr
oduc
t of i
ndus
try-le
vel h
uman
cap
ital i
nten
sity
(HC
I NT)
and
cou
ntry
-leve
l ave
rage
yea
rs o
f sch
oolin
g in
197
0 (S
CH
70).
The
hum
an c
apita
l qua
lity
(sch
oolin
g qu
ality
) int
erac
tion
is th
e pr
oduc
t of
HC
INT
and
an in
dica
tor o
f the
cou
ntry
-lev e
l qua
lity
of th
e la
bor f
orce
(LFQ
UA
L).
The
inve
stm
ent i
nter
actio
n is
the
prod
uct o
f ind
ustry
-leve
l inv
estm
ent i
nten
sity
(IN
VIN
T) a
nd th
e co
untry
-leve
l cha
nge
in c
apit a
l per
wor
ker o
ver t
he 1
970-
1990
per
iod
( ∆K
/L).
The
phys
ical
cap
ital l
evel
in
tera
ctio
n is
the
prod
uct o
f IN
VIN
T an
d ca
pita
l per
wor
ker i
n 19
70 (K
/L).
The
Dat
a A
ppen
dix
give
s mor
e de
taile
d va
riabl
e de
finiti
ons a
nd th
e so
urce
s of t
he d
ata.
All
spec
ifica
tions
incl
ude
coun
try a
nd
indu
stry
fixe
d ef
fect
s. A
bsol
ute
valu
es o
f t-s
tatis
tics b
ased
on
robu
st st
anda
rd e
rror
s are
repo
rted
in p
aren
thes
is a
nd it
alic
s bel
ow th
e co
effic
ient
s.
Tab
le V
--C
apita
l Acc
umul
atio
n, H
uman
Cap
ital L
evel
and
Indu
stry
Gro
wth
Scho
olin
g Y
ears
(SC
H)
Labo
r For
ce Q
ualit
y (L
FQU
AL)
Bot
h SC
H &
LFQ
UA
LPh
ysic
al C
apita
l
The
finan
ce in
tera
ctio
n is
the
prod
uct o
f ind
ustry
-leve
l dep
ende
nce
on e
xter
nal f
inan
ce (E
XTF
IN) a
nd c
ount
ry-le
vel f
inan
cial
de v
elop
men
t in
1980
(PR
IV).
The
prop
erty
righ
ts in
tera
ctio
n is
the
prod
uct o
f in
dust
ry d
epen
denc
e on
inta
ngib
le a
sset
s (IN
TAN
G) a
nd a
cou
ntry
-leve
l mea
sure
of p
rope
rty ri
ghts
pro
tect
ion
(PR
OP)
.
50ECBWorking Paper Series No 623May 2006

(1) (2) (3) (4) (5) (6)
FRACTs,c -0.9469 -0.9743 -0.9448 -0.9713 -0.9332 -0.9676 (3.52) (3.53) (3.52) (3.54) (3.47) (3.52)
Human Capital Accumulation Interaction 0.0126 0.0094 0.0124 0.0094 0.0129 0.0094[∆(SCH9070) X HCINT ] (3.81) (3.06) (3.78) (3.06) (3.84) (3.08)
Human Capital Quantity Interaction 0.0028 0.0027 0.0031[SCH70 X HCINT(SCH) ] (1.93) (1.87) (2.09)
Human Capital Quality Interaction 0.0660 0.0641 0.0698[LFQUAL X HCINT(SCH) ] (2.53) (2.45) (2.66)
Finance Interaction 0.0819 0.0626 0.0344 0.0139 [PRIV X EXTFIN] (2.34) (1.84) (0.81) (0.34)
Property Rights Interaction 0.0058 0.0053 0.0051 0.0046 0.0047 0.0043[PROP X INTANG] (2.02) (1.82) (1.90) (1.69) (1.73) (1.58)
Finance-Trade Credit Interaction -0.8580 -0.9060 -0.5672 -0.6580[PRIV X TRADEINT ] (2.85) (2.91) (1.82) (2.05)
Finance-Growth Opportunities Interaction 1.1524 1.1968 1.1560 0.9699[PRIV X OPPORT] (1.71) (1.77) (1.98) (1.66)
Adjusted R2 0.252 0.258 0.251 0.256 0.252 0.259Obs 1171 1171 1171 1171 1171 1171Countries 39 39 39 39 39 39Industry-Country Fixed-Effects Yes Yes Yes Yes Yes Yes
The dependent variable is the annual real growth rate of value added at the industry-country level for the period 1980-1989 (GROWTHs,c). FRACTs,c indicates the industry share in total value added in manufacturing in 1980. The human capital accumulation interaction is the product of industry-level human capital intensity (HCINT) and the country-level change in average years of schooling over the 1970-1990 period (∆SCH). The human capital quantity (years of schooling) interaction is the product of industry-level human capital intensity (HCINT) and country-level average years of schooling in 1970 (SCH70). The human capital quality (schooling quality) interaction is the product of HCINT and an indicator of the country-level quality of the labor force (LFQUAL). The finance interaction is the product of industry-level dependence on external finance (EXTFIN) and country-level financial development in 1980 (PRIV).
Table VI - Financial Development, Human Capital and Industry Growth
The property rights interaction is the product of industry dependence on intangible assets (INTANG) and a country-level measure of property rights protection (PROP). The finance trade credit interaction is the product of an industry-level measure of trade credit dependence (TRADEINT) and the country-level financial development (PRIV) in 1980. The finance growth opportunities interaction is the product of an industry-level measure of global industry growth opportunities (OPPORT) and country-level financial development in 1980. The Data Appendix gives more detailed variable definitions and the sources of the data. All specifications include country and industry fixed effects. Absolute values of t-statistics based on robust standard errors are reported in parenthesis and italics below the coefficients.
51ECB
Working Paper Series No 623May 2006

(1)
(2)
(3)
(4)
(5)
(6)
(7)
(8)
FRAC
Ts,c
-0.1
222
-0.1
437
-0.1
433
-0.1
404
-0.1
472
-0.1
659
-0.1
659
-0.1
643
(1.1
6) (1
.36)
(1.3
6) (1
.33)
(1.3
5) (1
.52)
(1.5
2) (1
.51)
Hum
an C
apita
l Acc
umul
atio
n In
tera
ctio
n0.
0083
0.00
870.
0087
0.00
880.
0045
0.00
500.
0050
0.00
50[∆
(SC
H90
70)
X H
CIN
T]
(4.6
1)(4
.81)
(4.7
9)(4
.81)
(2.7
1)(2
.99)
(2.9
8)(3
.00)
Hum
an C
apita
l Qua
ntity
Inte
ract
ion
0.00
410.
0040
0.00
400.
0041
[SC
H70
X H
CIN
T(SC
H)]
(5.1
5)(4
.85)
(4.7
8)(4
.80)
Hum
an C
apita
l Qua
lity
Inte
ract
ion
0.06
800.
0666
0.06
660.
0671
[ LFQ
UAL
X H
CIN
T(SC
H)]
(4.2
9)(4
.02)
(3.9
3)(3
.96)
Fina
nce
Inte
ract
ion
0.02
170.
0218
0.01
610.
0161
[PRI
V X
EXTF
I N]
(1.5
7)(1
.58)
(1.2
1)(1
.21)
Prop
erty
Rig
hts I
nter
actio
n 0.
0005
0.00
060.
0003
0.00
080.
0008
0.00
06[P
ROP
X IN
TAN
G]
(0.4
1)(0
.46)
(0.2
2)(0
.62)
(0.6
1)(0
.43)
Fina
nce-
Trad
e C
redi
t Int
erac
tion
0.08
210.
1847
0.00
010.
0806
[PRI
V X
TRA
DEI
NT
](0
.54)
(1.1
7)(0
.00)
(0.4
8)
Fina
nce-
Gro
wth
Opp
ortu
nitie
s Int
erac
tion
0.33
080.
2614
[PRI
V X
OPP
ORT
](1
.64)
(1.2
9)
Adj
uste
d R
20.
428
0.43
70.
437
0.43
70.
431
0.44
00.
439
0.43
9O
bs11
2410
9410
9410
9411
2410
9410
9410
94C
ount
ries
3939
3939
3939
3939
Indu
stry
-Cou
ntry
Fix
ed-E
ffec
tsY
esY
esY
esY
esY
esY
esY
esY
es
The
prop
erty
righ
ts in
tera
ctio
n is
the
prod
uct o
f ind
ustry
dep
ende
nce
on in
tang
ible
ass
ets (
INTA
NG
) and
a c
ount
ry-le
vel m
easu
re o
f pro
perty
righ
ts p
rote
ctio
n (P
RO
P). T
he fi
nanc
e tra
de c
redi
t in
tera
ctio
n is
the
prod
uct o
f an
indu
stry
-leve
l mea
sure
of t
rade
cre
dit d
epen
denc
e (T
RA
DEI
NT)
and
the
coun
try-le
vel f
inan
cial
dev
elop
men
t in
1980
(PR
IV).
The
finan
ce g
row
th o
ppor
tuni
ties
inte
ract
ion
is th
e pr
oduc
t of a
n in
dust
ry-le
vel m
easu
re o
f glo
bal i
ndus
try g
row
th o
ppor
tuni
ties (
OPP
OR
T) a
nd c
ount
ry-le
vel f
ina n
cial
dev
elop
men
t in
1980
. The
Dat
a A
ppen
dix
give
s mor
e de
taile
d va
riabl
e de
finiti
ons a
nd th
e so
urce
s of t
he d
ata.
All
spec
ifica
tions
incl
ude
coun
try a
nd in
dust
ry fi
xed
effe
cts.
Abs
olut
e va
lue s
of t
-sta
tistic
s bas
ed o
n ro
bust
stan
dard
err
ors a
re re
porte
d in
par
enth
and
italic
s bel
ow th
e co
effic
ient
s.Tab
le V
II :
Hum
an C
apita
l Acc
umul
atio
n, H
uman
Cap
ital L
evel
and
Em
ploy
men
t Gro
wth
Ave
rage
Sch
oolin
g Y
ears
(SC
H)
Labo
r For
ce Q
ualit
y (L
BQU
AL)
The
depe
nden
t var
iabl
e is
the
annu
al g
row
th ra
te o
f em
ploy
men
t at t
he in
dust
ry-c
ount
ry le
vel f
or th
e pe
riod
1981
-199
0 (E
MPG
Rs,c
). FR
AC
Ts,c
indi
cate
s the
indu
stry
shar
e in
tota
l val
ue a
dded
in
man
ufac
turin
g in
198
0. T
he h
uman
cap
ital a
ccum
ulat
ion
inte
ract
ion
is th
e pr
oduc
t of i
ndus
try-le
vel h
uman
cap
ital i
nten
sity
(HC
I NT)
and
the
coun
try-le
vel c
hang
e in
ave
rage
yea
rs o
f sch
oolin
g ov
er
the
1970
-199
0 pe
riod
(∆SC
H).
The
hum
an c
apita
l qua
ntity
(yea
rs o
f sch
oolin
g) in
tera
ctio
n is
the
prod
uct o
f ind
ustry
-leve
l hum
an c
apita
l int
ensi
ty (H
CI N
T) a
nd c
ount
ry-le
vel a
vera
ge y
ears
of
scho
olin
g in
197
0 (S
CH
70).
The
hum
an c
apita
l qua
lity
(sch
oolin
g qu
ality
) int
erac
tion
is th
e pr
oduc
t of H
CIN
T an
d an
indi
cato
r of t
he c
ount
ry-le
vel q
ualit
y of
the
labo
r for
ce (L
FQU
AL)
. Th
e fin
ance
inte
ract
ion
is th
e pr
oduc
t of i
ndus
try-le
vel d
epen
denc
e on
ext
erna
l fin
ance
(EX
TFIN
) and
cou
ntry
-leve
l fin
anci
al d
evel
o pm
ent i
n 19
80 (P
RIV
).
52ECBWorking Paper Series No 623May 2006

(1)
(2)
(3)
(4)
(5)
(6)
(7)
(8)
FRAC
Ts,c
-0.9
774
-0.9
365
-0.9
984
-0.9
812
-0.9
841
-0.9
523
-1.0
241
-0.9
886
(3.5
4)(3
.51)
(3.5
0)(3
.57)
(3.3
7)(3
.36)
(3.4
3)(3
.42)
HC
Acc
umul
atio
n - H
C In
tens
ity in
"Lo
w T
ariff
" 0.
0049
0.01
140.
0118
0.01
490.
0100
0.01
220.
0094
0.01
21[∆
(SC
H90
70)
X H
CIN
T X
LO
W]
(2.0
5)(3
.29)
(3.0
3)(3
.97)
(3.3
2)(3
.88)
(2.5
5)(3
.35)
HC
Acc
umul
atio
n - H
C In
tens
ity in
"H
igh
Tarif
f"
0.01
250.
0166
0.00
290.
0116
-0.0
268
-0.0
250
-0.0
272
-0.0
277
[∆(S
CH
9070
) X
HC
INT
X H
IGH
](1
.72)
(2.3
9)(0
.32)
(1.7
6)(1
.06)
(0.8
9)(0
.81)
(0.8
8)
HC
Qua
lity
- HC
Inte
nsity
in "
Low
Tar
iff"
0.09
380.
0563
0.04
980.
0689
[LFQ
UAL
X H
CIN
T X
LOW
](3
.20)
(1.9
3)(2
.43)
(2.7
7)
HC
Qua
lity
- HC
Inte
nsity
in "
Hig
h Ta
riff"
0.08
480.
0952
0.25
180.
4629
[LFQ
UAL
X H
CIN
T X
HIG
H]
(1.3
9)(1
.42)
(1.4
8)(1
.34)
HC
Qua
ntity
- H
C In
tens
ity in
"Lo
w T
ariff
"0.
0032
0.00
240.
0021
0.00
23[S
CH
70 X
HC
INT
XLO
W]
(2.0
6)(1
.48)
(1.6
9)(1
.72)
HC
Qua
ntity
- H
C In
tens
ity in
"H
igh
Tarif
f"0.
0000
0.00
100.
0181
0.02
28[S
CH
70 X
HC
INT
XH
IGH
](0
.01)
(0.2
6)(0
.89)
(1.1
9)
Oth
er C
ontro
ls
Adj
uste
d R
20.
260
0.25
10.
263
0.25
70.
265
0.25
70.
268
0.26
1O
bs11
7111
7110
7810
7811
7111
7110
7810
78C
ount
ries
3939
3535
3939
3535
Indu
stry
-Cou
ntry
Fix
ed-E
ffec
tsY
esY
esY
esY
esY
esY
esY
esY
es
All
spec
ifica
tions
incl
ude
coun
try a
nd in
dust
ry fi
xed
effe
cts.
Abs
olut
e va
lues
of t
-sta
tistic
s bas
ed o
n ro
bust
stan
dard
err
ors a
re re
porte
d in
par
enth
esis
and
ital
ics b
elow
the
coef
ficie
nts.
Tab
le V
III -
Tar
iff P
rote
ctio
n, H
uman
Cap
ital a
nd In
dust
ry G
row
th
Med
ian
tarif
f rat
e th
resh
old
Wor
ld B
ank
Sach
s-W
arne
rW
orld
Ban
k40%
tarif
f rat
e th
resh
old
The
depe
nden
t var
iabl
e is
the
annu
al re
al g
row
th ra
te o
f val
ue a
dded
at t
he in
dust
ry-c
ount
ry le
vel f
or th
e pe
riod
1980
-198
9 (G
RO
WTH
s,c).
FRA
CTs
,c in
dica
tes t
he in
dust
ry sh
are
in to
tal v
alue
add
ed in
m
anuf
actu
ring
in 1
980.
HIG
H a
nd L
OW
are
indi
cato
r var
iabl
es th
at e
qual
one
if a
cou
ntry
has
rela
tivel
y hi
gh a
nd re
lativ
ely
low
tarif
f rat
es re
spec
tivel
y an
d ze
ro o
ther
wis
e. In
col
umns
(1)-
(4) w
e us
e th
e m
edia
n va
lue
of ta
riffs
in o
ur sa
mpl
e as
a th
resh
old
betw
een
HIG
H a
nd L
OW
. In
colu
mns
(5)-
(8) w
e us
e a
40%
thre
shol
d. T
ariff
dat
a is
take
n fr
om th
e W
orld
Ban
k in
col
umns
(1),
(2),
(5),
and
(6).
In
colu
mns
(3),
(4),
(7) a
nd (8
) we
use
tarif
f dat
a fr
om S
achs
and
War
ner (
1995
). Th
e hu
man
cap
ital a
ccum
ulat
ion
inte
ract
ions
(for
HIG
H a
nd L
OW
tarif
f cou
ntrie
s) e
qual
the
prod
uct o
f ind
ustry
-leve
l hu
man
cap
ital i
nten
sity
(HC
INT)
and
the
coun
try-le
vel c
hang
e in
ave
rage
yea
rs o
f sch
oolin
g ov
er th
e 19
70-1
990
perio
d ( ∆
SCH
). Th
e hu
man
cap
ital q
uant
ity (y
ears
of s
choo
ling)
inte
ract
ions
(for
HIG
H a
nd L
OW
tarif
f cou
ntrie
s) e
qual
the
prod
uct o
f ind
ustry
- leve
l hum
an c
apita
l int
ensi
ty (H
CIN
T) a
nd c
ount
ry-le
vel a
vera
ge y
ears
of
scho
olin
g in
197
0 (S
CH
70).
The
hum
an c
apita
l qua
lity
(sch
oolin
g qu
ality
) int
erac
tions
(for
HIG
H a
nd L
OW
tarif
f cou
ntrie
s) e
qual
the
prod
uct o
f HC
INT
and
an in
dica
tor o
f the
cou
ntry
-leve
l qua
lity
of
the
labo
r for
ce (L
FQU
AL)
. A
ll sp
ecifi
catio
ns a
lso
incl
ude
(coe
ffic
ient
s not
repo
rted)
: A fi
nanc
e tra
de c
redi
t int
erac
tion,
def
ined
as t
he p
rodu
ct o
f an
indu
stry
-leve
l mea
sure
of t
rade
cre
dit d
epen
denc
e (T
RA
DEI
NT)
and
the
coun
try-le
vel f
inan
cial
dev
elop
men
t in
1980
(PR
IV);
a fin
ance
gro
wth
opp
ortu
nitie
s int
erac
tion,
def
ined
as t
he p
rodu
ct o
f an
indu
stry
-leve
l mea
sure
of g
loba
l ind
ustry
gro
wth
op
portu
nitie
s (O
PPO
RT)
and
cou
ntry
-leve
l fin
anci
al d
evel
opm
ent i
n 19
80 (P
RIV
); an
d a
prop
erty
righ
ts in
tera
ctio
n, d
efin
ed a
s th e
pro
duct
of i
ndus
try d
epen
denc
e on
inta
ngib
le a
sset
s (IN
TAN
G) a
nd a
co
untry
-leve
l mea
sure
of p
rope
rty ri
ghts
pro
tect
ion
(PR
OP)
. The
Dat
a A
ppen
dix
give
s mor
e de
taile
d va
riabl
e de
finiti
ons a
nd th
e so
urce
s of t
he d
ata.
Sach
s-W
arne
r
Fina
ncia
l Dev
elop
men
t X G
row
th O
ppor
tuni
ties [
PRIV
XO
PPO
RT];
Fin
anci
al D
evel
opm
ent X
Tra
de A
ffin
ity P
RIV
X
TRAD
EIN
T];
Prop
erty
Rig
hts P
rote
ctio
n X
Inta
ngib
ility
Inte
nsity
[PRO
P X
INTA
NG
]
53ECB
Working Paper Series No 623May 2006

Barr
o-Le
eC
ohen
-Sot
oIV
Bar
ro-L
eeBa
rro-
Lee
Coh
en-S
oto
IV B
arro
-Lee
(1)
(2)
(3)
(4)
(5)
(6)
FRAC
Ts,c
-0.9
647
-0.9
873
-1.0
007
-0.9
804
-1.0
024
-1.0
188
(3.7
2)(3
.46)
(3.4
4)(3
.66)
(3.4
7)(3
.37)
Hum
an C
apita
l Acc
umul
atio
n In
tera
ctio
n0.
0196
0.02
060.
0366
0.15
210.
0867
0.21
36[∆
(SC
H90
80)
X H
CIN
T]
(3.7
5)
(2.4
6)
(2.5
4)
(3.4
9)
(2.0
1)
(2.3
0)
0.00
400.
0029
0.00
460.
0480
0.03
480.
0614
(2.8
7)
(2.5
4)
(2.7
9)
(3.4
0)
(2.6
5)
(2.7
3)
Oth
er C
ontro
ls
Adj
uste
d R
20.
264
0.27
30.
308
0.27
20.
3248
Obs
1207
1131
1121
1131
1121
Cou
ntrie
s40
3837
4038
37In
dust
ry-C
ount
ry F
ixed
-Eff
ect s
Yes
Yes
Yes
Yes
Yes
Yes
Tab
le IX
- M
easu
rem
ent E
rror
and
Log
arith
mic
Spe
cific
atio
ns
The
depe
nden
t var
iabl
e is
the
annu
al re
al g
row
th ra
te o
f val
ue a
dded
at t
he in
dust
ry-c
ount
ry le
vel f
or th
e pe
riod
1980
-198
9 (G
RO
WTH
s,c).
FRA
CTs
,c in
dica
tes t
he in
dust
ry sh
are
in to
tal v
alue
add
ed
in m
anuf
actu
ring
in 1
980.
The
hum
an c
apita
l acc
umul
atio
n in
tera
ctio
n is
the
prod
uct o
f ind
ustry
-leve
l hum
an c
apita
l int
ensi
ty ( H
CIN
T) a
nd th
e co
untry
-leve
l cha
nge
in a
vera
ge y
ears
of s
choo
ling
over
th
e 19
70-1
980
perio
d (∆
SCH
). Th
e hu
man
cap
ital q
uant
ity (y
ears
of s
choo
ling)
inte
ract
ion
is th
e pr
oduc
t of i
ndus
try-le
vel h
uman
cap
ital i
nten
sity
(HC
I NT)
and
cou
ntry
-leve
l ave
rage
yea
rs o
f sc
hool
ing
in 1
980
(SC
H80
). In
col
umns
(1) a
nd (4
) we
use
scho
olin
g da
ta fr
om B
arro
and
Lee
(200
1). I
n co
lum
ns (2
) and
(5) w
e us
e sc
hool
ing
data
from
Coh
en a
nd S
oto
(200
2). C
olum
ns (3
) and
(6)
repo
rt in
stru
men
tal-v
aria
bles
est
imat
es u
sing
Coh
en-S
oto
chan
ges i
n sc
hool
ing
and
the
initi
al sc
hool
ing
leve
l as i
nstru
men
ts fo
r the
cor
resp
ondi
ng B
arro
-Lee
var
iabl
es. T
he m
odel
s est
imat
ed in
col
u(4
)-(6
) rel
y on
the
loga
rithm
ic c
hang
e in
scho
olin
g an
d th
e lo
g le
vel o
f sch
oolin
g in
198
0.
All
spec
ifica
tions
als
o in
clud
e (c
oeff
icie
nts n
ot re
porte
d): A
fina
nce
trade
cre
dit i
nter
actio
n, d
efin
ed a
s the
pro
duct
of a
n i n
dust
ry-le
vel m
easu
re o
f tra
de c
redi
t dep
ende
nce
(TR
AD
EIN
T) a
nd th
e co
untry
-leve
l fin
anci
al d
evel
opm
ent i
n 19
80 (P
RIV
); a
finan
ce g
row
th o
ppor
tuni
ties i
nter
actio
n, d
efin
ed a
s the
pro
duct
of a
n in
dust
ry-le
vel m
easu
re o
f glo
bal i
ndus
try g
row
th o
ppor
tuni
ties (
OPP
OR
T)
and
coun
try-le
vel f
inan
cial
dev
elop
men
t in
1980
(PR
IV);
and
a pr
oper
ty ri
ghts
inte
ract
ion,
def
ined
as t
he p
rodu
ct o
f ind
ustry
dep
ende
nce
on in
tang
ible
ass
ets (
INTA
NG
) and
a c
ount
ry-le
vel m
easu
re o
f pr
oper
ty ri
ghts
pro
tect
ion
(PR
OP)
. The
Dat
a A
ppen
dix
give
s mor
e de
taile
d va
riabl
e de
finiti
ons a
nd th
e so
urce
s of t
he d
ata.
All
s pec
ifica
tions
incl
ude
coun
try a
nd in
dust
ry fi
xed
effe
cts.
Abs
olut
e va
lof
t-st
atis
tics b
ased
on
robu
st st
anda
rd e
rror
s are
repo
rted
in p
aren
thes
is a
nd it
alic
s bel
ow th
e co
effic
ient
s.
Cha
nge
(199
0-19
80) i
n sc
hool
ing
and
initi
al (1
980)
leve
l of s
choo
ling
mea
sure
d as
Hum
an C
apita
l Qua
ntity
Inte
ract
ion
[SC
H80
X H
CIN
T]
Loga
rithm
of A
vera
ge S
choo
ling
Yea
rsA
vera
ge S
choo
ling
Yea
rs
Fina
ncia
l Dev
elop
men
t X G
row
th O
ppor
tuni
ties [
PRIV
X O
PPO
RT];
Fin
anci
al D
evel
opm
ent X
Tra
de A
ffin
ity [ P
RIV
X
TRAD
EIN
T];
Prop
erty
Rig
hts P
rote
ctio
n X
Inta
ngib
ility
Inte
nsity
[PRO
P X
INTA
NG
]
54ECBWorking Paper Series No 623May 2006

(1)
(2)
(3)
(4)
(5)
(6)
(7)
(8)
FRAC
Ts,c
-0.9
542
-0.9
723
-0.9
517
-0.9
749
-0.9
656
-0.9
826
-0.9
330
-0.9
759
(3.4
5)(3
.49)
(3.5
1)(3
.54)
(3.6
5)(3
.61)
(3.4
7)(3
.55)
Hum
an C
apita
l Acc
umul
atio
n In
tera
ctio
n0.
0126
0.01
070.
0118
0.00
940.
0135
0.01
170.
0130
0.01
17[∆
(SC
H90
70) X
HC
INT
](3
.92)
(3.5
5)(3
.68)
(3.0
4)(4
.13)
(3.7
6)(3
.91)
(3.7
7)
Hum
an C
apita
l Qua
ntity
Inte
ract
ion
0.00
040.
0016
-0.0
011
0.00
31[S
CH
70 X
HC
INT
](0
.32)
(0.9
5)(0
.57)
(2.0
9)
Hum
an C
apita
l Qua
lity
Inte
ract
ion
0.04
770.
0708
0.04
520.
0838
[ LFQ
UAL
X H
CIN
T]
(2.2
1)(2
.88)
(1.6
2)(2
.94)
GD
P Le
vel -
Hum
an C
apita
l Int
ensi
ty In
tera
ctio
n0.
0183
0.01
04[Y
70 X
HC
INT
](3
.66)
(2.8
5)
Phys
ical
Cap
ital/O
utpu
t - H
uman
Cap
ital I
nten
sity
0.
0246
0.01
39[K
70/Y
70) X
HC
INT
](1
.69)
(1.0
8)
Prop
erty
Rig
hts -
Hum
an C
apita
l Int
ensi
ty In
tera
ctio
n0.
0047
-0.0
013
[PRO
P X
HC
INT
](0
.69)
(0.2
6)
GD
P gr
owth
- H
uman
Cap
ital I
nten
sity
-0
.023
5-0
.395
6[G
ROW
TH90
70 X
HC
INT
](0
.12)
(1.9
0)
Oth
er C
ontro
ls
Adj
uste
d R
20.
257
0.26
00.
252
0.25
80.
259
0.26
20.
251
0.26
1O
bs11
7111
7111
7111
7111
7111
7111
7111
71C
ount
ries
3939
3939
3939
3939
Indu
stry
-Cou
ntry
Dum
mie
sY
esY
esY
esY
esY
esY
esY
esY
es
Fina
ncia
l Dev
elop
men
t X G
row
th O
ppor
tuni
ties [
PRIV
X O
PPO
RT];
Fin
anci
al D
evel
opm
ent X
Tra
de A
ffin
ity [ P
RIV
X T
RAD
EIN
T];
Prop
erty
Rig
hts P
rote
ctio
n X
Inta
ngib
ility
Inte
nsity
[PRO
P X
INTA
NG
]
Tab
le X
-Fur
ther
Rob
ustn
ess C
heck
s
Pane
l A: D
epen
dent
Var
iabl
e: V
alue
Add
ed G
row
th
Phys
ical
Cap
ital
Prop
erty
Rig
hts
GD
P G
row
thG
DP
Leve
l
55ECB
Working Paper Series No 623May 2006

(1)
(2)
(3)
(4)
(5)
(6)
(7)
(8)
FRAC
Ts,c
-0.1
619
-0.1
748
-0.1
434
-0.1
650
-0.1
507
-0.1
746
-0.1
408
-0.1
745
(1.4
6) (1
.55)
(1.3
4) (1
.50)
(1.4
5) (1
.63)
(1.3
4) (1
.61)
Hum
an C
apita
l Acc
umul
atio
n In
tera
ctio
n0.
0080
0.00
620.
0083
0.00
490.
0088
0.00
630.
0094
0.00
72[∆
(SC
H90
70) X
HC
INT
](4
.64)
(3.9
1)(4
.88)
(2.9
8)(4
.89)
(3.8
5)(5
.31)
(4.3
8)
Hum
an C
apita
l Qua
ntity
Inte
ract
ion
0.00
180.
0035
0.00
280.
0040
[SC
H70
X H
CIN
T]
(2.2
5)(3
.35)
(2.3
1)(4
.59)
Hum
an C
apita
l Qua
lity
Inte
ract
ion
0.03
550.
0572
0.04
870.
0765
[LFQ
UAL
X H
CIN
T]
(2.3
9)(3
.68)
(2.6
3)(4
.39)
GD
P Le
vel -
Hum
an C
apita
l Int
ensi
ty In
tera
ctio
n0.
0052
0.00
68[Y
70 X
HC
INT
](1
.63)
(2.9
1)
Phys
ical
Cap
ital/O
utpu
t - H
uman
Cap
ital I
nten
sity
0.
0196
0.01
85[K
70/Y
70) X
HC
INT
](2
.53)
(2.8
6)
Prop
erty
Rig
hts -
Hum
an C
apita
l Int
ensi
ty In
tera
ctio
n0.
0021
0.00
27[P
ROP
X H
CIN
T]
(0.4
6)(0
.94)
GD
P gr
owth
- H
uman
Cap
ital I
nten
sity
-0
.094
9-0
.390
0[G
ROW
TH90
70 X
HC
INT
] (0
.83)
(3.6
4)
Oth
er C
ontro
ls
Adj
uste
d R
20.
448
0.45
00.
437
0.43
90.
438
0.44
40.
437
0.44
7O
bs10
9410
9410
9410
9410
9410
9410
9410
94C
ount
ries
3939
3939
3939
3939
Indu
stry
-Cou
ntry
Dum
mie
sY
esY
esY
esY
esY
esY
esY
esY
es
Fina
ncia
l Dev
elop
men
t X G
row
th O
ppor
tuni
ties [
PRIV
X O
PPO
RT];
Fin
anci
al D
evel
opm
ent X
Tra
de A
ffin
ity [ P
RIV
X T
RAD
EIN
T];
Prop
erty
Rig
hts P
rote
ctio
n X
Inta
ngib
ility
Inte
nsity
[ PRO
P X
INTA
NG
]
Tab
le X
-Fur
ther
Rob
ustn
ess C
heck
s (co
nt.)
Pane
l B: D
epen
dent
Var
iabl
e: E
mpl
oym
ent G
row
th
Phys
ical
Cap
ital
Prop
erty
Rig
hts
GD
P G
row
thG
DP
Leve
l
56ECBWorking Paper Series No 623May 2006
Not
es to
Tab
le X
In P
anel
A th
e de
pend
ent v
aria
ble
is th
e an
nual
gro
wth
rate
of r
eal v
alue
add
ed fo
r the
per
iod
1980
-198
9 (G
RO
WTH
s,c).
In P
anel
B th
e de
pend
ent v
aria
ble
is th
e an
nual
gro
wth
rate
of e
mpl
oym
ent f
or th
e pe
riod
1981
-199
0 (E
MPG
Rs,c
). FR
AC
Ts,c
indi
cate
s the
indu
stry
shar
e in
tota
l val
ue a
dded
in m
anuf
actu
ring
in 1
980.
The
hum
an c
apita
l ac c
umul
atio
n in
tera
ctio
n is
the
prod
uct o
f ind
ustry
-leve
l hum
an c
apita
l int
ensi
ty
(HC
INT)
and
the
coun
try-le
vel c
hang
e in
ave
rage
yea
rs o
f sch
oolin
g ov
er th
e 19
70-1
990
perio
d ( ∆
SCH
). Th
e hu
man
cap
ital q
uant
ity (y
ears
of s
choo
ling)
inte
ract
ion
is th
e pr
oduc
t of H
CIN
T an
d co
untry
-leve
l av
erag
e ye
ars o
f sch
oolin
g in
197
0 (S
CH
70).
The
hum
an c
apita
l qua
lity
(sch
oolin
g qu
ality
) int
erac
tion
is th
e pr
oduc
t of H
CIN
T a n
d an
indi
cato
r of t
he c
ount
ry-le
vel q
ualit
y of
the
labo
r for
ce (L
FQU
AL)
. Th
e in
tera
ctio
n be
twee
n pr
oduc
tivity
leve
l and
indu
stry
hum
an c
apita
l int
ensi
ty is
the
prod
uct o
f the
loga
rithm
of G
DP
per w
orke
r (Y
) in
1970
and
indu
stry
-leve
l hum
an c
apita
l int
ensi
ty (H
CIN
T). T
he in
tera
ctio
n be
twee
n th
e ph
ysic
al c
apita
l-out
put r
atio
and
indu
stry
hum
an c
apita
l int
ensi
ty is
the
prod
uct o
f the
loga
rithm
of t
he p
hysi
cal c
apita
l to
GD
P ra
tio (K
/Y) i
n 19
70 a
nd in
dust
ry h
uman
cap
ital i
nten
sity
(HC
INT)
. Th
e in
tera
ctio
n be
twee
n pr
oper
ty ri
ghts
and
indu
stry
hum
an c
apita
l int
ensi
ty is
the
prod
uct o
f pro
perty
righ
ts p
rote
ctio
n (P
RO
P ) a
nd th
e in
dust
ry h
uman
cap
ital i
nten
sity
(HC
INT)
. The
inte
ract
ion
betw
een
prod
uctiv
ity g
row
th a
nd in
dust
ry h
uman
cap
ital i
nten
sity
is th
e pr
oduc
t of t
he lo
garit
hmic
gro
wth
rate
of G
DP
per w
orke
r (G
RO
WT H
) ove
r the
197
0-19
90 p
erio
d an
d in
dust
ry h
uman
cap
ital i
nten
sity
(HC
INT)
. All
spec
ifica
tions
als
o in
clud
e (c
oeff
icie
nts n
ot re
porte
d): A
fina
nce
trade
cre
dit i
nter
actio
n, d
efin
ed a
s the
pro
duct
of a
n in
dus t
ry-le
vel m
easu
re o
f tra
de c
redi
t dep
ende
nce
(TR
AD
EIN
T) a
nd th
e co
untry
-leve
l fin
anci
al
deve
lopm
ent i
n 19
80 (P
RIV
); a
finan
ce g
row
th o
ppor
tuni
ties i
nter
actio
n, d
efin
ed a
s the
pro
duct
of a
n in
dust
ry-le
vel m
easu
re o
f glo
bal i
ndus
try g
row
th o
ppor
tuni
ties (
OPP
OR
T) a
nd c
ount
ry-le
vel f
inan
cial
de
velo
pmen
t in
1980
(PR
IV);
and
a pr
oper
ty ri
ghts
inte
ract
ion,
def
ined
as t
he p
rodu
ct o
f ind
ustry
dep
ende
nce
on in
tang
ible
ass
e ts (
INTA
NG
) and
a c
ount
ry-le
vel m
easu
re o
f pro
perty
righ
ts p
rote
ctio
n (P
RO
P).
The
Dat
a A
ppen
dix
give
s mor
e de
taile
d va
riabl
e de
finiti
ons a
nd th
e so
urce
s of t
he d
ata.
All
spec
ifica
tions
incl
ude
coun
try a
nd in
dust
ry fi
xed
effe
cts.
Abs
olut
e va
lues
of t
-sta
tistic
s bas
ed o
n ro
bust
stan
dard
err
ors a
re
repo
rted
in p
aren
thes
is a
nd it
alic
s bel
ow th
e co
effic
ient
s.

57ECB
Working Paper Series No 623May 2006
European Central Bank Working Paper Series
For a complete list of Working Papers published by the ECB, please visit the ECB’s website(http://www.ecb.int)
585 “Are specific skills an obstacle to labor market adjustment? Theory and an application to the EUenlargement” by A. Lamo, J. Messina and E. Wasmer, February 2006.
586 “A method to generate structural impulse-responses for measuring the effects of shocks instructural macro models” by A. Beyer and R. E. A. Farmer, February 2006.
587 “Determinants of business cycle synchronisation across euro area countries” by U. Böwer andC. Guillemineau, February 2006.
588 “Rational inattention, inflation developments and perceptions after the euro cash changeover”by M. Ehrmann, February 2006.
589 “Forecasting economic aggregates by disaggregates” by D. F. Hendry and K. Hubrich,February 2006.
590 “The pecking order of cross-border investment” by C. Daude and M. Fratzscher, February 2006.
591 “Cointegration in panel data with breaks and cross-section dependence” by A. Banerjee andJ. L. Carrion-i-Silvestre, February 2006.
592 “Non-linear dynamics in the euro area demand for M1” by A. Calza and A. Zaghini,February 2006.
593 “Robustifying learnability” by R. J. Tetlow and P. von zur Muehlen, February 2006.
594 “The euro’s trade effects” by R. Baldwin, comments by J. A. Frankel and J. Melitz, March 2006
595 “Trends and cycles in the euro area: how much heterogeneity and should we worry about it?”by D. Giannone and L. Reichlin, comments by B. E. Sørensen and M. McCarthy, March 2006.
596 “The effects of EMU on structural reforms in labour and product markets” by R. Duvaland J. Elmeskov, comments by S. Nickell and J. F. Jimeno, March 2006.
597 “Price setting and inflation persistence: did EMU matter?” by I. Angeloni, L. Aucremanne,M. Ciccarelli, comments by W. T. Dickens and T. Yates, March 2006.
598 “The impact of the euro on financial markets” by L. Cappiello, P. Hördahl, A. Kadarejaand S. Manganelli, comments by X. Vives and B. Gerard, March 2006.
599 “What effects is EMU having on the euro area and its Member Countries? An overview”by F. P. Mongelli and J. L. Vega, March 2006.
600 “A speed limit monetary policy rule for the euro area” by L. Stracca, April 2006.
601 “Excess burden and the cost of inefficiency in public services provision” by A. Afonsoand V. Gaspar, April 2006.
602 “Job flow dynamics and firing restrictions: evidence from Europe” by J. Messina and G. Vallanti,April 2006.

58ECBWorking Paper Series No 623May 2006
603 “Estimating multi-country VAR models” by F. Canova and M. Ciccarelli, April 2006.
604 “A dynamic model of settlement” by T. Koeppl, C. Monnet and T. Temzelides, April 2006.
605 “(Un)Predictability and macroeconomic stability” by A. D’Agostino, D. Giannone and P. Surico,April 2006.
606 “Measuring the importance of the uniform nonsynchronization hypothesis” by D. A. Dias,C. Robalo Marques and J. M. C. Santos Silva, April 2006.
607 “Price setting behaviour in the Netherlands: results of a survey” by M. Hoeberichts andA. Stokman, April 2006.
608 “How does information affect the comovement between interest rates and exchange rates?”by M. Sánchez, April 2006.
609 “The elusive welfare economics of price stability as a monetary policy objective: why NewKeynesian central bankers should validate core inflation” by W. H. Buiter, April 2006.
610 “Real-time model uncertainty in the United States: the Fed from 1996-2003” by R. J. Tetlowand B. Ironside, April 2006.
611 “Monetary policy, determinacy, and learnability in the open economy” by J. Bullardand E. Schaling, April 2006.
612 “Optimal fiscal and monetary policy in a medium-scale macroeconomic model”by S. Schmitt-Grohé and M. Uribe, April 2006.
613 “Welfare-based monetary policy rules in an estimated DSGE model of the US economy”by M. Juillard, P. Karam, D. Laxton and P. Pesenti, April 2006.
614 “Expenditure switching vs. real exchange rate stabilization: competing objectives forexchange rate policy” by M. B. Devereux and C. Engel, April 2006.
615 “Quantitative goals for monetary policy” by A. Fatás, I. Mihov and A. K. Rose, April 2006.
616 “Global financial transmission of monetary policy shocks” by M. Ehrmann and M. Fratzscher,April 2006.
617 “New survey evidence on the pricing behaviour of Luxembourg firms” by P. Lünnemannand T. Y. Mathä, May 2006.
618 “The patterns and determinants of price setting in the Belgian industry” by D. Cornilleand M. Dossche, May 2006.
619by A. Campolmi and E. Faia, May 2006.
620 “Does fiscal policy matter for the trade account? A panel cointegration study” by K. Funke
621 “Assessing predetermined expectations in the standard sticky-price model: a Bayesian approach”by P. Welz, May 2006.
“Cyclical inflation divergence and different labor market institutions in the EMU”
and C. Nickel, May 2006.

59ECB
Working Paper Series No 623May 2006
622 “Short-term forecasts of euro area real GDP growth: an assessment of real-time performancebased on vintage data” by M. Diron, May 2006.
623 “Human capital, the structure of production, and growth” by A. Ciccone andE. Papaioannou, May 2006.

ISSN 1561081-0
9 7 7 1 5 6 1 0 8 1 0 0 5