human and machine vision
TRANSCRIPT

Partial success in closing the gap betweenhuman and machine vision
Robert Geirhos1-2§ Kantharaju Narayanappa1 Benjamin Mitzkus1
Tizian Thieringer1 Matthias Bethge1∗ Felix A. Wichmann1∗ Wieland Brendel1∗
1University of Tübingen2International Max Planck Research School for Intelligent Systems
∗Joint senior authors§To whom correspondence should be addressed: [email protected]
Abstract
A few years ago, the first CNN surpassed human performance on ImageNet. How-ever, it soon became clear that machines lack robustness on more challenging testcases, a major obstacle towards deploying machines “in the wild” and towardsobtaining better computational models of human visual perception. Here we ask:Are we making progress in closing the gap between human and machine vision?To answer this question, we tested human observers on a broad range of out-of-distribution (OOD) datasets, recording 85,120 psychophysical trials across 90participants. We then investigated a range of promising machine learning devel-opments that crucially deviate from standard supervised CNNs along three axes:objective function (self-supervised, adversarially trained, CLIP language-imagetraining), architecture (e.g. vision transformers), and dataset size (ranging from 1Mto 1B).Our findings are threefold. (1.) The longstanding distortion robustness gap be-tween humans and CNNs is closing, with the best models now exceeding humanfeedforward performance on most of the investigated OOD datasets. (2.) There isstill a substantial image-level consistency gap, meaning that humans make differenterrors than models. In contrast, most models systematically agree in their cate-gorisation errors, even substantially different ones like contrastive self-supervisedvs. standard supervised models. (3.) In many cases, human-to-model consistencyimproves when training dataset size is increased by one to three orders of mag-nitude. Our results give reason for cautious optimism: While there is still muchroom for improvement, the behavioural difference between human and machinevision is narrowing. In order to measure future progress, 17 OOD datasets withimage-level human behavioural data and evaluation code are provided as a toolboxand benchmark at https://github.com/bethgelab/model-vs-human/.
1 Introduction
Looking back at the last decade, deep learning has made tremendous leaps of progress by any standard.What started in 2012 with AlexNet [1] as the surprise winner of the ImageNet Large-Scale VisualRecognition Challenge quickly became the birth of a new AI “summer”, a summer lasting muchlonger than just a season. With it, just like with any summer, came great expectations: the hopethat the deep learning revolution will see widespread applications in industry, that it will propelbreakthroughs in the sciences, and that it will ultimately close the gap between human and machine
35th Conference on Neural Information Processing Systems (NeurIPS 2021).
arX
iv:2
106.
0741
1v2
[cs
.CV
] 2
5 O
ct 2
021
perception. We have now reached the point where deep learning has indeed become a significantdriver of progress in industry [e.g. 2, 3], and where many disciplines are employing deep learningfor scientific discoveries [4–9]—but are we making progress in closing the gap between human andmachine vision?
IID vs. OOD benchmarking. For a long time, the gap between human and machine vision wasmainly approximated by comparing benchmark accuracies on IID (independent and identicallydistributed) test data: as long as models are far from reaching human-level performance on challengingdatasets like ImageNet, this approach is adequate [10]. Currently, models are routinely matchingand in many cases even outperforming humans on IID data. At the same time, it is becomingincreasingly clear that models systematically exploit shortcuts shared between training and testdata [11–14]. Therefore we are witnessing a major shift towards measuring model performance onout-of-distribution (OOD) data rather than IID data alone, which aims at testing models on morechallenging test cases where there is still a ground truth category, but certain image statistics differfrom the training distribution. Many OOD generalisation tests have been proposed: ImageNet-C[15] for corrupted imaes, ImageNet-Sketch [16] for sketches, Stylized-ImageNet [17] for imagestyle changes, [18] for unfamiliar object poses, and many more [19–29]. While it is great to havemany viable and valuable options to measure generalisation, most of these datasets unfortunatelylack human comparison data. This is less than ideal, since we can no longer assume that humansreach near-ceiling accuracies on these challenging test cases as they do on standard noise-free IIDobject recognition datasets. In order to address this issue, we carefully tested human observersin the Wichmannlab’s vision laboratory on a broad range of OOD datasets, providing some 85Kpsychophysical trials across 90 participants. Crucially, we showed exactly the same images tomultiple observers, which means that we are able to compare human and machine vision on thefine-grained level of individual images [30–32]). The focus of our datasets is measuring distortionrobustness: we tested 17 variations that include changes to image style, texture, and various forms ofsynthetic additive noise.
Contributions & outlook. The resulting 17 OOD datasets with large-scale human comparion dataenable us to investigate recent exciting machine learning developments that crucially deviate from“vanilla” CNNs along three axes: objective function (supervised vs. self-supervised, adversariallytrained, and CLIP’s joint language-image training), architecture (convolutional vs. vision transformer)and training dataset size (ranging from 1M to 1B images). Taken together, these are some of the mostpromising directions our field has developed to date—but this field would not be machine learning ifnew breakthroughs weren’t within reach in the next few weeks, months and years. Therefore, weopen-sourced modelvshuman, a Python toolbox that enables testing both PyTorch and TensorFlowmodels on our comprehensive benchmark suite of OOD generalisation data in order to measurefuture progress. Even today, our results give cause for (cautious) optimism. After a method overview(Section 2), we are able to report that the human-machine distortion robustness gap is closing: thebest models now match or in many cases even exceed human feedforward performance on most ofthe investigated OOD datasets (Section 3). While there is still a substantial image-level consistencygap between humans and machines, this gap is narrowing on some—but not all—datasets when thesize of the training dataset is increased (Section 4).
2 Methods: datasets, psychophysical experiments, models, metrics, toolbox
OOD datasets with consistency-grade human data. We collected human data for 17 generalisa-tion datasets (visualized in Figures 7 and 8 in the Appendix, which also state the number of subjectsand trials per experiment) on a carefully calibrated screen in a dedicated psychophysical laboratory (atotal of 85,120 trials across 90 observers). Five datasets each correspond to a single manipulation(sketches, edge-filtered images, silhouettes, images with a texture-shape cue conflict, and stylizedimages where the original image texture is replaced by the style of a painting); the remaining twelvedatasets correspond to parametric image degradations (e.g. different levels of noise or blur). ThoseOOD datasets have in common that they are designed to test ImageNet-trained models. OOD imageswere obtained from different sources: sketches from ImageNet-Sketch [16], stylized images from
2

Stylized-ImageNet [17], edge-filtered images, silhouettes and cue conflict images from [17]1, and theremaining twelve parametric datasets were adapted from [33]. For these parametric datasets, [33]collected human accuracies but unfortunately, they showed different images to different observersimplying that we cannot use their human data to assess image-level consistency between humans andmachines. Thus we collected psychophysical data for those images ourselves by showing exactlythe same images to multiple observers for each of those twelve datasets. Additionally, we croppedthe images from [33] to 224 × 224 pixels to allow for a fair comparison to ImageNet models (allmodels included in our comparison receive 224× 224 input images; [33] showed 256× 256 imagesto human observers in many cases).
Psychophysical experiments. 90 observers were tested in a darkened chamber. Stimuli werepresented at the center of a 22” monitor with 1920× 1200 pixels resolution (refresh rate: 120 Hz).Viewing distance was 107 cm and target images subtended 3× 3 degrees of visual angle. Humanobservers were presented with an image and asked to select the correct category out of 16 basiccategories (such as chair, dog, airplane, etc.). Stimuli were balanced w.r.t. classes and presented inrandom order. For ImageNet-trained models, in order to obtain a choice from the same 16 categories,the 1,000 class decision vector was mapped to those 16 classes using the WordNet hierarchy [34]. InAppendix I, we explain why this mapping is optimal. We closely followed the experimental protocoldefined by [33], who presented images for 200 ms followed by a 1/f backward mask to limit theinfluence of recurrent processing (otherwise comparing to feedforward models would be difficult).Further experimental details are provided in Appendix C.
Why not use crowdsourcing instead? Our approach of investigating few observers in a high-quality laboratory setting performing many trials is known as the so-called “small-N design”, thebread-and-butter approach in high-quality psychophysics—see, e.g., the review “Small is beautiful:In defense of the small-N design” [35]. This is in contrast to the “crowdsourcing approach” (manyobservers in a noisy setting performing fewer trials each). The highly controlled conditions ofthe Wichmannlab’s psychophysical laboratory come with many advantages over crowdsourceddata collection: precise timing control (down to the millisecond), carefully calibrated monitors(especially important for e.g. low-contrast stimuli), controlled viewing distance (important forfoveal presentation), full visual acuity (we performed an acuity test with every observer prior tothe experiment), observer attention (e.g. no multitasking or children running around during anexperiment, which may happen in a crowdsourcing study), just to name a few [36]. Jointly, thesefactors contribute to high data quality.
Models. In order to disentangle the influence of objective function, architecture and trainingdataset size, we tested a total of 52 models: 24 standard ImageNet-trained CNNs [37], 8 self-supervised models [38–43],2 6 Big Transfer models [45], 5 adversarially trained models [46], 5 visiontransformers [47, 48], two semi-weakly supervised models [49] as well as Noisy Student [50] andCLIP [51]. Technical details for all models are provided in the Appendix.
Metrics. In addition to OOD accuracy (averaged across conditions and datasets), the followingthree metrics quantify how closely machines are aligned with the decision behaviour of humans.
Accuracy difference A(m) is a simple aggregate measure that compares the accuracy of a machine mto the accuracy of human observers in different out-of-distribution tests,
A(m) : R→ [0, 1],m 7→ 1
|D|∑d∈D
1
|Hd|∑h∈Hd
1
|Cd|∑c∈Cd
(accd,c(h)− accd,c(m))2 (1)
where accd,c(·) is the accuracy of the model or the human on dataset d ∈ D and condition c ∈ Cd
(e.g. a particular noise level), and h ∈ HD denotes a human observer tested on dataset d. Analogously,one can compute the average accuracy difference between a human observer h1 and all other humanobservers by substituting h1 for m and h ∈ HD \ {h1} for h ∈ HD (which can also be applied forthe two metrics defined below).
1For those three datasets consisting of 160, 160 and 1280 images respectively, consistency-grade psy-chophysical data was already collected by the authors and included in our benchmark with permission from theauthors.
2We presented a preliminary and much less comprehensive version of this work at the NeurIPS 2020workshop SVRHM [44].
3

Aggregated metrics like A(m) ignore individual image-level decisions. Two models with vastlydifferent image-level decision behaviour might still end up with the same accuracies on each datasetand condition. Hence, we include two additional metrics in our benchmark that are sensitive todecisions on individual images.
Observed consistency O(m) [32] measures the fraction of samples for which humans and a modelm get the same sample either both right or both wrong. More precisely, let bh,m(s) be one if botha human observer h and m decide either correctly or incorrectly on a given sample s, and zerootherwise. We calculate the average observed consistency as
O(m) : R→ [0, 1],m 7→ 1
|D|∑d∈D
1
|Hd|∑h∈Hd
1
|Cd|∑c∈Cd
1
|Sd,c|∑
s∈Sd,c
bh,m(s) (2)
where s ∈ Sd,c denotes a sample s (in our case, an image) of condition c from dataset d. Note thatthis measure can only be zero if the accuracy of h and m are exactly the same in each dataset andcondition.
Error consistency E(m) [32] tracks whether there is above-chance consistency. This is an importantdistinction, since e.g. two decision makers with 95% accuracy each will have at least 90% observedconsistency, even if their 5% errors occur on non-overlapping subsets of the test data (intuitively, theyboth get most images correct and thus observed overlap is high). To this end, error consistency (a.k.a.Cohen’s kappa, cf. [52]) indicates whether the observed consistency is larger than what could havebeen expected given two independent binomial decision makers with matched accuracy, which wedenote as oh,m. This can easily be computed analytically [e.g. 32, equation 1]. Then, the averageerror consistency is given by
E(m) : R→ [−1, 1],m 7→ 1
|D|∑d∈D
1
|Hd|∑h∈Hd
1
|Cd|∑c∈Cd
( 1|Sd,c|
∑s∈Sd,c
bh,m(s))− oh,m(Sd,c)
1− oh,m(Sd,c)
(3)
Benchmark & toolbox. A(m), O(m) and E(m) each quantify a certain aspect of the human-machine gap. We use the mean rank order across these metrics to determine an overall model ranking(Table 2 in the Appendix). However, we would like to emphasise that the primary purpose of thisbenchmark is to generate insights, not winners. Since insights are best gained from detailed plotsand analyses, we open-source modelvshuman, a Python project to benchmark models against humandata.3 The current model zoo already includes 50+ models, and an option to add new ones (bothPyTorch and TensorFlow). Evaluating a model produces a 15+ page report on model behaviour. Allplots in this paper can be generated for future models—to track whether they narrow the gap towardshuman vision, or to determine whether an algorithmic modification to a baseline model (e.g., anarchitectural improvement) changes model behaviour.
3 Robustness across models: the OOD distortion robustness gap betweenhuman and machine vision is closing
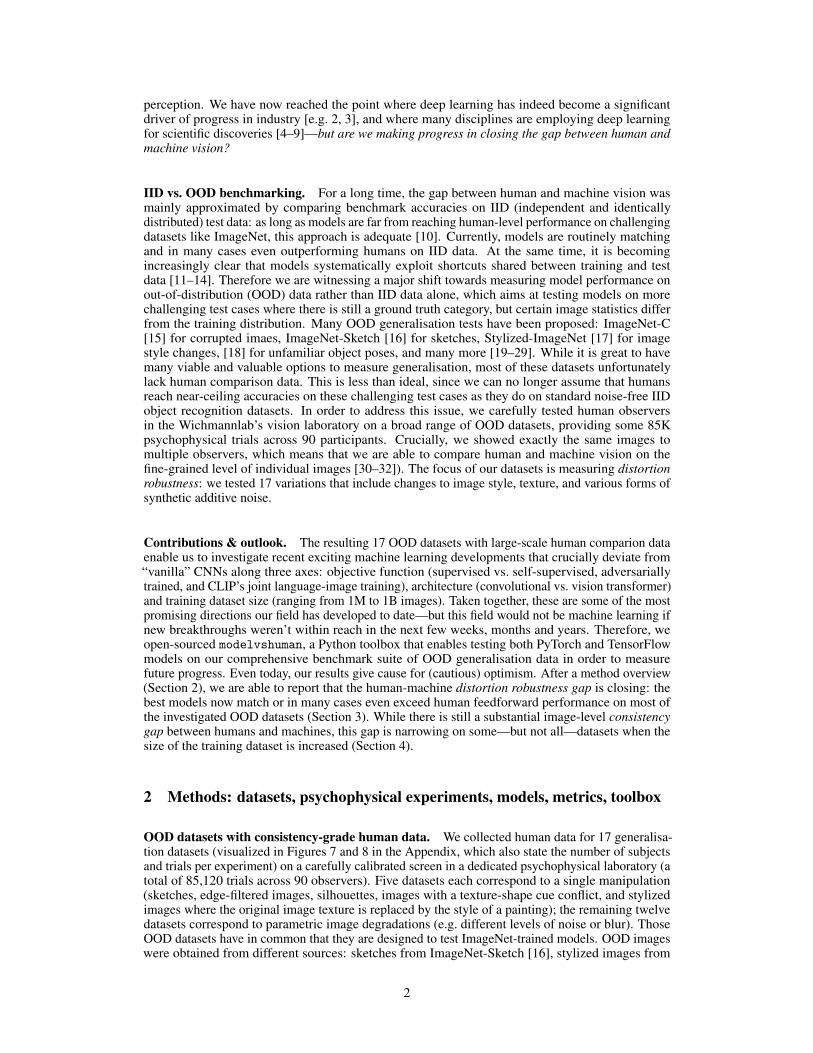
We are interested in measuring whether we are making progress in closing the gap between humanand machine vision. For a long time, CNNs were unable to match human robustness in terms ofgeneralisation beyond the training distribution—a large OOD distortion robustness gap [14, 33, 53–55]. Having tested human observers on 17 OOD datasets, we are now able to compare the latestdevelopments in machine vision to human perception. Our core results are shown in Figure 1: theOOD distortion robustness gap between human and machine vision is closing (1a, 1b), especially formodels trained on large-scale datasets. On the individual image level, a human-machine consistencygap remains (especially 1d), which will be discussed later.
Self-supervised models “If intelligence is a cake, the bulk of the cake is unsupervised learning,the icing on the cake is supervised learning and the cherry on the cake is reinforcement learning”,
3Of course, comparing human and machine vision is not limited to object recognition behaviour: othercomparisons may be just as valid and interesting.
4

0.0
0.1
0.2
0.3
0.4
0.5
0.6
0.7
0.8
0.9
OOD
accu
racy
sque
ezen
et1_
0sq
ueez
enet
1_1
alex
net
shuf
flene
t_v2
_x0_
5In
sDis:
Res
Net-5
0m
nasn
et0_
5PI
RL: R
esNe
t-50
vgg1
1_bn
vgg1
3_bn
ResN
et-5
0 L2
eps
5.0
MoC
o: R
esNe
t-50
mob
ilene
t_v2
resn
et18
mna
snet
1_0
vgg1
6_bn
ResN
et-5
0 L2
eps
3.0
ResN
et-5
0 L2
eps
0.0
vgg1
9_bn
ResN
et-5
0 L2
eps
1.0
ResN
et-5
0 L2
eps
0.5
resn
et34
resn
et50
wide
_res
net5
0_2
resn
ext5
0_32
x4d
Info
Min
: Res
Net-5
0in
cept
ion_
v3M
oCoV
2: R
esNe
t-50
dens
enet
121
ViT-
Sre
snet
101
wide
_res
net1
01_2
resn
et15
2re
snex
t101
_32x
8dSi
mCL
R: R
esNe
t-50x
1de
nsen
et16
9de
nsen
et20
1Si
mCL
R: R
esNe
t-50x
2Bi
T-M
: Res
Net-5
0x1
(14M
)Vi
T-B
ViT-
B (1
4M)
BiT-
M: R
esNe
t-101
x1 (1
4M)
SWSL
: Res
Net-5
0 (9
40M
)Si
mCL
R: R
esNe
t-50x
4Bi
T-M
: Res
Net-5
0x3
(14M
)Bi
T-M
: Res
Net-1
01x3
(14M
)Bi
T-M
: Res
Net-1
52x4
(14M
)Bi
T-M
: Res
Net-1
52x2
(14M
)SW
SL: R
esNe
Xt-1
01 (9
40M
)Vi
T-L
CLIP
: ViT
-B (4
00M
)hu
man
sVi
T-L
(14M
)No
isy S
tude
nt: E
NetL
2 (3
00M
)
(a) OOD accuracy (higher = better).
0.00
0.02
0.04
0.06
0.08
0.10
0.12
0.14
accu
racy
diff
eren
ce
sque
ezen
et1_
0In
sDis:
Res
Net-5
0sq
ueez
enet
1_1
shuf
flene
t_v2
_x0_
5PI
RL: R
esNe
t-50
alex
net
mna
snet
0_5
MoC
o: R
esNe
t-50
vgg1
1_bn
vgg1
3_bn
mna
snet
1_0
mob
ilene
t_v2
resn
et18
vgg1
6_bn
resn
et50
ResN
et-5
0 L2
eps
5.0
Info
Min
: Res
Net-5
0Re
sNet
-50
L2 e
ps 0
.0re
snet
34wi
de_r
esne
t50_
2M
oCoV
2: R
esNe
t-50
vgg1
9_bn
Sim
CLR:
Res
Net-5
0x1
ResN
et-5
0 L2
eps
3.0
resn
ext5
0_32
x4d
ResN
et-5
0 L2
eps
1.0
ResN
et-5
0 L2
eps
0.5
dens
enet
121
resn
et15
2re
snet
101
resn
ext1
01_3
2x8d
Sim
CLR:
Res
Net-5
0x2
Sim
CLR:
Res
Net-5
0x4
wide
_res
net1
01_2
ViT-
Sin
cept
ion_
v3de
nsen
et16
9de
nsen
et20
1Vi
T-B
(14M
)Vi
T-B
BiT-
M: R
esNe
t-50x
1 (1
4M)
SWSL
: Res
Net-5
0 (9
40M
)Bi
T-M
: Res
Net-1
01x3
(14M
)Bi
T-M
: Res
Net-5
0x3
(14M
)No
isy S
tude
nt: E
NetL
2 (3
00M
)Bi
T-M
: Res
Net-1
52x4
(14M
)Bi
T-M
: Res
Net-1
52x2
(14M
)Vi
T-L
(14M
)Bi
T-M
: Res
Net-1
01x1
(14M
)Vi
T-L
SWSL
: Res
NeXt
-101
(940
M)
CLIP
: ViT
-B (4
00M
)hu
man
s
(b) Accuracy difference (lower = better).
0.0
0.1
0.2
0.3
0.4
0.5
0.6
0.7
0.8
0.9
obse
rved
con
siste
ncy
sque
ezen
et1_
0sh
uffle
net_
v2_x
0_5
sque
ezen
et1_
1In
sDis:
Res
Net-5
0al
exne
tPI
RL: R
esNe
t-50
MoC
o: R
esNe
t-50
mna
snet
0_5
vgg1
3_bn
vgg1
1_bn
mob
ilene
t_v2
mna
snet
1_0
resn
et18
ResN
et-5
0 L2
eps
5.0
vgg1
6_bn
ResN
et-5
0 L2
eps
0.0
Info
Min
: Res
Net-5
0M
oCoV
2: R
esNe
t-50
vgg1
9_bn
resn
et34
wide
_res
net5
0_2
ResN
et-5
0 L2
eps
3.0
resn
et50
resn
ext5
0_32
x4d
Sim
CLR:
Res
Net-5
0x1
ResN
et-5
0 L2
eps
0.5
ResN
et-5
0 L2
eps
1.0
dens
enet
121
resn
et10
1re
snex
t101
_32x
8dre
snet
152
wide
_res
net1
01_2
ince
ptio
n_v3
ViT-
SSi
mCL
R: R
esNe
t-50x
2de
nsen
et16
9de
nsen
et20
1Si
mCL
R: R
esNe
t-50x
4Vi
T-B
(14M
)Bi
T-M
: Res
Net-5
0x1
(14M
)Vi
T-B
BiT-
M: R
esNe
t-101
x3 (1
4M)
BiT-
M: R
esNe
t-50x
3 (1
4M)
SWSL
: Res
Net-5
0 (9
40M
)Bi
T-M
: Res
Net-1
52x4
(14M
)Bi
T-M
: Res
Net-1
01x1
(14M
)Bi
T-M
: Res
Net-1
52x2
(14M
)Vi
T-L
ViT-
L (1
4M)
SWSL
: Res
NeXt
-101
(940
M)
CLIP
: ViT
-B (4
00M
)No
isy S
tude
nt: E
NetL
2 (3
00M
)hu
man
s
(c) Observed consistency (higher = better).0.0
0.1
0.2
0.3
0.4
0.5
erro
r con
siste
ncy
InsD
is: R
esNe
t-50
PIRL
: Res
Net-5
0M
oCo:
Res
Net-5
0sq
ueez
enet
1_0
shuf
flene
t_v2
_x0_
5al
exne
tIn
foM
in: R
esNe
t-50
Noisy
Stu
dent
: ENe
tL2
(300
M)
mna
snet
0_5
sque
ezen
et1_
1wi
de_r
esne
t50_
2M
oCoV
2: R
esNe
t-50
ResN
et-5
0 L2
eps
0.0
Sim
CLR:
Res
Net-5
0x4
Sim
CLR:
Res
Net-5
0x1
Sim
CLR:
Res
Net-5
0x2
vgg1
3_bn
resn
ext1
01_3
2x8d
resn
ext5
0_32
x4d
wide
_res
net1
01_2
mna
snet
1_0
resn
et15
2re
snet
101
vgg1
1_bn
mob
ilene
t_v2
vgg1
6_bn
dens
enet
121
vgg1
9_bn
resn
et18
ResN
et-5
0 L2
eps
0.5
BiT-
M: R
esNe
t-101
x3 (1
4M)
resn
et34
ViT-
L (1
4M)
dens
enet
169
resn
et50
ViT-
B (1
4M)
ince
ptio
n_v3
SWSL
: Res
Net-5
0 (9
40M
)de
nsen
et20
1Vi
T-S
ViT-
LVi
T-B
ResN
et-5
0 L2
eps
1.0
BiT-
M: R
esNe
t-50x
3 (1
4M)
BiT-
M: R
esNe
t-152
x4 (1
4M)
SWSL
: Res
NeXt
-101
(940
M)
ResN
et-5
0 L2
eps
3.0
ResN
et-5
0 L2
eps
5.0
BiT-
M: R
esNe
t-50x
1 (1
4M)
BiT-
M: R
esNe
t-152
x2 (1
4M)
BiT-
M: R
esNe
t-101
x1 (1
4M)
CLIP
: ViT
-B (4
00M
)hu
man
s
(d) Error consistency (higher = better).
Figure 1: Core results, aggregated over 17 out-of-distribution (OOD) datasets: The OOD robustnessgap between human and machine vision is closing (top), but an image-level consistency gap remains(bottom). Results compare humans, standard supervised CNNs, self-supervised models, adversariallytrained models, vision transformers, noisy student, BiT, SWSL and CLIP. For convenience, ↓ marksmodels that are trained on large-scale datasets. Metrics defined in Section 2. Best viewed on screen.
Yann LeCun said in 2016 [56]. A few years later, the entire cake is finally on the table—therepresentations learned via self-supervised learning4 now compete with supervised methods onImageNet [43] and outperform supervised pre-training for object detection [41]. But how do recentself-supervised models differ from their supervised counterparts in terms of their behaviour? Do theybring machine vision closer to human vision? Humans, too, rapidly learn to recognise new objectswithout requiring hundreds of labels per instance; additionally a number of studies reported increasedsimilarities between self-supervised models and human perception [57–61]. Figure 2 compares thegeneralisation behaviour of eight self-supervised models in orange (PIRL, MoCo, MoCoV2, InfoMin,InsDis, SimCLR-x1, SimCLR-x2, SimCLR-x4)—with 24 standard supervised models (grey). Wefind only marginal differences between self-supervised and supervised models: Across distortiontypes, self-supervised networks are well within the range of their poorly generalising supervisedcounterparts. However, there is one exception: the three SimCLR variants show strong generalisationimprovements on uniform noise, low contrast, and high-pass images, where they are the three top-performing self-supervised networks—quite remarkable given that SimCLR models were trained on adifferent set of augmentations (random crop with flip and resize, colour distortion, and Gaussian blur).Curious by the outstanding performance of SimCLR, we asked whether the self-supervised objectivefunction or the choice of training data augmentations was the defining factor. When comparingself-supervised SimCLR models with augmentation-matched baseline models trained in the standardsupervised fashion (Figure 15 in the Appendix), we find that the augmentation scheme (rather thanthe self-supervised objective) indeed made the crucial difference: supervised baselines show justthe same generalisation behaviour, a finding that fits well with [62], who observed that the influenceof training data augmentations is stronger than the role of architecture or training objective. Inconclusion, our analyses indicate that the “cake” of contrastive self-supervised learning currently(and disappointingly) tastes much like the “icing”.
4“Unsupervised learning” and “self-supervised learning” are sometimes used interchangeably. We use theterm “self-supervised learning”’ since those methods use (label-free) supervision.
5

colour greyscaleColour
0.0
0.2
0.4
0.6
0.8
1.0
Clas
sifica
tion
accu
racy
(a) Colour vs. greyscaletrue opponent
Colour0.0
0.2
0.4
0.6
0.8
1.0
Clas
sifica
tion
accu
racy
(b) True vs. false colouroriginal equalised
Power spectrum0.0
0.2
0.4
0.6
0.8
1.0
Clas
sifica
tion
accu
racy
(c) Power equalisation0 90 180 270
Rotation angle [ ]0.0
0.2
0.4
0.6
0.8
1.0
Clas
sifica
tion
accu
racy
(d) Rotation
0.0 .03 .05 .1 .2 .35 .6 .9Uniform noise width
0.0
0.2
0.4
0.6
0.8
1.0
Clas
sifica
tion
accu
racy
(e) Uniform noise100 50 30 15 10 5 3 1
Contrast in percent0.0
0.2
0.4
0.6
0.8
1.0
Clas
sifica
tion
accu
racy
(f) Contrast0 1 3 5 7 10 15 40
Filter standard deviation0.0
0.2
0.4
0.6
0.8
1.0
Clas
sifica
tion
accu
racy
(g) Low-passinf 3.0 1.5 1.0 .7 .55 .45 .4
Filter standard deviation0.0
0.2
0.4
0.6
0.8
1.0
Clas
sifica
tion
accu
racy
(h) High-pass
0 30 60 90 120 150 180Phase noise width [ ]
0.0
0.2
0.4
0.6
0.8
1.0
Clas
sifica
tion
accu
racy
(i) Phase noise0 1 2 3 4 5 6 7
Log2 of 'reach' parameter0.0
0.2
0.4
0.6
0.8
1.0
Clas
sifica
tion
accu
racy
(j) Eidolon I0 1 2 3 4 5 6 7
Log2 of 'reach' parameter0.0
0.2
0.4
0.6
0.8
1.0
Clas
sifica
tion
accu
racy
(k) Eidolon II0 1 2 3 4 5 6 7
Log2 of 'reach' parameter0.0
0.2
0.4
0.6
0.8
1.0
Clas
sifica
tion
accu
racy
(l) Eidolon III
Figure 2: The OOD distortion robustness gap between human and machine vision is closing. Robust-ness towards parametric distortions for humans, standard supervised CNNs, self-supervised models,adversarially trained models, vision transformers, noisy student, BiT, SWSL, CLIP. Symbols indicatearchitecture type (# convolutional, O vision transformer, ♦ human); best viewed on screen.
Adversarially trained models The vulnerability of CNNs to adversarial input perturbations is,arguably, one of the most striking shortcomings of this model class compared to robust humanperception. A successful method to increase adversarial robustness is adversarial training [e.g.63, 64]. The resulting models were found to transfer better, have meaningful gradients [65], andenable interpolating between two input images [66]: “robust optimization can actually be viewedas inducing a human prior over the features that models are able to learn” [67, p. 10]. Therefore,we include five models with a ResNet-50 architecture and different accuracy-robustness tradeoffs,adversarially trained on ImageNet with Microsoft-scale resources by [46] to test whether models with“perceptually-aligned representations” also show human-aligned OOD generalisation behaviour—aswe would hope. This is not the case: the stronger the model is trained adversarially (darker shades ofblue in Figure 2), the more susceptible it becomes to (random) image degradations. Most strikingly, asimple rotation by 90 degrees leads to a 50% drop in classification accuracy. Adversarial robustnessseems to come at the cost of increased vulnerability to large-scale perturbations.5 On the other hand,there is a silver lining: when testing whether models are biased towards texture or shape by testingthem on cue conflict images (Figure 3), in accordance with [69, 70] we observe a perfect relationshipbetween shape bias and the degree of adversarial training, a big step in the direction of human shapebias (and a stronger shape bias than nearly all other models).
Vision transformers In computer vision, convolutional networks have become by far the dominat-ing model class over the last decade. Vision transformers [47] break with the long tradition of usingconvolutions and are rapidly gaining traction [71]. We find that the best vision transformer (ViT-Ltrained on 14M images) even exceeds human OOD accuracy (Figure 1a shows the average across 17datasets). There appears to be an additive effect of architecture and data: vision transformers trainedon 1M images (light green) are already better than standard convolutional models; training on 14Mimages (dark green) gives another performance boost. In line with [72, 73], we observe a highershape bias compared to most standard CNNs.
5This might be related to [68], who studied a potentially related tradeoff between selectivity and invariance.
6

alex
net
vgg1
1_bn
vgg1
3_bn
vgg1
6_bn
vgg1
9_bn
sque
ezen
et1_
0sq
ueez
enet
1_1
dens
enet
121
dens
enet
169
dens
enet
201
ince
ptio
n_v3
resn
et18
resn
et34
resn
et50
resn
et10
1re
snet
152
shuf
flene
t_v2
_x0_
5m
obile
net_
v2re
snex
t50_
32x4
dre
snex
t101
_32x
8dwi
de_r
esne
t50_
2wi
de_r
esne
t101
_2m
nasn
et0_
5m
nasn
et1_
0In
sDis:
Res
Net-5
0M
oCo:
Res
Net-5
0PI
RL: R
esNe
t-50
MoC
oV2:
Res
Net-5
0In
foM
in: R
esNe
t-50
Sim
CLR:
Res
Net-5
0x1
Sim
CLR:
Res
Net-5
0x2
Sim
CLR:
Res
Net-5
0x4
ResN
et-5
0 L2
eps
0.0
ResN
et-5
0 L2
eps
0.5
ResN
et-5
0 L2
eps
1.0
ResN
et-5
0 L2
eps
3.0
ResN
et-5
0 L2
eps
5.0
ViT-
SVi
T-B
ViT-
LSW
SL: R
esNe
Xt-1
01 (9
40M
)SW
SL: R
esNe
t-50
(940
M)
BiT-
M: R
esNe
t-152
x4 (1
4M)
BiT-
M: R
esNe
t-152
x2 (1
4M)
BiT-
M: R
esNe
t-101
x3 (1
4M)
BiT-
M: R
esNe
t-101
x1 (1
4M)
BiT-
M: R
esNe
t-50x
3 (1
4M)
BiT-
M: R
esNe
t-50x
1 (1
4M)
ViT-
L (1
4M)
ViT-
B (1
4M)
Noisy
Stu
dent
: ENe
tL2
(300
M)
CLIP
: ViT
-B (4
00M
)hu
man
s
0.0
0.5
1.0
shap
e bi
as
Figure 3: Shape vs. texture biases of different models. While human shape bias is not yet matched,several approaches improve over vanilla CNNs. Box plots show category-dependent distribution ofshape / texture biases (shape bias: high values, texture bias: low values).
Standard models trained on more data: BiT-M, SWSL, Noisy Student Interestingly, the biggesteffect on OOD robustness we find simply comes from training on larger datasets, not from advancedarchitectures. When standard models are combined with large-scale training (14M images for BiT-M,300M for Noisy Student and a remarkable 940M for SWSL), OOD accuracies reach levels not knownfrom standard ImageNet-trained models; these models even outperform a more powerful architecture(vision transformer ViT-S) trained on less data (1M) as shown in Figure 1a. Simply training on(substantially) more data substantially narrows the gap to human OOD accuracies (1b), a finding thatwe quantified in Appendix H by means of a regression model. (The regression model also revealed asignificant interaction between dataset size and objective function, as well as a significant main effectfor transformers over CNNs.) Noisy Student in particular outperforms humans by a large marginoverall (Figure 1a)—the beginning of a new human-machine gap, this time in favour of machines?
CLIP CLIP is special: trained on 400M images6 (more data) with joint language-image supervision(novel objective) and a vision transformer backbone (non-standard architecture), it scores close tohumans across all of our metrics presented in Figure 1; most strikingly in terms of error consistency(which will be discussed in the next section). We tested a number of hypotheses to disentangle whyCLIP appears “special”. H1: because CLIP is trained on a lot of data? Presumably no: NoisyStudent—a model trained on a comparably large dataset of 300M images—performs very well onOOD accuracy, but poorly on error consistency. A caveat in this comparison is the quality of thelabels: while Noisy Student uses pseudolabeling, CLIP receives web-based labels for all images.H2: because CLIP receives higher-quality labels? About 6% of ImageNet labels are plainly wrong[74]. Could it be the case that CLIP simply performs better since it doesn’t suffer from this issue?In order to test this, we used CLIP to generate new labels for all 1.3M ImageNet images: (a) hardlabels, i.e. the top-1 class predicted by CLIP; and (b) soft labels, i.e. using CLIP’s full posteriordistribution as a target. We then trained ResNet-50 from scratch on CLIP hard and soft labels (fordetails see Appendix E). However, this does not show any robustness improvements over a vanillaImageNet-trained ResNet-50, thus different/better labels are not a likely root cause. H3: becauseCLIP has a special image+text loss? Yes and no: CLIP training on ResNet-50 leads to astonishinglypoor OOD results, so training a standard model with CLIP loss alone is insufficient. However, whileneither architecture nor loss alone sufficiently explain why CLIP is special, we find a clear interactionbetween architecture and loss (described in more detail in the Appendix along with the other “CLIPablation” experiments mentioned above).
4 Consistency between models: data-rich models narrow the substantialimage-level consistency gap between human and machine vision
In the previous section we have seen that while self-supervised and adversarially trained modelslack OOD distortion robustness, models based on vision transformers and/or trained on large-scaledatasets now match or exceed human feedforward performance on most datasets. Behaviourally, a
6The boundary between IID and OOD data is blurry for networks trained on big proprietary datasets. Weconsider it unlikely that CLIP was exposed to many of the exact distortions used here (e.g. eidolon or cue conflictimages), but CLIP likely had greater exposure to some conditions such as grayscale or low-contrast images.
7

stan
dard
sup
ervi
sed
CN
Ns
ViT
(Imag
eNet
)ad
v. tr
aine
dhu
man
sda
ta-r
ich
mod
els
self-
supe
rvis
ed
erro
r con
sist
ency
Figure 4: Data-rich models narrow the substantial image-level consistency gap between humansand machines. Error consistency analysis on a single dataset (sketch images; for other datasets seeAppendix, Figures 9, 11, 12, 13, 14) shows that most models cluster (dark red = highly consistenterrors) irrespective of their architecture and objective function; humans cluster differently (highhuman-to-human consistency, low human-to-model consistency); but some data-rich models includingCLIP and SWSL blur the boundary, making more human-like errors than standard models.
natural follow-up question is to ask not just how many, but which errors models make—i.e., do theymake errors on the same individual images as humans on OOD data (an important characteristic ofa “human-like” model, cf. [32, 75])? This is quantified via error consistency (defined in Section 2);which additionally allows us to compare models with each other, asking e.g. which model classesmake similar errors. In Figure 4, we compare all models with each other and with humans, askingwhether they make errors on the same images. On this particular dataset (sketch images), we cansee one big model cluster. Irrespective of whether one takes a standard supervised model, a self-supervised model, an adversarially trained model or a vision transformer, all those models make highlysystematic errors (which extends the results of [32, 76] who found similarities between standardvanilla CNNs). Humans, on the other hand, show a very different pattern of errors. Interestingly,the boundary between humans and some data-rich models at the bottom of the figure—especiallyCLIP (400M images) and SWSL (940M)—is blurry: some (but not all) data-rich models muchmore closely mirror the patterns of errors that humans make, and we identified the first models toachieve higher error consistency with humans than with other (standard) models. Are these promisingresults shared across datasets, beyond the sketch images? In Figures 1c and 1d, aggregated resultsover 17 datasets are presented. Here, we can see that data-rich models approach human-to-humanobserved consistency, but not error consistency. Taken in isolation, observed consistency is not agood measure of image-level consistency since it does not take consistency by chance into account;error consistency tracks whether there is consistency beyond chance; here we see that there is still
8

0.45 0.50 0.55 0.60 0.65 0.70 0.75 0.80OOD accuracy
0.0
0.1
0.2
0.3
0.4
0.5
erro
r con
siste
ncy
expected
(a) 12 “disappointing” datasets
0.2 0.3 0.4 0.5 0.6 0.7 0.8OOD accuracy
0.00
0.05
0.10
0.15
0.20
0.25
0.30
0.35
0.40
erro
r con
siste
ncy
expected
(b) 5 “promising” datasets
Figure 5: Partial failure, partial success: Error consistency with humans aggregated over multipledatasets. Left: 12 datasets where model accuracies exceed human accuracies; here, there is still asubstantial image-level consistency gap to humans. Right: 5 datasets (sketch, silhouette, edge, cueconflict, low-pass) where humans are more robust. Here, OOD accuracy is a near-perfect predictor ofimage-level consistency; especially data-rich models (e.g. CLIP, SWSL, BiT) narrow the consistencygap to humans. Symbols indicate architecture type (# convolutional, O vision transformer, ♦ human).
a substantial image-level consistency gap between human and machine vision. However, severalmodels improve over vanilla CNNs, especially BiT-M (trained on 14M images) and CLIP (400Mimages). This progress is non-trivial; at the same time, there is ample room for future improvement.
How do the findings from Figure 4 (showing nearly human-level error consistency for sketch images)and from Figure 1d (showing a substantial consistency gap when aggregating over 17 datasets) fittogether? Upon closer inspection, we discovered that there are two distinct cases. On 12 datasets(stylized, colour/greyscale, contrast, high-pass, phase-scrambling, power-equalisation, false colour,rotation, eidolonI, -II and -III as well as uniform noise), the human-machine gap is large; here,more robust models do not show improved error consistency (as can be see in Figure 5a). Onthe other hand, for five datasets (sketch, silhouette, edge, cue conflict, low-pass filtering), thereis a completely different result pattern: Here, OOD accuracy is a near-perfect predictor of errorconsistency, which means that improved generalisation robustness leads to more human-like errors(Figure 5b). Furthermore, training on large-scale datasets leads to considerable improvements alongboth axes for standard CNNs. Within models trained on larger datasets, CLIP scores best; but modelswith a standard architecture (SWSL: based on ResNet-50 and ResNeXt-101) closely follow suit.
It remains an open question why the training dataset appears to have the most important impact ona model’s decision boundary as measured by error consistency (as opposed to other aspects of amodel’s inductive bias). Datasets contain various shortcut opportunities [14], and if two differentmodels are trained on similar data, they might converge to a similar solution simply by exploiting thesame shortcuts—which would also fit well to the finding that adversarial examples typically transfervery well between different models [77, 78]. Making models more flexible (such as transformers,a generalisation of CNNs) wouldn’t change much in this regard, since flexible models can stillexploit the same shortcuts. Two predictions immediately follow from this hypothesis: (1.) errorconsistency between two identical models trained on very different datasets, such as ImageNet vs.Stylized-ImageNet, is much lower than error consistency between very different models (ResNet-50vs. VGG-16) trained on the same dataset. (2.) error consistency between ResNet-50 and a highlyflexible model (e.g., a vision transformer) is much higher than error consistency between ResNet-50and a highly constrained model like BagNet-9 [79]. We provide evidence for both predictions inAppendix B, which makes the shortcut hypothesis of model similarity a potential starting point forfuture analyses. Looking forward, it may be worth exploring the links between shortcut learning andimage difficulty, such as understanding whether many “trivially easy” images in common datasetslike ImageNet causes models to expoit the same characteristics irrespective of their architecture [80].
9

5 Discussion
Summary We set out to answer the question: Are we making progress in closing the gap betweenhuman and machine vision? In order to quantify progress, we performed large-scale psychophysicalexperiments on 17 out-of-distribution distortion datasets (open-sourced along with evaluation codeas a benchmark to track future progress). We then investigated models that push the boundariesof traditional deep learning (different objective functions, architectures, and dataset sizes rangingfrom 1M to 1B), asking how they perform relative to human visual perception. We found that theOOD distortion robustness gap between human and machine vision is closing, as the best modelsnow match or exceed human accuracies. At the same time, an image-level consistency gap remains;however, this gap that is at least in some cases narrowing for models trained on large-scale datasets.
Limitations Model robustness is studied from many different viewpoints, including adversarialrobustness [77], theoretical robustness guarantees [e.g. 81], or label noise robustness [e.g. 82]. Thefocus of our study is robustness towards non-adversarial out-of-distribution data, which is particularlywell-suited for comparisons with humans. Since we aimed at a maximally fair comparison betweenfeedforward models and human perception, presentation times for human observers were limited to200 ms in order to limit the influence of recurrent processing. Therefore, human ceiling performancemight be higher still (given more time); investigating this would mean going beyond “core objectrecognition”, which happens within less than 200 ms during a single fixation [83]. Furthermore,human and machine vision can be compared in many different ways. This includes comparingagainst neural data [84, 85], contrasting Gestalt effects [e.g. 86], object similarity judgments [87], ormid-level properties [61] and is of course not limited to studying object recognition. By no meansdo we mean to imply that our behavioural comparison is the only feasible option—on the contrary,we believe it will be all the more exciting to investigate whether our behavioural findings haveimplications for other means of comparison!
Discussion We have to admit that we view our results concerning the benefits of increasing datasetsize by one-to-three orders of magnitude with mixed feelings. On the one hand, “simply” training stan-dard models on (a lot) more data certainly has an intellectually disappointing element—particularlygiven many rich ideas in the cognitive science and neuroscience literature on which architecturalchanges might be required to bring machine vision closer to human vision [88–93]. Additionally,large-scale training comes with infrastructure demands that are hard to meet for many academicresearchers. On the other hand, we find it truly exciting to see that machine models are closing notjust the OOD distortion robustness gap to humans, but that also, at least for some datasets, thosemodels are actually making more human-like decisions on an individual image level; image-levelresponse consistency is a much stricter behavioural requirement than just e.g. matching overallaccuracies. Taken together, our results give reason to celebrate partial success in closing the gapbetween human and machine vision. In those cases where there is still ample room for improvement,our psychophysical benchmark datasets and toolbox may prove useful in quantifying future progress.
Acknowledgments and disclosure of fundingWe thank Andreas Geiger, Simon Kornblith, Kristof Meding, Claudio Michaelis and Ludwig Schmidt for helpfuldiscussions regarding different aspects of this work; Lukas Huber, Maximus Mutschler, David-Elias Künstlefor feedback on the manuscript; Ken Kahn for pointing out typos; Santiago Cadena for sharing a PyTorchimplementation of SimCLR; Katherine Hermann and her collaborators for providing supervised SimCLRbaselines; Uli Wannek and Silke Gramer for infrastructure/administrative support; the many authors who madetheir models publicly available; and our anonymous reviewers for many valuable suggestions.
Furthermore, we are grateful to the International Max Planck Research School for Intelligent Systems (IMPRS-IS) for supporting R.G.; the Collaborative Research Center (Projektnummer 276693517—SFB 1233: RobustVision) for supporting M.B. and F.A.W. This work was supported by the German Federal Ministry of Educationand Research (BMBF): Tübingen AI Center, FKZ: 01IS18039A (W.B. and M.B.). F.A.W. is a member of theMachine Learning Cluster of Excellence, EXC number 2064/1—Project number 390727645. M.B. and W.B.acknowledge funding from the MICrONS program of the Intelligence Advanced Research Projects Activity(IARPA) via Department of Interior/Interior Business Center (DoI/IBC) contract number D16PC00003. W.B.acknowledges financial support via the Emmy Noether Research Group on The Role of Strong ResponseConsistency for Robust and Explainable Machine Vision funded by the German Research Foundation (DFG)under grant no. BR 6382/1-1.
10

Author contributionsProject idea: R.G. and W.B.; project lead: R.G.; coding toolbox and model evaluation pipeline: R.G., K.N.and B.M. based on a prototype by R.G.; training models: K.N. with input from R.G., W.B. and M.B.; datavisualisation: R.G., B.M. and K.N. with input from M.B., F.A.W. and W.B.; psychophysical data collection: T.T.(12 datasets) and B.M. (2 datasets) under the guidance of R.G. and F.A.W.; curating stimuli: R.G.; interpretinganalyses and findings: R.G., M.B., F.A.W. and W.B.; guidance, feedback, infrastructure & funding acquisition:M.B., F.A.W. and W.B.; paper writing: R.G. with help from F.A.W. and W.B. and input from all other authors.
References[1] Alex Krizhevsky, Ilya Sutskever, and Geoffrey E Hinton. ImageNet classification with deep convolutional
neural networks. In Advances in Neural Information Processing Systems, pages 1097–1105, 2012.
[2] Jinjiang Wang, Yulin Ma, Laibin Zhang, Robert X Gao, and Dazhong Wu. Deep learning for smartmanufacturing: Methods and applications. Journal of Manufacturing Systems, 48:144–156, 2018.
[3] Javier Villalba-Diez, Daniel Schmidt, Roman Gevers, Joaquín Ordieres-Meré, Martin Buchwitz, andWanja Wellbrock. Deep learning for industrial computer vision quality control in the printing industry 4.0.Sensors, 19(18):3987, 2019.
[4] Christof Angermueller, Tanel Pärnamaa, Leopold Parts, and Oliver Stegle. Deep learning for computationalbiology. Molecular Systems Biology, 12(7):878, 2016.
[5] Adam H Marblestone, Greg Wayne, and Konrad P Kording. Toward an integration of deep learning andneuroscience. Frontiers in Computational Neuroscience, 10:94, 2016.
[6] Garrett B Goh, Nathan O Hodas, and Abhinav Vishnu. Deep learning for computational chemistry. Journalof Computational Chemistry, 38(16):1291–1307, 2017.
[7] Travers Ching, Daniel S Himmelstein, Brett K Beaulieu-Jones, Alexandr A Kalinin, Brian T Do, Gregory PWay, Enrico Ferrero, Paul-Michael Agapow, Michael Zietz, Michael M Hoffman, et al. Opportunities andobstacles for deep learning in biology and medicine. Journal of The Royal Society Interface, 15(141):20170387, 2018.
[8] Dan Guest, Kyle Cranmer, and Daniel Whiteson. Deep learning and its application to LHC physics. AnnualReview of Nuclear and Particle Science, 68:161–181, 2018.
[9] Andrew W Senior, Richard Evans, John Jumper, James Kirkpatrick, Laurent Sifre, Tim Green, ChongliQin, Augustin Žídek, Alexander WR Nelson, Alex Bridgland, et al. Improved protein structure predictionusing potentials from deep learning. Nature, 577(7792):706–710, 2020.
[10] Olga Russakovsky, Jia Deng, Hao Su, Jonathan Krause, Sanjeev Satheesh, Sean Ma, Zhiheng Huang,Andrej Karpathy, Aditya Khosla, Michael Bernstein, Alexander C Berg, and Li Fei-Fei. ImageNet LargeScale Visual Recognition Challenge. International Journal of Computer Vision, 115(3):211–252, 2015.
[11] Jason Jo and Yoshua Bengio. Measuring the tendency of cnns to learn surface statistical regularities. arXivpreprint arXiv:1711.11561, 2017.
[12] Sara Beery, Grant Van Horn, and Pietro Perona. Recognition in terra incognita. In Proceedings of theEuropean Conference on Computer Vision, pages 456–473, 2018.
[13] Timothy Niven and Hung-Yu Kao. Probing neural network comprehension of natural language arguments.In Proceedings of the 57th Annual Meeting of the Association for Computational Linguistics, pages4658–4664, 2019.
[14] Robert Geirhos, Jörn-Henrik Jacobsen, Claudio Michaelis, Richard Zemel, Wieland Brendel, MatthiasBethge, and Felix A Wichmann. Shortcut learning in deep neural networks. Nature Machine Intelligence,2:665–673, 2020.
[15] Dan Hendrycks and Thomas Dietterich. Benchmarking neural network robustness to common corruptionsand perturbations. In International Conference on Learning Representations, 2019.
[16] Haohan Wang, Songwei Ge, Eric P Xing, and Zachary C Lipton. Learning robust global representations bypenalizing local predictive power. arXiv preprint arXiv:1905.13549, 2019.
[17] Robert Geirhos, Patricia Rubisch, Claudio Michaelis, Matthias Bethge, Felix A. Wichmann, and WielandBrendel. ImageNet-trained CNNs are biased towards texture; increasing shape bias improves accuracy androbustness. In International Conference on Learning Representations, 2019.
11

[18] Michael A Alcorn, Qi Li, Zhitao Gong, Chengfei Wang, Long Mai, Wei-Shinn Ku, and Anh Nguyen.Strike (with) a pose: Neural networks are easily fooled by strange poses of familiar objects. In Proceedingsof the IEEE Conference on Computer Vision and Pattern Recognition, 2019.
[19] Brenden M Lake, Ruslan Salakhutdinov, and Joshua B Tenenbaum. Human-level concept learning throughprobabilistic program induction. Science, 350(6266):1332–1338, 2015.
[20] Andrei Barbu, David Mayo, Julian Alverio, William Luo, Christopher Wang, Dan Gutfreund, JoshTenenbaum, and Boris Katz. ObjectNet: a large-scale bias-controlled dataset for pushing the limits ofobject recognition models. In Advances in Neural Information Processing Systems, pages 9448–9458,2019.
[21] Claudio Michaelis, Benjamin Mitzkus, Robert Geirhos, Evgenia Rusak, Oliver Bringmann, Alexander SEcker, Matthias Bethge, and Wieland Brendel. Benchmarking robustness in object detection: Autonomousdriving when winter is coming. arXiv:1907.07484, 2019.
[22] Rohan Taori, Achal Dave, Vaishaal Shankar, Nicholas Carlini, Benjamin Recht, and Ludwig Schmidt. Mea-suring robustness to natural distribution shifts in image classification. In Advances in Neural InformationProcessing Systems, 2020.
[23] Josip Djolonga, Jessica Yung, Michael Tschannen, Rob Romijnders, Lucas Beyer, Alexander Kolesnikov,Joan Puigcerver, Matthias Minderer, Alexander D’Amour, Dan Moldovan, et al. On robustness andtransferability of convolutional neural networks. In Proceedings of the IEEE Conference on ComputerVision and Pattern Recognition, pages 16458–16468, 2021.
[24] Isaac Dunn, Hadrien Pouget, Daniel Kroening, and Tom Melham. Exposing previously undetectable faultsin deep neural networks. arXiv preprint arXiv:2106.00576, 2021.
[25] Yue He, Zheyan Shen, and Peng Cui. Towards non-iid image classification: A dataset and baselines.Pattern Recognition, 110:107383, 2021.
[26] Dan Hendrycks, Steven Basart, Norman Mu, Saurav Kadavath, Frank Wang, Evan Dorundo, Rahul Desai,Tyler Zhu, Samyak Parajuli, Mike Guo, et al. The many faces of robustness: A critical analysis ofout-of-distribution generalization. In Proceedings of the IEEE Conference on Computer Vision and PatternRecognition, pages 8340–8349, 2021.
[27] Dan Hendrycks, Kevin Zhao, Steven Basart, Jacob Steinhardt, and Dawn Song. Natural adversarialexamples. In Proceedings of the IEEE Conference on Computer Vision and Pattern Recognition, pages15262–15271, 2021.
[28] Spandan Madan, Tomotake Sasaki, Tzu-Mao Li, Xavier Boix, and Hanspeter Pfister. Small in-distributionchanges in 3D perspective and lighting fool both CNNs and transformers. arXiv preprint arXiv:2106.16198,2021.
[29] Vaishaal Shankar, Achal Dave, Rebecca Roelofs, Deva Ramanan, Benjamin Recht, and Ludwig Schmidt.Do image classifiers generalize across time? In Proceedings of the IEEE Conference on Computer Visionand Pattern Recognition, pages 9661–9669, 2021.
[30] David M. Green. Consistency of auditory detection judgments. Psychological Review, 71(5):392–407,1964.
[31] Kristof Meding, Dominik Janzing, Bernhard Schölkopf, and Felix A. Wichmann. Perceiving the arrowof time in autoregressive motion. Advances in Neural Information Processing Systems (NeurIPS), 32:2303–2314, 2019.
[32] Robert Geirhos, Kristof Meding, and Felix A Wichmann. Beyond accuracy: quantifying trial-by-trial be-haviour of CNNs and humans by measuring error consistency. Advances in Neural Information ProcessingSystems, 33, 2020.
[33] Robert Geirhos, Carlos RM Temme, Jonas Rauber, Heiko H Schütt, Matthias Bethge, and Felix AWichmann. Generalisation in humans and deep neural networks. In Advances in Neural InformationProcessing Systems, 2018.
[34] George A Miller. WordNet: a lexical database for English. Communications of the ACM, 38(11):39–41,1995.
[35] Philip L Smith and Daniel R Little. Small is beautiful: In defense of the small-N design. PsychonomicBulletin & Review, 25(6):2083–2101, 2018.
12

[36] Siavash Haghiri, Patricia Rubisch, Robert Geirhos, Felix Wichmann, and Ulrike von Luxburg. Comparison-based framework for psychophysics: lab versus crowdsourcing. arXiv preprint arXiv:1905.07234, 2019.
[37] Sébastien Marcel and Yann Rodriguez. Torchvision the machine-vision package of torch. In Proceedingsof the 18th ACM International Conference on Multimedia, pages 1485–1488, 2010.
[38] Zhirong Wu, Yuanjun Xiong, Stella X Yu, and Dahua Lin. Unsupervised feature learning via non-parametric instance discrimination. In Proceedings of the IEEE Conference on Computer Vision andPattern Recognition, pages 3733–3742, 2018.
[39] Kaiming He, Haoqi Fan, Yuxin Wu, Saining Xie, and Ross Girshick. Momentum contrast for unsupervisedvisual representation learning. In Proceedings of the IEEE Conference on Computer Vision and PatternRecognition, pages 9729–9738, 2020.
[40] Xinlei Chen, Haoqi Fan, Ross Girshick, and Kaiming He. Improved baselines with momentum contrastivelearning. arXiv preprint arXiv:2003.04297, 2020.
[41] Ishan Misra and Laurens van der Maaten. Self-supervised learning of pretext-invariant representations.In Proceedings of the IEEE Conference on Computer Vision and Pattern Recognition, pages 6707–6717,2020.
[42] Yonglong Tian, Chen Sun, Ben Poole, Dilip Krishnan, Cordelia Schmid, and Phillip Isola. What makes forgood views for contrastive learning. arXiv preprint arXiv:2005.10243, 2020.
[43] Ting Chen, Simon Kornblith, Mohammad Norouzi, and Geoffrey Hinton. A simple framework forcontrastive learning of visual representations. arXiv preprint arXiv:2002.05709, 2020.
[44] Robert Geirhos, Kantharaju Narayanappa, Benjamin Mitzkus, Matthias Bethge, Felix A Wichmann, andWieland Brendel. On the surprising similarities between supervised and self-supervised models. arXivpreprint arXiv:2010.08377, 2020.
[45] Alexander Kolesnikov, Lucas Beyer, Xiaohua Zhai, Joan Puigcerver, Jessica Yung, Sylvain Gelly, and NeilHoulsby. Big transfer (BiT): General visual representation learning. arXiv preprint arXiv:1912.11370, 6(2):8, 2019.
[46] Hadi Salman, Andrew Ilyas, Logan Engstrom, Ashish Kapoor, and Aleksander Madry. Do adversariallyrobust ImageNet models transfer better? arXiv preprint arXiv:2007.08489, 2020.
[47] Alexey Dosovitskiy, Lucas Beyer, Alexander Kolesnikov, Dirk Weissenborn, Xiaohua Zhai, ThomasUnterthiner, Mostafa Dehghani, Matthias Minderer, Georg Heigold, Sylvain Gelly, et al. An image is worth16x16 words: Transformers for image recognition at scale. arXiv preprint arXiv:2010.11929, 2020.
[48] Ross Wightman. PyTorch image models. https://github.com/rwightman/pytorch-image-models, 2019.
[49] I Zeki Yalniz, Hervé Jégou, Kan Chen, Manohar Paluri, and Dhruv Mahajan. Billion-scale semi-supervisedlearning for image classification. arXiv preprint arXiv:1905.00546, 2019.
[50] Qizhe Xie, Minh-Thang Luong, Eduard Hovy, and Quoc V Le. Self-training with noisy student im-proves ImageNet classification. In Proceedings of the IEEE Conference on Computer Vision and PatternRecognition, pages 10687–10698, 2020.
[51] Alec Radford, Jong Wook Kim, Chris Hallacy, Aditya Ramesh, Gabriel Goh, Sandhini Agarwal, GirishSastry, Amanda Askell, Pamela Mishkin, Jack Clark, et al. Learning transferable visual models fromnatural language supervision. arXiv preprint arXiv:2103.00020, 2021.
[52] Jacob Cohen. A coefficient of agreement for nominal scales. Educational and Psychological Measurement,20(1):37–46, 1960.
[53] Samuel Dodge and Lina Karam. A study and comparison of human and deep learning recognitionperformance under visual distortions. In 26th International Conference on Computer Communication andNetworks, pages 1–7. IEEE, 2017.
[54] Felix A Wichmann, David HJ Janssen, Robert Geirhos, Guillermo Aguilar, Heiko H Schütt, MarianneMaertens, and Matthias Bethge. Methods and measurements to compare men against machines. ElectronicImaging, Human Vision and Electronic Imaging, 2017(14):36–45, 2017.
[55] Thomas Serre. Deep learning: the good, the bad, and the ugly. Annual Review of Vision Science, 5:399–426,2019.
13

[56] Yann LeCun. Predictive learning, 2016. URL https://www.youtube.com/watch?v=Ount2Y4qxQo.
[57] William Lotter, Gabriel Kreiman, and David Cox. A neural network trained for prediction mimics diversefeatures of biological neurons and perception. Nature Machine Intelligence, 2(4):210–219, 2020.
[58] A Emin Orhan, Vaibhav V Gupta, and Brenden M Lake. Self-supervised learning through the eyes of achild. arXiv preprint arXiv:2007.16189, 2020.
[59] Talia Konkle and George A Alvarez. Instance-level contrastive learning yields human brain-like represen-tation without category-supervision. bioRxiv, 2020.
[60] Chengxu Zhuang, Siming Yan, Aran Nayebi, Martin Schrimpf, Michael Frank, James DiCarlo, and DanielYamins. Unsupervised neural network models of the ventral visual stream. bioRxiv, 2020.
[61] Katherine R Storrs, Barton L Anderson, and Roland W Fleming. Unsupervised learning predicts humanperception and misperception of gloss. Nature Human Behaviour, pages 1–16, 2021.
[62] Katherine Hermann, Ting Chen, and Simon Kornblith. The origins and prevalence of texture bias inconvolutional neural networks. Advances in Neural Information Processing Systems, 33, 2020.
[63] Ian J Goodfellow, Jonathon Shlens, and Christian Szegedy. Explaining and harnessing adversarial examples.arXiv preprint arXiv:1412.6572, 2014.
[64] Ruitong Huang, Bing Xu, Dale Schuurmans, and Csaba Szepesvári. Learning with a strong adversary.arXiv preprint arXiv:1511.03034, 2015.
[65] Simran Kaur, Jeremy Cohen, and Zachary C Lipton. Are perceptually-aligned gradients a general propertyof robust classifiers? arXiv preprint arXiv:1910.08640, 2019.
[66] Shibani Santurkar, Dimitris Tsipras, Brandon Tran, Andrew Ilyas, Logan Engstrom, and Aleksander Madry.Image synthesis with a single (robust) classifier. arXiv:1906.09453, 2019.
[67] Logan Engstrom, Andrew Ilyas, Shibani Santurkar, Dimitris Tsipras, Brandon Tran, and Aleksander Madry.Adversarial robustness as a prior for learned representations. arXiv preprint arXiv:1906.00945, 2019.
[68] Florian Tramèr, Jens Behrmann, Nicholas Carlini, Nicolas Papernot, and Jörn-Henrik Jacobsen. Fundamen-tal tradeoffs between invariance and sensitivity to adversarial perturbations. In International Conferenceon Machine Learning, pages 9561–9571. PMLR, 2020.
[69] Tianyuan Zhang and Zhanxing Zhu. Interpreting adversarially trained convolutional neural networks. InInternational Conference on Machine Learning, pages 7502–7511. PMLR, 2019.
[70] Peijie Chen, Chirag Agarwal, and Anh Nguyen. The shape and simplicity biases of adversarially robustImageNet-trained CNNs. arXiv preprint arXiv:2006.09373, 2020.
[71] Kai Han, Yunhe Wang, Hanting Chen, Xinghao Chen, Jianyuan Guo, Zhenhua Liu, Yehui Tang, An Xiao,Chunjing Xu, Yixing Xu, et al. A survey on visual transformer. arXiv preprint arXiv:2012.12556, 2020.
[72] Muzammal Naseer, Kanchana Ranasinghe, Salman Khan, Munawar Hayat, Fahad Shahbaz Khan, andMing-Hsuan Yang. Intriguing properties of vision transformers. arXiv preprint arXiv:2105.10497, 2021.
[73] Shikhar Tuli, Ishita Dasgupta, Erin Grant, and Thomas L Griffiths. Are convolutional neural networks ortransformers more like human vision? arXiv preprint arXiv:2105.07197, 2021.
[74] Curtis G Northcutt, Anish Athalye, and Jonas Mueller. Pervasive label errors in test sets destabilizemachine learning benchmarks. arXiv preprint arXiv:2103.14749, 2021.
[75] Rishi Rajalingham, Elias B Issa, Pouya Bashivan, Kohitij Kar, Kailyn Schmidt, and James J DiCarlo.Large-scale, high-resolution comparison of the core visual object recognition behavior of humans, monkeys,and state-of-the-art deep artificial neural networks. Journal of Neuroscience, 38(33):7255–7269, 2018.
[76] Horia Mania, John Miller, Ludwig Schmidt, Moritz Hardt, and Benjamin Recht. Model similarity mitigatestest set overuse. Advances in Neural Information Processing Systems, 2019.
[77] Christian Szegedy, Wojciech Zaremba, Ilya Sutskever, Joan Bruna, Dumitru Erhan, Ian Goodfellow, andRob Fergus. Intriguing properties of neural networks. arXiv:1312.6199, 2013.
[78] Florian Tramèr, Nicolas Papernot, Ian Goodfellow, Dan Boneh, and Patrick McDaniel. The space oftransferable adversarial examples. arXiv preprint arXiv:1704.03453, 2017.
14

[79] Wieland Brendel and Matthias Bethge. Approximating CNNs with bag-of-local-features models workssurprisingly well on ImageNet. In International Conference on Learning Representations, 2019.
[80] Kristof Meding, Luca M Schulze Buschoff, Robert Geirhos, and Felix A Wichmann. Trivial orimpossible–dichotomous data difficulty masks model differences (on ImageNet and beyond). arXivpreprint arXiv:2110.05922, 2021.
[81] Matthias Hein and Maksym Andriushchenko. Formal guarantees on the robustness of a classifier againstadversarial manipulation. arXiv preprint arXiv:1705.08475, 2017.
[82] Arash Vahdat. Toward robustness against label noise in training deep discriminative neural networks. arXivpreprint arXiv:1706.00038, 2017.
[83] James J DiCarlo, Davide Zoccolan, and Nicole C Rust. How does the brain solve visual object recognition?Neuron, 73(3):415–434, 2012.
[84] Daniel LK Yamins, Ha Hong, Charles F Cadieu, Ethan A Solomon, Darren Seibert, and James J DiCarlo.Performance-optimized hierarchical models predict neural responses in higher visual cortex. Proceedingsof the National Academy of Sciences, 111(23):8619–8624, 2014.
[85] Jonas Kubilius, Martin Schrimpf, Kohitij Kar, Rishi Rajalingham, Ha Hong, Najib Majaj, Elias Issa, PouyaBashivan, Jonathan Prescott-Roy, Kailyn Schmidt, et al. Brain-like object recognition with high-performingshallow recurrent ANNs. Advances in Neural Information Processing Systems, 32:12805–12816, 2019.
[86] Been Kim, Emily Reif, Martin Wattenberg, Samy Bengio, and Michael C Mozer. Neural networks trainedon natural scenes exhibit Gestalt closure. Computational Brain & Behavior, pages 1–13, 2021.
[87] Martin N Hebart, Charles Y Zheng, Francisco Pereira, and Chris I Baker. Revealing the multidimen-sional mental representations of natural objects underlying human similarity judgements. Nature HumanBehaviour, 4(11):1173–1185, 2020.
[88] Nikolaus Kriegeskorte. Deep neural networks: a new framework for modeling biological vision and braininformation processing. Annual Review of Vision Science, 1:417–446, 2015.
[89] Brenden M Lake, Tomer D Ullman, Joshua B Tenenbaum, and Samuel J Gershman. Building machinesthat learn and think like people. Behavioral and Brain Sciences, 40, 2017.
[90] Amirhossein Tavanaei, Masoud Ghodrati, Saeed Reza Kheradpisheh, Timothée Masquelier, and AnthonyMaida. Deep learning in spiking neural networks. Neural Networks, 111:47–63, 2019.
[91] Fabian H Sinz, Xaq Pitkow, Jacob Reimer, Matthias Bethge, and Andreas S Tolias. Engineering a lessartificial intelligence. Neuron, 103(6):967–979, 2019.
[92] Joel Dapello, Tiago Marques, Martin Schrimpf, Franziska Geiger, David D Cox, and James J DiCarlo.Simulating a primary visual cortex at the front of CNNs improves robustness to image perturbations.bioRxiv, 2020.
[93] Benjamin D Evans, Gaurav Malhotra, and Jeffrey S Bowers. Biological convolutions improve dnnrobustness to noise and generalisation. bioRxiv, 2021.
[94] Adam Paszke, Sam Gross, Francisco Massa, Adam Lerer, James Bradbury, Gregory Chanan, Trevor Killeen,Zeming Lin, Natalia Gimelshein, Luca Antiga, et al. PyTorch: An imperative style, high-performance deeplearning library. In Advances in Neural Information Processing Systems, pages 8026–8037, 2019.
[95] Aaron van den Oord, Yazhe Li, and Oriol Vinyals. Representation learning with contrastive predictivecoding. arXiv:1807.03748, 2018.
[96] Jia Deng, Wei Dong, Richard Socher, Li-Jia Li, Kai Li, and Li Fei-Fei. ImageNet: a large-scale hierarchicalimage database. In IEEE Conference on Computer Vision and Pattern Recognition, pages 248–255, 2009.
[97] Evgenia Rusak, Steffen Schneider, Peter Gehler, Oliver Bringmann, Wieland Brendel, and MatthiasBethge. Adapting ImageNet-scale models to complex distribution shifts with self-learning. arXiv preprintarXiv:2104.12928, 2021.
[98] Eleanor Rosch. Principles of categorization. In E. Margolis and S. Laurence, editors, Concepts: corereadings, pages 189–206. 1999.
15

Appendix
We here provide details on models (A), describe additional predictions and experiments regardingerror consistency mentioned in Section 4 (B), report experimental details regarding our psychphysicalexperiments (C), provide license information (D), and describe training with ImageNet labels providedby CLIP (E) as well as experiments with supervised SimCLR baseline models (F), provide overallbenchmark scores ranking different models (G), describe a regression model (H) and motivate thechoice of behavioural response mapping (I). Stimuli are visualized in Figures 7 and 8.
Our Python library,“modelvshuman”, to test and benchmark models against high-quality humanpsychophyiscal data is available from https://github.com/bethgelab/model-vs-human/.
A Model details
Standard supervised models. We used all 24 available pre-trained models from the PyTorchmodel zoo version 1.4.0 (VGG: with batch norm).
Self-supervised models. InsDis [38], MoCo [39], MoCoV2 [40], PIRL [41] and InfoMin [42]were obtained as pre-trained models from the PyContrast model zoo. We trained one linear classifierper model on top of the self-supervised representation. A PyTorch [94] implementation of SimCLR[43] was obtained via simclr-converter. All self-supervised models use a ResNet-50 architecture anda different training approach within the framework of contrastive learning [e.g. 95].
Adversarially trained models. We obtained five adversarially trained models [46] from the robust-models-transfer repository. All of them have a ResNet-50 architecture, but a different accuracy-L2-robustness tradeoff indicated by ε. Here are the five models that we used, in increasing order ofadversarial robustness: ε = 0, 0.5, 1.0, 3.0, 5.0.
Vision transformers. Three ImageNet-trained vision transformer (ViT) models [47] wereobtained from pytorch-image-models [48]. Specifically, we used vit_small_patch16_224,vit_base_patch16_224 and vit_large_patch16_224. They are referred to as ViT-S, ViT-B and ViT-Lthroughout the paper. Additionally, we included two transformers that were pre-trained on Ima-geNet21K [96], i.e. 14M images with some 21K classes, before they were fine-tuned on “standard”ImageNet-1K. These two models are referred to as ViT-L (14M) and ViT-B (14M) in the paper. Theywere obtained from the PyTorch-Pretrained-ViT repository, where they are called L_16_imagenet1kand B_16_imagenet1k. (No ViT-S model was available from the repository.) Note that the “im-agenet1k” suffix in the model names does not mean the model was only trained on ImageNet1K.On the contrary, this indicates fine-tuning on ImageNet; as mentioned above these models werepre-trained on ImageNet21K before fine-tuning.
CLIP. OpenAI trained a variety of CLIP models using different backbone networks [51]. Unfortu-nately, the best-performing model has not been released so far, and it is not currently clear whetherit will be released at some point according to issue #2 of OpenAI’s CLIP github repository. Weincluded the most powerful released model in our analysis, a model with a ViT-B/32 backbone.
Noisy Student One pre-trained Noisy Student model was obtained from pytorch-image-models[48], where the model is called tf_efficientnet_e2_ns_475. This involved the following preprocessing(taken from [97]):from PIL . Image import Imagefrom t o r c h v i s i o n . t r a n s f o r m s import Compose , Res ize , CenterCrop , ToTensor , Normal i ze
def g e t _ n o i s y _ s t u d e n t _ p r e p r o c e s s i n g ( ) :n o r m a l i z e = Normal i ze ( mean = [ 0 . 4 8 5 , 0 . 4 5 6 , 0 . 4 0 6 ] ,
s t d = [ 0 . 2 2 9 , 0 . 2 2 4 , 0 . 2 2 5 ] )i m g _ s i z e = 475c r o p _ p c t = 0 .936s c a l e _ s i z e = i m g _ s i z e / c r o p _ p c tre turn Compose ( [
R e s i z e ( s c a l e _ s i z e , i n t e r p o l a t i o n =PIL . Image . BICUBIC ) ,Cen te rCrop ( i m g _ s i z e ) ,ToTensor ( ) ,n o r m a l i z e ,
] )
16

SWSL Two pre-trained SWSL (semi-weakly supervised) models were obtained fromsemi-supervised-ImageNet1K-models, one with a ResNet-50 architecture and one with aResNeXt101_32x16d architecture.
BiT-M Six pre-trained Big Transfer models were obtained from pytorch-image-models[48], where they are called resnetv2_50x1_bitm, resnetv2_50x3_bitm, resnetv2_101x1_bitm,resnetv2_101x3_bitm, resnetv2_152x2_bitm and resnetv2_152x4_bitm.
Linear classifier training procedure. The PyContrast repository by Yonglong Tian contains aPytorch implementation of unsupervised representation learning methods, including pre-trainedrepresentation weights. The repository provides training and evaluation pipelines, but it supports onlymulti-node distributed training and does not (currently) provide weights for the classifier. We haveused the repository’s linear classifier evaluation pipeline to train classifiers for InsDis [38], MoCo[39], MoCoV2 [40], PIRL [41] and InfoMin [42] on ImageNet. Pre-trained weights of the modelrepresentations (without classifier) were taken from the provided Dropbox link and we then ran thetraining pipeline on a NVIDIA TESLA P100 using the default parameters configured in the pipeline.Detailed documentation about running the pipeline and parameters can be found in the PyContrastrepository (commit #3541b82).
B Error consistency predictions
Table 1: Error consistency across all five non-parametric datasets. Specifically, this comparisoncompares the influence of dataset vs. architecture (top) and the influence of flexibility vs. constraints(bottom). Results are described in Section B.
sketch stylized edge silhouette cue conflict
ResNet-50 vs. VGG-16 0.74 0.56 0.68 0.71 0.59ResNet-50 vs. ResNet-50 trained on Stylized-ImageNet 0.44 0.09 0.10 0.67 0.27
ResNet-50 vs. vision transformer (ViT-S) 0.67 0.43 0.41 0.68 0.48ResNet-50 vs. BagNet-9 0.31 0.17 0.32 0.14 0.44
In Section 4, we hypothesised that shortcut opportunities in the dataset may be a potential underlyingcause of high error consistency between models, since all sufficiently flexible models will pick up onthose same shortcuts. We then made two predictions which we test here.
Dataset vs. architecture. Prediction: error consistency between two identical models trained onvery different datasets, such as ImageNet vs. Stylized-ImageNet, is much lower than error consistencybetween very different models (ResNet-50 vs. VGG-16) trained on the same dataset. Observation:According to Table 1, this is indeed the case—training ResNet-50 on a different dataset, Stylized-ImageNet [17], leads to lower error consistency than comparing two ImageNet-trained CNNs withdifferent architecture. While this relationship is not perfect (e.g., the difference is small for silhouetteimages), we have confirmed that this is a general pattern not limited to the specific networks in thetable.
Flexibility vs. constraints. Prediction: error consistency between ResNet-50 and a highly flexiblemodel (e.g., a vision transformer) is much higher than error consistency between ResNet-50 and ahighly constrained model like BagNet-9 [79]. Observation: A vision transformer (ViT-S) indeedshows higher error consistency with ResNet-50 than with BagNet-9 (see Table 1). However, thisdifference is not large for one out of five datasets (cue conflict). One could imagine different reasonsfor this: perhaps BagNet-9 is still flexible enough to learn a decision rule close to the one of standardResNet-50 for cue conflict images; and of course there is also the possibility that the hypothesis iswrong. Further insights could be gained by testing successively more constrained versions of thesame base model.
17

C Experimental details regarding psychophysical experiments
C.1 Participant instructions and preparation
Participants were explained how to respond (via mouse click), instructed to respond as accurately aspossible, and to go with their best guess if unsure. In order to rule out any potential misunderstanding,participants were asked to name all 16 categories on the response screen. Prior to the experiment,visual acuity was measured with a Snellen chart to ensure normal or corrected to normal vision.Furthermore, four blocks of 80 practice trials each (320 practice trials in total) on undistorted colouror greyscale images were conducted (non-overlapping with experimental stimuli) to gain familiaritywith the task. During practice trials, but not experimental trials, visual and auditory feedback wasprovided: the correct category was highlighted and a “beep” sound was played for incorrect or missedtrials. The experiment itself consisted of blocks of 80 trials each, after each blocks participants werefree to take a break. In order to increase participant motivation, aggregated performance over the lastblock was displayed on the screen.
C.2 Participant risks
Our experiment was a standard perceptual experiment, for which no IRB approval was required. Thetask consisted of viewing corrupted images and clicking with a computer mouse. In order to limitparticipant risks related to a COVID-19 infection, we implemented the following measures: (1.) Theexperimenter was tested for corona twice per week. (2.) Prior to participation in our experiments,participants were explained that they could perform a (cost-free) corona test next to our building,and that if they choose to do so, we would pay them 10C/hour for the time spent doing the test andwaiting for the result (usually approx. 15–30min). (3.) Experimenter and participant adhered to astrict distance of at least 1.5m during the entire course of the experiment, including instructionsand practice trials. During the experiment itself, the participant was the only person in the room;the experimenter was seated in an adjacent room. (4.) Wearing a medical mask was mandatory forboth experimenter and participant. (5.) Participants were asked to disinfect their hands prior to theexperiment; additionally the desk, mouse etc. were disinfected after completion of an experiment.(6.) Participants were tested in a room where high-performance ventilation was installed; in order toensure that the ventilation was working as expected we performed a one-time safety check measuringCO2 parts-per-million before we decided to go ahead with the experiments.
C.3 Participant remuneration
Participants were paid 10C per hour or granted course credit. Additionally, an incentive bonus of upto 15C could be earned on top of the standard remuneration. This was meant to further motivate ourparticipants to achieve their optimal performance. The minimum performance for receiving a bonuswas set as 15% below the mean of the previous experiments accuracy. The bonus then was linearlycalculated with the maximal bonus being given from 15% above the previous experiments mean. Thetotal amount spent on participant compensation amounts to 647,50C.
C.4 Participant declaration of consent
Participants were asked to review and sign the following declaration of consent (of which theyreceived a copy):
Psychophysical studyYour task consists of viewing visual stimuli on a computer monitor and evaluating them by pressing akey. Participation in a complete experimental session is remunerated at 10 Euros/hour.Declaration of consentHerewith I agree to participate in a behavioural experiment to study visual perception. Myparticipation in the study is voluntary. I am informed that I can stop the experiment at any timeand without giving any reason without incurring any disadvantages. I know that I can contact theexperimenter at any time with questions about the research project.Declaration of consent for data processing and data publicationHerewith I agree that the experimental data obtained in the course of the experiment may be used insemianonymised form for scientific evaluation and publication. I agree that my personal data (e.g.
18

name, phone number, address) may be stored in digital form; they will not be used for any otherpurpose than for contacting me. This personal data will remain exclusively within the Wichmannlaband will not be passed on to third parties at any time.
D Licenses
Licenses for datasets, code and models are included in our code (see directory “licenses/”, file“LICENSES_OVERVIEW.md” of https://github.com/bethgelab/model-vs-human.
E Training with CLIP labels
0.0
0.1
0.2
0.3
0.4
0.5
0.6
0.7
0.8
OOD
accu
racy
ResN
et-5
0 (C
LIP
hard
labe
ls)
ResN
et-5
0 (Im
ageN
et la
bels)
ResN
et-5
0 (C
LIP
soft
labe
ls)
CLIP
: Res
Net-5
0 (4
00M
)
CLIP
: ViT
-B (4
00M
)
hum
ans
(a) OOD accuracy (higher = better).
0.00
0.02
0.04
0.06
0.08
0.10
0.12
0.14
accu
racy
diff
eren
ce
ResN
et-5
0 (Im
ageN
et la
bels)
ResN
et-5
0 (C
LIP
hard
labe
ls)
ResN
et-5
0 (C
LIP
soft
labe
ls)
CLIP
: Res
Net-5
0 (4
00M
)
CLIP
: ViT
-B (4
00M
)
hum
ans
(b) Accuracy difference (lower = better).
0.0
0.1
0.2
0.3
0.4
0.5
0.6
0.7
0.8
0.9
obse
rved
con
siste
ncy
ResN
et-5
0 (Im
ageN
et la
bels)
ResN
et-5
0 (C
LIP
hard
labe
ls)
ResN
et-5
0 (C
LIP
soft
labe
ls)
CLIP
: Res
Net-5
0 (4
00M
)
CLIP
: ViT
-B (4
00M
)
hum
ans
(c) Observed consistency (higher = better).0.0
0.1
0.2
0.3
0.4
0.5
erro
r con
siste
ncy
ResN
et-5
0 (Im
ageN
et la
bels)
ResN
et-5
0 (C
LIP
soft
labe
ls)
ResN
et-5
0 (C
LIP
hard
labe
ls)
CLIP
: Res
Net-5
0 (4
00M
)
CLIP
: ViT
-B (4
00M
)
hum
ans
(d) Error consistency (higher = better).
Figure 6: Aggregated results comparing models with and without CLIP-provided labels. Comparisonof standard ResNet-50 (light grey), CLIP with vision transformer backend (brown), CLIP withResNet-50 backend (brown), and standard ResNet-50 with hard labels (bright yellow) vs. soft labels(dark yellow) provided by evaluating standard CLIP on ImageNet; as well as humans (red diamonds)for comparison. Detailed performance across datasets in Figure 16.
As CLIP performed very well across metrics, we intended to obtain a better understanding for whythis might be the case. One hypothesis is that CLIP might just receive better labels: About 6% ofImageNet validation images are mis-labeled according to Northcutt et al. [74]. We therefore designedan experiment where we re-labeled the entire ImageNet training and validation dataset using CLIP pre-dictions as ground truth (https://github.com/kantharajucn/CLIP-imagenet-evaluation).Having re-labeled ImageNet, we then trained a standard ResNet-50 model from scratch on this datasetusing the standard PyTorch ImageNet training script. Training was performed on our on-premisecloud using four RTX 2080 Ti GPUs for five days. We ran the training pipeline in distributed modewith an nccl backed using the default parameters configured in the script, except for the numberof workers which we changed to 25. Cross-entropy loss was used to train two models, once withCLIP hard labels (the top-1 class predicted by CLIP) and once with CLIP soft labels (using CLIP’sfull posterior distribution as training target). The accuracies on the original ImageNet validationdataset of the resulting models ResNet50-CLIP-hard-labels and ResNet-50-CLIP-soft-labels are63.53 (top-1), 86.97 (top-5) and 64.63 (top-1), 88.60 (top-5) respectively. In order to make sure thatthe model trained on soft labels had indeed learned to approximate CLIP’s posterior distribution onImageNet, we calculated the KL divergence between CLIP soft labels and probability distributions
19

from ResNet-50 trained on the CLIP soft labels. The resulting value of 0.001 on both ImageNettraining and validation dataset is sufficiently small to conclude that the model had successfully learnedto approximate CLIP’s posterior distribution on ImageNet. The results are visualised in Figure 6. Theresults indicate that simply training a standard ResNet-50 model with labels provided by CLIP doesnot lead to strong improvements on any metric, which means that ImageNet label errors are unlikelyto hold standard models back in terms of OOD accuracy and consistency with human responses.
(a) Sketch (b) Stylized (c) Edge (d) Silhouette (e) Cue conflict
Figure 7: Exemplary stimuli (nonparametric image manipulations) for the following datasets: sketch(7 observers, 800 trials each), stylized (5 observers, 800 trials each), edge (10 observers, 160 trialseach), silhouette (10 observers, 160 trials each), and cue conflict (10 observers, 1280 trials each).Figures c–e reprinted from [32] with permission from the authors. [32] also analyzed “diagnostic”images, i.e. stimuli that most humans correctly classified (but few networks) and vice-versa.
Figure 8: Exemplary stimuli (parametric image manipulations). Manipulations are either binary (e.g.colour vs. grayscale) or they have a parameter (such as the degree of rotation, or the contrast level).Top row: colour vs. grayscale (4 observers, 1280 trials each), low contrast (4 observers, 1280 trialseach), high-pass (4 observers, 1280 trials each), low-pass/blurring (4 observers, 1280 trials each),phase noise (4 observers, 1120 trials each), true power spectrum vs. power equalisation (4 observers,1120 trials each). Bottom row: true vs. opponent colour (4 observers, 1120 trials each), rotation (4observers, 1280 trials each), Eidolon I (4 observers, 1280 trials each), Eidolon II (4 observers, 1280trials each), Eidolon III (4 observers, 1280 trials each, additive uniform noise (4 observers, 1280 trialseach). Figure adapted from [33] with permission from the authors.
F Supervised SimCLR baseline models
Figure 15 compares the noise generalisation performance self-supervised SimCLR models againstaugmentation-matched baseline models. The results indicate that the superior performance ofSimCLR in Figure 2 are largely a consequence of SimCLR’s data augmentation scheme, rather thana property of the self-supervised contrastive loss.
G Benchmark scores
Figure 1 in the main paper shows aggregated scores for the most robust model in terms of OODaccuracy (Figure 1a), and for the most human-like models in terms of accuracy, observed anderror consistency (Figures 1b, 1c, 1d). Numerically, these metrics are represented in two tables,
20

ranking the models according to out-of-distribution robustness (Table 3) and human-like behaviour(Table 2). Since the latter is represented by three different metrics (each characterising a distinctaspect), the mean rank across those three metrics is used to obtain a final ordering. The followingconditions and datasets influence benchmark scores: For the five nonparametric datasets, all datasetsare taken into account. For the twelve parametric datasets, we also take all datasets into account(overall, all 17 datasets are weighted equally); however, we exclude certain conditions for principledreasons. First of all, the easiest condition is always excluded since it does not test out-of-distributionbehaviour (e.g., for the contrast experiment, 100% contrast is more of a baseline condition ratherthan a condition of interest). Furthermore, we exclude all conditions for which human averageperformance is strictly smaller than 0.2, since e.g. comparisons against human error patterns arefutile if humans are randomly guessing since they cannot identify the stimuli anymore. For thesereasons, the following conditions are not taken into account when computing the benchmark scores.Colour vs. greyscale experiment: condition “colour”. True vs. false colour experiment: condition“true colour”. Uniform noise experiment: conditions 0.0, 0.6, 0.9. Low-pass experiment: conditions0, 15, 40. Contrast experiment: conditions 100, 3, 1. High-pass experiment: conditions inf, 0.55,0.45, 0.4. Eidolon I experiment: conditions 0, 6, 7. Phase noise experiment: conditions 0, 150, 180.Eidolon II experiment: conditions 0, 5, 6, 7. Power-equalisation experiment: condition “originalpower spectrum”. Eidolon III experiment: conditions 0, 4, 5, 6, 7. Rotation experiment: condition 0.
H Regression model
In order to quantify the influence of known independent variables (architecture: transformers vs.ConvNets; data: small (ImageNet) vs. large (“more” than standard ImageNet); objective: supervisedvs. self-supervised) on known dependent variables (OOD accuracy and error consistency withhumans), we performed a regression analysis using R version 3.6.3 (functions lm for fitting andanova for regression model comparison). We modelled the influence of those predictors on OODaccuracy, and on error consistency with human observers in two separate linear regression models(one per dependent variable). To this end, we used incremental model building, i.e. starting withone significant predictor and subsequently adding predictors if the reduction of degrees of freedomis justified by a significantly higher degree of explained variance (alpha level: .05). Both errorconsistency and accuracy, for our 52 models, followed (approximately) a normal distribution, asconfirmed by density and Q-Q-plots. That being said, the fit was better for error consistency than foraccuracy.
The final regression model for error consistency showed:
• a significant main effect for transformers over CNNs (p = 0.01936 *),• a significant main effect for large datasets over small datasets (p = 3.39e-05 ***),• a significant interaction between dataset size and objective function (p = 0.00625 **),• no significant main effect of objective function (p = 0.10062, n.s.)
Residual standard error: 0.02156 on 47 degrees of freedomMultiple R-squared: 0.5045, Adjusted R-squared: 0.4623F-statistic: 11.96 on 4 and 47 DF, p-value: 8.765e-07Significance codes: 0 ‘***’ 0.001 ‘**’ 0.01 ‘*’ 0.05
The final regression model for OOD accuracy showed:
• a significant main effect for large datasets over small datasets (p = 4.65e-09 ***),• a significant interaction between dataset size and architecture type (transformer vs. CNNs; p
= 0.0174 *),• no significant main effect for transformers vs. CNNs (p = 0.8553, n.s.)
Residual standard error: 0.0593 on 48 degrees of freedomMultiple R-squared: 0.5848, Adjusted R-squared: 0.5588F-statistic: 22.53 on 3 and 48 DF, p-value: 3.007e-09Significance codes: 0 ‘***’ 0.001 ‘**’ 0.01 ‘*’ 0.05
21

Limitations: a linear regression model can only capture linear effects; furthermore, diagnostic plotsshowed a better fit for the error consistency model (where residuals roughly followed the expecteddistribution as confirmed by a Q-Q-plot) than for the OOD accuracy model (where residuals were notperfectly normal distributed).
I Mapping behavioural decisions
Comparing model and human classification decisions comes with a challenge: we simply cannot askhuman observers to classify objects into 1,000 classes (as for standard ImageNet models). Even if thiswere feasible in terms of experimental time constraints, most humans don’t routinely know the namesof a hundred different dog breeds. What they do know, however, is how to tell dogs apart from catsand from airplanes, chairs and boats. Those are so-called “basic” or “entry-level” categories [98]. Inline with previous work [17, 32, 33], we therefore used a set of 16 basic categories in our experiments.For ImageNet-trained models, to obtain a choice from the same 16 categories, the 1,000 class decisionvector was mapped to those 16 classes using the WordNet hierarchy [34]. Those 16 categories werechosen to reflect a large chunk of ImageNet (227 classes, i.e. roughly a quarter of all ImageNetcategories is represented by those 16 basic categories). In order to obtain classification decisions fromImageNet-trained models for those 16 categories, at least two choices are conceivable: re-trainingthe final classification layer or using a principled mapping. Since any training involves making anumber of choices (hyperparameters, optimizer, dataset, ...) that may potentially influence and inthe worst case even bias the results (e.g. for ShuffleNet, more than half of the model’s parametersare contained in the final classification layer!), we decided against training and for a principledmapping by calculating the probability of a coarse class as the average of the probabilities of thecorresponding fine-grained classes. Why is this mapping principled? As derived by [33] (pages 22and 23 in the Appendix of the arXiv version, https://arxiv.org/pdf/1808.08750.pdf), this isthe optimal way to map (i.e. aggregate) probabilities from many fine-grained classes to a few coarseclasses. Essentially, the aggregation can be derived by calculating the posterior distribution of adiscriminatively trained CNN under a new prior chosen at test time (here: 1/16 over coarse classes).
22

Table 2: Benchmark table of model results. The three metrics “accuracy difference” “observedconsistency” and “error consistency” (plotted in Figure 1) each produce a different model ranking.The mean rank of a model across those three metrics is used to rank the models on our benchmark.
model accuracy diff. ↓ obs. consistency ↑ error consistency ↑ mean rank ↓CLIP: ViT-B (400M) 0.023 0.758 0.281 1.333SWSL: ResNeXt-101 (940M) 0.028 0.752 0.237 4.000BiT-M: ResNet-101x1 (14M) 0.034 0.733 0.252 4.333BiT-M: ResNet-152x2 (14M) 0.035 0.737 0.243 5.000ViT-L 0.033 0.738 0.222 6.667BiT-M: ResNet-152x4 (14M) 0.035 0.732 0.233 7.667BiT-M: ResNet-50x3 (14M) 0.040 0.726 0.228 9.333BiT-M: ResNet-50x1 (14M) 0.042 0.718 0.240 9.667ViT-L (14M) 0.035 0.744 0.206 9.667SWSL: ResNet-50 (940M) 0.041 0.727 0.211 11.667ViT-B 0.044 0.719 0.223 12.000BiT-M: ResNet-101x3 (14M) 0.040 0.720 0.204 14.333densenet201 0.060 0.695 0.212 15.000ViT-B (14M) 0.049 0.717 0.209 15.000ViT-S 0.066 0.684 0.216 16.667densenet169 0.065 0.688 0.207 17.333inception_v3 0.066 0.677 0.211 17.667Noisy Student: ENetL2 (300M) 0.040 0.764 0.169 18.000ResNet-50 L2 eps 1.0 0.079 0.669 0.224 21.000ResNet-50 L2 eps 3.0 0.079 0.663 0.239 22.000wide_resnet101_2 0.068 0.676 0.187 24.333SimCLR: ResNet-50x4 0.071 0.698 0.179 24.667SimCLR: ResNet-50x2 0.073 0.686 0.180 25.333ResNet-50 L2 eps 0.5 0.078 0.668 0.203 25.333densenet121 0.077 0.671 0.200 25.333resnet101 0.074 0.671 0.192 25.667resnet152 0.077 0.675 0.190 25.667resnext101_32x8d 0.074 0.674 0.182 26.667ResNet-50 L2 eps 5.0 0.087 0.649 0.240 27.000resnet50 0.087 0.665 0.208 28.667resnet34 0.084 0.662 0.205 29.333vgg19_bn 0.081 0.660 0.200 30.000resnext50_32x4d 0.079 0.666 0.184 30.333SimCLR: ResNet-50x1 0.080 0.667 0.179 32.000resnet18 0.091 0.648 0.201 34.667vgg16_bn 0.088 0.651 0.198 34.667wide_resnet50_2 0.084 0.663 0.176 35.667MoCoV2: ResNet-50 0.083 0.660 0.177 36.000mobilenet_v2 0.092 0.645 0.196 37.000ResNet-50 L2 eps 0.0 0.086 0.654 0.178 37.333mnasnet1_0 0.092 0.646 0.189 38.333vgg11_bn 0.106 0.635 0.193 38.667InfoMin: ResNet-50 0.086 0.659 0.168 39.333vgg13_bn 0.101 0.631 0.180 41.000mnasnet0_5 0.110 0.617 0.173 45.000MoCo: ResNet-50 0.107 0.617 0.149 47.000alexnet 0.118 0.597 0.165 47.333squeezenet1_1 0.131 0.593 0.175 47.667PIRL: ResNet-50 0.119 0.607 0.141 48.667shufflenet_v2_x0_5 0.126 0.592 0.160 49.333InsDis: ResNet-50 0.131 0.593 0.138 50.667squeezenet1_0 0.145 0.574 0.153 51.000
23

Table 3: Benchmark table of model results (accuracy).model OOD accuracy ↑ rank ↓Noisy Student: ENetL2 (300M) 0.829 1.000ViT-L (14M) 0.733 2.000CLIP: ViT-B (400M) 0.708 3.000ViT-L 0.706 4.000SWSL: ResNeXt-101 (940M) 0.698 5.000BiT-M: ResNet-152x2 (14M) 0.694 6.000BiT-M: ResNet-152x4 (14M) 0.688 7.000BiT-M: ResNet-101x3 (14M) 0.682 8.000BiT-M: ResNet-50x3 (14M) 0.679 9.000SimCLR: ResNet-50x4 0.677 10.000SWSL: ResNet-50 (940M) 0.677 11.000BiT-M: ResNet-101x1 (14M) 0.672 12.000ViT-B (14M) 0.669 13.000ViT-B 0.658 14.000BiT-M: ResNet-50x1 (14M) 0.654 15.000SimCLR: ResNet-50x2 0.644 16.000densenet201 0.621 17.000densenet169 0.613 18.000SimCLR: ResNet-50x1 0.596 19.000resnext101_32x8d 0.594 20.000resnet152 0.584 21.000wide_resnet101_2 0.583 22.000resnet101 0.583 23.000ViT-S 0.579 24.000densenet121 0.576 25.000MoCoV2: ResNet-50 0.571 26.000inception_v3 0.571 27.000InfoMin: ResNet-50 0.571 28.000resnext50_32x4d 0.569 29.000wide_resnet50_2 0.566 30.000resnet50 0.559 31.000resnet34 0.553 32.000ResNet-50 L2 eps 0.5 0.551 33.000ResNet-50 L2 eps 1.0 0.547 34.000vgg19_bn 0.546 35.000ResNet-50 L2 eps 0.0 0.545 36.000ResNet-50 L2 eps 3.0 0.530 37.000vgg16_bn 0.530 38.000mnasnet1_0 0.524 39.000resnet18 0.521 40.000mobilenet_v2 0.520 41.000MoCo: ResNet-50 0.502 42.000ResNet-50 L2 eps 5.0 0.501 43.000vgg13_bn 0.499 44.000vgg11_bn 0.498 45.000PIRL: ResNet-50 0.489 46.000mnasnet0_5 0.472 47.000InsDis: ResNet-50 0.468 48.000shufflenet_v2_x0_5 0.440 49.000alexnet 0.434 50.000squeezenet1_1 0.425 51.000squeezenet1_0 0.401 52.000
24

Accuracy
colour greyscaleColour
0.0
0.2
0.4
0.6
0.8
1.0
Clas
sifica
tion
accu
racy
(a) Colour vs. greyscale
Error consistency
colour greyscaleColour
0.2
0.0
0.2
0.4
0.6
0.8
1.0
Erro
r con
siste
ncy
(kap
pa)
Accuracy
true opponentColour
0.0
0.2
0.4
0.6
0.8
1.0
Clas
sifica
tion
accu
racy
(b) True vs. false colour
Error consistency
true opponentColour
0.2
0.0
0.2
0.4
0.6
0.8
1.0
Erro
r con
siste
ncy
(kap
pa)
0.0 .03 .05 .1 .2 .35 .6 .9Uniform noise width
0.0
0.2
0.4
0.6
0.8
1.0
Clas
sifica
tion
accu
racy
(c) Uniform noise
0.0 .03 .05 .1 .2 .35 .6 .9Uniform noise width
0.2
0.0
0.2
0.4
0.6
0.8
1.0
Erro
r con
siste
ncy
(kap
pa)
0 1 3 5 7 10 15 40Filter standard deviation
0.0
0.2
0.4
0.6
0.8
1.0
Clas
sifica
tion
accu
racy
(d) Low-pass
0 1 3 5 7 10 15 40Filter standard deviation
0.2
0.0
0.2
0.4
0.6
0.8
1.0
Erro
r con
siste
ncy
(kap
pa)
100 50 30 15 10 5 3 1Contrast in percent
0.0
0.2
0.4
0.6
0.8
1.0
Clas
sifica
tion
accu
racy
(e) Contrast
100 50 30 15 10 5 3 1Contrast in percent
0.2
0.0
0.2
0.4
0.6
0.8
1.0
Erro
r con
siste
ncy
(kap
pa)
inf 3.0 1.5 1.0 .7 .55 .45 .4Filter standard deviation
0.0
0.2
0.4
0.6
0.8
1.0
Clas
sifica
tion
accu
racy
(f) High-pass
inf 3.0 1.5 1.0 .7 .55 .45 .4Filter standard deviation
0.2
0.0
0.2
0.4
0.6
0.8
1.0
Erro
r con
siste
ncy
(kap
pa)
0 1 2 3 4 5 6 7Log2 of 'reach' parameter
0.0
0.2
0.4
0.6
0.8
1.0
Clas
sifica
tion
accu
racy
(g) Eidolon I
0 1 2 3 4 5 6 7Log2 of 'reach' parameter
0.2
0.0
0.2
0.4
0.6
0.8
1.0
Erro
r con
siste
ncy
(kap
pa)
0 30 60 90 120 150 180Phase noise width [ ]
0.0
0.2
0.4
0.6
0.8
1.0
Clas
sifica
tion
accu
racy
(h) Phase noise
0 30 60 90 120 150 180Phase noise width [ ]
0.2
0.0
0.2
0.4
0.6
0.8
1.0
Erro
r con
siste
ncy
(kap
pa)
0 1 2 3 4 5 6 7Log2 of 'reach' parameter
0.0
0.2
0.4
0.6
0.8
1.0
Clas
sifica
tion
accu
racy
(i) Eidolon II
0 1 2 3 4 5 6 7Log2 of 'reach' parameter
0.2
0.0
0.2
0.4
0.6
0.8
1.0
Erro
r con
siste
ncy
(kap
pa)
original equalisedPower spectrum
0.0
0.2
0.4
0.6
0.8
1.0
Clas
sifica
tion
accu
racy
(j) Power equalisation
original equalisedPower spectrum
0.2
0.0
0.2
0.4
0.6
0.8
1.0
Erro
r con
siste
ncy
(kap
pa)
0 1 2 3 4 5 6 7Log2 of 'reach' parameter
0.0
0.2
0.4
0.6
0.8
1.0
Clas
sifica
tion
accu
racy
(k) Eidolon III
0 1 2 3 4 5 6 7Log2 of 'reach' parameter
0.2
0.0
0.2
0.4
0.6
0.8
1.0
Erro
r con
siste
ncy
(kap
pa)
0 90 180 270Rotation angle [ ]
0.0
0.2
0.4
0.6
0.8
1.0
Clas
sifica
tion
accu
racy
(l) Rotation
0 90 180 270Rotation angle [ ]
0.2
0.0
0.2
0.4
0.6
0.8
1.0
Erro
r con
siste
ncy
(kap
pa)
Figure 9: OOD generalisation and error consistency results for humans, standard supervised CNNs,self-supervised models, adversarially trained models, vision transformers, noisy student, BiT, SWSL,CLIP. Symbols indicate architecture type (# convolutional, O vision transformer, ♦ human); bestviewed on screen. ‘Accuracy’ measures recognition performance (higher is better), ‘error consistency’how closely image-level errors are aligned with humans. Accuracy results are identical to Figure 2 inthe main paper. In many cases, human-to-human error consistency increases for moderate distortionlevels and drops afterwards.
25

subj
ect-0
1su
bjec
t-02
subj
ect-0
4su
bjec
t-06
subj
ect-0
7su
bjec
t-05
subj
ect-0
3CL
IP: V
iT-B
(400
M)
SWSL
: Res
NeXt
-101
(940
M)
SWSL
: Res
Net-5
0 (9
40M
)Bi
T-M
: Res
Net-1
01x3
(14M
)Vi
T-L
ViT-
L (1
4M)
BiT-
M: R
esNe
t-152
x2 (1
4M)
Noisy
Stu
dent
: ENe
tL2
(300
M)
BiT-
M: R
esNe
t-152
x4 (1
4M)
ViT-
BBi
T-M
: Res
Net-1
01x1
(14M
)Vi
T-B
(14M
)Bi
T-M
: Res
Net-5
0x3
(14M
)Bi
T-M
: Res
Net-5
0x1
(14M
)wi
de_r
esne
t101
_2wi
de_r
esne
t50_
2Re
sNet
-50
L2 e
ps 1
.0re
snet
152
ResN
et-5
0 L2
eps
3.0
resn
ext1
01_3
2x8d
ResN
et-5
0 L2
eps
5.0
resn
et34
ViT-
Sde
nsen
et20
1in
cept
ion_
v3Si
mCL
R: R
esNe
t-50x
4re
snet
18de
nsen
et12
1vg
g19_
bnSi
mCL
R: R
esNe
t-50x
2Re
sNet
-50
L2 e
ps 0
.5de
nsen
et16
9Re
sNet
-50
L2 e
ps 0
.0re
snet
50re
snet
101
MoC
oV2:
Res
Net-5
0m
obile
net_
v2Si
mCL
R: R
esNe
t-50x
1vg
g16_
bnre
snex
t50_
32x4
dvg
g13_
bnm
nasn
et1_
0vg
g11_
bnal
exne
tm
nasn
et0_
5sh
uffle
net_
v2_x
0_5
Info
Min
: Res
Net-5
0sq
ueez
enet
1_0
sque
ezen
et1_
1M
oCo:
Res
Net-5
0In
sDis:
Res
Net-5
0PI
RL: R
esNe
t-50
subject-01subject-02subject-04subject-06subject-07subject-05subject-03
CLIP: ViT-B (400M)SWSL: ResNeXt-101 (940M)
SWSL: ResNet-50 (940M)BiT-M: ResNet-101x3 (14M)
ViT-LViT-L (14M)
BiT-M: ResNet-152x2 (14M)Noisy Student: ENetL2 (300M)
BiT-M: ResNet-152x4 (14M)ViT-B
BiT-M: ResNet-101x1 (14M)ViT-B (14M)
BiT-M: ResNet-50x3 (14M)BiT-M: ResNet-50x1 (14M)
wide_resnet101_2wide_resnet50_2
ResNet-50 L2 eps 1.0resnet152
ResNet-50 L2 eps 3.0resnext101_32x8d
ResNet-50 L2 eps 5.0resnet34
ViT-Sdensenet201inception_v3
SimCLR: ResNet-50x4resnet18
densenet121vgg19_bn
SimCLR: ResNet-50x2ResNet-50 L2 eps 0.5
densenet169ResNet-50 L2 eps 0.0
resnet50resnet101
MoCoV2: ResNet-50mobilenet_v2
SimCLR: ResNet-50x1vgg16_bn
resnext50_32x4dvgg13_bn
mnasnet1_0vgg11_bn
alexnetmnasnet0_5
shufflenet_v2_x0_5InfoMin: ResNet-50
squeezenet1_0squeezenet1_1
MoCo: ResNet-50InsDis: ResNet-50
PIRL: ResNet-50
0.2
0.4
0.6
0.8
1.0
Figure 10: Error consistency for ‘sketch’ images (same as Figure 4 but sorted w.r.t. mean errorconsistency with humans).
subj
ect-0
4su
bjec
t-05
subj
ect-0
1su
bjec
t-02
subj
ect-0
3Vi
T-L
(14M
)CL
IP: V
iT-B
(400
M)
BiT-
M: R
esNe
t-50x
3 (1
4M)
BiT-
M: R
esNe
t-152
x4 (1
4M)
ResN
et-5
0 L2
eps
5.0
SWSL
: Res
NeXt
-101
(940
M)
Sim
CLR:
Res
Net-5
0x2
BiT-
M: R
esNe
t-152
x2 (1
4M)
ViT-
LSi
mCL
R: R
esNe
t-50x
4in
cept
ion_
v3SW
SL: R
esNe
t-50
(940
M)
BiT-
M: R
esNe
t-101
x1 (1
4M)
Noisy
Stu
dent
: ENe
tL2
(300
M)
BiT-
M: R
esNe
t-50x
1 (1
4M)
ResN
et-5
0 L2
eps
3.0
ResN
et-5
0 L2
eps
0.5
ViT-
B (1
4M)
dens
enet
201
ResN
et-5
0 L2
eps
1.0
ViT-
Sre
snet
101
ViT-
BBi
T-M
: Res
Net-1
01x3
(14M
)re
snet
34M
oCoV
2: R
esNe
t-50
mna
snet
0_5
resn
et15
2re
snex
t50_
32x4
dSi
mCL
R: R
esNe
t-50x
1re
snex
t101
_32x
8dde
nsen
et16
9re
snet
50re
snet
18sq
ueez
enet
1_1
dens
enet
121
Info
Min
: Res
Net-5
0wi
de_r
esne
t101
_2sh
uffle
net_
v2_x
0_5
wide
_res
net5
0_2
ResN
et-5
0 L2
eps
0.0
vgg1
1_bn
mob
ilene
t_v2
MoC
o: R
esNe
t-50
mna
snet
1_0
alex
net
vgg1
6_bn
InsD
is: R
esNe
t-50
vgg1
9_bn
sque
ezen
et1_
0vg
g13_
bnPI
RL: R
esNe
t-50
subject-04subject-05subject-01subject-02subject-03
ViT-L (14M)CLIP: ViT-B (400M)
BiT-M: ResNet-50x3 (14M)BiT-M: ResNet-152x4 (14M)
ResNet-50 L2 eps 5.0SWSL: ResNeXt-101 (940M)
SimCLR: ResNet-50x2BiT-M: ResNet-152x2 (14M)
ViT-LSimCLR: ResNet-50x4
inception_v3SWSL: ResNet-50 (940M)
BiT-M: ResNet-101x1 (14M)Noisy Student: ENetL2 (300M)
BiT-M: ResNet-50x1 (14M)ResNet-50 L2 eps 3.0ResNet-50 L2 eps 0.5
ViT-B (14M)densenet201
ResNet-50 L2 eps 1.0ViT-S
resnet101ViT-B
BiT-M: ResNet-101x3 (14M)resnet34
MoCoV2: ResNet-50mnasnet0_5
resnet152resnext50_32x4d
SimCLR: ResNet-50x1resnext101_32x8d
densenet169resnet50resnet18
squeezenet1_1densenet121
InfoMin: ResNet-50wide_resnet101_2
shufflenet_v2_x0_5wide_resnet50_2
ResNet-50 L2 eps 0.0vgg11_bn
mobilenet_v2MoCo: ResNet-50
mnasnet1_0alexnet
vgg16_bnInsDis: ResNet-50
vgg19_bnsqueezenet1_0
vgg13_bnPIRL: ResNet-50
0.2
0.3
0.4
0.5
0.6
0.7
0.8
0.9
1.0
Figure 11: Error consistency for ‘stylized’ images (sorted w.r.t. mean error consistency with humans).
26

subj
ect-0
4su
bjec
t-02
subj
ect-0
3su
bjec
t-05
subj
ect-0
6su
bjec
t-08
subj
ect-1
0su
bjec
t-07
subj
ect-0
1CL
IP: V
iT-B
(400
M)
subj
ect-0
9SW
SL: R
esNe
Xt-1
01 (9
40M
)SW
SL: R
esNe
t-50
(940
M)
BiT-
M: R
esNe
t-152
x2 (1
4M)
BiT-
M: R
esNe
t-101
x1 (1
4M)
Noisy
Stu
dent
: ENe
tL2
(300
M)
BiT-
M: R
esNe
t-152
x4 (1
4M)
BiT-
M: R
esNe
t-50x
3 (1
4M)
ViT-
BVi
T-L
(14M
)Vi
T-B
(14M
)Vi
T-L
ViT-
SBi
T-M
: Res
Net-5
0x1
(14M
)al
exne
tde
nsen
et20
1Re
sNet
-50
L2 e
ps 5
.0Si
mCL
R: R
esNe
t-50x
4in
cept
ion_
v3Re
sNet
-50
L2 e
ps 3
.0de
nsen
et12
1Si
mCL
R: R
esNe
t-50x
2In
foM
in: R
esNe
t-50
vgg1
9_bn
ResN
et-5
0 L2
eps
0.0
ResN
et-5
0 L2
eps
0.5
BiT-
M: R
esNe
t-101
x3 (1
4M)
dens
enet
169
mna
snet
0_5
mob
ilene
t_v2
resn
et18
resn
et10
1Si
mCL
R: R
esNe
t-50x
1re
snex
t50_
32x4
dM
oCo:
Res
Net-5
0Re
sNet
-50
L2 e
ps 1
.0re
snet
152
resn
ext1
01_3
2x8d
mna
snet
1_0
vgg1
6_bn
MoC
oV2:
Res
Net-5
0sq
ueez
enet
1_1
vgg1
1_bn
resn
et34
sque
ezen
et1_
0PI
RL: R
esNe
t-50
resn
et50
wide
_res
net5
0_2
shuf
flene
t_v2
_x0_
5In
sDis:
Res
Net-5
0vg
g13_
bnwi
de_r
esne
t101
_2
subject-04subject-02subject-03subject-05subject-06subject-08subject-10subject-07subject-01
CLIP: ViT-B (400M)subject-09
SWSL: ResNeXt-101 (940M)SWSL: ResNet-50 (940M)
BiT-M: ResNet-152x2 (14M)BiT-M: ResNet-101x1 (14M)
Noisy Student: ENetL2 (300M)BiT-M: ResNet-152x4 (14M)
BiT-M: ResNet-50x3 (14M)ViT-B
ViT-L (14M)ViT-B (14M)
ViT-LViT-S
BiT-M: ResNet-50x1 (14M)alexnet
densenet201ResNet-50 L2 eps 5.0SimCLR: ResNet-50x4
inception_v3ResNet-50 L2 eps 3.0
densenet121SimCLR: ResNet-50x2
InfoMin: ResNet-50vgg19_bn
ResNet-50 L2 eps 0.0ResNet-50 L2 eps 0.5
BiT-M: ResNet-101x3 (14M)densenet169mnasnet0_5
mobilenet_v2resnet18
resnet101SimCLR: ResNet-50x1
resnext50_32x4dMoCo: ResNet-50
ResNet-50 L2 eps 1.0resnet152
resnext101_32x8dmnasnet1_0
vgg16_bnMoCoV2: ResNet-50
squeezenet1_1vgg11_bnresnet34
squeezenet1_0PIRL: ResNet-50
resnet50wide_resnet50_2
shufflenet_v2_x0_5InsDis: ResNet-50
vgg13_bnwide_resnet101_2
0.0
0.2
0.4
0.6
0.8
1.0
Figure 12: Error consistency for ‘edge’ images (sorted w.r.t. mean error consistency with humans).
subj
ect-0
7su
bjec
t-04
subj
ect-0
9su
bjec
t-05
subj
ect-0
3su
bjec
t-06
subj
ect-0
1SW
SL: R
esNe
Xt-1
01 (9
40M
)su
bjec
t-02
CLIP
: ViT
-B (4
00M
)No
isy S
tude
nt: E
NetL
2 (3
00M
)Vi
T-L
SWSL
: Res
Net-5
0 (9
40M
)Vi
T-B
(14M
)Bi
T-M
: Res
Net-5
0x3
(14M
)Vi
T-L
(14M
)Re
sNet
-50
L2 e
ps 1
.0Vi
T-B
ResN
et-5
0 L2
eps
5.0
ResN
et-5
0 L2
eps
3.0
subj
ect-1
0re
snet
50Bi
T-M
: Res
Net-1
52x4
(14M
)Bi
T-M
: Res
Net-5
0x1
(14M
)Re
sNet
-50
L2 e
ps 0
.5Bi
T-M
: Res
Net-1
52x2
(14M
)su
bjec
t-08
dens
enet
201
BiT-
M: R
esNe
t-101
x1 (1
4M)
resn
ext1
01_3
2x8d
ince
ptio
n_v3
ViT-
SSi
mCL
R: R
esNe
t-50x
4m
nasn
et1_
0re
snet
152
resn
ext5
0_32
x4d
Sim
CLR:
Res
Net-5
0x2
dens
enet
169
ResN
et-5
0 L2
eps
0.0
BiT-
M: R
esNe
t-101
x3 (1
4M)
wide
_res
net1
01_2
mob
ilene
t_v2
resn
et34
resn
et10
1wi
de_r
esne
t50_
2al
exne
tvg
g19_
bnSi
mCL
R: R
esNe
t-50x
1re
snet
18vg
g16_
bnM
oCoV
2: R
esNe
t-50
dens
enet
121
vgg1
1_bn
mna
snet
0_5
Info
Min
: Res
Net-5
0vg
g13_
bnsh
uffle
net_
v2_x
0_5
sque
ezen
et1_
1sq
ueez
enet
1_0
PIRL
: Res
Net-5
0M
oCo:
Res
Net-5
0In
sDis:
Res
Net-5
0
subject-07subject-04subject-09subject-05subject-03subject-06subject-01
SWSL: ResNeXt-101 (940M)subject-02
CLIP: ViT-B (400M)Noisy Student: ENetL2 (300M)
ViT-LSWSL: ResNet-50 (940M)
ViT-B (14M)BiT-M: ResNet-50x3 (14M)
ViT-L (14M)ResNet-50 L2 eps 1.0
ViT-BResNet-50 L2 eps 5.0ResNet-50 L2 eps 3.0
subject-10resnet50
BiT-M: ResNet-152x4 (14M)BiT-M: ResNet-50x1 (14M)
ResNet-50 L2 eps 0.5BiT-M: ResNet-152x2 (14M)
subject-08densenet201
BiT-M: ResNet-101x1 (14M)resnext101_32x8d
inception_v3ViT-S
SimCLR: ResNet-50x4mnasnet1_0
resnet152resnext50_32x4d
SimCLR: ResNet-50x2densenet169
ResNet-50 L2 eps 0.0BiT-M: ResNet-101x3 (14M)
wide_resnet101_2mobilenet_v2
resnet34resnet101
wide_resnet50_2alexnet
vgg19_bnSimCLR: ResNet-50x1
resnet18vgg16_bn
MoCoV2: ResNet-50densenet121
vgg11_bnmnasnet0_5
InfoMin: ResNet-50vgg13_bn
shufflenet_v2_x0_5squeezenet1_1squeezenet1_0
PIRL: ResNet-50MoCo: ResNet-50InsDis: ResNet-50
0.2
0.4
0.6
0.8
1.0
Figure 13: Error consistency for ‘silhouette’ images (sorted w.r.t. mean error consistency withhumans).
27

subj
ect-0
2su
bjec
t-08
subj
ect-0
3su
bjec
t-10
subj
ect-0
5su
bjec
t-07
subj
ect-0
6su
bjec
t-04
subj
ect-0
9su
bjec
t-01
Noisy
Stu
dent
: ENe
tL2
(300
M)
CLIP
: ViT
-B (4
00M
)Re
sNet
-50
L2 e
ps 5
.0Re
sNet
-50
L2 e
ps 3
.0Vi
T-L
SWSL
: Res
NeXt
-101
(940
M)
BiT-
M: R
esNe
t-152
x4 (1
4M)
ViT-
BRe
sNet
-50
L2 e
ps 1
.0Vi
T-L
(14M
)Bi
T-M
: Res
Net-1
52x2
(14M
)Bi
T-M
: Res
Net-1
01x1
(14M
)Bi
T-M
: Res
Net-5
0x3
(14M
)Bi
T-M
: Res
Net-1
01x3
(14M
)Bi
T-M
: Res
Net-5
0x1
(14M
)in
cept
ion_
v3Si
mCL
R: R
esNe
t-50x
2Re
sNet
-50
L2 e
ps 0
.5Vi
T-B
(14M
)Si
mCL
R: R
esNe
t-50x
4Vi
T-S
Sim
CLR:
Res
Net-5
0x1
MoC
oV2:
Res
Net-5
0SW
SL: R
esNe
t-50
(940
M)
dens
enet
201
alex
net
resn
et18
resn
et34
resn
et15
2re
snet
101
dens
enet
169
dens
enet
121
resn
ext1
01_3
2x8d
wide
_res
net1
01_2
resn
et50
mna
snet
1_0
mna
snet
0_5
shuf
flene
t_v2
_x0_
5re
snex
t50_
32x4
dIn
foM
in: R
esNe
t-50
sque
ezen
et1_
1Re
sNet
-50
L2 e
ps 0
.0wi
de_r
esne
t50_
2m
obile
net_
v2M
oCo:
Res
Net-5
0In
sDis:
Res
Net-5
0sq
ueez
enet
1_0
vgg1
9_bn
PIRL
: Res
Net-5
0vg
g16_
bnvg
g11_
bnvg
g13_
bn
subject-02subject-08subject-03subject-10subject-05subject-07subject-06subject-04subject-09subject-01
Noisy Student: ENetL2 (300M)CLIP: ViT-B (400M)
ResNet-50 L2 eps 5.0ResNet-50 L2 eps 3.0
ViT-LSWSL: ResNeXt-101 (940M)BiT-M: ResNet-152x4 (14M)
ViT-BResNet-50 L2 eps 1.0
ViT-L (14M)BiT-M: ResNet-152x2 (14M)BiT-M: ResNet-101x1 (14M)
BiT-M: ResNet-50x3 (14M)BiT-M: ResNet-101x3 (14M)
BiT-M: ResNet-50x1 (14M)inception_v3
SimCLR: ResNet-50x2ResNet-50 L2 eps 0.5
ViT-B (14M)SimCLR: ResNet-50x4
ViT-SSimCLR: ResNet-50x1
MoCoV2: ResNet-50SWSL: ResNet-50 (940M)
densenet201alexnet
resnet18resnet34
resnet152resnet101
densenet169densenet121
resnext101_32x8dwide_resnet101_2
resnet50mnasnet1_0mnasnet0_5
shufflenet_v2_x0_5resnext50_32x4d
InfoMin: ResNet-50squeezenet1_1
ResNet-50 L2 eps 0.0wide_resnet50_2
mobilenet_v2MoCo: ResNet-50InsDis: ResNet-50
squeezenet1_0vgg19_bn
PIRL: ResNet-50vgg16_bnvgg11_bnvgg13_bn
0.2
0.4
0.6
0.8
1.0
Figure 14: Error consistency for ‘cue conflict’ images (sorted w.r.t. mean error consistency withhumans).
28

Accuracy
colour greyscaleColour
0.0
0.2
0.4
0.6
0.8
1.0
Clas
sifica
tion
accu
racy
(a) Colour vs. greyscale
Error consistency
colour greyscaleColour
0.2
0.0
0.2
0.4
0.6
0.8
1.0
Erro
r con
siste
ncy
(kap
pa)
Accuracy
true opponentColour
0.0
0.2
0.4
0.6
0.8
1.0
Clas
sifica
tion
accu
racy
(b) True vs. false colour
Error consistency
true opponentColour
0.2
0.0
0.2
0.4
0.6
0.8
1.0
Erro
r con
siste
ncy
(kap
pa)
0.0 .03 .05 .1 .2 .35 .6 .9Uniform noise width
0.0
0.2
0.4
0.6
0.8
1.0
Clas
sifica
tion
accu
racy
(c) Uniform noise
0.0 .03 .05 .1 .2 .35 .6 .9Uniform noise width
0.2
0.0
0.2
0.4
0.6
0.8
1.0
Erro
r con
siste
ncy
(kap
pa)
0 1 3 5 7 10 15 40Filter standard deviation
0.0
0.2
0.4
0.6
0.8
1.0
Clas
sifica
tion
accu
racy
(d) Low-pass
0 1 3 5 7 10 15 40Filter standard deviation
0.2
0.0
0.2
0.4
0.6
0.8
1.0
Erro
r con
siste
ncy
(kap
pa)
100 50 30 15 10 5 3 1Contrast in percent
0.0
0.2
0.4
0.6
0.8
1.0
Clas
sifica
tion
accu
racy
(e) Contrast
100 50 30 15 10 5 3 1Contrast in percent
0.2
0.0
0.2
0.4
0.6
0.8
1.0
Erro
r con
siste
ncy
(kap
pa)
inf 3.0 1.5 1.0 .7 .55 .45 .4Filter standard deviation
0.0
0.2
0.4
0.6
0.8
1.0
Clas
sifica
tion
accu
racy
(f) High-pass
inf 3.0 1.5 1.0 .7 .55 .45 .4Filter standard deviation
0.2
0.0
0.2
0.4
0.6
0.8
1.0
Erro
r con
siste
ncy
(kap
pa)
0 1 2 3 4 5 6 7Log2 of 'reach' parameter
0.0
0.2
0.4
0.6
0.8
1.0
Clas
sifica
tion
accu
racy
(g) Eidolon I
0 1 2 3 4 5 6 7Log2 of 'reach' parameter
0.2
0.0
0.2
0.4
0.6
0.8
1.0
Erro
r con
siste
ncy
(kap
pa)
0 30 60 90 120 150 180Phase noise width [ ]
0.0
0.2
0.4
0.6
0.8
1.0
Clas
sifica
tion
accu
racy
(h) Phase noise
0 30 60 90 120 150 180Phase noise width [ ]
0.2
0.0
0.2
0.4
0.6
0.8
1.0
Erro
r con
siste
ncy
(kap
pa)
0 1 2 3 4 5 6 7Log2 of 'reach' parameter
0.0
0.2
0.4
0.6
0.8
1.0
Clas
sifica
tion
accu
racy
(i) Eidolon II
0 1 2 3 4 5 6 7Log2 of 'reach' parameter
0.2
0.0
0.2
0.4
0.6
0.8
1.0
Erro
r con
siste
ncy
(kap
pa)
original equalisedPower spectrum
0.0
0.2
0.4
0.6
0.8
1.0
Clas
sifica
tion
accu
racy
(j) Power equalisation
original equalisedPower spectrum
0.2
0.0
0.2
0.4
0.6
0.8
1.0
Erro
r con
siste
ncy
(kap
pa)
0 1 2 3 4 5 6 7Log2 of 'reach' parameter
0.0
0.2
0.4
0.6
0.8
1.0
Clas
sifica
tion
accu
racy
(k) Eidolon III
0 1 2 3 4 5 6 7Log2 of 'reach' parameter
0.2
0.0
0.2
0.4
0.6
0.8
1.0
Erro
r con
siste
ncy
(kap
pa)
0 90 180 270Rotation angle [ ]
0.0
0.2
0.4
0.6
0.8
1.0
Clas
sifica
tion
accu
racy
(l) Rotation
0 90 180 270Rotation angle [ ]
0.2
0.0
0.2
0.4
0.6
0.8
1.0
Erro
r con
siste
ncy
(kap
pa)
Figure 15: Comparison of self-supervised SimCLR models with supervised, augmentation-matchedbaseline models. Note that for better visibility, the colours and symbols deviate from previous plots.Plotting symbols: triangles for self-supervised models, stars for supervised baselines. Two differentmodel-baseline pairs are plotted; they differ in the model width: blue models have 1x ResNet width,green models have 4x ResNet width [43]. For context, human observers are plotted as red diamonds.Baseline models kindly provided by Hermann et al. [62].
29

Accuracy
colour greyscaleColour
0.0
0.2
0.4
0.6
0.8
1.0
Clas
sifica
tion
accu
racy
(a) Colour vs. greyscale
Error consistency
colour greyscaleColour
0.2
0.0
0.2
0.4
0.6
0.8
1.0
Erro
r con
siste
ncy
(kap
pa)
Accuracy
true opponentColour
0.0
0.2
0.4
0.6
0.8
1.0
Clas
sifica
tion
accu
racy
(b) True vs. false colour
Error consistency
true opponentColour
0.2
0.0
0.2
0.4
0.6
0.8
1.0
Erro
r con
siste
ncy
(kap
pa)
0.0 .03 .05 .1 .2 .35 .6 .9Uniform noise width
0.0
0.2
0.4
0.6
0.8
1.0
Clas
sifica
tion
accu
racy
(c) Uniform noise
0.0 .03 .05 .1 .2 .35 .6 .9Uniform noise width
0.2
0.0
0.2
0.4
0.6
0.8
1.0
Erro
r con
siste
ncy
(kap
pa)
0 1 3 5 7 10 15 40Filter standard deviation
0.0
0.2
0.4
0.6
0.8
1.0
Clas
sifica
tion
accu
racy
(d) Low-pass
0 1 3 5 7 10 15 40Filter standard deviation
0.2
0.0
0.2
0.4
0.6
0.8
1.0
Erro
r con
siste
ncy
(kap
pa)
100 50 30 15 10 5 3 1Contrast in percent
0.0
0.2
0.4
0.6
0.8
1.0
Clas
sifica
tion
accu
racy
(e) Contrast
100 50 30 15 10 5 3 1Contrast in percent
0.2
0.0
0.2
0.4
0.6
0.8
1.0
Erro
r con
siste
ncy
(kap
pa)
inf 3.0 1.5 1.0 .7 .55 .45 .4Filter standard deviation
0.0
0.2
0.4
0.6
0.8
1.0
Clas
sifica
tion
accu
racy
(f) High-pass
inf 3.0 1.5 1.0 .7 .55 .45 .4Filter standard deviation
0.2
0.0
0.2
0.4
0.6
0.8
1.0
Erro
r con
siste
ncy
(kap
pa)
0 1 2 3 4 5 6 7Log2 of 'reach' parameter
0.0
0.2
0.4
0.6
0.8
1.0
Clas
sifica
tion
accu
racy
(g) Eidolon I
0 1 2 3 4 5 6 7Log2 of 'reach' parameter
0.2
0.0
0.2
0.4
0.6
0.8
1.0
Erro
r con
siste
ncy
(kap
pa)
0 30 60 90 120 150 180Phase noise width [ ]
0.0
0.2
0.4
0.6
0.8
1.0
Clas
sifica
tion
accu
racy
(h) Phase noise
0 30 60 90 120 150 180Phase noise width [ ]
0.2
0.0
0.2
0.4
0.6
0.8
1.0
Erro
r con
siste
ncy
(kap
pa)
0 1 2 3 4 5 6 7Log2 of 'reach' parameter
0.0
0.2
0.4
0.6
0.8
1.0
Clas
sifica
tion
accu
racy
(i) Eidolon II
0 1 2 3 4 5 6 7Log2 of 'reach' parameter
0.2
0.0
0.2
0.4
0.6
0.8
1.0
Erro
r con
siste
ncy
(kap
pa)
original equalisedPower spectrum
0.0
0.2
0.4
0.6
0.8
1.0
Clas
sifica
tion
accu
racy
(j) Power equalisation
original equalisedPower spectrum
0.2
0.0
0.2
0.4
0.6
0.8
1.0
Erro
r con
siste
ncy
(kap
pa)
0 1 2 3 4 5 6 7Log2 of 'reach' parameter
0.0
0.2
0.4
0.6
0.8
1.0
Clas
sifica
tion
accu
racy
(k) Eidolon III
0 1 2 3 4 5 6 7Log2 of 'reach' parameter
0.2
0.0
0.2
0.4
0.6
0.8
1.0
Erro
r con
siste
ncy
(kap
pa)
0 90 180 270Rotation angle [ ]
0.0
0.2
0.4
0.6
0.8
1.0
Clas
sifica
tion
accu
racy
(l) Rotation
0 90 180 270Rotation angle [ ]
0.2
0.0
0.2
0.4
0.6
0.8
1.0
Erro
r con
siste
ncy
(kap
pa)
Figure 16: Do CLIP-provided labels lead to better performance? Comparison of standard ResNet-50(light grey circles), CLIP with vision transformer backend (brown triangles), CLIP with ResNet-50backend (brown circles), and standard ResNet-50 with hard labels (bright yellow circles) vs. softlabels (dark yellow circles) provided by evaluating standard CLIP on ImageNet; as well as humans(red diamonds) for comparison. Symbols indicate architecture type (# convolutional, O visiontransformer, ♦ human); best viewed on screen. With the exception of high-pass filtered images,standard CLIP training with a ResNet-50 backbone performs fairly poorly.
30