human and environmental influences on the distribution and
TRANSCRIPT

Human and environmental influences on the distribution and abundance of arapaima in river
floodplains of the Lower Amazon
By
Jordan C. Richard
Thesis submitted to the faculty of the Virginia Polytechnic Institute and State University in
partial fulfillment of the requirements for the degree of
Master of Science
in
Fisheries and Wildlife Conservation
Leandro Castello, Committee Chair
Paul L. Angermeier
Donald J. Orth
8/31/2016
Blacksburg, Virginia
Keywords: arapaima, river floodplain, social ecological systems, habitat use
Human and environmental influences on the distribution and abundance of arapaima in river
floodplains of the Lower Amazon
Jordan C. Richard
ABSTRACT (Academic)
Understanding the factors influencing the abundance and distribution of tropical
floodplain fishes is an important component of fisheries management plans to support future
sustainable resource use. This thesis uses a multi-scale approach to understand the habitat factors
controlling the distribution and abundance of arapaima (Arapaima spp.) in river floodplains of
the lower Amazon River, near the municipality of Santarém, Pará State, Brazil. In chapter 1, a
study of eight environmental variables in 13 dry season floodplain lakes demonstrates that lake
depth, relative depth, conductivity, and transparency were significantly related to the probability
of arapaima presence at individual locations within lakes. Further, the study revealed that smaller
arapaima were more likely to be found near macrophyte coverage than in open water locations.
In chapter 2, a landscape scale approach was used to examine the interactions between
management systems, landscape habitat coverage, and spatial arrangement on arapaima
population sizes in 73 floodplain lakes. Results showed that all three influences were important
in explaining variability in arapaima abundances. Management and habitat variables contributed
equally in controlling arapaima abundances. Both had strong patterns of spatial arrangement and
overlapped significantly, suggesting that analysis of either management systems or landscape
habitats without the other would lead to overestimations of the strength of their influence.
Findings from both chapters support the notion that future sustainable use of arapaima
populations requires a dualistic approach combining habitat conservation with fisheries
management techniques enacted at a local scale.
ABSTRACT (Public)
Understanding where fishes choose to live within aquatic habitats, and why they do so, is
important for their long-term protection habitat destruction and overfishing. This thesis looks at
fish habitats at both small and large scales to understand the variables affecting populations of
the megafish arapaima (Arapaima spp.) in lakes of the lower Amazon River, near the
municipality of Santarém, Pará State, Brazil. In chapter 1, a study of eight environmental
variables in 13 lakes shows that for each lake, deeper, muddier (less clear), and more electrically-
conductive waters were more likely placed to find arapaima. Further, the study revealed that
young arapaima were more likely to be found near aquatic plants than in open water areas near
the middle of the lake. In chapter 2, a larger-scale approach was used to examine the interactions
between humans, habitats, and spatial groupings for arapaima population sizes in 73 lakes.
Results showed that all three factors were important in explaining how many arapaima were
found in each lake. Human and habitat variables were equally important variables affecting
arapaima. Both were strongly related to spatial groupings and overlapped significantly,
suggesting that analysis of either human systems or habitats without the other would lead
researchers to overestimate how important they are for arapaima. Findings from both chapters
support the notion that future sustainable use of arapaima populations requires an approach
combining habitat conservation with fisheries management techniques enacted at a local scale.

iv
Acknowledgements
This thesis could never have happened without the efforts of countless people who helped
me along the way. My family and friends have been incredibly supportive from start to finish.
My girlfriend Breanna has wholeheartedly supported my work, and I truly couldn’t have pulled
this off without her. There are too many people within the Fish and Wildlife Conservation
Department at Virginia to thank individually, but Paul Angermeier and Emmanuel Frimpong
deserve special mention. They have guided my career from its inception and played a massive
role in the development of this thesis. My committee members – Paul Angermeier and Don Orth
– have been incredibly helpful at every step along the way, particularly with their flexibility in
meeting tight deadlines to keep the project going. They repeatedly bent over backwards to help
me out, and I will be forever grateful. Leandro Castello took me on as his very first graduate
student, and together we succeeded on a highly ambitious project. There aren’t many people who
could successfully guide a new MS student through a journey to the Amazon and back in under a
year, and his patience has been incredible. Daniel Gurdak, Kapil Mandrekar, and Caroline
Arantes provided me with moral and logistical support while on the ground in Brazil. Without
the three of them, I might still be sitting down in Brazil attempting to make contact with the
fishing communities. My labmates Jesse Olsen, Gretchen Stokes, and Sasha Doss have been
fantastic as both coworkers and friends. Finally, my best friend and dog Chase has been the
greatest source of moral support anyone could ever ask for. He never held it against me when I
left him for months at a time to complete field work, and he always lifted my spirits when
needed.

v
Table of Contents
Abstract (Academic)..................................................................................................................... ii
Abstract (Public).......................................................................................................................... iii
Acknowledgements...................................................................................................................... iv
List of Tables................................................................................................................................ vi
List of Figures............................................................................................................................. vii
Preface............................................................................................................................................ 1
Chapter 1. Size-structured habitat selection by arapaima in dry season Amazonian
floodplain lakes............................................................................................................................... 6
Abstract.......................................................................................................................................... 6
Introduction................................................................................................................................... 7
Methods........................................................................................................................................ 10
Study area................................................................................................................................. 11
Sampling................................................................................................................................... 12
Data analysis............................................................................................................................ 13
Results.......................................................................................................................................... 16
Discussion.................................................................................................................................... 17
Conservation implications........................................................................................................ 20
Chapter 2. A landscape approach to modeling resource abundance in social ecological
systems: a case study of arapaima fisheries in the Lower Amazon River ................................... 28
Abstract........................................................................................................................................ 28
Introduction................................................................................................................................. 29
Study area................................................................................................................................. 33
Methods........................................................................................................................................ 36
Arapaima abundance data....................................................................................................... 37
Landscape habitat model.......................................................................................................... 38
Governance model.................................................................................................................... 40
Spatial model............................................................................................................................ 41
Variation partitioning............................................................................................................... 42
Results.......................................................................................................................................... 43
Landscape, Governance, and Spatial Models.......................................................................... 43
Variation partitioning............................................................................................................... 44
Discussion.................................................................................................................................... 45
Conservation implications........................................................................................................ 50
Conclusions.................................................................................................................................. 63
References.................................................................................................................................... 69

vi
List of Tables
Table 1.1. Habitat variable means, for each lake, of measured microhabitat variables............... 23
Table 1.2. GLMM model parameters and importance rank for microhabitat variables............... 24
Table 1.3. Variable means by size-class and significance values for pairwise comparisons
between all size classes................................................................................................................. 24
Table 2.1. Descriptions and cost distance values for landscape habitat classes........................... 53
Table 2.2. Variables, with descriptions and formulae, calculated for each class within the
habitat and macrophyte datasets................................................................................................... 54
Table 2.3. Variables used to develop the CBM model relating governance principles to
arapaima abundance at the community level................................................................................ 55
Table 2.4. Variables selected for each of the three independent models used in the variation
partitioning analysis...................................................................................................................... 56

vii
List of Figures
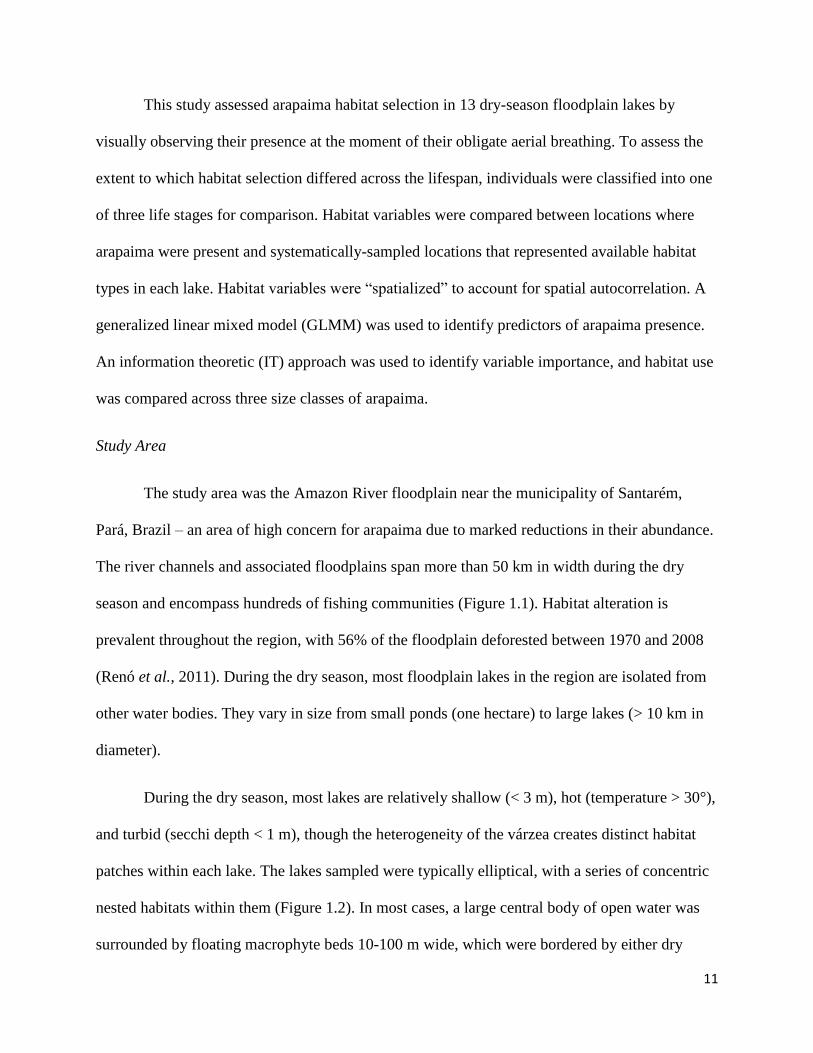
Figure 1.1. Map of the lower Amazon region depicting fishing community boundaries and
sampling locations........................................................................................................................ 25
Figure 1.2. Schematic design of a typical várzea lake and sampling methodology.................... 25
Figure 1.3. Plots of predicted probabilities of arapaima presence for each of the eight
microhabitat variables measured................................................................................................... 26
Figure 1.4. Standardized effect size and relative importance for each habitat variable.............. 26
Figure 1.5. Distance from nearest cover for small, medium, and large arapaima....................... 27
Figure 2.1. Conceptualization of spatial scale relationships between social and ecological
aspects of a typical SES................................................................................................................ 57
Figure 2.2. Map of surveyed lakes and community boundaries in the study area....................... 58
Figure 2.3. Map of habitat coverage types throughout the lower Amazon.................................. 59
Figure 2.4. Comparison of traditional buffer-distance approaches to delineating available
habitat surrounding a floodplain lake with a cost-distance approach........................................... 60
Figure 2.5. Map of arapaima abundances for all lakes surveyed................................................. 61
Figure 2.6. Venn diagram illustrating contributions of each independent model and shared
proportions of variation explained between all models................................................................ 62
1
Preface
The study of fish that have significant value to humans has long comprised two primary
schools of inquiry: ecologists who study the fish in their natural environment, and social
scientists who study management and human uses of fish. As the increasing needs of a growing
human population continually pressure the world’s natural resources, better understanding and
management is needed. Ensuring the long-term sustainability of fisheries resources will require
collaborative approaches that unite scientists across disciplines to develop comprehensive
methods for understanding and solving problems. This thesis applies an interdisciplinary
approach to determine the human and environmental factors influencing the distribution and
abundance of arapaima (Arapaima spp.) in the Lower Amazon River, near the municipality of
Santarém, Pará State, Brazil.
Both chapters of this thesis focus on arapaima populations in the nutrient-rich,
whitewater-influenced habitats of the lower Amazon River near Santarém. These floodplain
areas, collectively known as várzea, contain forests, grasslands, lakes, streams, and river
channels that continually shift as erosion and sedimentation shape the landscape (Junk, 1997).
Fish richness and abundance in Amazon River floodplains are strongly related to flooded forest
areas and proximity river channels (Lobón-Cerviá et al., 2015). Regular and predictable seasonal
changes in floodplain fish assemblages are known to occur as a result of the flood-pulse cycle
(Rodríguez and Lewis, 1994). Seasonal flooding of forest areas adjacent to floodplain lakes
connects large areas, which allows fish to take advantage of expanding food and habitat
resources (Galacatos et al., 2004). A number of fish species in Amazon floodplains undergo
lateral migrations related to breeding and physical habitat changes throughout the flood cycle
(Fernandes, 1997; Castello, 2008a).

2
The seasonal replenishing of nutrients (Melack and Forsberg, 2001), stable tropical
temperature regime, and immense productivity (Goulding, 1999) of the várzea systems in the
lower Amazon have made them ideal locations for human inhabitants. The abundance of natural
resources, coupled with the ease of transportation afforded by the large-river system, make the
várzea vulnerable to exploitation – particularly of fish populations – from a multitude of sources.
As the human population within the area grows, deforestation to support agriculture in the
nutrient-rich várzea soils is an increasing problem (Neill et al., 2001). Historically, fishing has
served as a vital source of sustenance and income for a significant portion of the native human
population (Crampton et al., 2004). Fish species diversity in the Amazon River basin is
extraordinary, with >2,500 described species (Val and Almeida-Val, 1995; Reis et al., 2003) and
estimates of >1,000 undescribed species. However, only ~700 fish species exist in the várzea
ecosystem, and of these less than ten species comprise over three-quarters of the commercially-
harvested fish biomass (Crampton et al., 2004). As a result, many fish species vital to the local
economy have been overexploited to the point of localized extinctions, prompting a need for
conservation efforts. Among these species is the arapaima – one of the fishes of greatest
conservation concern in the lower Amazon (Castello and Stewart, 2010).
The arapaima is a large-bodied (up to 3 m) member of the Osteoglossiformes with unique
adaptations to the Amazon floodplain ecosystem. Commonly achieving sizes >65cm (Arantes et
al., 2010) within the first year of life, their modified swim bladder makes them obligate-air
breathers; an adaptation which makes them uniquely suited to the harsh conditions within várzea
lakes during the dry season. Arapaima build nests for spawning when the waters begin to rise at
the beginning of the flood season. The young-of-year fish then hatch shortly before the floods
reconnect the entire várzea ecosystem, at which point males escort their young through the

3
flooded forest to forage for approximately three months (Queiroz, 2000; Castello, 2008b).
Recent studies (Stewart, 2013a, 2013b) have suggested that the species Arapaima gigas, which
has traditionally been the only recognized species of the Arapaima family, may actually
comprise several distinct species. To date, studies have not conclusively demonstrated
differences and range descriptions for the proposed splitting of Arapaima gigas into multiple
species, thus this thesis will assess arapaima as a unified group. Whereas the arapaima’s air-
breathing makes it a particularly efficient predator within the extreme conditions of the várzea, it
also leaves the fish uniquely susceptible to overfishing. Because it must surface every 10-15
minutes for air (Goulding et al., 1996; Queiroz and Sardinha, 1999), the arapaima can easily be
tracked and hunted by local fishermen. Their fast growth, prized meat, and ease of capture have
resulted in arapaima populations throughout the Amazon becoming threatened or locally-
extirpated (Castello et al., 2015a). However, the arapaima is not unique in regards to overfishing.
A number of other fish species that utilize the floodplain lake and seasonally-flooded forest
habitats face strong fishing pressures that threaten the long-term sustainability of their
populations (Goulding, 1999; Crampton et al., 2004; Isaac and Ruffino, 2007).
Understanding and managing the threats to arapaima (and other fish) populations
necessitates interdisciplinary knowledge that is greater than the sum of individual disciplinary
components. However, putting all of the parts together has traditionally been a challenge.
Considering ecological and anthropogenic phenomena in isolated contexts rather than as
dynamic, interacting factors hampers the ability to predict outcomes for important systems
(Bozelli et al., 2009), such as arapaima population management. Integration of both human and
environmental influences (Agrawal, 2001) in models describing fish abundances and
distributions is a critical step in developing effective conservation schemes. In order to
4
understand these systems, scientists have developed frameworks, such as the social-ecological
systems (SES) model (Ostrom, 2009), which link humans, management, natural resources, and
ecosystems together in unified models. By simultaneously considering all of the components
interacting within these systems, researchers hope to understand the factors contributing to – or
detracting from – the sustainable use of these systems. While these models provide excellent
foundations for interdisciplinary assessment of sustainability, to date, their use has been largely
biased in favor of the social science aspects of the models (Epstein et al., 2013; Vogt et al.,
2015). Meanwhile, ecologists have continued to operate largely within their own discipline while
ignoring the human influences to their target species or ecosystem. However, I do not intend to
discount the merit of disciplinary research. On the contrary, I believe that true interdisciplinary
research will require more single-disciplinary rigor than ever before. Each successive
contribution granted by a single disciplinary study is like a piece added to a puzzle; we cannot
solve the puzzle without first holding the necessary pieces. The difficulty lies in assembling the
disparate pieces into a unified picture of the system as a whole.
Nowhere is the need for building such detailed interdisciplinary approaches more
apparent than the Amazon River basin, where the rapidly developing human population is
increasingly linked to the outside world through the harvest of the Amazon’s bountiful natural
resources. In this thesis, I address the challenges of understanding and managing arapaima
fisheries in floodplains of the Lower Amazon River. I do so in the spirit of focusing my abilities
to contribute to a larger body of knowledge for arapaima, and indeed fisheries management as a
whole. Whereas previous studies had identified patterns of habitat selection among various
floodplain lakes during the dry season (Tejerina-Garro et al., 1998; Arantes et al., 2013), in
chapter 1 I conduct an assessment of the habitat factors affecting the distribution of arapaima

5
within lakes during the dry season. This work investigates the importance of several key
floodplain lake habitat variables on the distribution of arapaima individuals at distinct periods of
their life cycles. In chapter 2, I contribute to the science of SES research by conducting an
integrated assessment using a series of datasets on arapaima abundances, landscape habitat
classifications, and human governance of arapaima fisheries by using spatial analysis as a linking
mechanism between multiple disciplines. The purpose of this analysis is to address the largely
unexplored question of estimating relative importance of human versus environmental influences
that control the abundance of fish populations.
Fish ecology in the Amazon and assessments of tropical fisheries are both largely
unexplored frontiers. It is my hope that this thesis will constitute a small, but potentially useful,
piece to each of these puzzles. Just as this research was built upon (and in collaboration with) the
work of others, I aim to contribute something meaningful to the next person seeking to push the
science of sustainability forward by another small step.

6
Chapter 1. Size-structured habitat selection by arapaima in dry season Amazonian floodplain
lakes
Abstract
Identifying habitat selection patterns throughout the lifespan of river floodplain fishes is
important for identifying areas of conservation interest. However, few studies have attempted to
characterize the extent to which intra-lake variables influence habitat selection at multiple life-
stages for tropical floodplain fishes in dry-season floodplain lakes. The goal of this study was to
examine the effects of environmental factors (i.e., depth, water chemistry, refugia) on habitat
selection patterns by arapaima Arapaima spp. and determine the extent to which these
relationships differ across three distinct size classes. In 13 floodplain lakes of the lower Amazon
River, variables were measured at locations representing habitat availability and compared to
measurements taken where arapaima were observed during surface-breathing. Generalized linear
mixed models (GLMM) were used to account for variability from human effects in different
lakes and probability of arapaima presence at each sample location was modeled based on the
variables measured. Arapaima expressed distinct habitat selection patterns and significant
differences across size classes. The general pattern observed was that all arapaima were more
likely to be found in deeper, more turbid, and higher-conductivity locations, while smaller
arapaima were more likely to remain near areas of dense floating macrophytes. The probability
of arapaima presence differed significantly among fishing community territories, reflecting
differences in fishery management. This study reveals that depth, water clarity, and macrophyte
cover can govern patterns of habitat selection in floodplain fishes during the dry season and
suggests patterns of current habitat destruction for agriculture may disrupt important habitats for
fishes.

7
Introduction
Tropical river floodplain ecosystems are among the most important locations to human
populations in developing regions (Junk, 2002; Tockner and Stanford, 2002), as they make
excellent grounds for fisheries, settlements, and agriculture while also providing a means of
transportation. Rapid development of these areas has resulted in significant deforestation (Renó
et al., 2011) and depletion of tropical fisheries (Castello et al., 2013) crucial to the income- and
food-security of some of the world’s poorest populations (Coomes et al., 2010; Ziv et al., 2012).
Balancing human development with conservation to ensure the continued productivity of
floodplain fisheries requires knowledge of which habitats are most important in supporting
heavily-exploited fishes. During the dry season, floodplain fishes are often concentrated into
small lakes (Winemiller and Jepsen, 1998), making them more susceptible to natural and human-
induced mortality (Junk, 1984; de Yuan and de Hassan, 1985; Winemiller and Jepsen, 1998).
Therefore, identifying the dry-season habitat factors important to floodplain fishes is an
important step in determining locations for habitat protection. However, understanding of fish
habitat selection in dry season lakes is limited, as most studies of floodplain fishes in dry season
have historically focused largely on describing patterns of fish community structure. Further,
many fishes exhibit changes in habitat selection as they grow (Schlosser, 1987; Lecchini et al.,
2007), but the extent to which this pattern applies to tropical floodplain fishes is largely
unexplored. Developing effective conservation strategies for tropical floodplain fishes will likely
necessitate protection of key habitats supporting fish. Understanding dry season intra-lake habitat
selection at various life stages is an important step in identifying key habitats for protection.
Floodplain fish distribution and habitat selection are driven primarily by the effects of the
flood pulse, a yearly cycle fluctuating between the high water levels of the flood season and the

8
relative scarcity of aquatic habitats during the dry season (Junk et al., 1989). Following the
lowest water levels of the year, rising waters create a moving littoral zone that advances from
low water habitats into adjacent areas until the entire floodplain becomes a single connected
aquatic habitat that includes river channels, floodplain lakes, macrophyte beds, and flooded
forests. As waters recede, the littoral zone retreats until main river channels and floodplain lakes
are the only aquatic habitats available. Many fishes migrate laterally during high waters to forage
and seek cover in vegetated floodplain habitats (Fernandes, 1997; Castello, 2008a). When water
levels recede, these fishes migrate back to main river channels or dry-season floodplain lakes in
search of refugia from habitat reductions, where they must tolerate poor water quality
characterized by high temperature, low pH, and low dissolved oxygen levels (Welcomme, 1979;
Magoulick and Kobza, 2003). Within dry-season lakes, limited habitat availability increases fish
density (Matthews, 1998; Magoulick and Kobza, 2003; Matthews and Marsh-Matthews, 2003),
and consequently intensifies biotic interactions (Welcomme, 1979; Schlosser et al., 2000). These
concentration effects, induced by low water in river channels and floodplain lakes, make large-
bodied, commercially-valuable species more vulnerable to fishing gear and overharvesting
(Welcomme, 1995). Fish are known to migrate laterally between the highly productive
floodplain habitats available during the flood season and the relatively restricted lake habitats of
the dry season. While these movements likely reflect resource tracking in the flood season and
selection of deep lakes promoting survival from desiccation in the dry season, little is known
about the factors determining fish distribution and habitat selection within these dry season lakes.
In addition to changes following the seasonal influence of the flood pulse, floodplain fish
habitat selection within dry season lakes can be expected to change as fish grow. Many fish
species demonstrate distinct patterns of shifting spatio-temporal distributions across their

9
lifespans (Schlosser, 1987; Harvey and Stewart, 1991; Lecchini et al., 2007). These changes in
habitat selection influence survival rates by altering exposure to stressors that differentially
influence individuals throughout their ontogeny. Early life stages are frequently more susceptible
than adults to predation, and more sensitive to chemical and physical stressors (Kurihara, 2008;
Baumann et al., 2011). For younger or smaller individuals, risk of predation and foraging
profitability are important drivers of habitat selection (Werner et al., 1983; Werner and Gilliam,
1984; Mittelbach, 1986) that may shift as individuals grow to larger sizes. In tropical floodplains,
where dry season lakes feature stressful water quality conditions and high predator
concentrations, differentiation of habitat selection across the lifespan may be a key determinant
of survival and recruitment. However, the role of habitat selection within dry-season habitats,
and the extent to which it varies through ontogeny, is largely unknown. For tropical floodplain
fishes, little is known about how habitat use across the lifespan influences species occurrence
and vulnerability (Kouamé et al., 2008), and most studies have focused on patterns of fish
community structure rather than individual species or life stages.
Among threatened tropical floodplain fishes, arapaima (Arapaima spp.) are one of the
largest and most historically important fish to Amazonian river-floodplain fisheries (Verissimo,
1895). They are of great conservation concern (Castello and Stewart, 2010), and in many areas,
arapaima populations are being overexploited and depleted to the point of causing local
extinctions (Castello et al., 2015a). Arapaima are fast-growing, obligate air breathers that must
gulp atmospheric oxygen from the water’s surface or risk drowning. Their rapid growth to large
sizes makes them strong candidates for investigating size-structured habitat selection. At birth,
arapaima are only a few cm total length (TL), but they grow to ~ 1 m within the first two years of
life. Arapaima reach sexual maturity at ~ 157 - 164 cm TL between three and five years of age,

10
and grow to an estimative maximum of ~ 3 m TL (Arantes et al., 2010). Arapaima are generally
found in slow-moving waters near the moving littoral edge (Castello, 2008a) and spawn during
rising waters, when they build nests on forest margins in lake and connecting channel habitats
(Castello, 2008b). During the flooded season, arapaima migrate laterally out of floodplain lakes
and move between a variety of seasonally-available habitats (Castello, 2008a). They select the
higher-elevation floodplain habitats (primarily flooded forests) when accessible during high
waters and migrate back to the lower-lying floodplain lakes only when declining waters dry
vegetated floodplain habitats (Castello, 2008a). While arapaima abundances in dry-season lakes
of the central Amazon were positively correlated with lake depth, area, and conductivity
(Arantes et al., 2013), habitat selection by arapaima was not studied within dry-season lakes.
Intra-lake variation in factors controlling the abundance of other floodplain fishes, such as
dissolved oxygen, transparency, and macrophyte cover (Petry et al., 2003a, 2003b), may also be
important for arapaima. Previous studies documenting arapaima distribution have ignored the
role of size-structured habitat selectivity, having assessed only individuals > 1 m TL (Arantes et
al., 2013). Understanding the habitat factors affecting arapaima distribution in dry-season lakes
throughout their lifespan is an important step in designating habitats in need of protection under
conservation schemes.
The purpose of this study was to (1) determine the factors influencing arapaima habitat
selection within dry-season floodplain lakes and (2) evaluate how dry-season habitat selection of
arapaima varies across life-stages.
Methods
11
This study assessed arapaima habitat selection in 13 dry-season floodplain lakes by
visually observing their presence at the moment of their obligate aerial breathing. To assess the
extent to which habitat selection differed across the lifespan, individuals were classified into one
of three life stages for comparison. Habitat variables were compared between locations where
arapaima were present and systematically-sampled locations that represented available habitat
types in each lake. Habitat variables were “spatialized” to account for spatial autocorrelation. A
generalized linear mixed model (GLMM) was used to identify predictors of arapaima presence.
An information theoretic (IT) approach was used to identify variable importance, and habitat use
was compared across three size classes of arapaima.
Study Area
The study area was the Amazon River floodplain near the municipality of Santarém,
Pará, Brazil – an area of high concern for arapaima due to marked reductions in their abundance.
The river channels and associated floodplains span more than 50 km in width during the dry
season and encompass hundreds of fishing communities (Figure 1.1). Habitat alteration is
prevalent throughout the region, with 56% of the floodplain deforested between 1970 and 2008
(Renó et al., 2011). During the dry season, most floodplain lakes in the region are isolated from
other water bodies. They vary in size from small ponds (one hectare) to large lakes (> 10 km in
diameter).
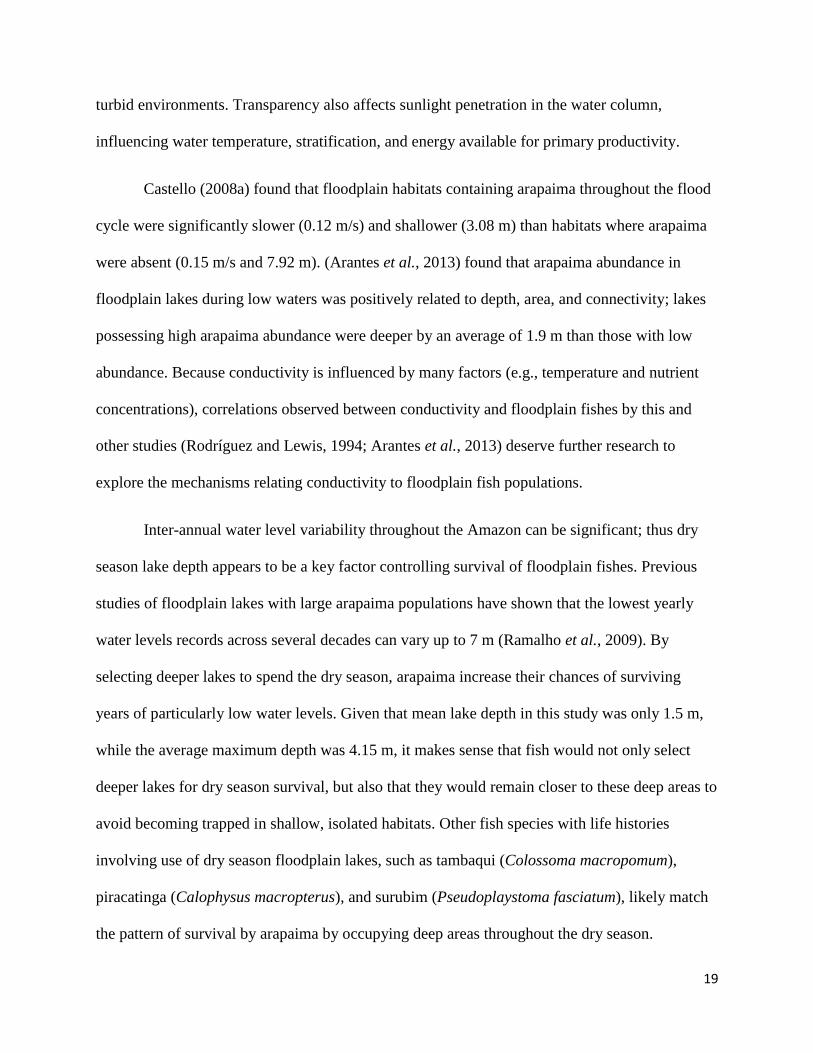
During the dry season, most lakes are relatively shallow (< 3 m), hot (temperature > 30°),
and turbid (secchi depth < 1 m), though the heterogeneity of the várzea creates distinct habitat
patches within each lake. The lakes sampled were typically elliptical, with a series of concentric
nested habitats within them (Figure 1.2). In most cases, a large central body of open water was
surrounded by floating macrophyte beds 10-100 m wide, which were bordered by either dry

12
seasonally-flooded forests, cattle-ranching grounds, or dense “aningal” thickets (Figure 1.2).
Aningal habitats are characterized by stands of Montrichardia arborescens mixed with
floodplain trees so densely concentrated that they prevented entry for habitat sampling. The
sample lakes were characterized by different habitat conditions, fishing pressures, and
management regimes. Fishing rules and restrictions varied among communities, and among lakes
within communities; multiple lakes from several communities were sampled to examine
variability across environmental gradients and to account for differences in management
practices. The extent to which arapaima populations among lakes interact when connected by
flood waters is undescribed.
Sampling
In order to determine what factors influence arapaima habitat selection, habitat variables
were compared between collective locations where arapaima were present and other
systematically-sampled locations representing the available habitat types in each lake. Lakes
were surveyed between 12 November 2014 and 20 December 2014 from a canoe by one of us
(J.C.R.) and a local expert fisherman paddling the perimeter of each lake near the open-
water/macrophyte edge and across transects through the open-water areas (Figure 1.2). To assess
habitat availability, eight habitat variables were measured at regular intervals around the
perimeter and along the open-water transects. These intervals ranged 75 – 125 m and were
determined for each lake such that habitat sampling could be accomplished in a single day. A
paired sampling design was used near edge areas to quantify potential differences in habitat
selection between open water and vegetated habitats for a given location. Measurements were

13
taken 10 m inside the macrophyte bed from the edge and 10 m in the opposite direction toward
the open water.
To assess habitat use, measurements were taken at the exact locations where arapaima
were observed surfacing to breathe. Arapaima presences were assessed by experienced
fishermen, who were trained in a visual census method for arapaima (Castello 2004) that yields
fish counts highly correlated (r = 0.983) with mark-recapture estimates of the same populations.
Arapaima were grouped into three size classes: ‘small’ (< 1 m TL), ‘medium’ (1-1.5 m TL), and
‘large’ (> 1.5 m TL). Based on available information (Arantes et al., 2010), the small size class
represents exclusively young fish (< 2 years old), the medium size class represents mostly
juvenile fish (2-5 years old), and the large size class represents mostly adult fish (> 5 years old).
At each sampled location, a water quality meter (YSI 556 MPS) was placed just below
the surface to measure temperature (°C), dissolved oxygen (DO, mg/L), conductivity (µS/cm2),
and pH. A Hawkeye H22PX sonar depth sounder was used to measure depth. For open-water
locations, a Secchi disk was used to measure water clarity, and a Nikon Prostaff rangefinder was
used to determine distance from the nearest habitat patch providing cover (i.e., macrophyte beds
or aningal habitats). Relative depth was estimated at each location to determine if individuals
utilized the deepest areas available within lakes. Relative depth was calculated by dividing the
measured depth at each location by the maximum depth observed within the lake. Because secchi
depth cannot be measured under floating macrophyte beds without disturbing sediments, a
nearest-neighbor approach (i.e., measurement at the closest location not obscured by
macrophytes) was utilized for secchi depth in macrophyte locations in order to avoid issues
arising from missing values in the analysis.
Data Analysis

14
Many ecological analyses can be confounded by spatial autocorrelation among sites due
to unquantified underlying spatial gradients. In order to avoid potentially spurious findings
caused by spatial autocorrelation, habitat variables were “spatialized” prior to analysis; this
approach allows researchers to account for spatial autocorrelation without sacrificing degrees of
freedom in subsequent models due to the need to include separate spatial variables
(Brind’Amour et al., 2005; F. Dormann et al., 2007). First, a pairwise Euclidean distance matrix
of sampling location coordinates (latitude and longitude) was calculated using the spDistsN1
function in the sp package (Pebesma and Bivand, 2005; Bivand et al., 2013) in R (R Core Team,
2014). The distance matrix was then subjected to a principal coordinates of neighborhood
matrices (PCNM) analysis using the PCNM function from the PCNM package (Legendre et al.,
2013) of R. This procedure identifies significant gradients in spatial clustering of sampling
locations by testing for significance on Moran’s I of spatial autocorrelation of eigenvectors (α =
0.05). Next, all significant spatial eigenvectors with positive eigenvalues produced by the PCNM
analysis were retained and used as potential independent variables in linear regression models to
predict each habitat variable. The optimal model for each habitat variable was identified based
on the lowest value of Akaike’s information criterion (AIC) using the stepAIC function in the
MASS package of R. Finally, subsequent regression models for each variable were created using
only the spatial predictors from the optimal model for each habitat variable. Predicted values
from these models represent both spatial gradients and habitat characteristics, and were retained
as factors predicting arapaima presence. Spatialized habitat variables were scaled and centered to
mean = 0 and variance = 1 prior to analysis.
In order to determine the factors influencing arapaima habitat selection across all size-
classes, a generalized linear mixed model (GLMM) predicting the probability of arapaima

15
presence based on habitat variables was developed. Habitat variables were pre-screened for
multicollinearity using Pearson correlation indices in which |r| > 0.7 indicated an unacceptably
high correlation. A GLMM using the glmer function in the lme4 package of R was used to
estimate the effects of habitat variables and fishing community on arapaima. Depth, relative
depth, temperature, conductivity, pH, dissolved oxygen, transparency, and distance from nearest
cover were included as fixed effects in the model. To separate the habitat variables affecting
arapaima habitat selection from other confounding influences, one fixed and one random effect
were added to the model. Fishing community identity (hereafter, “community”) was included as
a fixed effect to account for the relative influence of management rules on habitat parameters. A
random effect of habitat measurement location nested within lake identity was included as a
categorical variable to account for inherent inter-lake variability in habitat variables.
Use of GLMM models was necessary to model the habitat variables while accounting for
confounding effects. However, individual GLMM models cannot estimate the relative
importance of individual significant independent variables. Therefore, an information-theoretic
approach was used to estimate the relative importance of each habitat variable in predicting
arapaima presence. The dredge function in the MuMin package in R was used to calculate
Akaike weights (wi) for GLMMs of all possible combinations of independent variables,
including an intercept-only model. For each variable, wi was summed for all models containing
that variable. Variables with higher summed w values are considered more important (Burnham
and Anderson, 2010).
Size-structured habitat selection was assessed using linear mixed models (LMMs) to
evaluate differences in environmental variables across three size classes of arapaima. Because
the goal of this study was to assess differences in habitat selection across size classes, lake

16
identity was specified as a random effect (rather than a fixed effect) in LMMs to make inferences
generalizable across Amazon floodplain lakes. Individual fish located in floating macrophytes
were excluded from the LMM assessing differences in distance from nearest cover by size class,
as all individuals located in cover areas were recorded as a ‘0’ for the nearest-distance metric.
Tukey’s Honest Significant Difference (HSD) was used to create pairwise comparisons between
size classes for each habitat variable. All statistical effects were interpreted as significant at α <
0.05.
Results
Arapaima exhibited strong habitat selection with respect to lake and anthropogenic
factors (Figure 1.3). Models predicting the probability of arapaima presence, based on 243
observed breathing events, indicated that arapaima presence was significantly affected by
community, depth, relative depth, and transparency (Table 1.2). Arapaima were observed in
similar frequencies across size-classes (n = 85 small, 76 medium, 82 large) and were more likely
to occur in deeper, more turbid areas. Arapaima presence was strongly influenced by the
community associated with the lake. GLMM-predicted mean probabilities of occurrence ranged
from 0.80 ± 0.02 for Santa Maria to 0.24 ± 0.02 for Tapara-Miri, and differed significantly
among communities surveyed (Table 1.2). Santa Maria had the highest community-level mean
probability of occurrence, while all other communities were significantly lower. Both relative
depth and absolute depth had significant positive effects on probability of arapaima presence (p <
0.001, p = 0.013, respectively), while transparency had a significant negative effect (p = 0.028).
Conductivity was strongly and positively related to arapaima presence (p = 0.0503). Water
temperature was consistently included in heavily-weighted models, but was not a statistically
significant predictor of arapaima presence. Dissolved oxygen, pH, and distance from cover did

17
not significantly affect arapaima presence. The most important variable predicting arapaima
presence was community (w = 1.0), followed by relative depth (w = 0.99), absolute depth (w =
0.93), temperature (w = 0.91) and secchi depth (w = 0.85) – all of which were significant except
for temperature (Figure 1.4). Other variables were relatively less important (see Table 1.1).
Models of habitat selection by individual size-classes showed that arapaima exhibited
distinct patterns of size-structured habitat use (Figure 1.5). After accounting for differences
among lakes, distance of fish from nearest cover differed significantly among size classes. For
arapaima found in open water, small individuals were located significantly closer to floating
macrophyte beds (distance = 12.96 ± 15.77 m) than medium (29.07 ± 22.81 m) and large (30.33
± 21.60 m) individuals (Table 1.3). Arapaima were found in open water habitats nearly twice as
often as in cover habitats, and habitat type did not differ significantly among size classes (Chi-
Square p-value = 0.38). Though depth appeared to differ between small arapaima (1.38 ± 0.06
m) and the two larger size classes (medium = 2.25 ± 0.21, large = 1.73 ± 0.14), the difference
was not significant when the random effect of lake was included. All other pairwise
comparisons of environmental variables by size-class were insignificant.
Discussion
The distribution of arapaima within dry-season lakes of the Lower Amazon was primarily
influenced by the community in which lakes were located, depth, relative depth, conductivity,
and water transparency. Arapaima were more likely to be located in deeper, more turbid, and
higher-conductivity waters, but did not respond to temperature, pH, or dissolved oxygen
concentrations. These results are consistent with previous studies of Amazon floodplain lakes

18
during low waters, which have identified transparency, conductance, depth, and area as
important predictors of assemblage structure for fish communities (Rodríguez and Lewis, 1994,
1997; Pouilly and Rodríguez, 2004). Distance from macrophyte cover was not a useful predictor
of arapaima presence, as all size classes were frequently located in both macrophytes and open
water. However, small arapaima were more likely to remain closer to macrophyte edges, while
medium and large arapaima ventured farther from macrophytes into open waters.
Arapaima consistently selected the deepest locations within lakes, probably because
deeper areas provide increased aquatic habitat volume. Dry-season mortality rates are generally
high in tropical floodplain fish populations (Welcomme, 1979; Rodríguez and Lewis, 1994),
owing largely to increased predator densities, extreme water conditions, and even desiccation.
Increased water volume likely promotes survival during low water periods in several ways.
Particularly during droughts (e.g., due to El Niño events), deeper water offers fishes protection
from extreme water quality conditions, such as increased temperature, hypoxia, and high
concentrations of harmful pollutants (Schöngart and Junk, 2007). Being obligate air breathers,
arapaima are not susceptible to hypoxia. However, hypoxia and other water quality extremes
may indirectly affect arapaima by either decreasing abundance of prey species or leaving prey
weakened and vulnerable to predation. Deeper water also corresponds with increased water
volume, which would influence predation rates through decreased predator concentrations. Water
transparency, which showed a significant and strongly negative relationship with arapaima
presence, is known to strongly affect fish community structure in low water floodplain habitats
(Rodríguez and Lewis, 1994). The success of visually-oriented predators, such as arapaima, in
clearer waters can be expected to cause corresponding shifts in community structure throughout
the dry season, while fish adapted to low light conditions experience higher success in more
19
turbid environments. Transparency also affects sunlight penetration in the water column,
influencing water temperature, stratification, and energy available for primary productivity.
Castello (2008a) found that floodplain habitats containing arapaima throughout the flood
cycle were significantly slower (0.12 m/s) and shallower (3.08 m) than habitats where arapaima
were absent (0.15 m/s and 7.92 m). (Arantes et al., 2013) found that arapaima abundance in
floodplain lakes during low waters was positively related to depth, area, and connectivity; lakes
possessing high arapaima abundance were deeper by an average of 1.9 m than those with low
abundance. Because conductivity is influenced by many factors (e.g., temperature and nutrient
concentrations), correlations observed between conductivity and floodplain fishes by this and
other studies (Rodríguez and Lewis, 1994; Arantes et al., 2013) deserve further research to
explore the mechanisms relating conductivity to floodplain fish populations.
Inter-annual water level variability throughout the Amazon can be significant; thus dry
season lake depth appears to be a key factor controlling survival of floodplain fishes. Previous
studies of floodplain lakes with large arapaima populations have shown that the lowest yearly
water levels records across several decades can vary up to 7 m (Ramalho et al., 2009). By
selecting deeper lakes to spend the dry season, arapaima increase their chances of surviving
years of particularly low water levels. Given that mean lake depth in this study was only 1.5 m,
while the average maximum depth was 4.15 m, it makes sense that fish would not only select
deeper lakes for dry season survival, but also that they would remain closer to these deep areas to
avoid becoming trapped in shallow, isolated habitats. Other fish species with life histories
involving use of dry season floodplain lakes, such as tambaqui (Colossoma macropomum),
piracatinga (Calophysus macropterus), and surubim (Pseudoplaystoma fasciatum), likely match
the pattern of survival by arapaima by occupying deep areas throughout the dry season.

20
Although distance from nearest macrophyte cover had little effect on the presence of
arapaima of all sizes, small arapaima were more closely associated with macrophytes. Several
possibilities relating to ontogenetic shifts in diet and predation risk may explain the tendency of
smaller arapaima to remain close to macrophyte beds. Arapaima diets change significantly across
their lifespans. While juveniles and adults feed almost exclusively on other fishes, the bulk of
prey items for arapaima < 1 m TL comprises insects, molluscs, and crustaceans found among the
root zones of macrophytes (Queiroz, 2000). Ontogenetic shifts in diet based on gape-size
limitations are a well-known aspect of many freshwater fishes (Schael et al., 1991), and
arapaima appear to exhibit similar patterns. Smaller arapaima likely remain close to macrophyte
beds, as they support higher densities of available prey, including crustaceans, insects, and small
fishes. As arapaima grow larger, they probably venture further out into open water areas to
forage for larger-bodied prey. At the same time, smaller arapaima may remain closer to
macrophyte beds to seek cover from a variety of predators. Previous studies have demonstrated
size-specific habitat use in freshwater fishes based on the presence of predators (Holbrook and
Schmitt, 1988; Persson et al., 1996). When predators are present, many fish alter their foraging
strategies to exploit less productive areas in exchange for reduced risk of predation. While adult
arapaima possess few natural predators, individuals < 1 m TL likely follow habitat use patterns
similar to other floodplain fishes. In dry season floodplain lakes, macrophytes act as nursery
grounds for the majority of fish larvae (Goulding et al., 1996), where the abundance of refugia
and small prey items promotes their survival and growth.
Conservation implications
The strong influence of community identity on arapaima presence reflects differences in
the community-based management (CBM) schemes used throughout the region to conserve

21
arapaima populations, where differing participation and effectiveness has yielded patchy
distributions of arapaima populations. Previous research has shown that successful CBM
schemes in the area (i.e., systems resulting in higher arapaima density) have many of the traits
related to successful self-governance (Gutiérrez et al., 2011; Basurto et al., 2013), such as well-
defined community boundaries, rules for fisheries created and modified by local users,
monitoring systems, and graduated sanctions for rule-breakers (Arantes et al., 2016).
Communities where these traits are absent or poorly-developed tend to have lower arapaima
concentrations (Castro and McGrath, 2003; McGrath et al., 2008), and thus, lower probabilities
of arapaima presence. Current conservation efforts for floodplain fishes focus largely on
community-level property rights, CBM schemes, and fishing agreements (McGrath et al., 1993).
CBM schemes would likely be improved by incorporating elements of habitat conservation, of
which knowledge of the important habitats to fishes throughout their lifespan is an important
component. To that end, the habitat models developed in this study reveal two key aspects for
determining which floodplain habitats should be given higher conservation priority. First, fish
presence is dependent upon floodplain lake habitats containing deep areas that appear to provide
protection during low water events. Second, survival and recruitment of small floodplain fishes
(and juveniles of larger species) is closely linked to macrophyte refugia habitats (Delariva et al.,
1994; Agostinho et al., 2007) that are highly threatened by human activities. Deeper,
macrophyte-rich lakes that persist throughout low water seasons are key habitats for floodplain
fishes, including arapaima, and may be appropriate targets for conservation.
Habitat modifications to meet the needs of rapidly-expanding human populations are
predicted to pose the greatest long-term threat to fish and fisheries of the Amazon (Saint-Paul et
al., 2000). Currently, the Amazon River contains 154 large hydroelectric dams, with another 277

22
dams planned for construction in the next few decades (Castello and Macedo, 2015; Zarfl et al.,
2015). Hydrological alterations to the natural flood pulse cycle pose a direct threat to Lower
Amazon floodplain species by disrupting the timing, duration, and volume of aquatic habitat
available during low water. Further, cattle ranching is the dominant land use on the Lower
Amazon floodplain (McGrath et al., 1993), and threatens to disrupt key floodplain habitats as
forests and vegetation surrounding lakes are removed to create pastures (Zarin et al., 2001).
Cattle in the moving littoral zone frequently graze and trample macrophyte patches (Sheikh et
al., 2006), which are crucial to survival and recruitment of young arapaima and other small
fishes. Reduction of macrophytes and riparian vegetation also results in increased soil erosion,
which decreases water clarity through increased suspended sediment loads and reduces depth as
those particulates settle out. Anecdotal information from local fishermen indicates that lakes
have become steadily shallower each year as várzea development progresses. Though these
claims have not been empirically tested, reduced depth is a likely result of the increased sediment
loads caused by deforestation near lakes.
If sustainable fisheries are long-term management goals for floodplain lakes of the Lower
Amazon, we suggest that priority be given to management practices that protect key habitats
enhancing low water survival, growth, and recruitment of valued species such as arapaima.
Alteration of the flood pulse by dams and disruption of vegetation controlling siltation threatens
to further reduce the quality of low water habitat available to floodplain fishes. If these processes
continue, there may be insufficient suitable habitat to support persistence of fish populations
critical to the economy and sustenance of the Lower Amazon’s human population.

23
Table 1.1. Habitat variable means (± standard error) for 13 sites in the Santarem region of the lower Amazon River. D.O. = dissolved oxygen,
Cond. = conductivity, Distance = distance between an observed fish and the nearest macrophytes.
Community Lake Depth (m) Relative Depth (%) Temperature (°C) pH Cond. (µS) D.O. (mg/L) Secchi (cm) Distance (m)
Tapara-Miri TM1 0.40 ± 0.07 0.50 ± 0.09 33.75 ± 0.34 6.54 ± 0.03 43.0 ± 0.5 6.47 ± 0.07 0.03 ± 0.00 151.8 ± 43.1
Tapara-Miri TM2 1.21 ± 0.05 0.55 ± 0.02 31.16 ± 0.18 6.83 ± 0.07 44.0 ± 0.3 5.50 ± 0.26 0.24 ± 0.00 55.3 ± 18.1
Tapara-Miri TM3 1.50 ± 0.01 0.84 ± 0.01 30.53 ± 0.15 6.10 ± 0.02 54.0 ± 0.9 1.54 ± 0.18 0.78 ± 0.03 8.3 ± 2.5
Tapara-Miri TM4 1.10 ± 0.07 0.52 ± 0.03 30.71 ± 0.08 6.98 ± 0.04 52.0 ± 0.5 5.62 ± 0.23 0.16 ± 0.01 56.4 ± 14.2
Santa Maria SM1 1.28 ± 0.02 0.71 ± 0.02 31.27 ± 0.06 6.52 ± 0.02 48.0 ± 0.8 3.08 ± 0.17 0.43 ± 0.01 15.7 ± 2.4
Centro do Aripiri CDA1 2.43 ± 0.10 0.61 ± 0.03 31.70 ± 0.13 6.60 ± 0.02 62.0 ± 0.5 2.13 ± 0.13 1.18 ± 0.02 13.5 ± 3.0
Ilha do Carmo IDC1 1.29 ± 0.09 0.47 ± 0.04 31.48 ± 0.18 6.54 ± 0.04 60.0 ± 1.0 2.53 ± 0.29 0.46 ± 0.04 15.4 ± 6.1
Ilha do Carmo IDC2 0.88 ± 0.05 0.63 ± 0.04 32.43 ± 0.28 6.69 ± 0.05 75.0 ± 1.3 3.01 ± 0.36 0.29 ± 0.01 8.5 ± 4.4
Ilha do Carmo IDC3 1.48 ± 0.05 0.59 ± 0.02 29.31 ± 0.05 6.15 ± 0.01 71.0 ± 0.8 0.50 ± 0.04 0.30 ± 0.01 3.4 ± 0.6
Ilha do Carmo IDC4 1.04 ± 0.10 0.45 ± 0.05 32.30 ± 0.19 6.80 ± 0.03 63.0 ± 0.8 3.34 ± 0.24 0.31 ± 0.02 9.5 ± 3.6
Ilha do Carmo IDC5 1.01 ± 0.06 0.53 ± 0.03 33.93 ± 0.09 6.94 ± 0.03 62.0 ± 1.4 3.86 ± 0.33 0.69 ± 0.02 7.7 ± 3.2
Ilha da Sao Miguel ISM1 2.33 ± 0.37 0.44 ± 0.04 30.18 ± 0.07 7.36 ± 0.08 68.0 ± 0.5 8.39 ± 0.22 0.15 ± 0.00 33.9 ± 5.1
Agua Preta AP1 3.59 ± 0.46 0.20 ± 0.03 30.46 ± 0.06 7.10 ± 0.02 56.0 ± 0.1 3.94 ± 0.11 0.12 ± 0.00 29.2 ± 3.8

24
Table 1.2. Parameter estimates (±standard error), P-values, cumulative model
weights (Σwi) and relative importance (rank) of habitat variables in generalized
linear mixed models predicting arapaima presence in lower Amazon floodplain
lakes. Ranks range from 1 (most important) to 9 (least important). Parameter
estimates are given as standardized values, not in their respective measured units.
Variable Parameter estimate P-value Σwi Rank
Depth (m) 0.4 ± 0.16 0.0130 0.93 3
Relative Depth (%) 0.96 ± 0.24 <0.0001 1 2
Temperature (°C) -0.55 ± 0.34 0.1057 0.91 4
pH -0.09 ± 0.21 0.6636 0.32 9
Conductivity (µS) 1.48 ± 0.75 0.0503 0.65 6
Dissolved Oxygen (mg/L) -0.53 ± 0.32 0.0998 0.62 7
Secchi Depth (cm) -2.21 ± 1.01 0.0281 0.85 5
Distance from Cover (m) -0.15 ± 0.19 0.4311 0.36 8
Community 1 1
Centro do Aripiri 6.62 ± 3.73 0.0761 Ilha do Carmo -0.08 ± 1.14 0.9422 Santa Maria 4.16 ± 1.11 0.0002 Sao Miguel -2.32 ± 0.78 0.0031 Tapara-Miri 1.2 ± 1.15 0.2970
Table 1.3. Habitat variable means (± standard error) for three size-classes of arapaima and Tukey Honest
Significant Difference (HSD) pairwise comparisons across the three size classes assessed: small (S), medium
(M), and large (L). HSD Columns show the p-values for pairwise tests between size classes for each variable.
Bold p-values are significant.
Variable Small Medium Large HSD S-M HSD S-L HSD M-L
Depth (m) 1.38 ± 0.06 2.25 ± 0.21 1.73 ± 0.14 0.3955 0.8351 0.7085
Relative depth 0.66 ± 0.02 0.65 ± 0.03 0.65 ± 0.02 0.3991 0.9417 0.5610
Temperature (C) 30.78 ± 0.13 30.71 ± 0.15 30.78 ± 0.11 0.8346 0.3500 0.7104
pH 6.47 ± 0.03 6.64 ± 0.06 6.61 ± 0.06 0.5620 0.1024 0.5885
Conductivity (µS/cm) 58.33 ± 1.31 61.02 ± 1.09 57.80 ± 1.14 0.6407 0.5643 0.9965
Dissolved oxygen (mg/l) 2.30 ± 0.22 2.83 ± 0.31 3.18 ± 0.32 0.2548 0.3243 0.9734
Secchi Depth (cm) 0.39 ± 0.02 0.49 ± 0.04 0.45 ± 0.03 0.5060 0.2802 0.9301
Open water distance 12.96 ± 2.09 29.07 ± 3.13 30.33 ± 2.94 0.0332 0.0058 0.8597
25
Figure 1.1. Map of the lower Amazon region depicting fishing community boundaries and
sampling locations.
Figure 1.2. Schematic representation of a typical várzea lake in the lower Amazon. Solid colored
area indicates open water, stippled area indicates floating aquatic macrophytes. Surrounding
areas included patches of aningal, dry forests, and cattle pastures (not pictured). Black lines and
arrows indicate the direction and path traveled during data collection.

26
Figure 1.3. Plots showing the predicted probabilities of arapaima presence based on each of the
eight habitat predictors measured. All plots are scaled based on the standardized estimates for the
spatialized variables. 95% Confidence intervals are shown in gray.
Figure 1.4. Plot showing standardized effect size and relative importance to arapaima occurrence
for each of the eight habitat variables measured. Error bars for each point show 95% confidence
intervals for estimates.

27
Figure 1.5. Quantile plot of distance from nearest cover for small, medium, and large arapaima.
Small arapaima were significantly different from medium and large arapaima, while medium and
large arapaima were not significantly different from each other.

28
Chapter 2. A landscape approach to modeling resource abundance in social ecological systems:
a case study of arapaima fisheries in the Lower Amazon River
Abstract
Understanding patterns of sustainable use for natural resources governed by community-
based management (CBM) schemes is a topic of increasing research interest. Social ecological
systems (SES) frameworks have been a popular method for interdisciplinary research linking
human and environmental influences to resource systems. However, few studies have
quantitatively linked human and ecological variables in a spatially-explicit manner to assess
patterns of resource abundance and management outcomes. The goal of this study was to
examine the effects of three factors (human governance, landscape habitat, and spatial structure)
on abundances of arapaima Arapaima spp. and determine the extent to which each effect controls
abundance when considered simultaneously. Three independent linear models were developed
relating governance, landscape habitat, and spatial structure to arapaima abundances in dry
season lakes, and variation partitioning was used to examine the unique and joint influences of
the three models. All three models explained large proportions of the variability observed in
arapaima abundances. Governance and habitat contributed equally in explaining variability, and
overlapped significantly when considered simultaneously. Spatial structuring was a significant
influence on governance, habitat, and variability in arapaima abundances. This study reveals that
patterns of resource abundance are strongly influenced by human, environmental and spatial
effects, and researchers should be wary of assessments excluding any individual component.
Failing to simultaneously model all three components may lead to overestimations of the
importance of individual factors in controlling resource abundance.
29
Introduction
Sustainable use of natural resources necessitates an interdisciplinary approach to describe
human and environmental interactions because single disciplines cannot provide a complete
understanding of the complex nature of environmental problems. In order to describe complex
environmental problems, researchers have increasingly relied on frameworks like the social-
ecological systems (SES) model (Ostrom, 2009), which guides assessments of the
multidimensional components contributing to sustainable resource use and management. Recent
studies have shown that many SES studies focus mainly on social aspects and fail to sufficiently
incorporate important ecological variables into assessments of resource systems (Epstein et al.,
2013; Leslie et al., 2015; Vogt et al., 2015). Similarly, ecological research has commonly
ignored integrations of human influences and environmental drivers. The prevailing lack of
effective integration of social and ecological sciences is illustrated by a recent meta-analysis of
SES research, which found that quantitative methodologies combining social and ecological
variables were present in less than 10% of 120 studies reviewed (Rissman and Gillon, 2016).
There is a need for analytical mechanisms linking SES frameworks to traditional methods of
ecological inquiry to accurately describe the underlying drivers that support sustainable
ecosystems.
A central tenet of SES is the need to match scales of ecological processes to those of
human institutions in order to facilitate governance (Wilson, 2006). Human and natural systems
are both spatially organized in relation to a multitude of complex interacting factors. For
example, fisher communities are often distributed along rivers, lakes, and oceanic coasts
following the spatial distribution of fishing grounds and fish populations. Managing these
fisheries requires allocating tasks like rule creation and enforcement at spatial scales that match

30
the geographic distribution of the harvested fish populations. Similarly, creating suitable
management rules may not be sufficient if the scale of management itself is incorrect. Here, we
test the use of proper spatial scale as a mechanism to link human and environmental drivers of
resource abundance in ways that enhance sustainable fishery management. We examine the case
of arapaima fisheries of the lower Amazon River, in the state of Pará, Brazil, because it is a well-
documented example of how community-based management (CBM) strategies can be applied to
fisheries throughout a landscape of spatially-explicit fishing communities (McGrath et al., 1993,
2008).
Understanding the role of spatial structuring in patterns of ecological datasets has been an
increasingly fundamental component of ecological research in recent decades (Legendre and
Fortin, 1989; Peterson and Parker, 1998; Borcard et al., 2004). Numerous methods are now
available to incorporate the geographic coordinates of observations directly in statistical models
relating ecological variables to species assemblages (see Legendre and Troussellier, 1988;
Legendre and Fortin, 1989; Leduc et al., 1992 for but a few of many examples). In cases where
environmental variables and species assemblages share a common spatial structure, the amount
of variation in species data they explain may be redundant, and therefore lead to overestimation
of the true proportion of variation explained when both components are included (Legendre and
Troussellier, 1988). Borcard et al. (1992) developed an approach (hereafter referred to as
variation partitioning), allowing researchers to partition the proportion of variation in a response
variable into components uniquely explained by each independent variable dataset, components
jointly explained by the datasets, and a component explained by none of the datasets (i.e.,
unexplained variation). Variation partitioning is now widely-used in ecological research, most
commonly to separate the influence of environmental and spatial variables on multivariate

31
species datasets. In these analyses, the proportion of variation explained uniquely by spatial
variables, as well as the proportion of unexplained variation (which is often high), can potentially
be explained by other variables not considered in the model (Borcard et al., 1992). Though it
seems likely that human influences on species assemblages may be important contributors to the
unexplained variation or the uniquely spatially-explained variation, ecological studies frequently
do not incorporate human variables into modelling of species patterns (Rosa and Dietz, 1998;
Liu et al., 2007).
Research linking human effects to environmental systems often utilizes a different
approach to considering the spatial effects, in which spatial scaling is primarily defined in terms
of hierarchical human institutions managing natural resources (Cumming et al., 2006) (Figure
2.1). In ideal systems, the human institutions governing natural resources are matched to the
resources at the most effective scale (Folke et al., 2005). For example, a federal government
would likely be an inappropriately large institution for developing specific rules regarding an
individual lake fishery, while a thousand individual community groups throughout a country
would be too unwieldy to conduct international agreements governing trade with other countries.
In this sense, nested tiers related to spatial scale of human organizations and natural resource
systems are an integral part of social science research, but they do not incorporate the
quantitative spatial effects of resource systems into models as explicitly as variation partitioning
in ecological studies. Interdisciplinary research linking human and environmental effects in SES
is largely skewed in favor of social science approaches (Epstein et al., 2013; Vogt et al., 2015),
which has resulted in many of the resulting models considering spatial effects in a less
quantitative manner than may be warranted.
32
This study uses arapaima (Arapaima spp.) fisheries to examine the usefulness of spatial
structuring variables to elucidate the interactive effects of community-based management and
landscape-scale habitat factors on the distribution and abundance of this highly-exploited fish
taxa. Arapaima are historically the most important fish to Amazon fisheries. They are most
commonly found in floodplain lake systems, where they migrate seasonally among several
floodplain habitats, including shrub, forest, and macrophytes, in response to water level
variations. In Brazil, management of arapaima in these environments has historically devolved
into a typical ‘tragedy of the commmons’ (Hardin, 1968) situation enabled by an open-access
regime in which all citizens have equal rights to use aquatic resources. The Brazilian government
has attempted to reverse declining arapaima population trends by establishing minimum size
limits (1.5 m total length (TL)), closed seasons (December–May), and even moratoria in some
states. These top-down regulations have proven largely ineffective as the federal and state
institutions implementing them lack sufficient local-scale monitoring and enforcement resources
(McGrath et al., 1993). As a result, as much as 77% of arapaima catches are illegal (Cavole et al
2015), and in many areas arapaima populations are widely overexploited and even depleted to
the point of localized extinctions due to their high economic value (Castello et al., 2015a).
Successful arapaima management now depends largely on cooperative, bottom-up, CBM
schemes in which higher levels of government (i.e., state and federal agencies) place control of
fishery resources in the hands of local users (McGrath et al., 2008; Castello et al., 2009). The
difference in the spatial scale of these management approaches is striking. For example,
management rules like the moratorium on arapaima fishing in the State of Amazonas applied
across the entire 1.5 million km2 area of the state, but were enforced by only a handful of
government employees. By contrast, local scale CBM schemes operate at a community level

33
(generally ~ 25 km2), and are enforced by the community members. In these CBM systems, local
fishers self-impose closed seasons, gear restrictions, and size limits of catch in order to increase
the abundance of local fish populations and to address concerns over food and income security.
When implemented successfully, arapaima CBM caused up to 23-fold increases in population
sizes within a decade of implementation, in part due to the biological traits of arapaima which
confer to them high rates of population growth (Castello et al., 2011). These CBM systems
provide a unique opportunity for understanding the relationships between management and
environmental factors resulting in sustainable fisheries use. The combination of the arapaima’s
high economic value and their fast population responses to conservation measures makes CBM
an ideal system for studying the relationships between people, resources, and landscapes in SES.
In order to test the use of spatial structuring as a mechanism to link and compare the
relative magnitudes of human and environmental factors affecting arapaima population size, we
(1) develop independent quantitative models of arapaima population size as a function of
landscape, governance, and spatial factors, and (2) utilize variation partitioning to assess the
variation in fish abundances that can be explained uniquely and jointly by each of the three
components. We expect that the combined model incorporating human, environmental, and
spatial influences will provide significantly improved explanatory power as compared to models
of individual components. Strongly shared variation between all three components would suggest
that space plays an important role in structuring landscape and governance factors. Determining
the magnitude of influence from each component is an important step in facilitating continued
sustainability of successful CBM systems and in developing measures to promote sustainability
in areas where populations are currently depleted.
Study Area

34
The study was conducted in floodplain habitats along approximately 180 river km of the
lower Amazon River in Pará State, Brazil (Figure 2.2). The lower Amazon ecosystem comprises
the nutrient-rich waters of the main river channel flanked by seasonally-flooded habitats,
including forested levees, grasslands, and a series of lake networks in the floodplain interior.
Though the floodplain was once heavily forested, habitat alteration is now prevalent; 56 % of the
floodplain was deforested between 1970 and 2008 (Renó et al., 2011). The yearly change of river
height from dry season to flood season is ~ 7 m (Sioli, 1984). In the dry season, aquatic habitats
are limited to the main river channel and permanent floodplain lakes (Figure 2.3) at their lowest
water levels (hereafter, “dry season lakes”). During the rising water period (approximately
December through May), the waters within main river channels progressively rise, flooding the
surrounding habitats and continuously expanding across the landscape until the peak flood stage,
at which point the lower Amazon comprises a single aquatic landscape. The seasonally-flooded
zones flood based on topography, beginning with low-lying grasslands habitats containing
numerous perennial semi-aquatic macrophyte species (Table 2.1). Shrub and forested habitats are
the next areas to flood, followed finally by mid- to high-elevation grasslands – many of which
are denuded areas formerly containing forests. Each habitat type provides forage, refugia, and
reproductive habitats for many floodplain fishes (Goulding, 1980; Goulding et al., 1996).
Following peak flood stage, during which fishes occupy these highly productive seasonal
habitats, the process reverses. As water levels decline from August to December, floodplain
habitats shrink until once again the only aquatic habitats remaining are the main river channels
and dry season lakes.
Fisheries in the lower Amazon constitute a significant proportion of the local economy
and also play a vital role as a protein source for much of the human population. The majority of
35
commercially-important Amazon fishes utilize river-floodplain habitats throughout the year
(Castello et al., 2013), where they take advantage of the seasonality in resource availability
driven by the flood pulse (Lowe-McConnell, 1987; Castello, 2008a). During the flood season,
floodplain fishes occupy the highly productive flooded forest habitats adjacent to lakes
(Goulding, 1980), where predation risk is low owing to the diffuse concentrations of prey species
throughout refugia (Saint-Paul et al., 2000). As waters recede into the dry season, fish are forced
to migrate out of the floodplains into either permanent lakes or main river channels. Decreased
habitat availability during the dry season results in a concentration effect for many populations,
leaving them susceptible to overfishing. Fishing pressure is maximized during the dry season to
exploit these concentrated populations, making governance an important driver of long-term
fishery sustainability.
Managing the floodplain fisheries of the lower Amazon has traditionally been
problematic due to the open-access nature of fishing grounds established by Brazilian law.
Local-scale attempts by individual communities to conserve or manage fishing grounds were
thwarted by city-based and commercial fishers, who quickly depleted thriving stocks (Smith,
1985; Almeida et al., 2001). In response to the growing issue of floodplain resource use, CBM
schemes multiplied in the region, taking two main forms: fishing agreements, which occur in ~
40% of local communities, and Agro-extractivist Settlement Projects (known as ‘PAEs’), which
occur in ~60% of communities. Fishing agreements were established in the 1990s through
collaborations between local communities, government agencies, and non-governmental
organizations. Fishing agreements consist primarily of rules – recognized by higher levels of
government – restricting fishing gear, locations, and seasons within local fisheries. These
restrictions make fishing in such areas unappealing to non-local, city-based fishers, effectively
36
restricting access to only those local fishers willing to harvest under the established regulations.
PAE communities have collective land concessions, which were formally established in 2011 in
cooperation with the Brazilian agrarian reform agency as a means for sustainably managing
natural resources within their respective areas (McGrath et al., 2008). Both PAE and fishing-
agreement communities utilize representatives who implement fishing rules and bring unresolved
issues from the community level to the Regional Fisheries or PAE Councils, which represent the
next higher level of governance. The communities studied here range in size from 40 to 130
families, most of which rely on fishing for subsistence and income (McGrath et al., 2008).
Arapaima are a primary focus of CBM schemes in the region because they have high
social, cultural, and economic value, and they possess several life history traits conducive to
bottom-up conservation schemes. Arapaima have historically been overfished, as they possess
high market prices, grow to three meters in length and 200 kg in weight (Castello and Stewart,
2010; Castello et al., 2015b), and are easy targets for fishermen because they must surface every
15 minutes to breathe air. Recent arapaima population recoveries achieved by CBM schemes
have shown great promise (Castello et al., 2009, 2011; Arantes et al., 2010). CBM schemes for
arapaima have thus become increasingly popular in the region.
Methods
For the lower Amazon region near Santarem, we developed a comprehensive dataset
including arapaima population data for 73 floodplain lakes, satellite-derived data on habitat
classifications and macrophyte presence, and eight indicators of governance measured for 83
floodplain fishing communities. To model arapaima population sizes in floodplain lakes as a
function of landscape, governance, and spatial factors, we first identified sets of candidate
37
explanatory variables based on previous research. We developed quantitative indicators of each
variable identified that could be measured for each of 73 floodplain-lake arapaima populations
throughout the study area. We used model selection procedures to identify the most important
landscape and governance variables. In order to assess the role of spatial structuring as a linking
mechanism for the governance and landscape factors, first we developed an independent spatial
model of arapaima abundance using principal coordinates of neighbor matrices (PCNM)
analysis. Then, we integrated the spatial, landscape, and governance models using variation
partitioning analysis to quantify the unique and joint contributions made by the three models in
terms of explaining variability in arapaima abundance across all lakes.
Arapaima abundance data
We estimated arapaima population sizes in 73 floodplain lakes using data collected from
arapaima management censuses conducted from 2004 – 2014 (Figure 2.5). Arapaima are unique
among highly-exploited floodplain fishes in that their obligate air breathing facilitates a
relatively simple, inexpensive method for determining population sizes. Trained fishers observe
lakes for a set time and visually count the number of adult and juvenile arapaima surfacing to
breathe using the standardized method of Castello ( 2004). Population estimates using this
methodology have been found to vary within ~ 10% of true values (see details in Castello 2004).
We assembled arapaima population data records from the Instituto de Pesquisa Ambiental da
Amazonia (IPAM), who has collected these data together with communities, NGOs, and
researchers during the dry season, when arapaima populations are confined to the isolated dry
season floodplain lakes prevalent throughout the region (Castello et al., 2015b). We accounted
for inter-annual variability in abundances by using the average census count over multiple years,
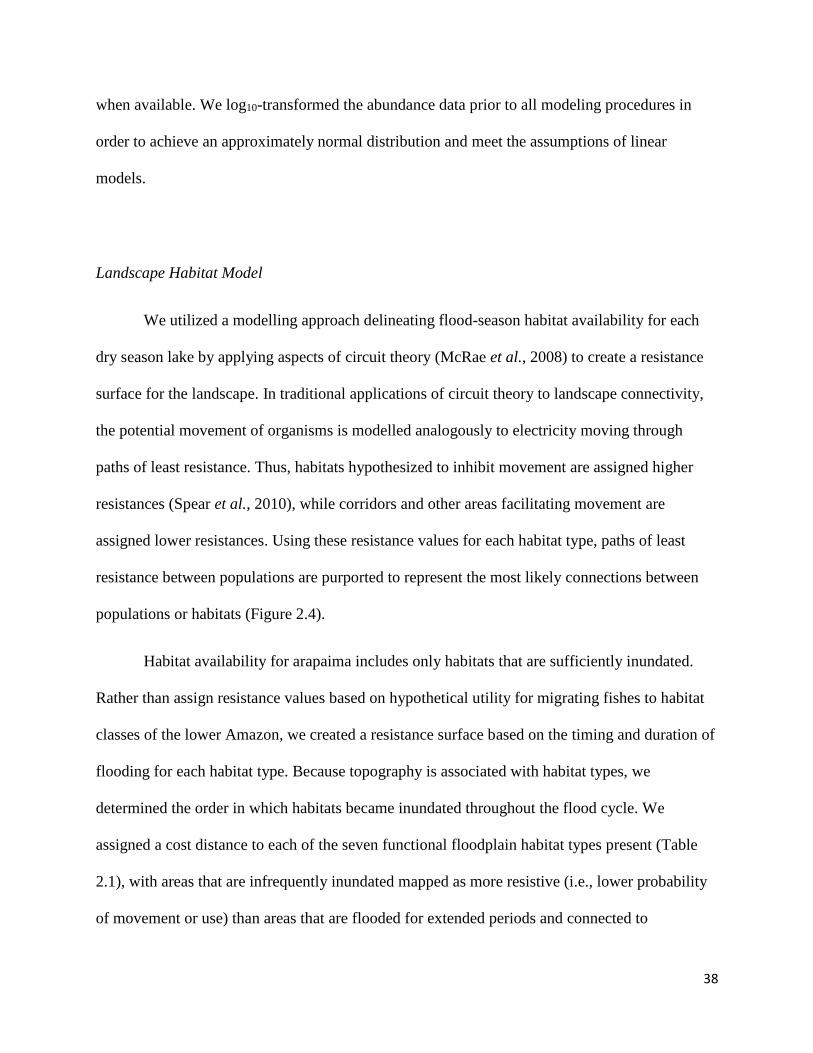
38
when available. We log10-transformed the abundance data prior to all modeling procedures in
order to achieve an approximately normal distribution and meet the assumptions of linear
models.
Landscape Habitat Model
We utilized a modelling approach delineating flood-season habitat availability for each
dry season lake by applying aspects of circuit theory (McRae et al., 2008) to create a resistance
surface for the landscape. In traditional applications of circuit theory to landscape connectivity,
the potential movement of organisms is modelled analogously to electricity moving through
paths of least resistance. Thus, habitats hypothesized to inhibit movement are assigned higher
resistances (Spear et al., 2010), while corridors and other areas facilitating movement are
assigned lower resistances. Using these resistance values for each habitat type, paths of least
resistance between populations are purported to represent the most likely connections between
populations or habitats (Figure 2.4).
Habitat availability for arapaima includes only habitats that are sufficiently inundated.
Rather than assign resistance values based on hypothetical utility for migrating fishes to habitat
classes of the lower Amazon, we created a resistance surface based on the timing and duration of
flooding for each habitat type. Because topography is associated with habitat types, we
determined the order in which habitats became inundated throughout the flood cycle. We
assigned a cost distance to each of the seven functional floodplain habitat types present (Table
2.1), with areas that are infrequently inundated mapped as more resistive (i.e., lower probability
of movement or use) than areas that are flooded for extended periods and connected to

39
surrounding aquatic habitats. Using this information, we delineated an “accessible” landscape
around each dry-season lake based on the accumulated cost distance along all possible paths until
a specified cutoff value was reached. The cutoff value reflected arapaima movement ranges
described by Crossa (2003).
For each landscape delineated around a dry-season lake, we used Geographic Information
System (GIS) software (ArcMap 10.2.2) and Fragstats (version 4.2.598) (McGarigal et al., 2012)
to calculate landscape metrics describing the composition and arrangement of floodplain
habitats. We calculated three parameters (Table 2.2) for each habitat type (Table 2.1) to
quantitatively describe the composition and arrangement of floodplain habitats. These
parameters were selected based on previous knowledge of arapaima habitat associations
(Castello, 2008a; Arantes et al., 2013; Richard, 2016): Class Area (CA), Clumpiness
(CLUMPY), and the area-weighted mean Euclidean Nearest Neighbor distance (ENNAM)
between patches of the same type.
Macrophyte patch distribution was based on a 30-m resolution dataset of
presence/absence collected during the rising water phase of the flood pulse (when macrophyte
presence is maximized) over a five year period coinciding with the collection of the arapaima
density data (2007 – 2011). We classified locations into three groups for analysis: areas where
macrophytes were never present, areas where macrophytes were present irregularly (one to three
out of five years observed), and areas where macrophyte stands consistently developed (four or
five out of five years observed). The two parameters calculated for macrophyte coverage were
Percentage of Landscape (PLAND) and Clumpiness (CLUMPY).
Following calculation of the 27 potential variables ([7 habitat types x 3 parameters] + [3
macrophyte classifications x 2 parameters]), variables were selectively omitted if they were

40
deemed nonsensical (e.g., main channel areas always comprised a single patch, making ENN-
AM meaningless for channel habitats). We then screened the remaining candidate variables and
removed variables for multicollinearity based on a maximum allowable r > |0.7|. Six variables
were removed from consideration, and subsequent model selection procedures were conducted
using 21 candidate landscape habitat variables. A subset of the best landscape habitat predictors
of arapaima abundance was developed using an information theoretic (IT) approach based on the
stepwise-forward variable selection in the stepAIC function from the MASS package (Venables et
al., 2002) of R (Version 3.2.3) (R Core Team, 2014). We started with a null model containing no
landscape variables and added the variable that resulted in the greatest reduction in Akaike’s
Information Criterion (AIC). Variables were iteratively added until no further reduction could be
obtained, at which point the model represented the best explanation of variation in arapaima
abundances that could be obtained from the considered landscape variables.
Governance Model
In order to model arapaima abundances as a response to governance factors, we used data
from Arantes et al. (2016) on a set of eight governance factors hypothesized to influence the
abundance of arapaima in floodplain lakes. Governance factors reflected the eight institutional
design principles proposed by Ostrom (1990). Research on these principles over recent decades
has led to the widely accepted conclusion that they are well-supported by empirical evidence
(Cox et al., 2010). The foundation of Ostrom’s principles includes the presence of a series of
factors, including well-established resource system boundaries, autonomy of users to create and
adapt governance rules at a local scale, capability of monitoring the resource and behavior of
users, punishments for rule offenders that increase with the frequency and severity of

41
transgressions, and affordable means of conflict resolution for disputes. Adherence to these
principles was measured for all communities in which we had arapaima abundance data (each
principle is summarized in Table 2.3). Data for each principle were measured using indicators
that were developed specifically for understanding the influence of Ostrom’s design principles
on the abundance of arapaima in dry season lakes. We screened and removed variables for
multicollinearity based on a maximum allowable r > |0.7| and each of the remaining variables
was assessed for normality. Two of the eight variables in the CBM data matrix (I7 and I8) were
excluded from the analysis because they were singular (i.e., all values were the same) for the
communities assessed by this study. Each variable was then considered as a potential candidate
for inclusion in models relating measures of governance to arapaima abundances. We followed
the same IT approach described for the landscape habitat models, using stepwise-forward
variable selection, to determine a best subset of governance variables.
Spatial Model
To assess the extent to which arapaima population sizes in dry season floodplain lakes
were spatially correlated, we conducted a Principal Coordinates of Neighbor Matrices (PCNM)
analysis using the PCNM function from the PCNM package (Legendre et al., 2013) of R. PCNM
analysis models the spatial arrangement of the data points (dry-season lakes) within the
landscape based on their geographic coordinates by creating quantitative descriptors (PCNM
axes) that can be statistically modeled alongside other variables. The analysis utilized in this
study was conducted following standard procedures for PCNM, in which the threshold distance
for defining sites as neighbors was truncated to the minimum distance needed to keep all sites
connected. Pairwise distances between sites greater than this cutoff value were calculated as four
times the cutoff value. Variable selection procedures were not utilized for determining a best
42
subset of spatial variables because the PCNM axes collectively represent the spatial structuring
in the dataset at different scales. Instead, all positive and significant eigenvectors (p < 0.05)
calculated from the pairwise matrix of site locations were retained as variables representing the
spatial component of the dataset.
Variation Partitioning
To assess the variation in arapaima abundances that can be explained uniquely and jointly
by each of the three components, we conducted variation partitioning using the varpart function
from the vegan package (Oksanen et al., 2015) of R. We then used partial linear regression to
estimate the proportions of variation in arapaima abundance (measured as adjusted-R2) uniquely
attributable to each set of explanatory variables after the other sets of variables were taken into
account (Legendre and Legendre, 2012). The total inter-lake variation in arapaima abundances
was partitioned into eight independent components: (i) three ‘pure’ components explained
uniquely by landscape habitat, governance, or spatial variables, (ii) three two-way ‘shared’
components consisting of the proportion of variation shared by each pair of the three data
matrices independent of the third, (iii) one three-way interaction of the variation ‘shared’ among
all three data matrices, and (iv) unexplained variation, which is the fraction explained by none of
the three matrices. Large proportions of variation explained by the pure components would
indicate that they possess high individual relative importance, while large proportions shared
with space would indicate the importance of spatial structuring in determining the influence of
governance or habitat variables. Because the union of three independent models’ results involves
a large number of variables included in the overall model, all correlations were reported using
adjusted-R2 to penalize over-fitted models.

43
After computing the proportion of variance uniquely attributable to each of the three data
matrices, we calculated standardized partial regression coefficients and partial r2 (Neter et al.,
1996) to compare the relative importance of individual variables within each matrix. We
determined these values by regressing the variables from each data matrix on the residuals
obtained from a regression of the other two matrices on the abundance of arapaima. This residual
analysis enabled us to examine the individual components of each model contributing uniquely
to the overall explanation of variance.
Results
Landscape, Governance, and Spatial Models
Model selection procedures relating landscape habitat variables to arapaima abundances
yielded a five-variable model consisting of shrub habitat aggregation, inter-patch distance for
forest habitats, total dry-season lake area, and aggregation of both regularly- and irregularly-
present macrophyte patches (Table 2.4). Of these, only aggregation of irregularly-present stands
of macrophytes was non-significant (p = 0.10). Aggregation of shrub and regularly-present
macrophyte patches were both positively correlated with arapaima abundances (i.e.,
concentrations of these habitat types into large, uniform patches was associated with higher
arapaima abundance), while forest inter-patch distance and total lake area were negatively
correlated with abundances (i.e., landscapes with larger volumes of open lake habitat and longer
distances between patches of forest contained fewer arapaima). The five-variable landscape
habitat model explained 51.3% of the variation in arapaima abundances among lakes.
The governance model comprised three of the six variables considered: collective action
arrangements (I3), monitoring system (I4), and graduated sanctioning (I5). I4 was highly

44
correlated with both defined boundaries (I1) (r2 = 0.72) and congruence between rules and local
conditions (I2) (r2 = 0.90), thus only I4 was included during model selection procedures. I3 and
graduated sanctioning (I5) were best modeled as ordinal variables containing three levels,
therefore the final governance model contained five variables describing three governance
factors. All factors included in the governance model were positively and significantly correlated
with arapaima abundances (Table 2.4), and they collectively explained 51.8% of variation in
arapaima abundances.
PCNM analysis of the spatial components yielded 42 total eigenvectors (PCNM axes). Of
these, the spatial factors model comprised only the ten PCNM axes that were both positive and
statistically significant. Five of the ten axes included in the model were significantly correlated
with arapaima abundances (Table 2.4).
Variation Partitioning
The full model combining all variables selected for the three individual models included
20 variables (10 spatial PCNM axes, five landscape habitat variables, five governance variables)
and explained 71.0% of variation in arapaima abundances (Figure 2.6). Individual landscape and
governance models were relatively balanced, containing five variables each and providing
similar explanatory power. The landscape habitat model contributed a unique 13.0% explanatory
power when governance and spatial factors were considered, and shared 7.8% with spatial
factors independent of the governance variables. Governance variables uniquely contributed
12.0% explanatory power when spatial and landscape factors were considered and shared 9.2%
with spatial factors independent of the landscape factors. The spatial factors model alone
45
explained 44.3% of variation in arapaima abundances, but contributed no unique explanatory
power. The single largest component of explanatory power was the three-way shared intersection
between the landscape, governance, and spatial models, with 28.7% variation explained. The
shared variation between landscape habitat and governance variables was just 2% when
considered independently of space, but was 29% when also shared with spatial variables.
Discussion
The analysis yielded two key findings explaining the variation in arapaima abundances
throughout the study area. First, as evidenced by the large (29%) three-way component of shared
variability, spatial structuring played an important role in the individual components controlling
arapaima abundance. Second, arapaima abundances were explained equally by landscape habitat
and governance variables, both when modeled alone (51.3% and 51.8%, respectively and
together (13.0% and 12.0%, respectively). Considering either the governance or landscape
habitat variables independently would lead to overestimations of variable importance, as
modeling them together revealed that a large proportion of the variation explained (31%) was
shared between the two. Further, when spatial variables representing spatial structuring were
included as a third component to the human-environmental model, the overwhelming majority of
the shared explanatory power (29% of the total 31% shared) was explained as a common spatial
structuring shared between the variables. Accounting for spatial structuring also changed the
relative importance of individual variables within each of the component models. For example,
while graduated sanctioning (I5) and average inter-patch distance for forests (ENNAM-Forest)
had the smallest and second smallest coefficients in their respective individual models, they were
the largest contributors to the unique variability explained by their components in the combined

46
partitioning analysis (i.e., after space was accounted for, they become the most important
variables). Failing to calculate a unified model simultaneously assessing governance, landscape
habitat, and spatial effects would therefore not only have led to overestimation of the importance
of each component, but would also result in incorrect identification of the most important
individual landscape or governance variables. It would seem, therefore, that spatial analysis does
serve as a mechanism to frame simultaneous analysis of human and environmental variables.
The landscape habitat features found to influence arapaima abundances provided further
evidence of the importance of spatial structuring. Four of the five variables selected were related
to the arrangement of habitats within the landscape, rather than volumes or percentages of habitat
types. Landscapes can be characterized in terms of the area, volume, and the spatial arrangement
of those patches (Turner, 1989; Dunning et al., 1992), thus factors such as total habitat area may
be less important in sustaining populations than the arrangement or connectivity of key habitat
types (Taylor et al., 1993). The strongest landscape habitat predictors of arapaima abundances
were average inter-patch distance for forests habitats (ENNAM-Forest, standardized regression
coefficient = – 0.87, p < 0.0001) and aggregation of shrub habitats (CLUMPY-Shrub,
standardized regression coefficient = 0.88, p <0.0001). Flooded forests and shrubs are known to
be important habitats for arapaima (Castello, 2008a, 2008b). Arapaima build nests near lake
margins under forested levees during the rising water period. Following spawning, male
arapaima guide the newly-hatched young throughout the flooded forest areas for several months,
where they grow and feed on the rich nutrients provided from fruits, insects, and fish of the
forests (Queiroz, 2000; Castello, 2008a, 2008b). Shorter distances between forest patches would
provide arapaima enhanced opportunities to forage throughout a variety of forest areas,
particularly when attempting to minimize exposure of newly-hatched young to higher currents

47
and avian predators associated with open water areas. Similarly, large aggregated patches of
flooded shrub habitats likely supply fruitful foraging areas for arapaima, while also providing
refugia from predators for smaller individuals.
Floating macrophytes had a positive effect on the abundance of arapaima. They are
known to be important habitats for arapaima, particularly during earlier life stages when they are
utilized more frequently (Richard, 2016). The bulk of prey items for arapaima < 1 m TL
comprises insects, molluscs, and crustaceans found among the root zones of macrophytes
(Queiroz, 2000). The aggregation of regularly- and irregularly-present macrophyte areas
(CLUMPY-RegMacro, CLUMPY-IrrMacro) was positively related to arapaima abundances,
though only CLUMPY-RegMacro was statistically significant (p 0.0106). The only habitat
variable best modeled in terms of volume alone was total lake area (CA-Lake), which was
negatively correlated with arapaima abundances. Previous studies have shown that larger
arapaima populations are found in larger, deeper lakes (Arantes et al., 2013; Richard, 2016), but
it is important to note that CA-Lake is a measure of total open water lake area within the
landscape, not the size of an individual lake containing arapaima. The negative correlation with
total lake area found here is likely related to the fact that larger lakes in the area are more
frequently visited by commercial fishermen, making them contentious areas where conflict over
CBM rules has resulted in depleted catches for all species (Isaac and Ruffino, 2007). It is also
possible that in areas where dry-season lakes are abundant, the total concentration of arapaima
may be diffuse when compared to a landscape containing only 1-2 suitable lakes, which could
result in the observed negative relationship between arapaima abundance and CA-Lake. All other
significant relationships between arapaima abundances and landscape habitat indicated that
larger, more aggregated habitat patches of macrophytes, shrubs, and forests supported larger

48
populations. Our findings align with previous studies, which have shown that vegetated
floodplain habitats such as flooded forests, shrubs, and macrophytes are important for floodplain
fish growth, survival, and reproduction (Fernandes, 1997; Castello, 2008a; Arantes et al., 2013).
The flooded vegetation of the Amazon provides some of the most biologically-productive
habitats in the world (Goulding et al., 1996), therefore it makes sense that arapaima and other
fishes would likely thrive in landscapes providing large aggregations of shrubs, forests, and
macrophytes. These habitats control numerous factors influencing floodplain fish distribution,
including dissolved oxygen concentrations, food resource availability, and predation success
(Agostinho et al., 2007).
We identified collective action arrangements (I3), monitoring system (I4), and graduated
sanctioning (I5) as key components of community governance directly associated with arapaima
population sizes. These three components of governance established that arapaima populations
were monitored, rules regarding arapaima fishing were created with participation from all
community members, the rules were enforced by the community members themselves, and
punishments were enforced for rule-breaking individuals. The strong collective presence of these
mechanisms resulted in higher arapaima abundances, as it has been widely demonstrated to do in
other studies of fisheries governance (Pomeroy and Williams, 1994; Berkes, 2007). Collective
action arrangements resulting in the participation of all users affected by fishery rules is an
important element of success in CBM schemes (Pollnac et al., 2001; Pomeroy et al., 2001).
Aside from the importance of including all users as a means of supporting participation in the
governing process as a while, collective action arrangements benefit CBM by allowing local
users to incorporate their knowledge of the resource system into the governance process (Berkes
et al., 2000; Cox et al., 2010). Consistently, fairly, and objectively enforcing management rules

49
is an important element of success for fisheries CBM (Pomeroy et al., 2001), as reflected by the
presence of monitoring systems in the governance model for arapaima abundance. Participation
by fishers in the monitoring programs creates a situation where guards are incentivized to
prevent rule-breaking, as they directly benefit from the increased availability of the resource
when rule-breaking is prevented. In tandem with monitoring systems, graduated sanctioning is an
important component of fisheries governance. Consistently enforced penalties that are scaled to
match the severity of rule-breaking instances are important for maintaining community cohesion
while also appropriately punishing severe cases (Cox et al., 2010).
It is critical to note that while our statistical and spatial analyses enabled us to create a
comprehensive modeling assessment, the variables not selected for inclusion in the individual
governance model may still play an important role. Minimum recognition of right to organize
(I7) and nested enterprises (I8) were excluded from the statistical model because there was no
variation in their measured values. However, right to organize (I7) and nested enterprises (I8)
were both strongly present in all communities, and are an important precursor to the
development of CBM governance. Similarly, defined boundaries (I1), congruence between rules
and local conditions (I2), and collective action arrangements (I6) were excluded from the model,
but their correlation with variables that were included in the model suggests that they function in
concert with other mechanisms to promote successful governance.
The PCNM model was developed using a cutoff value of ~ 14.5 km (corresponding to the
minimum distance needed to keep all sites connected). Further analysis of the spatial model
revealed that contributions from the individual components, as well as total variation explained
in the full partitioning model, could be influenced by altering the cutoff value in the PCNM
calculations. Relative component contributions and total variation explained were stable at

50
values greater than the cutoff used. However, when the cutoff was reduced to a value that failed
to keep all sites connected, individual contributions and total variation explained were sensitive
to the particular value of the cutoff selected. Future work should explore the potential for spatial
analysis across a range of scales to elucidate the changing contributions of human and
environmental drivers to SES.
Conservation Implications
Considered alone, any one of the three datasets could have provided reasonable
explanatory power for managers attempting to understand the factors controlling arapaima
abundance – particularly if additional variables had been introduced to further reduce the
unexplained variation. A powerful spatial-only model would lend credence to the presence of
underlying metapopulation dynamics effects, in which strong populations occur in spatially-
clustered “hotspots”. Resultant management strategies would likely focus on the importance of
individual populations in maintaining arapaima throughout the landscape. If only human effects
were considered, the strength of the governance model would support the notion that governance
is the primary factor controlling arapaima abundance, and as such, environmental effects might
largely be ignored. Similarly, a landscape habitat-only model would likely support an ecosystem-
based conservation approach instead of incorporating human influences. While any of the above
strategies would not be entirely incorrect, they would be formulated upon an incomplete picture
of the true factors controlling abundance. Given the results obtained by incorporating all three
variable sets, arapaima management in this region would benefit from a multifaceted approach
supporting the establishment of CBM schemes with specific rules, objectives, and monitoring
programs in areas where CBM scores were low, while simultaneously promoting habitat

51
conservation and restoration in areas where important habitats (e.g., forests, shrubs, and
macrophytes) have been reduced due to ranching and agriculture.
While the specific results from this study apply to arapaima in Lower Amazon
floodplains, the methods used to obtain them should be generalizable to a variety of resource
systems. The most obvious candidates for expansion of the techniques used here are other
economically-important floodplain fish species, such as tambaqui (Colossoma macropomum),
piracatinga (Calophysus macropterus), and surubim (Pseudoplaystoma fasciatum), among
others. However, SES approaches are designed for use in a wide range of scenarios, and as such,
the approach used here for arapaima could be easily modified to address questions outside of
river floodplains or the tropics. By developing strong, independent models of human,
environmental, and spatial effects, then linking them together using variation partitioning to
understand the individual and joint contributions of each component, researchers may be able to
pinpoint the drivers of resource abundance with much higher confidence than would result from
traditional, singular approaches.
Understanding and incorporating the relationships between humans, the environment, and
space in assessments of resource systems is essential for ensuring the long-term sustainability of
natural resources. The strong overlap among habitat, governance, and spatial factors controlling
the abundance arapaima in the study suggests that dispersal, source-sink effects, and
metapopulation dynamics may act synergistically with governance and landscape habitat
influences. Unravelling the specific mechanisms and connections operating within the observed
overlap remains an important future research topic not only for arapaima, but also for many other
resource systems. Human-environmental interactions can never be fully decoupled, therefore
attempts to understand them should utilize a comprehensive approach that models them

52
simultaneously. Our results indicate that spatial analysis can serve as an effective mechanism to
link and understand humans and the environment in social-ecological systems.

53
Table 2.1. Landscape habitat classifications, descriptions, and cost distance values (resistances) used to map connectivity of habitat patches potentially used by arapaima. N/A
values occurred because the habitat classes underlying macrophyte beds were used in calculation of cost distances.
Dataset Class Name
Average % of
year flooded
Cost
Distance Description
Habitat
classification
GrasslandHi 45 7.4 Grassland habitat (areas without significant tree or shrub cover), flooded only at high water
GrasslandMid 62 6.2 Grassland habitat (areas without significant tree or shrub cover), flooded at mid water
Forest 67 5.7 Seasonally-flooded forest areas
Shrub 75 5 Shrub, short trees, or semi-shrub; includes aningais
GrasslandLow 83 4.1 Grassland habitat (areas without significant tree or shrub cover), exposed only at very low water
Floodplain Lake 100 1 Permanently flooded lakes and side channels (excluding main river channels)
River Channels 100 1 Permanent mainstem river channel
Macrophtye
presence
Never N/A N/A Locations where macrophytes were never observed
Irregular N/A N/A Locations where macrophtyes were present 1-3 out of 5 years
Regular N/A N/A Locations where macrophytes were observed 4-5 out of 5 years
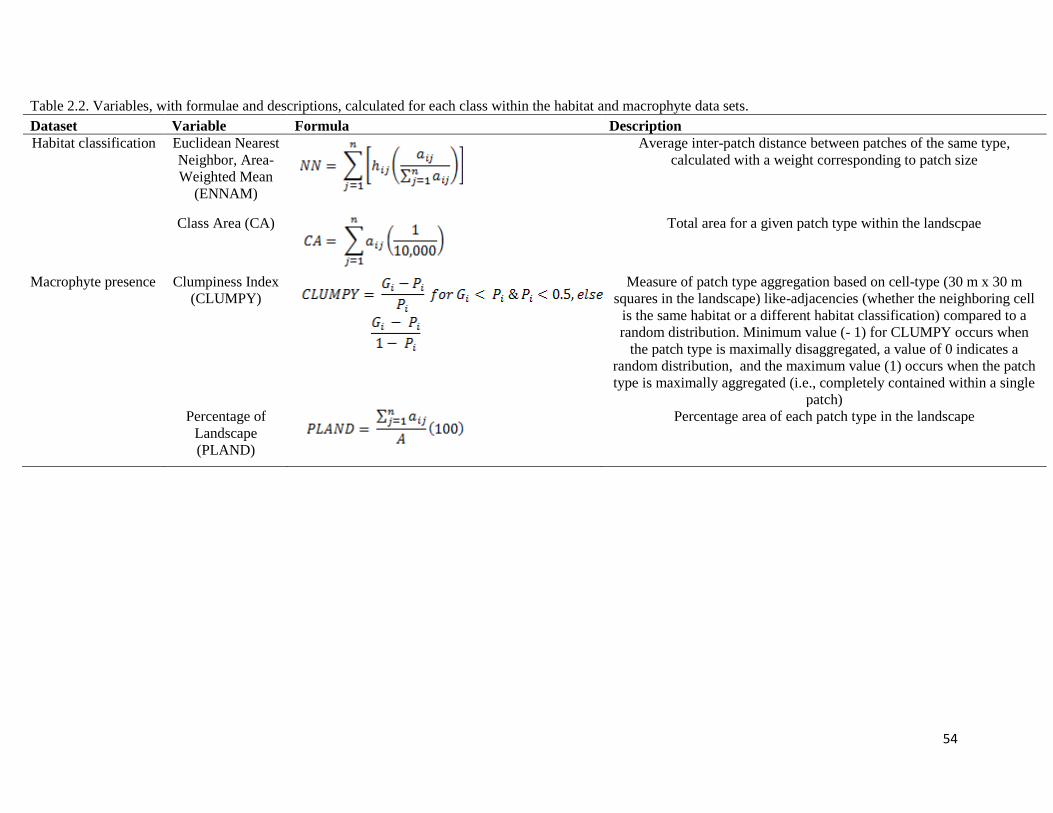
54
Table 2.2. Variables, with formulae and descriptions, calculated for each class within the habitat and macrophyte data sets.
Dataset Variable Formula Description
Habitat classification Euclidean Nearest
Neighbor, Area-
Weighted Mean
(ENNAM)
Average inter-patch distance between patches of the same type,
calculated with a weight corresponding to patch size
Class Area (CA)
Total area for a given patch type within the landscpae
Macrophyte presence Clumpiness Index
(CLUMPY)
Measure of patch type aggregation based on cell-type (30 m x 30 m
squares in the landscape) like-adjacencies (whether the neighboring cell
is the same habitat or a different habitat classification) compared to a
random distribution. Minimum value (- 1) for CLUMPY occurs when
the patch type is maximally disaggregated, a value of 0 indicates a
random distribution, and the maximum value (1) occurs when the patch
type is maximally aggregated (i.e., completely contained within a single
patch) Percentage of
Landscape
(PLAND)
Percentage area of each patch type in the landscape

55
Table 2.3. Variables (principles) and descriptions adapted from Arantes et al (2016), used to develop the Community-Based Management model relating governance
principles to arapaima abundance at the community level. All continuous variables ranged from 0 (completely absent) to 1 (fully present).
Principle Name Scale Description
I1 Defined boundaries Continuous Clearly defined boundaries of the resource and its users
I2 Congruence between rules and
local conditions Continuous
Rules of resource access and use (e.g. limits to gear, catch, areas, etc.) match local
conditions
I3 Collective action arrangements
Ordinal (Absent, Partially
Present, Fully Present)
Functional collective action arrangements allow most individuals affected by the rules to
participate in the definition and modification of the rules
I4 Monitoring system Continuous Resource and behavior of the fishers is monitored
I5 Graduated sanctioning
Ordinal (Absent, Partially
Present, Fully Present) Punishments for rule offenders based on severity and frequency of misconduct
I6 Conflict resolution mechanisms Continuous Rapid and low-cost conflict resolution mechanism
I7 Minimum recognition and right to
organize Continuous
Central governments formally authorize and recognize the rights of appropriators to devise
their own institutions
I8 Nested enterprises Continuous Nested structure of management tasks distributed across multiple levels and organizations

56
Table 2.4. Variables selected for each of the three independent models used in the variation partitioning analysis. Significant variables
are denoted in bold. PCNM = Principal Coordinates of Neighbor Matrices. ENNAM = Euclidean Nearest Neighbor, Area-weighted
Mean. CA = Cumulative Area. Brackets for governance variables indicate ordinal effect levels. Bold p-values are significant.
Individual Model Variable Standardized Regression Coefficient p-value
Landscape habitat ENNAM-Forest -0.87 <0.0001
CLUMPY-IrrMacro 0.26 0.1045
CLUMPY-RegMacro 0.35 0.0106
CA-Lake -0.50 0.0003
CLUMPY-Shrub 0.88 <0.0001
Governance I3 [0.5-0] 0.65 0.0390
I3 [1-0.5] 0.20 0.1974
I4 0.31 0.0344
I5 [0.5-0] 0.06 0.7412
I5 [1-0.5] 0.56 0.0075
Spatial PCNM1 0.36 <0.0001
PCNM2 0.33 0.0023
PCNM3 0.06 0.6292
PCNM4 -0.46 0.0003
PCNM5 -0.34 0.0031
PCNM6 -0.03 0.8467
PCNM7 -0.59 0.0008
PCNM8 0.21 0.2308
PCNM9 0.04 0.8441
PCNM10 -0.07 0.6762

57
Figure 2.1. Conceptualization of the scales and interactions between social systems and
ecosystems that collectively form a social-ecological system. Arrows indicate theoretical
interactions between social and ecological systems that apply to a variety of contexts, though the
importance and magnitude of these interactions requires data and modeling to depict for specific
cases.

58
Figure 2.2. Map of the study system showing main river channels (dark blue), dry-season lake extent (light blue), fishing community
boundaries, and lakes sampled (triangles).

59
Figure 2.3. Map of habitat class coverage throughout the study area.

60
Figure 2.4. Comparison of traditional buffer-distance approaches to delineating available habitat surrounding a floodplain lake (left)
with the cost-distance approach (right). By using the latter approach, dispersal of arapaima through potentially-available landscapes
reflects patterns more consistent with true availability, based on the length of time each habitat type is available throughout the year.

61
Figure 2.5. Map of arapaima abundances by study lake. Red circles are centered over each lake and scaled proportionally to the total
number of arapaima counted in the lake. Inset maps show areas where numerous lakes were in close proximity.

62
Figure 2.6. Venn diagram illustrating contributions of the three independent models in explaining the variation in inter-lake arapaima
abundances.
63
Conclusions
I think it is important to begin my thesis conclusions with an observation from my time
working within the Amazon. In developing my thesis and working in the field, I came to treasure
the information I obtained through anecdotes from researchers, conversations with fishermen,
local knowledge, brief observations mentioned only in the conclusion sections of theses and
dissertations, and other sources. As a whole, the value of knowledge I built from these sources
was at least equal to that obtained from traditional scientific publications. With so much of
Amazon fish ecology remaining unexplored and unpublished, I believe that collective
observations, opinions, and instincts of researchers who have worked in the field are valuable
resources that deserve publication in some form (though much of this information should be
“taken with a grain of salt”). With that in mind, I have structured my thesis as two independent,
publishable research articles, grounded in previously-published research and concluding only
that which can be shown statistically. By contrast, these conclusions are an opportunity to
discuss my findings for others in light of multiple lines of evidence, not just those that can be
demonstrated with a p-value.
In the preface to this thesis, I described my hope that this research would contribute a
potentially meaningful piece to the puzzles of both arapaima conservation and interdisciplinary
fisheries conservation as a whole. With that goal in mind, I believe this work has yielded
promising results in several ways, while also hinting at further processes for future investigation.
Ecologically speaking, these studies have demonstrated that the floodplain habitats of the
Amazon River play specific, important roles in supporting their native fish fauna. These fishes in
turn support the human population by providing both food security and economic prosperity. In
developing this study I found that both stage-structured habitat selection and dry season habitat

64
selection were largely unexplored topics for tropical floodplain fishes. Chapters 1 and 2 both
provide new evidence of the important role of flooded vegetation (macrophytes, shrubs, and
forests) for arapaima, and the habitat use patterns exhibited by small (< 1 m TL) arapaima
suggest that these results are likely applicable to numerous other floodplain fishes. Further, the
results reveal that depth plays a key role structuring the spatial distribution of arapaima within
lakes during the dry season.
In my mind, chapter 1 demonstrates the kind of ecological research that focuses on a
specific disciplinary concept (size-structured habitat selection) while also providing meaningful
evidence to apply later to interdisciplinary investigations. As arapaima population monitoring
and management continues to advance throughout the Amazon, knowledge of which habitats
support arapaima at various life stages could become an important component for managing the
population structures of local fisheries. Anecdotally, I was told by both fishermen and
researchers that the youngest, smallest arapaima (< 0.5 m TL) are often found in very specific,
secluded habitats with no larger arapaima present. These habitats are supposedly difficult to
access, and often completely covered in “floating meadows” of dense macrophytes inaccessible
to canoes. Despite my best efforts, I was able to find only a handful of these smallest individuals,
and they were found alongside other, larger arapaima. From my experiences, I believe that these
populations and habitats exist, and are important nurseries for recruiting arapaima to the age 1+
age class during their first dry season. Previous research and my own conversations with
fishermen led me to believe that the majority of my “small” arapaima assessed in chapter 1 were
individuals who would reach age 2 during the rising waters at the end of the dry season. That
these age 1+ fish demonstrated distinct patterns of habitat selection – along with the possibility
of age 0+ fish existing in distinct, unexplored habitats – suggests that size-structured habitat

65
selection by arapaima may be even more important than evidenced here. These possibilities
make for excellent future research targets for fisheries studies throughout the Amazon.
The results from chapter 2 provide strong, fitting evidence supporting the notion that both
human and environmental influences must be equally considered in integrated assessments of
fish populations. The discovery that landscape habitats and local-scale human governance play
almost equal roles in explaining inter-lake variability in arapaima abundances lends further
credence to the growing body of literature supporting the necessity of interdisciplinary
approaches to natural resources conservation. The importance of flooded vegetation habitats in
particular spatial arrangements provides implications for future conservation strategies – namely
that continued deforestation to support cattle ranching and further development may impair
fisheries productivity.
One of the most tantalizing research targets resulting from my findings in chapter 2 is the
unexplored migratory patterns of arapaima (and other floodplain fishes). Many fishes of the
Amazon River exhibit extraordinary life history patterns involving complex migrations up the
river timed with the flood pulse. Other less mobile fish (including arapaima) have been theorized
to adapt their local-scale foraging movements to intercept yearly migration runs of prey species.
Much of the evidence supporting these theorized movement patterns comes from unpublished
data and conversations with fishermen, but it provides potential clues for future telemetry work.
For arapaima, I am personally aware of two previous, three current, and several more future
telemetry studies to document movement patterns across multiple scales of time and space.
Despite having accessed results to four different studies (two of which occurred in the Santarém
region), I am still at a loss to answer basic questions about arapaima movement ecology. The
total range size, homing behavior (particularly repeated dry season lake homing), and migratory

66
nature of arapaima is largely a mystery. Understanding how, when, and why arapaima move has
severe implications for pressing issues regarding arapaima. The future development of local-
scale CBM, particularly in regions where arapaima populations are depleted, hinges on
understanding the potential for arapaima to disperse (or not) from more concentrated
populations. One of the critical components in developing the results from chapter 2 was the
development of the connectivity analysis for floodplain lakes. I view this work as a promising
way of understanding fish movement dynamics in floodplain systems, but the results would be
greatly refined and strengthened with more explicit knowledge of the movement ecology of
arapaima.
Oftentimes in the Amazon, the best way to obtain information about fish is to simply ask
the fishers. My research experience in the Amazon mirrors that of many of my colleagues, in that
reliable data collection often requires levels of effort orders of magnitude higher than similar
studies in North America. Given the massive knowledge gaps in fish ecology throughout the
Amazon, future studies may have promise in pairing ecological inquiry with traditional
ecological knowledge (TEK). For example, if studies of fish movement in floodplain systems
were paired with surveys of (TEK) from fishermen, we might be able to reliably gage the
accuracy of easily-acquired information and begin subsequent telemetry studies with a much
better idea of where and when to search for marked individuals. Similarly, my lakes yielding the
lowest arapaima concentrations in chapter 1 occurred in areas where I was warned that looking
for arapaima would be a borderline waste of time. I searched these lakes anyway, as I suspected
that they might hold low concentrations due to the presence of some important environmental
gradient, but the ability of fishermen to consistently predict where we could find arapaima is
greater than that of any model I could ever develop.

67
My findings in this thesis continue to make it apparent that the biology, ecology, and
sociology of fisheries are incredibly complex systems that can only be fully understood by
developing a thorough understanding of each piece in the puzzle – and then putting all of the
pieces together. The complexity of the individual pieces continues to grow, as my findings fall in
line with other recent studies suggesting that simply understanding the habitat requirements of a
species may not be enough. Just as ecological systems are constantly adapting and changing,
individual fish face continuous shifts in their vulnerability to stressors, habitat needs, and prey
selection. To ignore the significance of these often subtle, but important, shifts would be as
detrimental as to consider conservation of fishes with no regard to human influences.
The interdisciplinary assessment developed in chapter 2 was an enormous undertaking
that involved months of data collation, analysis, re-analysis, and development of new
methodologies to link everything together. Defining “available habitat” in the constantly shifting
floodplains to begin the landscape analysis was, by itself, a two-month process that took me
hundreds of hours and dozens of failed models to develop. The end result – a completely new
way of considering habitat connectivity that blends the spatial and temporal variation of the flood
pulse – is presented in just two paragraphs of text in chapter two. Assembling the records for the
arapaima count data and matching them to the lakes in our landscape database required help
from dozens of individuals. Similarly, the governance variables included in the chapter 2 model
were built by standing on the shoulders of our collaborators, who spent years conducting
interviews on the ground and honing their understanding of which drivers within social systems
to assess. Their data were condensed, analyzed, and fed into my modeling approach with only a
brief outline of the work put into making them. This work was very much a team undertaking
from the beginning, and the end results are far from perfect. For each question we have

68
(partially) answered, a dozen more have spawned, and it is already apparent to the authors
involved how we can improve upon our work in numerous ways. However, I am hopeful that in
presenting our work to the scientific community at large, we might help push knowledge of SES
sustainability forward by some small increment.
To that end, my final conclusions from this work echo those from the very beginning: this
thesis is but a small piece of the larger puzzle necessary to conserve the fish fauna of the world. I
hope that, one day, someone will find at least some small part of it helpful.

69
References
Agostinho AA, Thomaz SM, Gomes LC, Baltar SLSMA. 2007. Influence of the macrophyte Eichhornia
azurea on fish assemblage of the Upper Paraná River floodplain (Brazil). Aquatic Ecology 41:
611–619.
Agrawal A. 2001. Common Property Institutions and Sustainable Governance of Resources. World
Development 29: 1649–1672.
Almeida OT, McGrath DG, Ruffino ML. 2001. The commercial fisheries of the lower Amazon: an
economic analysis. Fisheries Management and Ecology 8: 253–269.
Arantes CC, Castello L, Stewart DJ, Cetra M, Queiroz HL. 2010. Population density, growth and
reproduction of arapaima in an Amazonian river-floodplain. Ecology of Freshwater Fish 19: 455–
465.
Arantes CC, Castello L, Cetra M, Schilling A. 2013. Environmental influences on the distribution of
arapaima in Amazon floodplains. Environmental Biology of Fishes 96: 1257–1267.
Arantes CC, Castello L, Angeli N, Sene-Harper A, McGrath DG, Basurto X. 2016. Measuring community-
based management capacity in the Amazon. In review with Conservation Letters.
Basurto X, Gelcich S, Ostrom E. 2013. The social–ecological system framework as a knowledge
classificatory system for benthic small-scale fisheries. Global Environmental Change 23: 1366–
1380.
Baumann H, Talmage SC, Gobler CJ. 2011. Reduced early life growth and survival in a fish in direct
response to increased carbon dioxide. Nature Climate Change 2: 38–41.
Berkes F. 2007. Community-based conservation in a globalized world. Proceedings of the National
Academy of Sciences 104: 15188–15193.
Berkes F, Colding J, Folke C. 2000. Rediscovery of Traditional Ecological Knowledge as Adaptive
Management. Ecological Applications 10: 1251.

70
Bivand RS, Pebesma E, Gomez-Rubio V. 2013. Applied spatial data analysis with R.
Borcard D, Legendre P, Drapeau P. 1992. Partialling out the Spatial Component of Ecological Variation.
Ecology 73: 1045.
Borcard D, Legendre P, Avois-Jacquet C, Tuomisto H. 2004. DISSECTING THE SPATIAL STRUCTURE OF
ECOLOGICAL DATA AT MULTIPLE SCALES. Ecology 85: 1826–1832.
Bozelli RL, Caliman A, Guariento RD, Carneiro LS, Santangelo JM, Figueiredo-Barros MP, Leal JJF, Rocha
AM, Quesado LB, Lopes PM, et al. 2009. Interactive effects of environmental variability and
human impacts on the long-term dynamics of an Amazonian floodplain lake and a South Atlantic
coastal lagoon. Limnologica - Ecology and Management of Inland Waters 39: 306–313.
Brind’Amour A, Boisclair D, Legendre P, Borcard D. 2005. Multiscale spatial distribution of a littoral fish
community in relation to environmental variables. Limnology and Oceanography 50: 465–479.
Burnham KP, Anderson DR. 2010. Model selection and multimodel inference: a practical information-
theoretic approach. Springer: New York, NY.
Castello L. 2004. A Method to Count Pirarucu Arapaima gigas: Fishers, Assessment, and Management.
North American Journal of Fisheries Management 24: 379–389.
Castello L. 2008a. Lateral migration of Arapaima gigas in floodplains of the Amazon. Ecology of
Freshwater Fish 17: 38–46.
Castello L. 2008b. Nesting habitat of Arapaima gigas (Schinz) in Amazonian floodplains. Journal of Fish
Biology 72: 1520–1528.
Castello L, Macedo MN. 2015. Large-scale degradation of Amazonian freshwater ecosystems. Global
Change Biology: n/a–n/a.
Castello L, Stewart DJ. 2010. Assessing CITES non-detriment findings procedures for Arapaima in Brazil.
Journal of Applied Ichthyology 26: 49–56.

71
Castello L, Viana JP, Watkins G, Pinedo-Vasquez M, Luzadis VA. 2009. Lessons from Integrating Fishers of
Arapaima in Small-Scale Fisheries Management at the Mamirauá Reserve, Amazon.
Environmental Management 43: 197–209.
Castello L, Stewart DJ, Arantes CC. 2011. Modeling population dynamics and conservation of arapaima in
the Amazon. Reviews in Fish Biology and Fisheries 21: 623–640.
Castello L, McGrath DG, Hess LL, Coe MT, Lefebvre PA, Petry P, Macedo MN, Renó VF, Arantes CC. 2013.
The vulnerability of Amazon freshwater ecosystems. Conservation Letters 6: 217–229.
Castello L, Arantes CC, Mcgrath DG, Stewart DJ, Sousa FSD. 2015a. Understanding fishing-induced
extinctions in the Amazon. Aquatic Conservation: Marine and Freshwater Ecosystems: n/a–n/a.
Castello L, Arantes CC, Mcgrath DG, Stewart DJ, Sousa FSD. 2015b. Understanding fishing-induced
extinctions in the Amazon: FISHING-INDUCED EXTINCTIONS IN THE AMAZON. Aquatic
Conservation: Marine and Freshwater Ecosystems 25: 587–598.
Castro F de, McGrath DG. 2003. Moving Toward Sustainability in the Local Management of Floodplain
Lake Fisheries in the Brazilian Amazon. Human Organization 62: 123–133.
Coomes OT, Takasaki Y, Abizaid C, Barham BL. 2010. Floodplain fisheries as natural insurance for the
rural poor in tropical forest environments: evidence from Amazonia: FLOODPLAIN FISHERIES AS
INSURANCE IN TROPICAL FORESTS. Fisheries Management and Ecology 17: 513–521.
Cox M, Arnold G, Tomas SV. 2010. A review of design principles for community-based natural resource
management. Ecology and Society 15.
Crampton WGR, Castello L, Viana JP. 2004. Fisheries in the Amazon Várzea. In People in nature: wildlife
conservation in South and Central America, Silvius KM, , Bodmer RE, , Fragoso JMV (eds).
Columbia University Press: New York;
Crossa M. 2003. Annual Report Varzea Project. Santarem: Instituto de Pesquisa Ambiental da
Amazoˆnia– IPAM., Santarem.

72
Cumming GS, Cumming DHM, Redman CL. 2006. Scale Mismatches in Social-Ecological Systems: Causes,
Consequences, and Solutions. Ecology and Society 11.
Delariva RL, Agostinho AA, Nakatani K, Baumgartner G. 1994. Ichthyofauna associated to aquatic
macrophytes in the Upper Parana River floodplain. Revista UNIMAR 16: 41–60.
Dunning JB, Danielson BJ, Pulliam HR. 1992. Ecological Processes That Affect Populations in Complex
Landscapes. Oikos 65: 169.
Epstein G, Vogt J, Mincey S, Cox M, Fischer B. 2013. Missing ecology: integrating ecological perspectives
with the social-ecological system framework. International Journal of the Commons 7: 432–453.
F. Dormann C, M. McPherson J, B. Araújo M, Bivand R, Bolliger J, Carl G, G. Davies R, Hirzel A, Jetz W,
Daniel Kissling W, et al. 2007. Methods to account for spatial autocorrelation in the analysis of
species distributional data: a review. Ecography 30: 609–628.
Fernandes CC. 1997. Lateral migration of fishes in Amazon floodplains. Ecology of Freshwater Fish 6: 36–
44.
Folke C, Hahn T, Olsson P, Norberg J. 2005. Adaptive governance of social-ecological systems. Annual
Review of Environment and Resources 30: 441–473.
Galacatos K, Barriga-Salazar R, Stewart DJ. 2004. Seasonal and Habitat Influences on Fish Communities
within the Lower Yasuni River Basin of the Ecuadorian Amazon. Environmental Biology of Fishes
71: 33–51.
Goulding M. 1980. The fishes and the forest: explorations in Amazonian natural history. University of
California Press: Berkeley.
Goulding M. 1999. An introduction to varzea fish and fisheries. In Várzea: diversity, development, and
conservation of Amazonia’s whitewater floodplains, Padoch C (ed). New York Botanical Garden
Press: Bronx, N.Y;
73
Goulding M, Smith NJH, Mahar DJ. 1996. Floods of fortune: ecology and economy along the Amazon.
Columbia University Press: New York.
Gutiérrez NL, Hilborn R, Defeo O. 2011. Leadership, social capital and incentives promote successful
fisheries. Nature 470: 386–389.
Hardin G. 1968. The Tragedy of the Commons. Science 162: 1243–1248.
Harvey BC, Stewart AJ. 1991. Fish size and habitat depth relationships in headwater streams. Oecologia
87: 336–342.
Holbrook SJ, Schmitt RJ. 1988. Effects of predation risk on foraging behavior: mechanisms altering patch
choice. Journal of Experimental Marine Biology and Ecology 121: 151–163.
Isaac VJ, Ruffino ML. 2007. Evaluation of Fisheries in Middle Amazon. the American Fisheries Society;
Junk WJ. 1984. Ecology, fisheries and fish culture in Amazonia. In The Amazon, Sioli H (ed). Springer
Netherlands: Dordrecht; 443–476.
Junk WJ (Ed.). 1997. The central Amazon floodplain: ecology of a pulsing system. Springer: Berlin ; New
York.
Junk WJ. 2002. Long-term environmental trends and the future of tropical wetlands. Environmental
Conservation 29.
Junk WJ, Bayley PB, Sparks RE. 1989. The flood pulse concept in river-floodplain systems. Canadian
special publication of fisheries and aquatic sciences: Honey Harbour, Ontario, Canada;
Kouamé KA, Yao SS, Gooré Bi G, Kouamélan EP, N’Douba V, Kouassi NJ. 2008. Influential environmental
gradients and patterns of fish assemblages in a West African basin. Hydrobiologia 603: 159–169.
Kurihara H. 2008. Effects of CO2-driven ocean acidification on the early developmental stages of
invertebrates. Marine Ecology Progress Series 373: 275–284.
74
Lecchini D, Osenberg CW, Shima JS, St Mary CM, Galzin R. 2007. Ontogenetic changes in habitat
selection during settlement in a coral reef fish: ecological determinants and sensory
mechanisms. Coral Reefs 26: 423–432.
Leduc A, Drapeau P, Bergeron Y, Legendre P. 1992. Study of spatial components of forest cover using
partial Mantel tests and path analysis. Journal of Vegetation Science 3: 69–78.
Legendre P, Fortin MJ. 1989. Spatial pattern and ecological analysis. Vegetatio 80: 107–138.
Legendre P, Legendre L. 2012. Numerical ecology. Elsevier: Amsterdam.
Legendre P, Troussellier M. 1988. Aquatic heterotrophic bacteria: Modeling in the presence of spatial
autocorrelation: Modeling autocorrelated data. Limnology and Oceanography 33: 1055–1067.
Legendre P, Borcard D, Blanchet FG, Dray S. 2013. PCNM: MEM spatial eigenfunction and principal
coordinate analyses. R package version 2.1-2/r109. http://R-Forge.R-
project.org/projects/sedar/.
Leslie HM, Basurto X, Nenadovic M, Sievanen L, Cavanaugh KC, Cota-Nieto JJ, Erisman BE, Finkbeiner E,
Hinojosa-Arango G, Moreno-Báez M, et al. 2015. Operationalizing the social-ecological systems
framework to assess sustainability. Proceedings of the National Academy of Sciences 112: 5979–
5984.
Liu J, Dietz T, Carpenter SR, Alberti M, Folke C, Moran E, Pell AN, Deadman P, Kratz T, Lubchenco J, et al.
2007. Complexity of Coupled Human and Natural Systems. Science 317: 1513–1516.
Lobón-Cerviá J, Hess LL, Melack JM, Araujo-Lima CARM. 2015. The importance of forest cover for fish
richness and abundance on the Amazon floodplain. Hydrobiologia 750: 245–255.
Lowe-McConnell R. 1987. Ecological studies in tropical fish communities. Cambridge University Press:
Cambridge [Cambridgeshire] ; New York.
Magoulick DD, Kobza RM. 2003. The role of refugia for fishes during drought: a review and synthesis.
Freshwater Biology 48: 1186–1198.

75
Matthews WJ. 1998. Patterns in freshwater fish ecology. Chapman & Hall: New York.
Matthews WJ, Marsh-Matthews E. 2003. Effects of drought on fish across axes of space, time and
ecological complexity. Freshwater Biology 48: 1232–1253.
McGarigal K, Cushman SA, Ene E. 2012. FRAGSTATS v4: Spatial Pattern Analysis Program for Categorical
and Continuous Maps. Computer software program produced by the authors at the University
of Massachusetts, Amherst.
McGrath DG, de Castro F, Futemma C, de Amaral BD, Calabria J. 1993. Fisheries and the evolution of
resource management on the lower Amazon floodplain. Human Ecology 21: 167–195.
McGrath DG, Cardoso A, Almeida OT, Pezzuti J. 2008. Constructing a policy and institutional framework
for an ecosystem-based approach to managing the Lower Amazon floodplain. Environment,
Development and Sustainability 10: 677–695.
McRae BH, Dickson BG, Keitt TH, Shah VB. 2008. Using circuit theory to model connectivity in ecology,
evolution, and conservation. Ecology 89: 2712–2724.
Melack JM, Forsberg BR. 2001. Biogeochemistry of Amazon floodplain lakes and associated wetlands. In
The biogeochemistry of the Amazon Basin, McClain ME, , Victoria RL, , Richey JE (eds). Oxford
University Press: New York;
Mittelbach G. 1986. Predator-mediated habitat use: some consequences for species interactions.
Environmental Biology of Fishes 16: 159–169.
Neill C, Deegan LA, Thomas SM, Cerri CC. 2001. Deforestation for pasture alters nitrogen and
phosphorus in small Amazonian streams. Ecological Applications 11: 1817–1828.
Neter J, Kutner MH, Nachtsheim CJ, Wasserman W. 1996. Applied linear statistical models. Irwin:
Chicago.
Oksanen J, Blanchet FG, Kindt R, Legendre P, Minchin PR, O’Hara RB, Simpson GL, Solymos P, Henry M,
Stevens H, et al. 2015. Vegan: Community Ecology Package.

76
Ostrom E. 1990. Governing the commons: the evolution of institutions for collective action. Cambridge
University Press: Cambridge ; New York.
Ostrom E. 2009. A General Framework for Analyzing Sustainability of Social-Ecological Systems. Science
325: 419–422.
Pebesma EJ, Bivand RS. 2005. Classes and methods for spatial data in R. R News 5.
Persson L, Andersson J, Wahlstrom E, Eklov P. 1996. Size-Specific Interactions in Lake Systems: Predator
Gape Limitation and Prey Growth Rate and Mortality. Ecology 77: 900.
Peterson DL, Parker VT (Eds.). 1998. Ecological scale: theory and applications. Columbia University Press:
New York.
Petry AC, Agostinho AA, Gomes LC. 2003a. Fish assemblages of tropical floodplain lagoons: exploring the
role of connectivity in a dry year. Neotropical Ichthyology 1.
Petry P, Bayley PB, Markle DF. 2003b. Relationships between fish assemblages, macrophytes and
environmental gradients in the Amazon River floodplain. Journal of Fish Biology 63: 547–579.
Pollnac RB, Crawford BR, Gorospe MLG. 2001. Discovering factors that influence the success of
community-based marine protected areas in the Visayas, Philippines. Ocean & Coastal
Management 44: 683–710.
Pomeroy RS, Williams MJ. 1994. Fisheries Co-Management and Small-Scale Fisheries: A Policy Brief.
ICLARM.
Pomeroy RS, Katon BM, Harkes I. 2001. Conditions affecting the success of fisheries co-management:
lessons from Asia. Marine Policy 25: 197–208.
Pouilly M, Rodríguez M. 2004. Determinism of fish assemblage structure in neotropical floodplain lakes:
influence of internal and landscape lake conditions. Proceedings of the second international
symposium on the management of large rivers for fisheries 2: 243–265.

77
Queiroz HL, Sardinha AD. 1999. A preservacao e o uso sustentado dos pirarucus em Mamiraua. In
Estrategias para o manejo de recursos pesqueiros em Mamiraua, Queiroz HL, , Crampton WGR
(eds). Sociedade Civil Mamiraua´/ Ministe´rio de Cieˆncia e Tecnologia /Conselho Nacional de
Pesquisa: Brasilia; 108–141.
Queiroz HL de. 2000. Natural history and conservation of pirarucu, Arapaima gigas, at the Amazonian
Várzea : red giants in muddy waters. University of St. Andrews, St. Adrews, Scotland.
Ramalho EE, Macedo J, Vieira TM, Valsecchi J, Calvimontes J, Marmontel M, Queiroz HL. 2009. Ciclo
hidrológico nos ambientes de várzea da Reserva de Desenvolvimento Sustentável Mamirauá–
Médio Solimões, período de 1990 a 2008. No. 5(1)., Uakari.
R Core Team. 2014. R: A language and environment for statistical computing. R Foundation for Statistical
Computing, Vienna, Austria.
Reis RE, Kullander SO, Ferraris CJ, Pontifícia Universidade Católica do Rio Grande do Sul (Eds.). 2003.
Check list of the freshwater fishes of South and Central America. EDIPUCRS: Porto Alegre.
Renó VF, Novo EMLM, Suemitsu C, Rennó CD, Silva TSF. 2011. Assessment of deforestation in the Lower
Amazon floodplain using historical Landsat MSS/TM imagery. Remote Sensing of Environment
115: 3446–3456.
Richard JC. 2016. Human and environmental influences on the distribution and abundance of arapaima
in river floodplains of the Lower Amazon. Virginia Tech.
Rissman AR, Gillon S. 2016. Where are ecology and biodiversity in social-ecological systems research? A
review of research methods and applied recommendations. Conservation Letters.
Rodríguez MA, Lewis WM. 1994. Regulation and stability in fish assemblages of neotropical floodplain
lakes. Oecologia 99: 166–180.
Rodríguez MA, Lewis WM. 1997. Structure of fish assemblages along environmental gradients in
floodplain lakes of the Orinoco River. Ecological Monographs 67: 109–128.

78
Rosa EA, Dietz T. 1998. Climate Change and Society: Speculation, Construction and Scientific
Investigation. International Sociology 13: 421–455.
Rosenberg A, Bigford TE, Leathery S, Hill RL, Bickers K. 2000. Ecosystem approaches to fishery
management through essential fish habitat. Bulletin of Marine Science 66: 535–542.
Saint-Paul U, Zuanon J, Villacorta Correa MA, Garcia M, Fabre NN, Berger U, Junk WJ. 2000. Fish
Communities in Central Amazonian White- and Blackwater Floodplains. Environmental Biology
of Fishes 57: 235–250.
Schael DM, Rudstam LG, Post JR. 1991. Gape Limitation and Prey Selection in Larval Yellow Perch (Perca
flavescens), Freshwater Drum (Aplodinotus grunniens), and Black Crappie (Pomoxis
nigromaculatus). Canadian Journal of Fisheries and Aquatic Sciences 48: 1919–1925.
Schlosser IJ. 1987. The Role of Predation in Age- and Size-Related Habitat Use by Stream Fishes. Ecology
68: 651–659.
Schlosser IJ, Johnson JD, Knotek WL, Lapinska M. 2000. Climate variability and size-structured
interactions among juvenile fish along a lake-stream gradient. Ecology 81: 1046–1057.
Schöngart J, Junk WJ. 2007. Forecasting the flood-pulse in Central Amazonia by ENSO-indices. Journal of
Hydrology 335: 124–132.
Sheikh PA, Merry FD, McGrath DG. 2006. Water buffalo and cattle ranching in the Lower Amazon Basin:
Comparisons and conflicts. Agricultural Systems 87: 313–330.
Sioli H. 1984. The Amazon and its main affluents: Hydrography, morphology of the river courses, and
river types. In The Amazon, Sioli H (ed). Springer Netherlands: Dordrecht; 127–165.
Smith NJH. 1985. The impact of cultural and ecological change on Amazonian fisheries. Biological
Conservation 32: 355–373.

79
Spear SF, Balkenhol N, Fortin M-J, Mcrae BH, Scribner K. 2010. Use of resistance surfaces for landscape
genetic studies: considerations for parameterization and analysis. Molecular Ecology 19: 3576–
3591.
Stewart DJ. 2013a. A New Species of Arapaima (Osteoglossomorpha: Osteoglossidae) from the Solimões
River, Amazonas State, Brazil. Copeia 2013: 470–476.
Stewart DJ. 2013b. Re-description of Arapaima agassizii (Valenciennes), a Rare Fish from Brazil
(Osteoglossomorpha: Osteoglossidae). Copeia 2013: 38–51.
Taylor PD, Fahrig L, Henein K, Merriam G. 1993. Connectivity Is a Vital Element of Landscape Structure.
Oikos 68: 571.
Tejerina-Garro F, Fortin R, Rodríguez M. 1998. Fish community structure in relation to environmental
variation in floodplain lakes of the Araguaia River, Amazon Basin. Environmental Biology of
Fishes 51: 399–410.
Tockner K, Stanford JA. 2002. Riverine flood plains: present state and future trends. Environmental
Conservation 29.
Turner MG. 1989. Landscape Ecology: The Effect of Pattern on Process. Annual Review of Ecology and
Systematics 20: 171–197.
Val AL, Almeida-Val VMF de. 1995. Fishes of the Amazon and their environment: physiological and
biochemical aspect. Springer: Berlin ; New York.
Venables WN, Ripley BD, Venables WN. 2002. Modern applied statistics with S. Springer: New York.
Verissimo J. 1895. A pesca na Amazonia. [The Fishery in the Amazon]. Livraria Classica Alves and
Companhia, Rio de Janeiro.
Vogt JM, Epstein GB, Mincey SK, Fischer BC, McCord P. 2015. Putting the ‘E’ in SES: unpacking the
ecology in the Ostrom social-ecological system framework. Ecology and Society 20.
Welcomme RL. 1979. Fisheries ecology of floodplain rivers. Longman: London ; New York.

80
Welcomme RL. 1995. Relationships between fisheries and the integrity of river systems. Regulated
Rivers: Research & Management 11: 121–136.
Werner EE, Gilliam JF. 1984. The Ontogenetic Niche and Species Interactions in Size-Structured
Populations. Annual Review of Ecology and Systematics 15: 393–425.
Werner EE, Gilliam JF, Hall DJ, Mittelbach GG. 1983. An Experimental Test of the Effects of Predation
Risk on Habitat Use in Fish. Ecology 64: 1540.
Wilson JA. 2006. Matching social and ecological systems in complex ocean fisheries. Ecology and Society
11.
Winemiller KO, Jepsen DB. 1998. Effects of seasonality and fish movement on tropical river food webs.
Journal of Fish Biology 53: 267–296.
de Yuan EC, de Hassan CP. 1985. Fish populations in the Paraná River: Lentic environments of Diamante
and San Pedro Areas (Argentine Republic). Hydrobiologia 127: 213–218.
Zarfl C, Lumsdon AE, Berlekamp J, Tydecks L, Tockner K. 2015. A global boom in hydropower dam
construction. Aquatic Sciences 77: 161–170.
Zarin DJ, Pereira VF., Raffles H, Rabelo FG, Pinedo-Vasquez M, Congalton RG. 2001. Landscape change in
tidal floodplains near the mouth of the Amazon River. Forest Ecology and Management 154:
383–393.
Ziv G, Baran E, Nam S, Rodriguez-Iturbe I, Levin SA. 2012. Trading-off fish biodiversity, food security, and
hydropower in the Mekong River Basin. Proceedings of the National Academy of Sciences 109:
5609–5614.