hubballi dharwad city development frameworksutpindia.com/skin/pdf/hubli dharwad city development...
TRANSCRIPT

Project Summary
HUBBALLI DHARWAD CITY DEVELOPMENT FRAMEWORK
Hubballi-Dharwad BRTS Company Ltd.
Directorate of Urban Land Transport
23 February 2019

1. Introduction
2. Project Details
3. Learnings
AGENDA

What is Hubli Dharwad City Plan?
HUBLI DHAWRAD CITY PLAN
TERMS OF REFERENCE
• Inform and provide context on how urban development
should occur
• Set a new standard for
comprehensiveness
• Be a reliable guide to local
authorities
• Guide ongoing
comprehensive strategy development on a dynamic basis
• Become a basis for informed
changes in the Master Plan
INTRODUCTION
Informs

KEY COMPONENTS OF THE CITY PLAN
City Development Framework
Urban Design Guidelines
Development Control Regulations
Landscape Infrastructure Guidelines
Heritage Guidelines
HUBLI DHARWAD
2030
Based on the inputs from Final Stakeholder & TAC Workshop, the deliverables
were re-structured to suit the requirements.

PROJECT DETAILS

What is Hubli Dharwad City Plan? CITY PLAN PROCESS

CITY PLAN STUDY AREA
Study Area
Local Planning Area
HDMC Area
Hubli
Dharwad
202 Sq.Km.
805 Sq.Km.
408 Sq.Km.

HDMC STUDY AREA
202 sqkm 805 sqkm
9.43 LAKH 11.34 LAKH
MEDIAN AGE:
22-24 YRS
PEOPLE
WORKFORCE:
URBAN 35%
RURAL 48%
LIVE
HOUSEHOLDS:
2.1 LAKH
HOUSEHOLD
SIZE:
4.7
60% 2-3 BHK
WORK
25% EMPLOYED
40% LABOUR
66% EARN
<15K/month
68% LABOUR
93.5% EARN
<15K/month
FORMAL
SECTORS
INFORMAL
SECTORS
PLAY LEARN
3.38 sqkm
OPEN
SPACE
31 ACTIVE
GARDENS
COMMUTE
34
BRTS STATIONS
RAILWAY STATIONS
DOMESTIC
AIRPORT
LOGISTICS
RAILWAYSTATION
ROAD NETWORK
3545 KM 1
2 2
900 ANGANWADI
450
SCHOOLS
>50 COLLEGES
81% COME IN
FROM VILLAGES
>50% FOR JOBS
>30% GO OUT
MOJORITY FOR
JOBS/EDUCATION
KEY FACTS
MIGRATION
Where Are We Now? KEY FACTS

What Challenges Do We Face?
Unemployment Rate of unemployment is
higher for post graduates
Loss of Natural
Environment
• Decreasing ground water
recharge and increase in
surface water run-off due to
fragmentation of natural
drainage system
• Unsustainable water
consumption patterns
• Lack of appropriate sewage
treatment is also cause for
pollution of water bodies
• Electricity supply in the city
is sporadic due to absence
of a reliable system with
necessary infrastructure
Miscoordination
Lack of coordination
between multiple
stakeholders with
overlapping jurisdictions
Disjointed City
Most development between
Hubli and Dharwad is
sprawling, thereby physically
dividing the two cities
Sprawl
Availability of large tracts of
urbanisable land with very
little demand has led to
proliferating urban sprawl
Unproductive Land
Loss of Agricultural
productivity in the
hinterlands
Limited Participation
Limited means of
consultative processes in
planning
CITY PEOPLE INSTITUTIONS ENVIRONMENT

Data Understanding – Compiled Geo-Database
http://203.124.128.99/IBI/login.aspx

City Plan Vision
The City Plan envisions a participatory society that contributes to the
enrichment of their physical environment by engaging with and responding to their
natural surroundings; building industries and institutions that enhance opportunities
for healthy and comfortable lives for everyone; and progressing
together in liberal, livable and inclusive communities. [ ] VISION 2030
STRATEGIC PILLARS

Diverse Economic
and Social
Growth
Manage
Environment and
Climate
Resilience
Effective
Land
Management &
Transportation
A Range of
Housing and
Community
Facilities
Celebrate
Heritage
Green
Infrastructure
and Services
Effective
Implementation
and Governance
Enhance business
climate, ensure the
fiscal health, skill
development and
support economic
growth in Hubli
Dharwad in a manner
consistent with the
city’s character.
Examine the impact
and influence of
development on the
natural landscapes/
systems and how
natural systems can
build resilience from
forces of change.
Land use decisions
should focus on the
interrelationship of
transportation and
land use, with an
emphasis on
development patterns
that support the use
of public transit.
To create an
inclusive, competitive,
and sustainable city.
Creating and
maintaining a full
range of housing
types and community
facilities.
To involve advice and
guidance to the
government on the
protection of the city’s
rich architectural,
cultural
archaeological and
natural heritage.
To make a
sustainable city
through energy
efficiency, sustainable
water management
and solid waste
management
mechanism by 2030.
To focus on
processes on plan
evolution,
enforcement and
implementation.
• Inclusive growth
• Infrastructure for
growth
• Competitive growth
• Sustaining growth
for future
• Preserve and
Enhance City’s
Natural Assets
• Protect Critical
Ecosystems
• Ensure Food
Security
• Empower
Institutions with
Data
• Healthy live-work-
play balance in a
compact walkable
environment
• Inclusive and
affordable
development within
transit catchment
• Reduced land
speculation
• Make Housing
Sustainable
• Make Housing
Resilient
• Create Long Term
Provisions for
Housing
• Effective
management of
heritage resources
• use heritage as a
driver to preserve,
conserve and
protect the natural
resources
• Public outreach to
create Interest
• Increase energy
efficiency
• Provide a resilient
and robust energy
supply
• Provide sufficient
drinking water and
increase coverage
• Reduce SW
generation
• Delineation of city-
regions and
• Preparation of
Regional Plans,
Development Plans
at local level and
Local Area Plans at
Ward level
Strategic Pillars O
BJ
EC
TIV
ES
G
OA
LS

Spatial Growth Strategy- Land Capability Analysis
Nutrient Management Services
Water Resource Capability
Agricultural Potential
I. Soil Type II. Land
Cover
I. Watershed
Capacity
II. Water System
Capacity
I. Soil Fertility II. Irrigation
Potential
Vulnerability to Floods
4 I. Flooding Streams and
Impact Areas II. Contours
III. Land
Cover
III. Forest
Area Buffers
Derived Conservation Areas
+
+
+
=
PARAMETERS & CRITERIA
3
2
1
4
3
2
1
5

Spatial Growth Strategy- Density Assessment
Scenario 1 Scenario 2 Scenario 3
150 pph 200 pph 100 pph
• Danger of Sprawled
Development
• Cost of Infrastructure
Distribution systems is High
• Non Inclusive development
• Cost of Infrastructure Distribution
systems is Moderate
• Livability condition is good
• Compact walkable environment
• Cost of Infrastructure Distribution
systems is low
• Livability condition is low
DENSITY
LU DISTRIBUTION
MIN. AREA REQ.
MAX. AREA REQ.
Population as per MP
2031: 2200000
Population (as per
City Plan): 1390048
139 sq.km 92.67 sq.km 69.50 sq.km
220 sq.km 144.66 sq.km 110 sq.km
Dus per HA 63 83 111

Spatial Growth Strategy- Growth Plan
Aims to develop high, medium,
and low growth areas around the
growth nodes connected by
transportation corridors
“The spatial concept envisions Hubli-
Dharwad as a hierarchy of mixed use
areas, corridors and nodes, that
integrate the natural ecological
system, and that are connected by an
efficient public transit system”
EXISTING STRUCTURE
Characterized by:
• Work opportunities located far from
residential areas
• Separated land uses resulting in high
social, economic and environmental costs
• Lack of sub-centres to absorb and
redistribute the development
PROPOSED MODEL POLYCENTRIC MODEL CONCEPT

The resulting Spatial Growth Concept
acknowledges environmental constraints
and leverages economic opportunities born
out of emerging industries and land-based opportunities.
• Develop Secondary Mixed Use
Growth Nodes surrounding the city
cores and along the PB Road
• Develop Commercial Corridors along
Gokul Road and Solapur Rd
• Develop Activity Nodes at key locations
to leverage locational advantages
The Growth Concept makes the following
proposals:
PROPOSED CONCEPT PLAN Spatial Growth Strategy

Spatial Growth Strategy- Spatial Framework
Conservation Area Framework
No Development Zone

Spatial Growth Strategy- Spatial Framework
Conservation Area Framework
Regulated Growth Zone
No Development Zone
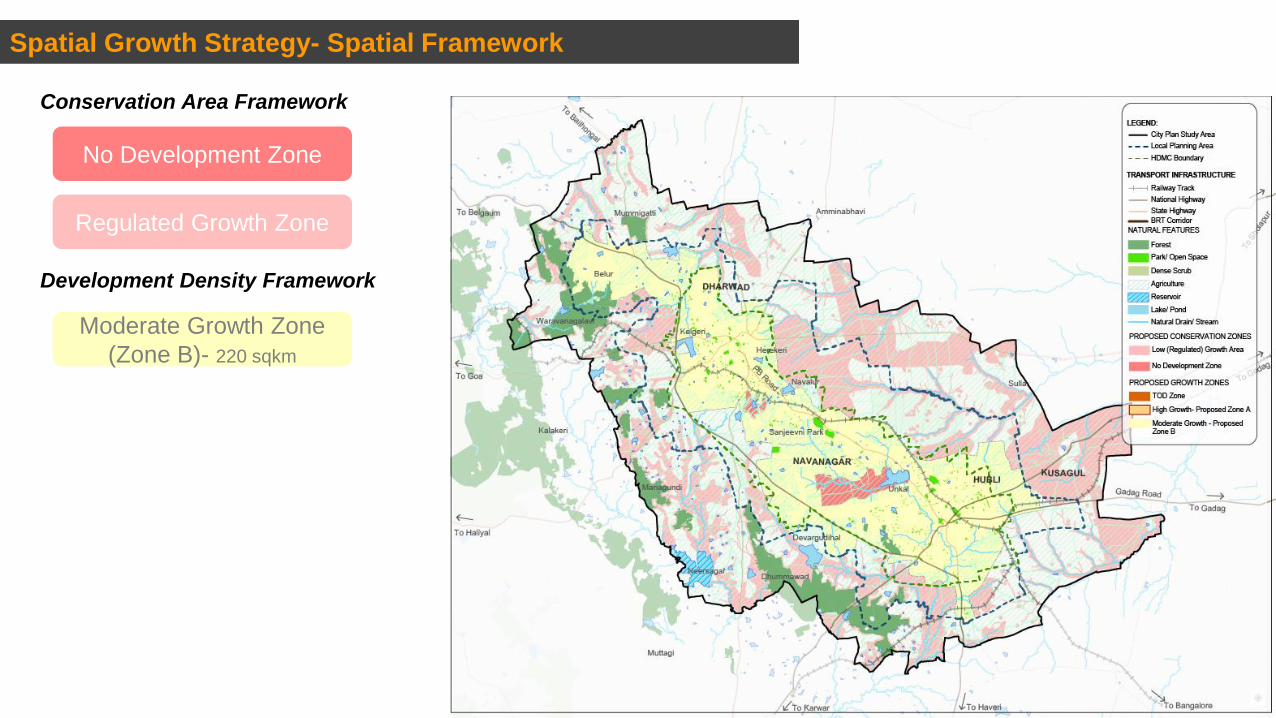
Spatial Growth Strategy- Spatial Framework
Conservation Area Framework
Development Density Framework
Regulated Growth Zone
No Development Zone
Moderate Growth Zone
(Zone B)- 220 sqkm

Spatial Growth Strategy- Spatial Framework
Conservation Area Framework
Development Density Framework
High Growth Zone
(Zone A)- 83.2 sqkm
Regulated Growth Zone
No Development Zone
Moderate Growth Zone
(Zone B)- 220 sqkm

Spatial Growth Strategy- Spatial Framework
Conservation Area Framework
Development Density Framework
TOD Zone- 30.1 sqkm
High Growth Zone
(Zone A)- 83.2 sqkm
Regulated Growth Zone
No Development Zone
Moderate Growth Zone
(Zone B)- 220 sqkm

High Growth Zone
(Zone A)
Moderate Growth Zone
(Zone B)
Regulated Growth Zone
No Development Zone
Spatial Growth Strategy
FAR Setbacks Ground
Coverage Parking
TOD Zone
A comparison of Development Control Regulations
in various zones ranging from ‘Lowest’ to ‘Highest’

Connect and Strengthen Strategies Preserve and Manage Strategies
Upgrade and Transform Strategies Grow and Innovate Strategies
1. Formalize a Bottom-Up and Integrated
Planning Process
2. Rethink Urban Parks to maximize value
3. Build Partnership to link Education,
Research and Development
4. Develop a Hubli – Dharwad City Brand
5. Manage Regional Water Resource
6. Reimagine Built Heritage and Maximize Value
7. Build Complimentary Institutions for Key Functions
8. Improve Institutional Capacities
9. Enable Housing Plurality
10. Make Villages Independent
11. Create Tourist Ready Circuit
12. Upgrade Neighbourhoods
13. Encourage Compact Intensification through
Regulations
14. Capitalize on City Strengths to Build Economic Clusters
15. Green the Hubli-Dharwad Economy
16. Remodel Public Infrastructure to accommodate Green
Infrastructure
17. Create Sustainable Land Development Opportunities for
the Future
18. Promote High Density Compact Mixed use Development
in TOD Zone
19. Capitalize on Sharing Economy for augmentation of
Transportation Services
20. Tap on smart trends
Core Objectives – 20 POINT ACTION PLAN

Core Objectives – 20 POINT ACTION PLAN- Details

TOD ZONE
URBAN DESIGN GUIDELINES

DEFINING THE HDBRT TOD ZONE
EXISTING BUILT ENVIRONMENT Existing large scale developments and destinations beyond
10 minute walking distance.
NATURAL ENVIRONMENT BOUNDARIES The boundary is remapped to include natural systems,
greenways and open spaces.
WALKING DISTANCE FROM TRANSIT STATION Willingness to walk up to 10 minutes to a given station. Boundary is
defined by 500m radial circle centered on the station.
EXISTING ROAD GRID The boundary is compromised by breaks in the road
network and major roadways.

ANALYZE HDBRT TOD ZONE
ROW (m) Length (km)
9-12 20.34
13-18 13.63
19-30 8.9
Above 30 0.6
Hosayellapur
Kamariapeth
Hosur Circle
SDM college
PROPOSED LAND USE ACCESS ROUTES HDBRT RIDERSHIP
REAL ESTATE STUDIES TOD ZONE DENSITY SOCIO CULTURAL ACTIVITIES

IG Glass House
Unkal Lake
Navalur Lake
Ho
su
r In
terc
ha
ng
e
Un
ka
l V
illa
ge
BV
B C
olle
ge
AP
MC
Na
vlu
r
RT
O
La
ka
ma
na
ha
lli
To
ll N
aka
Co
urt
Cir
cle
KIADB Land
Sanjeevini Park Navanagar
APMC KIMS Rani
Chennamma Circle
Shantinikatan Layout
HUBLI DHARWAD Sattur Gandhinagar
Dharwad Rly. Stn.
Navalur Navanagar BVB College
ANALYZE HDBRT TOD ZONE – BUILT FORM

TOD Zone – PREFERRED APPROACH
STRENGTH WEAKNESS OPPORTUNITIES THREATS
HDBRT TOD ZONE HDBRT CORRIDOR ZONE HDBRT NEIGHBOURHOOD ZONE

TOD ZONE – CONCEPT PLAN PROPOSAL
HDBRT Corridor Streetscape Framework
Multi Modal Transit Plaza
Parks & Open Spaces
Heritage Gateways
City Gateways
Intersection Improvements
HDBRT Corridor Development Framework
Agro-Economy Node
Healthcare Node
Heritage Districts
Environment Sensitive Nodes
Transit Priority Neighbourhood Framework
Neighbourhood Nodes
primary access route improvements

OVERVIEW – TOD URBAN DESIGN GUIDELINES
HDBRTS TOD
ZONE
URBAN
DESIGN
GUIDELINES
RELEVANCE TO AGENCIES
• HDBRT Co.
• NWKRTC
• Private Transit Agency
• HDUDA/HDMC-PWD
• KRDCL
To address the streetscape
or transit improvements
along the HDBRT corridor
• HDUDA/HDMC
• Special Approvals Agency
• TOD & Heritage
Committees
• Real Estate Developer
• Citizens
For building construction,
campus development,
improving local streets or
taking up public space design
within TOD zone
HDBRT Corridor Guidelines
A. Corridor Streetscape Manual
B. Station Vicinity Design Guide
HDBRT TOD Zone Guidelines
C. Better Access Guide
D. Built form Guidelines
E. Public Realm Guidelines

COMPONENTS OF URBAN DESIGN GUIDELINES
PART A:
HDBRT Corridor Guidelines
Footpath Improvements Bicycle facilities Safer Intersections Amenities
A1:
Corridor Streetscape Manual
A2:
Station Vicinity Design Guide
Multi-modal Integration Station Accessibility Commuter Amenities

COMPONENTS OF URBAN DESIGN GUIDELINES
Street Network First n Last Mile Streetscape Design
Built form Frontage Infrastructure
Public Plazas NMT-Priority Streets Parks & Play areas Waterfronts
PART B:
HDBRT TOD Zone Guidelines
B1:
Better Access Guide
B2:
Built Form Guidelines
B3:
Public Realm Guidelines

Navalur Lake
Sattur
SDM Hospital
Navalur Stn
TOD DEMONSTRATION AREA PROPOSED IMPROVEMENTS
NGEF

TOD DEMONSTRATION AREA PROPOSED IMPROVEMENTS
Navalur Lake
Sattur
SDM Hospital
Navalur Stn
NGEF
High Density -Commercial
High/Medium Density –Residential Mixed
Medium Density – Innovation/Commercial
Transit Plaza

Key Interventions: Introduce street connections to better access the
BRT station
Delineate the main road as primary access street
that requires pedestrian priority, firs n last mile
connectivity
Identify bicycle/IPT stops at key locations along the
primary access route
Enhance the existing parks as neighbourhood nodes
to improve public realm for better community
interaction
Adopt NMT-first measures like traffic calming of
intersections at each of the neighbourhood nodes.
Create Neighbourhood transit plaza at the
intersection of access route and BRT corridor with
vending zones, gateway features and signage
Ensure active frontage/shop-line along the primary
access route within the neighbourhood.
01
02
03
04
04
04
04
05
05
05
05
06
07
07
01
02
03
04
05
06
07
TOD DEMONSTRATION AREA PROPOSED NEIGHBOURHOOD PLAN
Vanasirinagar Neighbourhood

CHALLENGES & LEARNINGS
Need for Statutory backing: As a guideline framework the city may not be able to find means to channelize the ideas into action, integration of vision / strategy document into the policy framework Need for Regulatory Support: Integration of TOD concepts into the DCR documents, zoning overlay of the Master plan & preparation of detail development plans Institutional Framework: Integrated transit & development has to be a mandate to the organization or an overarching agency that facilitates inter-agency coordination Cross-Financing Mechanisms: Inter-agency coordination for land value capture to harness development potential across TOD corridor Capacity building needs: sensitize and provide exposure to implementing agency on overall benefits of TOD Low real estate demand: New approaches to contextualize TOD for diverse contexts & development demands

THANK YOU