http://yilmaz.mersin.edu.tr/. textbook damodar n. gujarati (2004) basic econometrics, 4th edition,...
TRANSCRIPT

http://yilmaz.mersin.edu.tr/

Textbook
• Damodar N. Gujarati (2004) Basic Econometrics, 4th edition, The McGraw-Hill Companies

ECONOMETRICS I
INTRODUCTION

What is econometrics?
• Literally econometrics mean economic measurement.
• Econometrics may be defined as the social science in which the tools of economic theory, mathematics, and statistical inference are applied to the analysis of economic phenomena. (Goldberger, 1964)
Why A Separate Discipline?
• Econometrics is an amalgam of economic theory, mathematical economics, economic statistics, and mathematical statistics. So why do we need to study econometrics as a seperate discipline?

Why A Separate Discipline?
• Economic theory makes statements or hypotheses that are mostly qualitative in nature. The theory itself does not provide any numerical measure. We need econometrics, because econometrics gives emperical content to most economic theory.
For example, think about the law of demand...

Why A Separate Discipline?
• The main concern of mathematical economics is to express economic theory in mathematical form (equations) without regard to measurability or emperical verification of the theory.
• Verification of the theory is the job of econometricians.

Why A Separate Discipline?
• Economic statistics is mainly concerned with collecting, processing, and presenting economic data in the form of charts and tables.
• Econometrician uses the collected data to test economic theories.

Why A Separate Discipline?
• The data econometrician uses are nonexperimental data. The econometrician uses these data as given.
• Such data are likely to contain errors of measurement, and the econometrician may use special methods of analysis to deal with such errors of measurement.
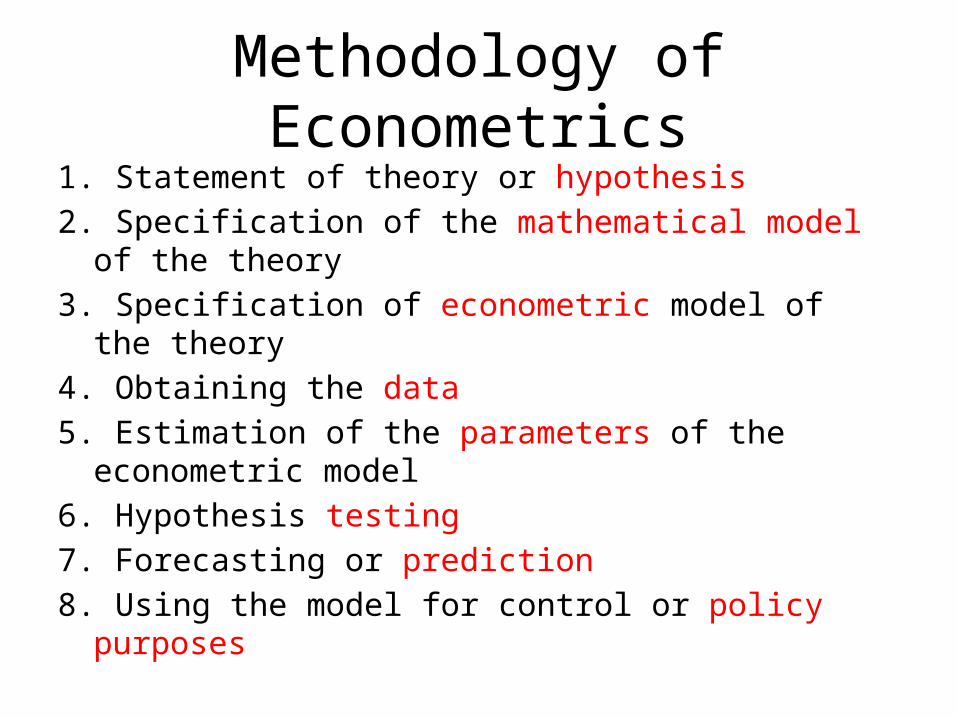
Methodology of Econometrics1. Statement of theory or hypothesis
2. Specification of the mathematical model of the theory
3. Specification of econometric model of the theory
4. Obtaining the data
5. Estimation of the parameters of the econometric model
6. Hypothesis testing
7. Forecasting or prediction
8. Using the model for control or policy purposes
To show these steps we will consider the well-known Keynesian theory of consumption.

1. Statement of theory or hypothesis
• Keynes said:The fundamental psychological law ... is that men are disposed, as a rule and on average, to increase their consumption as their income increases, but not as much as the increase in their income. (Keynes, 1936)
• Keynes postulated that the marginal propensity to consume (MPC) is between 0 and 1.

2. Specification of the mathematical model of consumption
• Keynes did not specify the precise form of the functional relationship between the two. For simplicity, a mathematical economist might suggest the following form of the Keynesian consumption function:
• This equation is the consumption function, where Y = consumption expenditure, X = income...β1 and β2 are the parameters of the model, β1 is the intercept and β2 is the slope coeffient.

2. Specification of the mathematical model of consumption

Terminology
• Parameters• Slope coefficient• Intercept• Model: a set of mathematical equations• Single equation model• Multiple equation model• Dependent variable• Independent (explanatory) variable

3. Specification of the econometric model of consumption
• The relationship between economic variables are generally inexact. To allow for the inexact relationship between economic variables, the econometrician would modify the deterministic consumption function as follows:
where u is the disturbance (error) term. The error term represents all those factors that affect consumption but are not taken into account explicitly.

3. Specification of the econometric model of consumption

Terminology
• Disturbance (error) term• Econometric model• Linear regression model

4. Obtaining data
• To estimate the econometric model, that is, to obtain the numerical values of β1 and β2, we need data.
• In the following slide, Y is personal consumption expenditure and X is gross national product of the US. Both are in 1992 billions of dollars.

4. Obtaining data

4. Obtaining data

5. Estimation of the econometric model
• The actual mechanics of estimating the parameters will be discussed in Chapter 3. For now, note that the statistical technique of regression analysis is the main tool used to obtain the estimates. Using this technique and the data given in Table I.1, we obtain the following estimates of β1 and β2, namely, −184.08 and 0.7064.Thus, the estimated consumption function is:

6. Hypothesis Testing
• The estimated value of β2 is about 0.71. This number is between 0 and 1, as expected, but is it statistically significant? Is this estimate sufficiently below 1 to convince us that this is not a chance occurrence or peculiarity of the particular data we used? Is 0.71 statistically less than 1?
• In order to answer these questions we need to do hypothesis testing.
• The branch of statistical theory which deals with confirmation or refutation of economic theories on the basis of sample evidence is called statistical inference (hypothesis testing).

7. Forecasting or Prediction
• If the chosen model does not refute the hypothesis or theory under consideration, we may use it to predict the future value(s) of the dependent, or forecast, variable Y on the basis of known or expected future value(s) of the explanatory, or predictor, variable X.

7. Forecasting or Prediction
• The actual value of the consumption expenditure reported
in 1997 was 4913.5 billion dollars. The estimated model thus
overpredicted the actual consumption expenditure by about
37.82 billion dollars. We could say the forecast error is about
37.82 billion dollars, which is about 0.76 percent of the
actual GDP value for 1997.

7. Forecasting or Prediction
• We can use the estimated MPC to guess the value of income multiplier (M):
• M = 1/(1-0.71) = 3.4

8. Use of the model for control or policy purposes
• Suppose the government believes that consumer expenditure of
about 4900 (billions of 1992 dollars) will keep the unemployment
rate at the level of about 4.2 percent. What level of income will
guarantee the target amount of consumption expenditure?
• So X must be equal to 7197, approximately. That is, an income
level of about 7197 (billion) dollars, given an MPC of about 0.71,
will produce an expenditure of about 4900 billion dollars.

8. Use of the model for control or policy purposes
• As these calculations suggest, an estimated model may be used for control, or policy, purposes. By appropriate fiscal and monetary policy mix, the government can manipulate the control variable X to produce the desired level of the target variable Y.

Anatomy of econometric modelling
Types of econometrics
• Theoretical econometrics is concerned with the development of
appropriate methods for measuring economic relationships
specified by econometric models. In this aspect, econometrics
leans heavily on mathematical statistics. For example, one of the
methods used extensively in this book is least squares.
• In applied econometrics we use the tools of theoretical
econometrics to study some special fields of economics and
business, such as the production function, investment function,
demand and supply functions, portfolio theory, etc.