http://. higher education roi nysfaaa october 19, 2011 james w. gathard
Post on 18-Dec-2015
218 views
TRANSCRIPT


Higher Education ROI
NYSFAAA
October 19, 2011
James W. Gathard

Higher Education ROI
Value Proposition: (belief)
Educational capital has a direct impact on the nation’s/state’s social and economic health.

Percentage of Individuals Ages 25 and Older Living in Households that Participated in Various Public Assistance Programs, by Education Level,
2008
Sources: The College Board, Education Pays 2010, Figure 1.15; U.S. Census Bureau, 2009; calculations by the authors.
Higher Education ROI
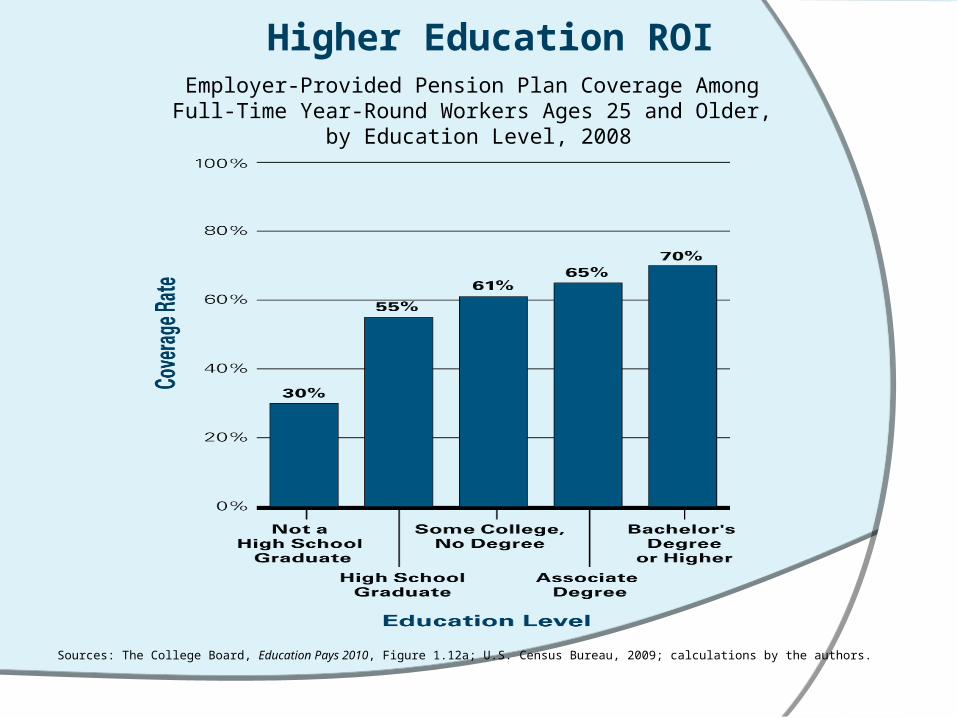
Employer-Provided Pension Plan Coverage Among Full-Time Year-Round Workers Ages 25 and Older,
by Education Level, 2008
Sources: The College Board, Education Pays 2010, Figure 1.12a; U.S. Census Bureau, 2009; calculations by the authors.
Higher Education ROI

Expected Lifetime Earnings Relative to High School Graduates, by Education Level
Sources: The College Board, Education Pays 2010, Figure 1.2; U.S. Census Bureau, 2009; calculations by the authors.
Higher Education ROI

Higher Education ROI
Educational Capital
Investments

Ten-Year Trend in Student Aid and Nonfederal Loans per FTE
Used to Finance Postsecondary Education Expenses in Constant 2009 Dollars, 1999-2000 to 2009-10
SOURCE: The College Board, Trends in Student Aid 2010, Figure 1.

Total Pell Expenditures (in Billions), Maximum and Average Pell Grant (Constant 2009 Dollars, in Thousands), and
Number of Recipients (in Millions), 1976-77 to 2009-10
SOURCE: The College Board, Trends in Student Aid 2010, Figure 13A.
Higher Education ROI
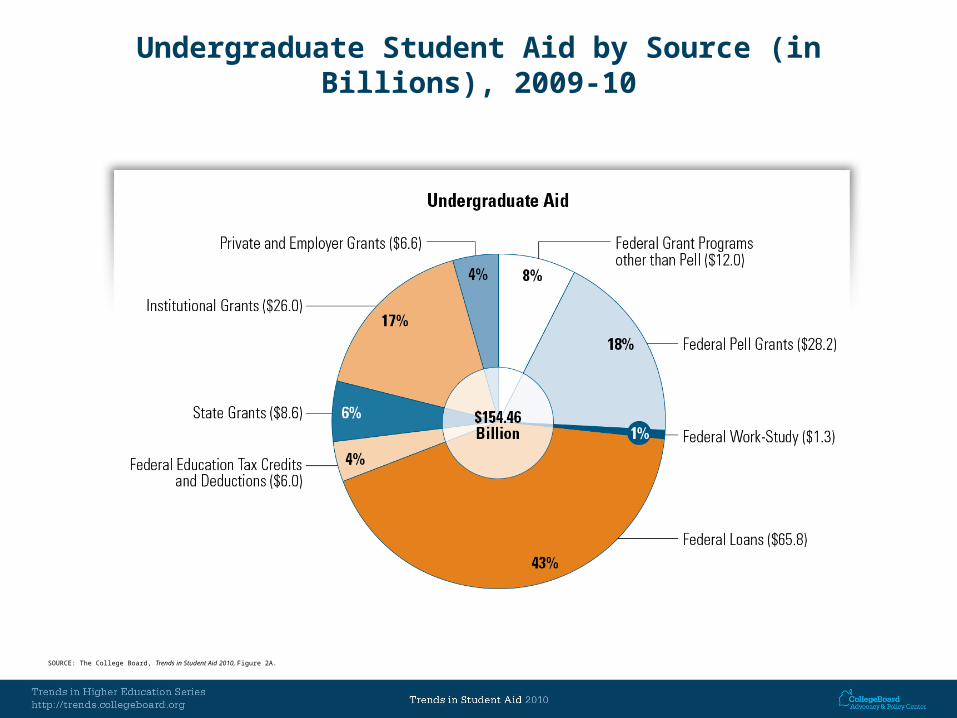
Undergraduate Student Aid by Source (in Billions), 2009-10
SOURCE: The College Board, Trends in Student Aid 2010, Figure 2A.

Graduate Student Aid by Source (in Billions), 2009-10
SOURCE: The College Board, Trends in Student Aid 2010, Figure 2B.

Higher Education ROI
Educational Capital
Outcomes

Mean and Median State Appropriations for Higher Education per $1,000 in Personal Income, 1989-90 to 2009-10
SOURCE: The College Board, Trends in College Pricing 2010, Figure 11A.
Higher Education ROI

Annual Percentage Changes in State Appropriations for Higher Education per Full-Time Equivalent (FTE) Student and in Tuition and Fees at Public Four-Year
Institutions in Constant 2009 Dollars, 1979-80 to 2009-10
SOURCE: The College Board, Trends in College Pricing 2010, Figure 10A.
Higher Education ROI

State Appropriations for Higher Education per $1,000 in Personal Income by State, 2009-10 (including Federal Stimulus
Funds)
SOURCE: The College Board, Trends in College Pricing 2010, Figure 11B.
Higher Education ROI

Higher Education ROI
# 1
Higher Education ROI
Global Performance (OECD*)
USA ranks 1st in college dropout rates
USA ranks 1st in dollar investments
*Organization of Economic Co-operation and Development 31 democracies and free market countries in NA, Europe and Asia

Higher Education ROI
Global Performance (OECD*)
USA ranks 18th in college graduation rates
USA ranks 21st in high school graduations rates
*Organization of Economic Co-operation and Development 31 democracies and free market countries in NA, Europe and Asia

Higher Education ROI


Higher Education ROI
U.S. educational pipeline by race/ ethnicity

Higher Education ROI

Higher Education ROI

Change the Conversation
Be proactive rather than reactive
Transfer your passion
Go on the offense
BE the “best” not necessarily # 1
Communicate “success” value propositions
Seek opportunities to speak with policymakers
Invite policymakers to campus
Higher Education ROI


Higher Education ROI
Source: U.S. Census Bureau, 5% Public Microdata Samples (based on 2000 Census).
The greatest portion of U.S. population growth from ages 0 to 44 is projected to be among minorities.