http:// progressive increase in educational levels of the population 1940: 60% elementary educated,...
TRANSCRIPT

http://www.dallasfed.org/fed/annual/2004/ar04.pdf
Progressive increase in educational levels of the population
1940: 60% Elementary Educated, 5% college educated
2004: 7% elementary educated, 25% college educated

Money Earnings (Mean) for Full-Time,
Year-Round Male Workers, 2003
Lifetime Sum of College vs High School Earnings
$593,000

Money Earnings (Mean) for
Full-Time, Year-Round Female Workers, 2003
Lifetime Sum of College vs High School Earnings
$415,000
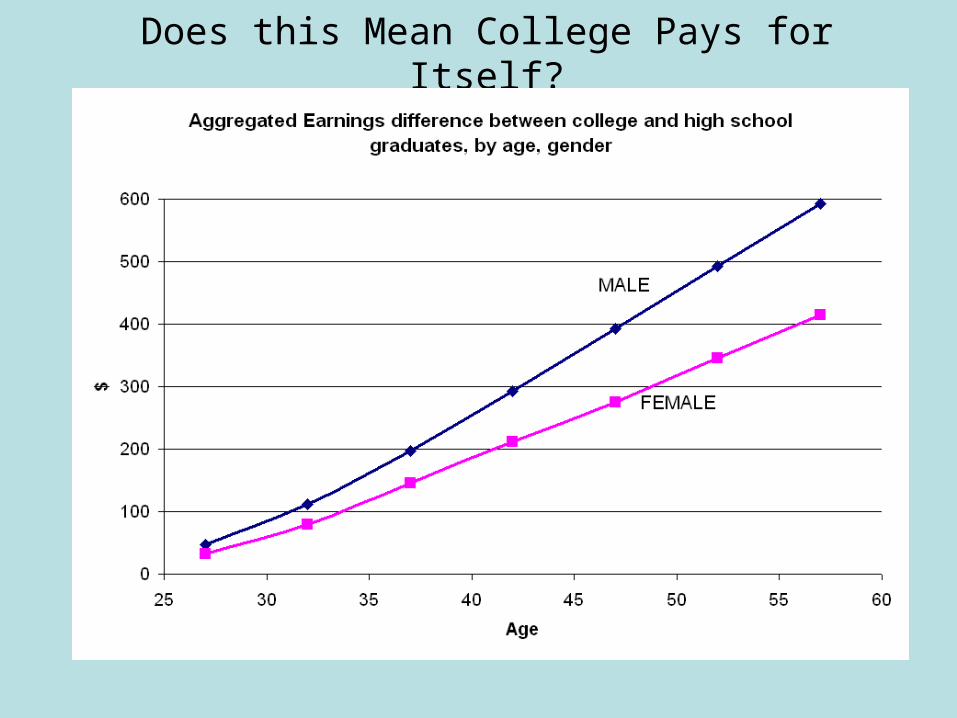
Does this Mean College Pays for Itself?

College Enrollment and College Wage Premium
Based on Ehrenberg and Smith. 2006: Table 9.1, p. 286

College Enrollment and College Wage Premium
Based on Ehrenberg and Smith. 2006: Table 9.1, p. 286
6 point increase in wage premium raise male enrollment by 1 point
3 point increase in wage premium raise female enrollment by 1 point

Male Profile Female Profile

Stylized Facts Regarding Age Earnings Profiles
1) All profiles flatten with ageMost rapid wage growth early in career
2) Earnings increase with education
3) Earnings gap between education groups widens with age
4) Male female comparisons1) Female earnings lower than male earnings
2) Female wage profiles flatter than men
Note: These are synthetic cohorts—longitudinal data may differ especially for women

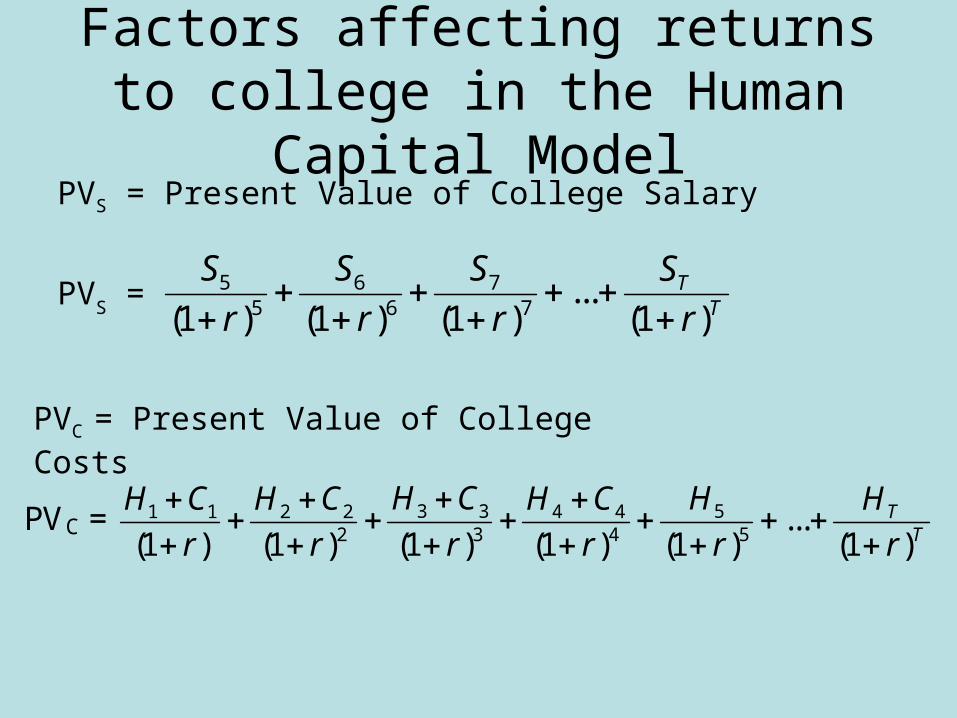
Factors affecting returns to college in the Human Capital Model
Ht = Earnings from High School Education in year t
St = Earnings from College Education in year t
Ct = College Tuition in year t
r = Rate of time preference
T = Time Span
Factors affecting returns to college in the Human Capital Model
PVS = 5 6 75 6 7
...(1 ) (1 ) (1 ) (1 )
TT
S S S S
r r r r
PVC = Present Value of College Costs
PVS = Present Value of College Salary
PVC = 3 3 51 1 2 2 4 42 3 4 5
...(1 ) (1 ) (1 ) (1 ) (1 ) (1 )
TT
H C HH C H C H C H
r r r r r r

Ht => decreases incentive to invest
St => increases incentive to invest
Ct => decreases incentive to invest
r => decreases incentive to invest
T => increases incentive to invest
NPV = 3 3 5 51 1 2 2 4 42 3 4 5
( ) ( )( ) ( ) ( ) ( )...
(1 ) (1 ) (1 ) (1 ) (1 ) (1 )T T
T
H C S HH C H C H C S H
r r r r r r
Factors affecting returns to college in the Human Capital Model
NPV: Net Present Value

Internal rate of return: the interest rate that sets NPV = 0
Measure of the returns to college
NPV = 3 3 5 51 1 2 2 4 42 3 4 5
( ) ( )( ) ( ) ( ) ( )...
(1 ) (1 ) (1 ) (1 ) (1 ) (1 )T T
T
H C S HH C H C H C S H
r r r r r r
Factors affecting returns to college in the Human Capital Model
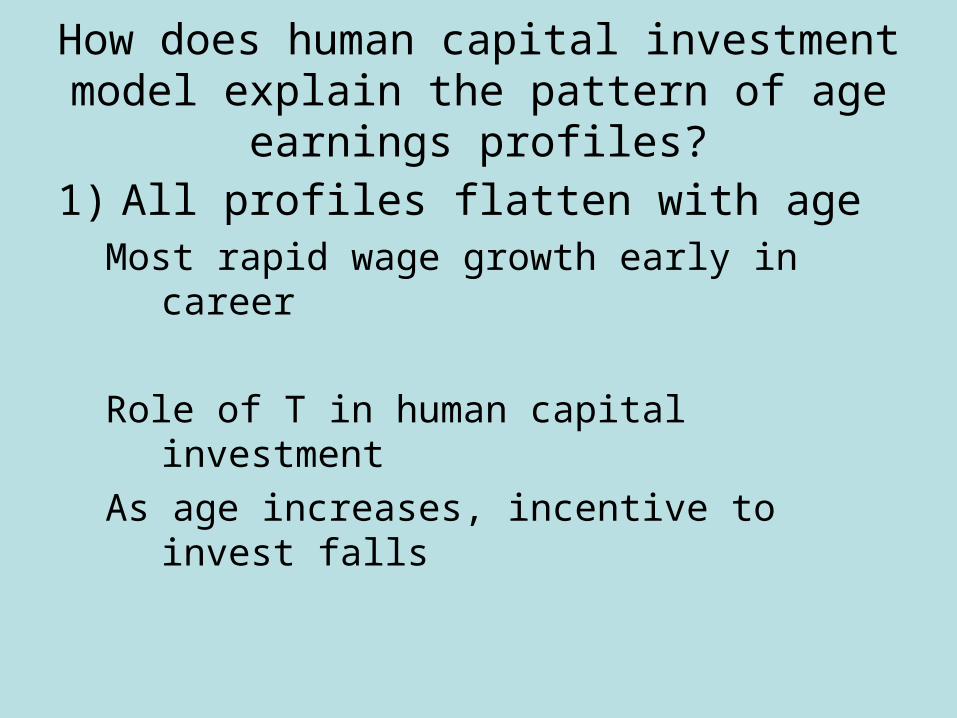
How does human capital investment model explain the pattern of age earnings profiles?
1) All profiles flatten with ageMost rapid wage growth early in career
Role of T in human capital investment
As age increases, incentive to invest falls

How does human capital investment model explain the pattern of age earnings profiles?
2) Earnings increase with education
S>H required for investment

How does human capital investment model explain the pattern of age earnings profiles?
3) Earnings gap between education groups widens with age
More educated get more firm-provided training
Sorting on r: More educated have lower r?

How does human capital investment model explain the pattern of age earnings profiles?
4) Male female comparisons1) Female earnings lower than male earnings
Discrimination?Role of discontinuous labor supply
Human capital decay affects occupational choiceAbsence decreases wages
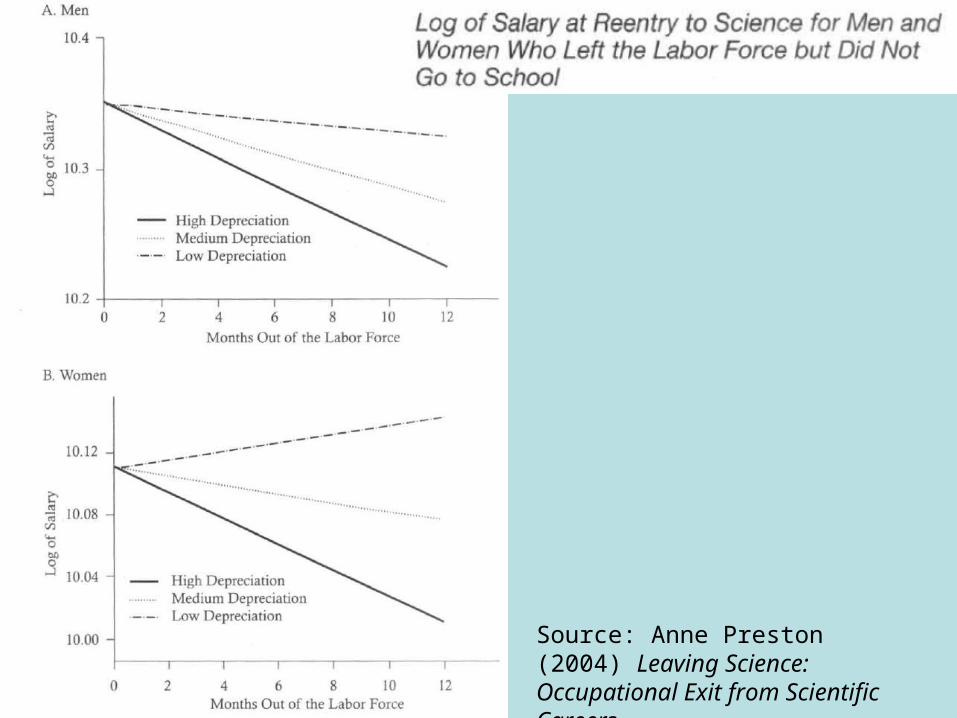
Source: Anne Preston (2004) Leaving Science: Occupational Exit from Scientific Careers
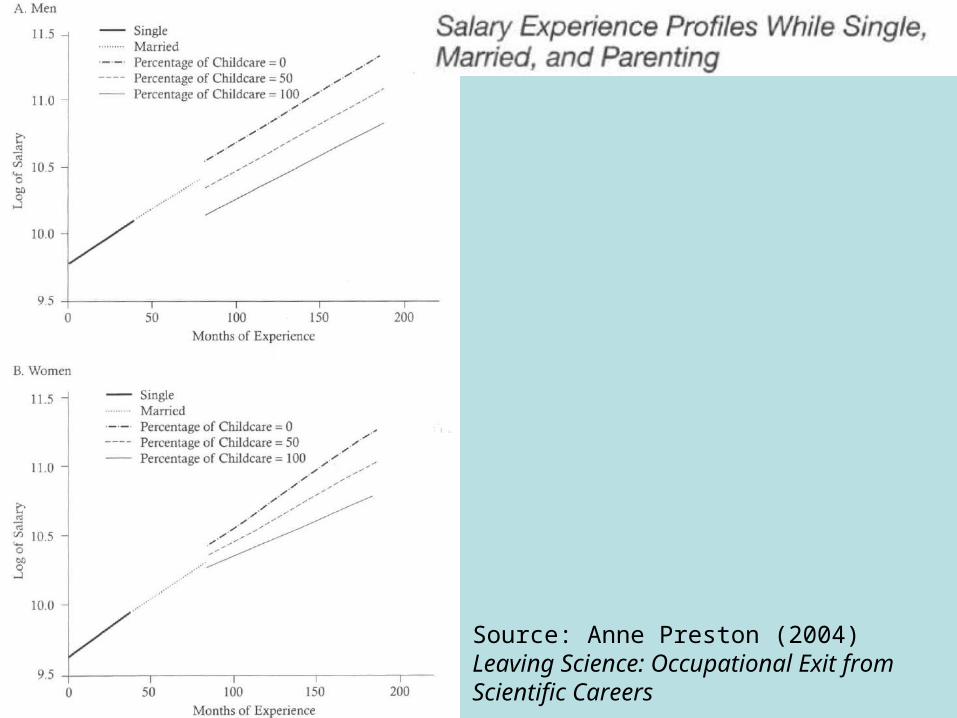
Source: Anne Preston (2004) Leaving Science: Occupational Exit from Scientific Careers

How does human capital investment model explain the pattern of age earnings profiles?
2) Male female comparisons2) Female wage profiles flatter than men
Role of marital status in age earnings profiles

How does human capital investment model explain the pattern of age earnings profiles?
2) Male female comparisons2) Female wage profiles flatter than men
How have these changed over time
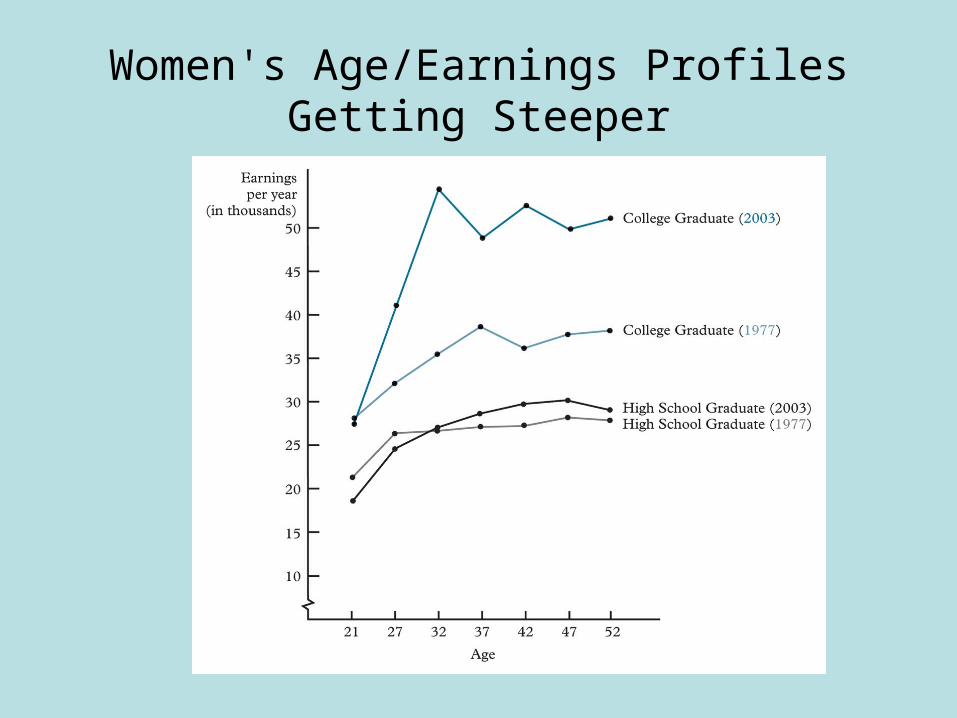
Women's Age/Earnings Profiles Getting Steeper

Occupational/Educational Choices getting more similar between men and women
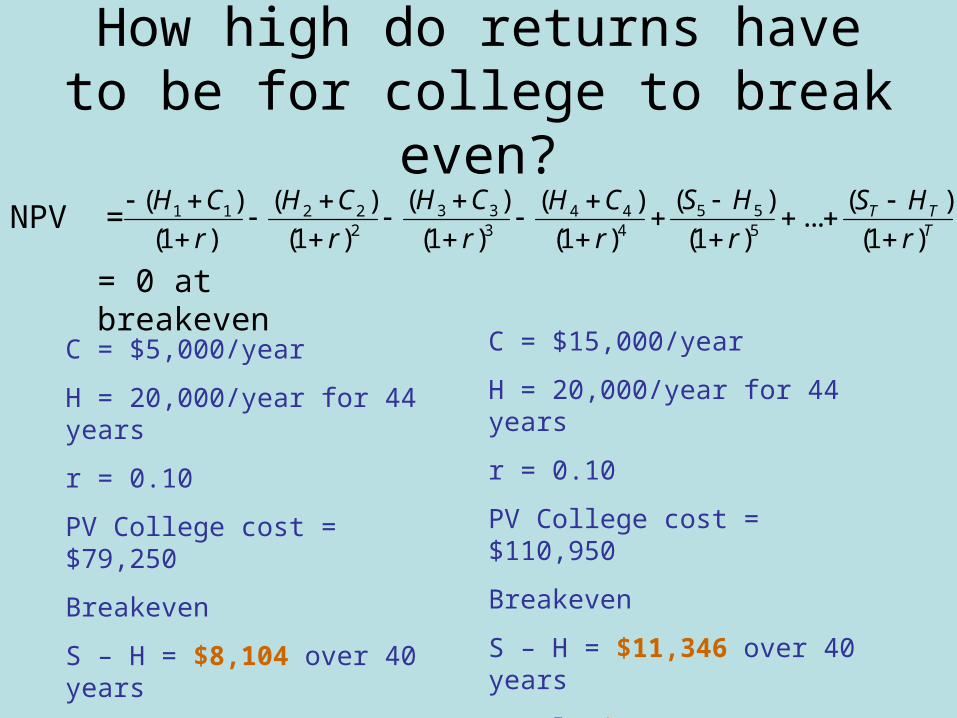
How high do returns have to be for college to break even?
NPV = 3 3 5 51 1 2 2 4 42 3 4 5
( ) ( )( ) ( ) ( ) ( )...
(1 ) (1 ) (1 ) (1 ) (1 ) (1 )T T
T
H C S HH C H C H C S H
r r r r r r
= 0 at breakeven
C = $5,000/year
H = 20,000/year for 44 years
r = 0.10
PV College cost = $79,250
Breakeven
S – H = $8,104 over 40 years
Total: $324,000
C = $15,000/year
H = 20,000/year for 44 years
r = 0.10
PV College cost = $110,950
Breakeven
S – H = $11,346 over 40 years
Total: $453,830

Diminishing returns to schooling
Why?

Diminishing returns to schooling
Why?
Opportunity cost
Direct cost
Marginal Product of time invested in schooling

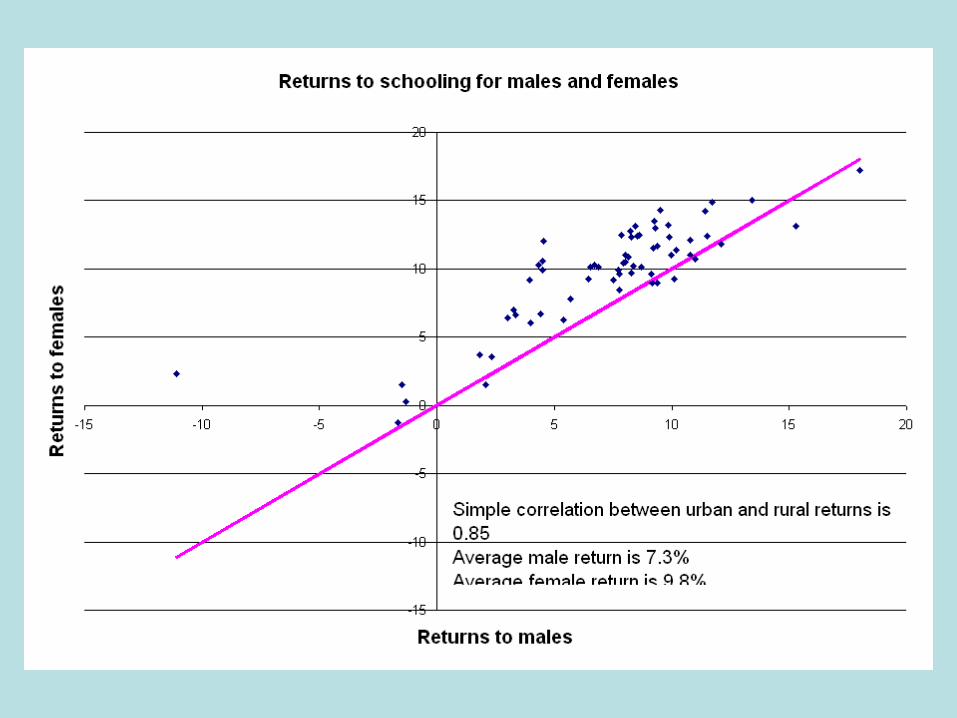
Computing returns to schooling
ln(W) = β0 + β1 ED + β2 EXP + β3 EXP^2 + γZ + ε
β1 is a measure of the percentage returns to an additional year of schooling
Log Earnings Function

Alternative estimates of the returns to schooling as summarized in David Card, Handbook of Labor Economics Vol. 3A . 1999
Card, 1995 0.084
Card, 1999
Men 0.106
Women 0.110
Conneely and Uusitalo, 1997 0.114
Ashenfelter and Zimmerman, 1997 0.08 – 0.109


If individuals get returns to schooling, why should the public subsidize it?
If individuals get returns to schooling, why should the public subsidize it?
Externalities: Benefits go to individuals other than the one receiving schooling
=>Individuals will underinvest relative to social optimum
Liquidity constraints: individuals cannot borrow against future expected returns
=>Poor will underinvest
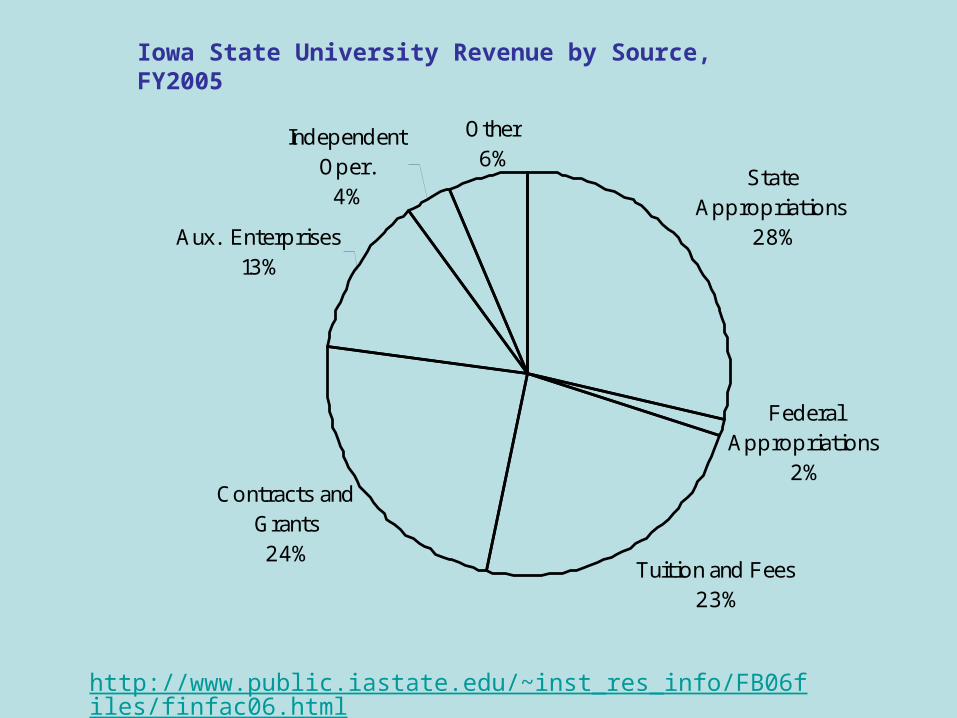
Tuition and Fees23%
Federal Appropriations
2%
State Appropriations
28%Aux. Enterprises13%
Independent Oper.4%
Contracts and Grants24%
Other6%
http://www.public.iastate.edu/~inst_res_info/FB06files/finfac06.html
Iowa State University Revenue by Source, FY2005

–––2000-2001––– –––2004-2005–––
DOLLARS % DOLLARS % GROWTHRevenues
State Appropriations 281,459 38.6% 236,156 28.5% -16.1% Federal Appropriations 10,802 1.5% 12,446 1.5% 15.2% Tuition and Fees 118,332 16.2% 193,547 23.4% 63.6% Contracts and Grants 139,990 19.2% 197,838 23.9% 41.3%
Auxiliary Enterprises1 103,649 14.2% 106,093 12.8% 2.4%
Independent Operations2 25,317 3.5% 29,075 3.5% 14.8%
Other3 48,716 6.7% 52,767 6.4% 8.3%
Total $728,265 $827,922
Revenues rose by 13.7% compared to 12.3% for inflation
Iowa State University Revenue by Source, FY2001 and FY2005
(Thousands of dollars)
1 Iowa State Center, Residence System, University Bookstore, Athletic Department.
2 Ames Laboratory.
3 Sales of educational activities and equipment, investment income

Source: What D'Ya Know? Lifetime Learning in Pursuit of the American Dream 2004 Annual Report—Federal Reserve Bank of Dallas
Higher Proportion Educated means higher per capita income, faster growth
Correlation or causation?

AGO
ALB
ARM
AZE
BDI
BEN
BFA
BGD
BOL
BRA
CAF
CIV
CMR
COL
COM
DOMEGY
ETHGABGHA
GIN
GMB
GNB
GTM
GUY
HTI
IDN
IND
KAZ
KEN
KGZ
KHM
LAO
LSO
MAR
MDA
MDG
MLI
MMR
MNG
MOZ
MRTMWI
NAM
NER
NGA
NIC
NPL
PAK
PAN PERPHL
PNG
RWA
SEN
SLE
SUR
SWZ
TCD
TGO
THA
TJK
TMP
TUR
TZA
UGAUZB
VEN
VNM
ZAF
ZARZMB
ZWE
-.2
-.1
0.1
.2.3
.4.5
.6D
iffe
ren
ce b
etw
ee
n m
ale
an
d f
em
ale
en
rollm
en
t in
urb
an
are
as
-.2 -.1 0 .1 .2 .3 .4 .5 .6Difference between male and female enrollment in rural areas
Gender Differences (by urban and rural) for ages 15-17
45o line: male = female
>0: Rural Male ed > Female ed
>0: Urban Male ed > Female ed
Higher enrollment
Quad 1: Males
Quad 2: Urban male, Rural Females
Quad 3: Females
Quad 4: Rural Males, Urban Females
III
III IV
Male and Female Enrollment Rates, Ages 15-17, 70 Developing countries

If individuals get returns to schooling, why should the public subsidize it?
Are externalities bigger for women?
Fertility
Health