hst alignment and station screening ... alignment and station screening california high-speed train...
TRANSCRIPT
APPENDIX 2-H
HST ALIGNMENT AND STATION SCREENING EVALUATION SUMMARY TABLES
HST Alignment and Station Screening California High-Speed Train Program EIR/EIS Evaluation Summary Tables
CALIFORNIA HIGH SPEED RAIL AUTHORITY
U.S. Department of Transportation Federal Railroad Administration
Page 2-H-1
APPENDIX 2-H
HST ALIGNMENT AND STATION SCREENING EVALUATION SUMMARY TABLES
Summary—HST Alignment/Station Screening Evaluation
This appendix contains the tables summarizing the comparison of alignment and station options prepared during the screening evaluation of the High-Speed Train (HST) Alternative. These screening tables present all options considered, distinguishing among the options carried forward and those eliminated from further consideration. The primary considerations for elimination are highlighted.
The HST Alternative represents the proposed action and was developed by considering a range of potential HST technologies, corridors, and within the corridors alignment and station options. Informed by previous studies and the scoping process, the California High Speed Rail Authority (Authority) and the Federal Railroad Administration (FRA) evaluated potential HST corridors and defined those that would be able to best meet the purpose of the system: to provide a reliable mode of travel that links the major metropolitan areas of the state and delivers predictable and consistent travel times. A further objective is, in a manner sensitive to and protective of California’s unique natural resources, to provide an interface with commercial airports, mass transit, and the highway network and to relieve the capacity constraints of the existing transportation system as intercity travel demand increases in California. Through the screening process, reasonable and feasible technology, alignment and station options were identified for analysis in this Program Environmental Impact Report/Environmental Impact Statement (EIR/EIS).
HST alignment options considered were generally configured along or adjacent to existing rail transportation facilities, rather than in new corridors. While a wide range of options have been considered, the Authority’s initial conceptual approach, previous corridor evaluations, and the screening evaluation conducted as part of this Program EIR/EIS have consistently shown a potential for lower environmental impacts along existing highway and rail facilities than on new alignments through both developed and undeveloped areas. Although increasing the overall width of existing facilities could have similar potential impacts on the amount of land disturbed as creating new facilities, creating new facilities would also introduce potential land use incompatibility and division or separation issues in both urban communities and rural settings (farmlands, open spaces).
Several factors were considered in identifying potential station locations. These include potential connections with other modes of transportation, ridership potential (considering the distribution of population and major destinations along the route), potential through speeds, costs, and local station access times. The ultimate locations and configurations of stations cannot be determined until the project level environmental process. The station locations described in this appendix were identified generally and represent the most likely sites based on current knowledge, consistent with the objective to serve the major population centers of the state. There would be a critical tradeoff between the accessibility of the system to potential passengers and the resulting HST travel times. The potential station locations shown are spaced approximately 50 miles (80 kilometers [km]) apart in rural areas and 15 miles (24 km) apart in the metropolitan areas. Having additional or more closely spaced stations would increase travel times and would reduce the ability to operate both express and local services, due to increased ingress/egress of trains from the mainline.
The Authority and the FRA initiated the alternatives development process in February 2000 to identify the most reasonable, feasible, and practicable HST alignment and station options for analysis in this Program EIR/EIS. The general project purpose was described early in the process and is closely related to the general objectives and criteria for the proposed HST system set forth by the Authority with the
HST Alignment and Station Screening California High-Speed Train Program EIR/EIS Evaluation Summary Tables
CALIFORNIA HIGH SPEED RAIL AUTHORITY
U.S. Department of Transportation Federal Railroad Administration
Page 2-H-2
concurrence of the FRA. Potential high-speed train corridors identified in previous studies and those identified during scoping were evaluated for their ability to meet the general project purpose and objectives. Some corridors were found not to meet the project purpose, while others were further considered through an HST alignments/stations screening evaluation to identify reasonable and practical options. This alignment and station evaluation was accomplished through the following steps.
• Review of alignment and station options identified in previous studies.
• Identification through the environmental scoping process of additional potentially feasible alignment and station options.
• Evaluation of alignment and station options using engineering, environmental, and financial criteria and evaluation methodologies (set forth in the High-Speed Train Alignment/Station Screening Evaluation Methodology Report [May 2001]).
Review of the ability of alignment and station options to meet general project objectives.
To simplify the evaluation of environmental impacts throughout this Program EIR/EIS, the state was divided into five geographic regions. The results of the five regional screening studies were documented in the HST alignments/stations screening evaluation. The technical data provided in the screening evaluation, combined with public and agency input, provided the Authority and the FRA with the necessary information to focus further studies for the Program EIR/EIS on a range of alignments, station locations, and HST systems that are considered practicable and were deemed likely to attain the following project objectives.
• Maximize ridership/revenue potential.
• Maximize connectivity and accessibility.
• Maximize compatibility with existing and planned development.
• Maximize avoidance of areas with geological and soils constraints.
• Maximize avoidance of areas with potential hazardous materials.
• Minimize operating and capital costs.
• Minimize impacts on natural resources.
• Minimize impacts on social and economic resources.
• Minimize impacts on cultural resources.
The results of the detailed screening evaluation are described in the California High-Speed Train Screening Report.
The mountain crossings for the proposed HST system would present difficult terrain and result in the need for extensive tunneling to accomplish the necessary traversing alignments. The screening evaluation of the mountain crossings was complicated by the vast potential for variation in specific alignment (horizontal and vertical) and associated differences in costs and environmental impacts. In the screening evaluation, alignment options were under consideration that could require a total of over 80 miles (129 km) of twin-tube tunneling, including the potential for continuous tunnel segments of over 30 miles (48 km) in length. Crossing the Tehachapi Mountains between Los Angeles and Bakersfield could result in 30 to 45 total miles (72 km) of tunneling in extremely challenging seismic and geologic conditions. Relative certainty and confidence in the feasibility of the proposed tunneling and associated cost estimates were of critical importance to the screening evaluation.
HST Alignment and Station Screening California High-Speed Train Program EIR/EIS Evaluation Summary Tables
CALIFORNIA HIGH SPEED RAIL AUTHORITY
U.S. Department of Transportation Federal Railroad Administration
Page 2-H-3
Given the potential for a wide range of impacts within the mountain passes, the Authority completed a review of tunneling considerations, including a two-day technical conference, and an alignment optimization and refinement study using the Quantm system to assist in the screening review.1 Following the technical tunneling conference, the Authority developed objective criteria to minimize the amount of tunneling required, particularly the use of long tunnels (over 6 miles [10 km] in total length), due to cost, time of construction, and potential for delay. In addition, as a result of the technical conference tunnels over 12 miles (19 km) in total length are considered infeasible for this project. The crossing of major fault zones at grade was also identified as a necessary criterion. The technical information produced by the tunneling conference is documented in the Tunneling Issues Report (January 2003). Using the Quantm system a broad range of horizontal and vertical variations on alignment options were analyzed to provide more confidence that optimal alignments are being considered and more certainty concerning the cost estimates and potential impacts of each alignment option. The Quantm study focused on the following three objectives:
• Review the general corridors considered in the screening studies to date and/or identify any other corridors of equal or greater viability that may not have been considered in previous studies.
• Refine the alignment options in each general corridor to identify the most viable options in terms of infrastructure requirements and impact avoidance/minimization.
• Test the sensitivity of the alignment options in each corridor to key defining criteria such as vertical grade (2.5% and 3.5%), alignment geometry, infrastructure (tunnel, structure) costs, and environmental constraints.
The Quantm system identified, located, and quantified the cost of approximately 12 million alignment variations for each mountain crossing and provided a range of optimal alignments that minimized tunneling and capital costs while avoiding or minimizing potential impacts on natural resources and other sensitive areas (communities, national forests, etc.). The alignment refinement studies provided data to support the screening evaluation in the mountain passes and are documented in the Alignment Refinement/Optimization and Evaluation of the Quantm System (April 30, 2003).
For the HST Alternative, a number of alignment and station options, and technology options, were considered. The steel-wheel-on-steel-rail technology option was retained for further study, and the magnetic levitation technology was not recommended for the proposed HST system. There are three general reasons why alignment options were eliminated from further consideration.
• Failure to meet the general project purpose and objectives,
• Practicability constraints, and
• High potential for significant adverse environmental consequences.
For most of the alignment and station options not carried forward, failure to meet the general project purpose and objectives and practicability constraints were the primary reasons for elimination. Environmental criteria were considered a reason for elimination when an option had significantly more probable environmental impacts than other practicable options for the same segment. General project purpose and objectives were considered in terms of ridership potential, connectivity and accessibility, incompatibility with existing or planned development, or severe operational constraints. Practicability constraints were considered in terms of cost, constructability, right-of-way constraints, or other technical issues. To assess the constructability of tunnels, some specific thresholds were established to help guide the ranking. Continuous tunnel lengths of over 12 miles (19 km) were considered impracticable, and the
1 The Quantm system is an automated route selection and optimization tool that carries out automated alignment searches and corridor screening based on client or user specified geometry, constraints, and cost parameters. While Quantm has been widely utilized in Australia, the Authority’s work is the first application of this optimization system in North America.
HST Alignment and Station Screening California High-Speed Train Program EIR/EIS Evaluation Summary Tables
CALIFORNIA HIGH SPEED RAIL AUTHORITY
U.S. Department of Transportation Federal Railroad Administration
Page 2-H-4
crossing of major fault zones at grade was also identified as a necessary criterion. For other practicability considerations (e.g., right-of-way constraints, construction issues, costs) thresholds could not be established for this program-level evaluation and impracticability was determined based upon professional judgment. Environmental constraints are identified for alternatives only if they constituted primary reasons for eliminating an alternative.
A relative and comparison using qualitative indicators of potential impacts is appropriate for a screening evaluation in a program level environmental analysis, due to the broad planning decisions being considered and the substantial differences in context among different parts of the study area. The potential alignment and station options in each region that were recommended for study in the Program EIR/EIS were considered likely to be practicable and meet the general project purpose and objectives.
Screening Evaluation Criteria
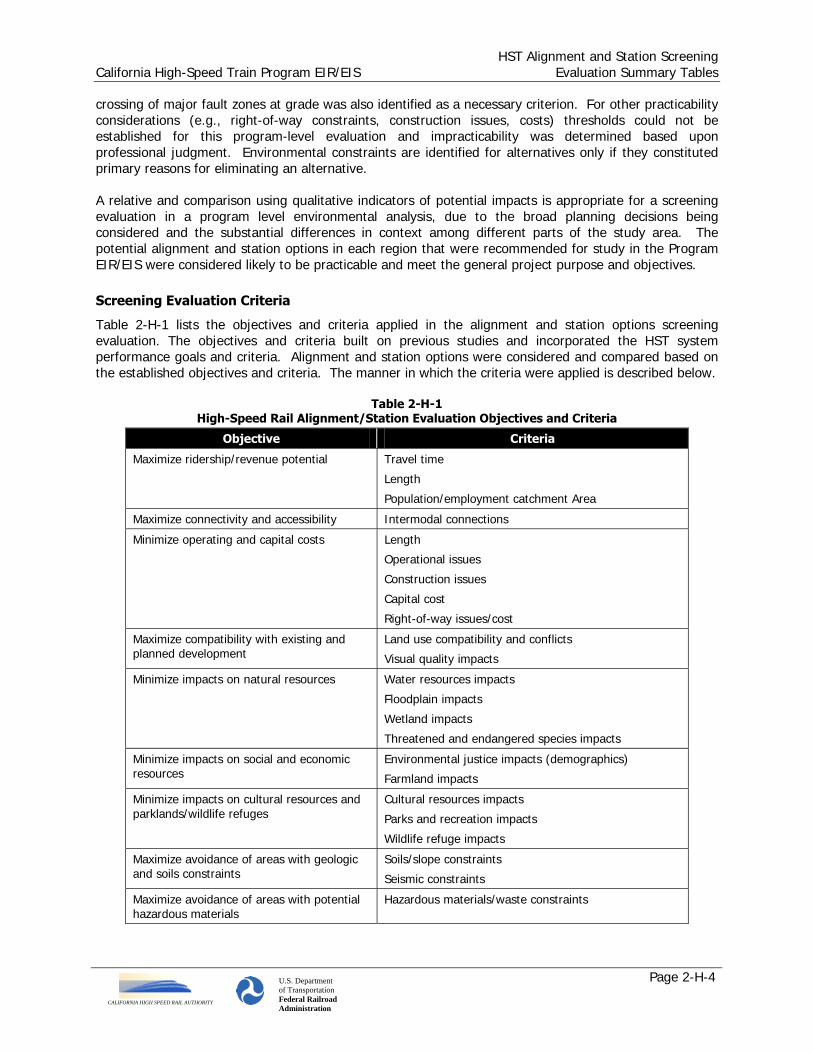
Table 2-H-1 lists the objectives and criteria applied in the alignment and station options screening evaluation. The objectives and criteria built on previous studies and incorporated the HST system performance goals and criteria. Alignment and station options were considered and compared based on the established objectives and criteria. The manner in which the criteria were applied is described below.
Table 2-H-1 High-Speed Rail Alignment/Station Evaluation Objectives and Criteria
Objective Criteria
Maximize ridership/revenue potential Travel time
Length
Population/employment catchment Area
Maximize connectivity and accessibility Intermodal connections
Minimize operating and capital costs Length
Operational issues
Construction issues
Capital cost
Right-of-way issues/cost
Maximize compatibility with existing and planned development
Land use compatibility and conflicts
Visual quality impacts
Minimize impacts on natural resources Water resources impacts
Floodplain impacts
Wetland impacts
Threatened and endangered species impacts
Minimize impacts on social and economic resources
Environmental justice impacts (demographics)
Farmland impacts
Minimize impacts on cultural resources and parklands/wildlife refuges
Cultural resources impacts
Parks and recreation impacts
Wildlife refuge impacts
Maximize avoidance of areas with geologic and soils constraints
Soils/slope constraints
Seismic constraints
Maximize avoidance of areas with potential hazardous materials
Hazardous materials/waste constraints

HST Alignment and Station Screening California High-Speed Train Program EIR/EIS Evaluation Summary Tables
CALIFORNIA HIGH SPEED RAIL AUTHORITY
U.S. Department of Transportation Federal Railroad Administration
Page 2-H-5
These criteria and how they were measured is described in Appendix 2-I, Screening Evaluation Methodology and Criteria. Some of the screening evaluation criteria focused on cost and travel time as primary indicators of engineering viability and ridership potential related to HST operations. Capital costs were estimated and travel times were quantified for each of the alignment and station options considered. Other engineering criteria such as operational, construction, and right-of-way issues were evaluated qualitatively. These engineering criteria were based on accepted engineering practices, the criteria and experiences of other railway and HST systems, and the comments of HST manufacturers as documented in the Engineering Criteria Report (June 2001).
The broad objectives related to the environment and the general criteria used for evaluation reflect the objectives of the National Environmental Policy Act (NEPA) and California Environmental Quality Act (CEQA), and are consistent with the objective of the Clean Water Act Section 404(b)(1) to provide consideration of alternatives to minimize impacts on waters of the United States. The environmental constraints and impacts criteria focused on environmental issues that can affect the location or selection of alignments and stations.
To identify potential impacts, a number of commonly available geographic information systems (GIS) digital data sources were used along with published information from federal, state, regional, and local planning documents and reports. Alignments and stations right-of-way widths dictated by engineering requirements were utilized to identify in general terms the sensitive environmental resources within each corridor segment. Potential environmental impacts were reviewed by considering areas of potential impact appropriate to the resources, and these areas varied from 100 feet to 0.5 mile, extending beyond the conceptual right-of-way for the segments. In some cases, field reconnaissance was required to view on-the-ground conditions and to provide relative values. The methods used to identify potential impacts are also described in the High-Speed Train Alignment/Station Screening Evaluation Methodology Report (May 2000).
Evaluation Results—Review Of High-Speed Train Corridors
Tables 2-H-2 and 2-H-3 summarize the comparison of HST alternative corridors that were evaluated during the alternatives screening process based on the consideration of available information, including data from previous studies. The tables include both the corridors that were carried forward and those that were eliminated from further consideration. The detailed technical results and description of public involvement activities and additional data that support the decision to eliminate some conceptual alternatives are contained in previously completed reports, including the Authority’s final business plan (June 2000), and the corridor evaluation (December 1999), and the Commission’s Summary Report and Action Plan (December 1996), Corridor Evaluation and Environmental Constraints Analysis, Final Report and Appendix Volume 1 (September 1996), and the Definition and Ranking of Potential Alignments Draft (September 1995). These previous studies, incorporated similar system objectives, analysis methods, and evaluation criteria as used in this Program EIR/EIS. These previous corridor evaluation studies applied GIS databases and analysis methods that have been refined, updated, and applied in this Program EIR/EIS.
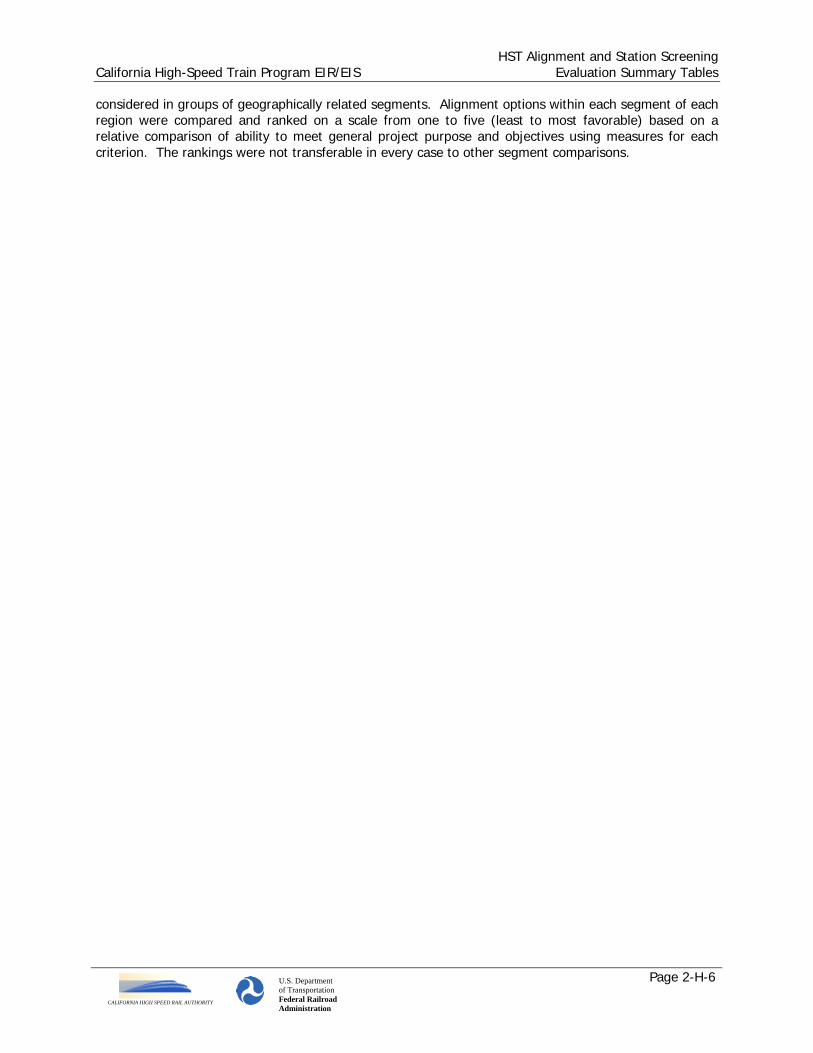
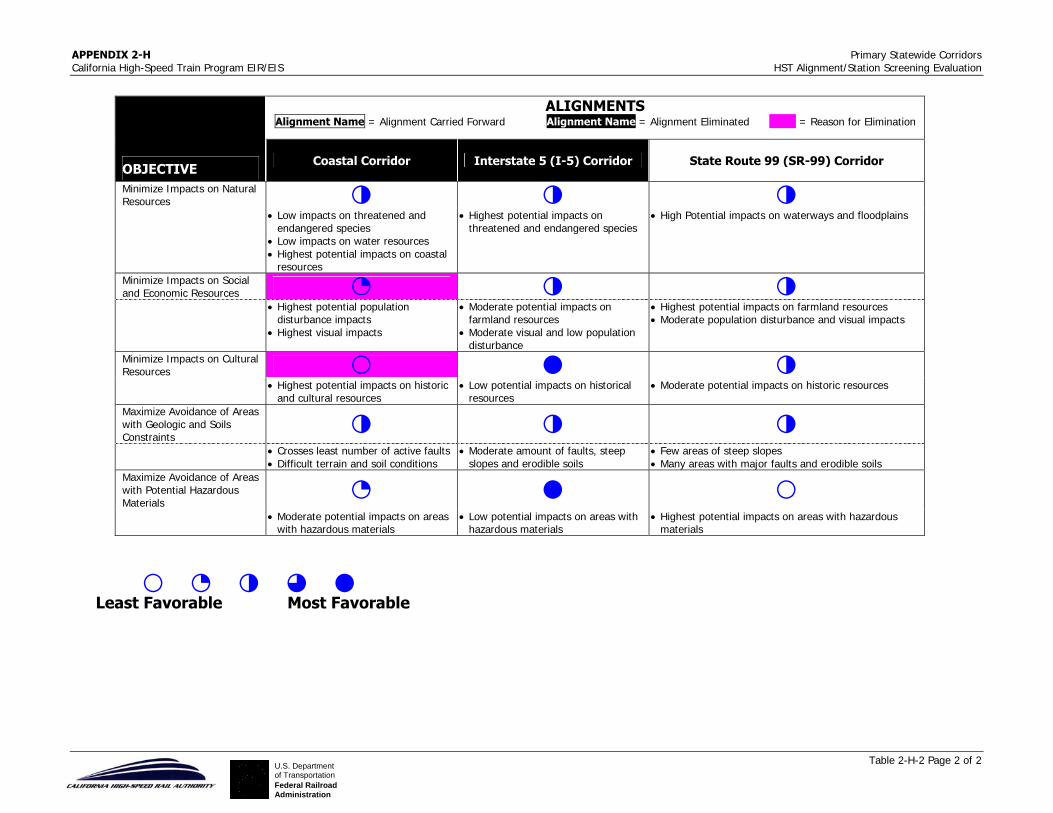
Table 2-H-2 compares the State Route 99 (SR-99), Interstate 5 (I-5), and Coastal corridors between San Francisco and Los Angeles. Table 2-H-3 compares the northern mountain crossings between the Bay Area and the Central Valley (Pacheco Pass, Panoche Pass and Altamont Pass). These screening tables present all factors considered distinguishing between the corridors carried forward and those eliminated from further consideration. In addition, the primary considerations for elimination are highlighted.
Evaluation Results—Review Of Alignment/Station Options
Tables 2-H-4 through 2-H-20 compare alignment and station options investigated during the screening evaluation for the five regional study areas. Within the five study areas alignment options were
HST Alignment and Station Screening California High-Speed Train Program EIR/EIS Evaluation Summary Tables
CALIFORNIA HIGH SPEED RAIL AUTHORITY
U.S. Department of Transportation Federal Railroad Administration
Page 2-H-6
considered in groups of geographically related segments. Alignment options within each segment of each region were compared and ranked on a scale from one to five (least to most favorable) based on a relative comparison of ability to meet general project purpose and objectives using measures for each criterion. The rankings were not transferable in every case to other segment comparisons.

APPENDIX 2-H Primary Statewide Corridors California High-Speed Train Program EIR/EIS HST Alignment/Station Screening Evaluation
Table 2-H-2 Page 1 of 2 U.S. Departmentof TransportationFederal RailroadAdministration
Table 2-H-2 Previous Studies, Primary Statewide Corridors – High-Speed Train Alignment Attainment of Objectives
Los Angeles to the San Francisco Bay Area
ALIGNMENTS Alignment Name = Alignment Carried Forward Alignment Name = Alignment Eliminated = Reason for Elimination
OBJECTIVE Coastal Corridor Interstate 5 (I-5) Corridor State Route 99 (SR-99) Corridor
1 3 5 Maximize Ridership / Revenue Potential
• Slowest SF-LA travel times – 3:25 to 4:30 depending on alignment option
• Serves Coastal Cities/ Communities • Longest route between Los Angeles
and San Francisco Bay Area (43%-97% longer than I-5 Corridor)
• Least ridership potential: 24-46% less ridership than shortest I-5 option
• Fastest SF-LA travel times – 2:23 to 2:31 depending on alignment option
• Most direct route between Los Angeles and Northern Markets (San Francisco Bay Area or Sacramento)
• No Service to Central Valley Cities (e.g., 20 miles from Bakersfield and 46 miles from Fresno)
• Very little projected growth in catchment area
• Fast SF-LA Travel times – 2:34-2:47 depending on alignment option
• Serves Central Valley Cities • More population served (1 million more than Coastal
Corridor and 3-4 million more than I-5 Corridor) • 1.2 million more annual passengers than I-5 Corridor
for Major North-South Markets • 3.3 million more annual intermediate market trips than
I-5 Corridor
3 2 5 Maximize Connectivity and Accessibility
• Serves Coastal Cities/Communities
• Does not serve intermediate intercity travel markets
• Serves Central Valley Cities
1 5 4 Minimize Operating and Capital Costs
• Longest route between Los Angeles and San Francisco Bay Area
• Higher capital costs due to length and terrain (22% higher than I-5 Corridor and 12% higher than SR 99 Corridor)
• Difficult construction along coastal terrain
• Highest amount of steep slope areas • Constrained alignment speeds along
coastal areas (maximum speeds of 150 mph)
• Shortest route between Los Angeles and San Francisco Bay Area
• Lowest capital costs
• Marginally Longer route than I-5 • Higher capital cost due to increased length and
significantly more urban areas traversed (6% higher than I-5 Corridor)
3 1 5 Maximize Compatibility with Existing and Planned Development • Serves/Impacts developed Coastal
communities • Highest potential visual impacts
• Traverses primarily undeveloped land • Serves developed Central Valley communities
APPENDIX 2-H Primary Statewide Corridors California High-Speed Train Program EIR/EIS HST Alignment/Station Screening Evaluation
Table 2-H-2 Page 2 of 2 U.S. Departmentof TransportationFederal RailroadAdministration
ALIGNMENTS Alignment Name = Alignment Carried Forward Alignment Name = Alignment Eliminated = Reason for Elimination
OBJECTIVE Coastal Corridor Interstate 5 (I-5) Corridor State Route 99 (SR-99) Corridor
Minimize Impacts on Natural Resources 3 3 3 • Low impacts on threatened and
endangered species • Low impacts on water resources • Highest potential impacts on coastal
resources
• Highest potential impacts on threatened and endangered species
• High Potential impacts on waterways and floodplains
Minimize Impacts on Social and Economic Resources 2 3 3 • Highest potential population
disturbance impacts • Highest visual impacts
• Moderate potential impacts on farmland resources
• Moderate visual and low population disturbance
• Highest potential impacts on farmland resources • Moderate population disturbance and visual impacts
Minimize Impacts on Cultural Resources 1 5 3 • Highest potential impacts on historic
and cultural resources • Low potential impacts on historical
resources • Moderate potential impacts on historic resources
Maximize Avoidance of Areas with Geologic and Soils Constraints
3 3 3 • Crosses least number of active faults
• Difficult terrain and soil conditions • Moderate amount of faults, steep
slopes and erodible soils • Few areas of steep slopes • Many areas with major faults and erodible soils
Maximize Avoidance of Areas with Potential Hazardous Materials
2 5 1 • Moderate potential impacts on areas
with hazardous materials • Low potential impacts on areas with
hazardous materials • Highest potential impacts on areas with hazardous
materials
1 2 3 4 5
Least Favorable Most Favorable

APPENDIX 2-H Northern Mountain Crossing California High-Speed Train Program EIR/EIS HST Alignment/Station Screening Evaluation
Table 2-H-3 Page 1 of 3 U.S. Departmentof TransportationFederal RailroadAdministration
Table 2-H-3 Previous Studies, Northern Mountain Crossing – High-Speed Train Alignment Attainment of Objectives
Bay Area to Merced Region
ALIGNMENTS Alignment Name = Alignment Carried Forward Alignment Name = Alignment Eliminated = Reason for Elimination
OBJECTIVE Altamont Pass Pacheco Pass Panoche Pass
3 5 1 Maximize Ridership/ Revenue Potential
• Substantially less frequency to and from the major SF Bay Area intercity travel markets than the Pacheco Pass or Panoche Pass
• Longer travel times between San Jose and Los Angeles than the Pacheco Pass or Panoche Pass
• More directly serves market between Bay Area to northern Central Valley Cities
• Shorter travel times than Pacheco between Sacramento and the Bay Area (25 minutes less for express between Sacramento to San Jose; 41 minutes less for express between Sacramento and San Francisco)
• Highest ridership and revenue potential • Shorter travel times than Altamont between Los
Angeles and San Jose (10 minutes shorter express; 26 minutes shorter local)
• Comparable travel times with Altamont between Los Angeles and San Francisco (3 minutes longer express; 8 minutes shorter local)
• Competitively serves market between Bay Area and Central Valley Cities
• Increase of 1.1 million annual riders over Altamont Pass
• Increase of $56 million annual revenue over Altamont Pass
• Lowest ridership and revenue potential • Longer travel times than Pacheco between
Sacramento and San Jose (37 minutes longer for express service)
• Not a competitive connection between Sacramento/Northern San Joaquin Valley and the Bay Area (35-40 miles south of the Pacecho Pass)
2 5 3 Maximize Connectivity and Accessibility
• Substantially less frequency to and from the major SF Bay Area intercity travel markets than the Pacheco Pass or Panoche Pass
• Requirement for new SF Bay crossing makes service to SF Peninsula uncertain
• Best connectivity/accessibility for major intercity travel markets
• Does not provide a competitive connection between Sacramento/Northern San Joaquin Valley and the Bay Area
• Provides good connectivity between the SF Bay Area and Southern California
APPENDIX 2-H Northern Mountain Crossing California High-Speed Train Program EIR/EIS HST Alignment/Station Screening Evaluation
Table 2-H-3 Page 2 of 3 U.S. Departmentof TransportationFederal RailroadAdministration
ALIGNMENTS Alignment Name = Alignment Carried Forward Alignment Name = Alignment Eliminated = Reason for Elimination
OBJECTIVE Altamont Pass Pacheco Pass Panoche Pass
4 3 2 Minimize Operating and Capital Costs
• Lowest estimated capital costs • Requires 3 way service split to serve the Bay
Area • Requires new Bay Crossing to serve San
Francisco peninsula – high construction and environmental mitigation costs anticipated with new bridge could greatly reduce cost difference with Pacheco Pass and Panoche Pass
• New SF Bay Crossing is a major additional constructability issue and source for project delay
• High capital costs (estimated to cost $2 billion more than Altamont Pass)
• Serves the Bay Area from the south (San Jose) requiring only one service split to serve both San Francisco Peninsula and East Bay
• Much higher frequency of service than Altamont• Requires fewer trainsets to provide similar
service level than Altamont • Potentially lower operating and maintenance
costs
• Highest capital costs (estimated at approximately $500 million more than Pacheco Pass)
• Longer than Pacheco (30 miles of additional line required)
• Longer distance through mountain pass • Serves the Bay Area from the south (San Jose)
requiring only one service split to serve both San Francisco Peninsula and East Bay
• Much higher frequency of service than Altamont• Requires fewer trainsets to provide similar
service level than Altamont
3 2 2 Maximize Compatibility with Existing and Planned Development • Medium compatibility with existing and planned
development through mountain pass • Low compatibility with existing and planned
development through mountain pass • Low compatibility with existing and planned
development through mountain pass
1 3 3 Minimize Impacts on Natural Resources
• Highest potential impacts on sensitive wetlands, salt water marshes and aquatic habitat
• Greatest impacts on SF Bay and Don Edwards Wildlife Refuge
• High impacts on sensitive habitat that supports special status and endangered
• Higher potential impacts on threatened and endangered species through the mountain pass section
• Higher potential impacts on water resources andpark and recreation areas through mountain pass area
• High impacts on water resources, wetlands and floodplains
• Medium impacts on threatened and endangered species
Wetlands (sites/area) (24/20.7 ac) Central Valley to Niles Junction (16/6.71 ac) Niles Junction to Redwood City
(57/290ac) N/A
Stream Crossings (number of crossings/linear ft)
(58/2,900 linear ft and 7,014 linear ft for Bay Crossing)
(77/3,850) N/A
3 3 3 Minimize Impacts on Social and Economic Resources
• Medium impacts on social and economic resources
• Medium impacts on social and economic resources
• Medium impacts on social and economic resources
3 3 3 Minimize Impacts on Cultural Resources • Medium impacts on cultural resources • Medium impacts on cultural resources • Medium impacts on cultural resources

APPENDIX 2-H Northern Mountain Crossing California High-Speed Train Program EIR/EIS HST Alignment/Station Screening Evaluation
Table 2-H-3 Page 3 of 3 U.S. Departmentof TransportationFederal RailroadAdministration
ALIGNMENTS Alignment Name = Alignment Carried Forward Alignment Name = Alignment Eliminated = Reason for Elimination
OBJECTIVE Altamont Pass Pacheco Pass Panoche Pass
3 3 3 Maximize Avoidance of Areas with Geologic and Soils Constraints • High impacts for seismic constraints and shrink
soils • Medium impacts on steep slopes • Low impacts on erodible soils
• High impacts on erodible soils • Medium impacts on seismic constraints and
steep slopes • Low impacts on shrink soils
• Medium impacts on seismic constraints, shrink soils, erodible soils, and steep slopes
• Longer length in mountainous areas
3 3 4 Maximize Avoidance of Areas with Potential Hazardous Materials
• Medium impacts on hazardous materials • Medium impacts on hazardous materials • Low impacts on hazardous materials
1 2 3 4 5
Least Favorable Most Favorable

APPENDIX 2-H Bay Area to Merced California High-Speed Train Program EIR/EIS HST Station/Alignment Screening Evaluation
Table 2-H-4a Page 1 of 4 U.S. Departmentof TransportationFederal RailroadAdministration
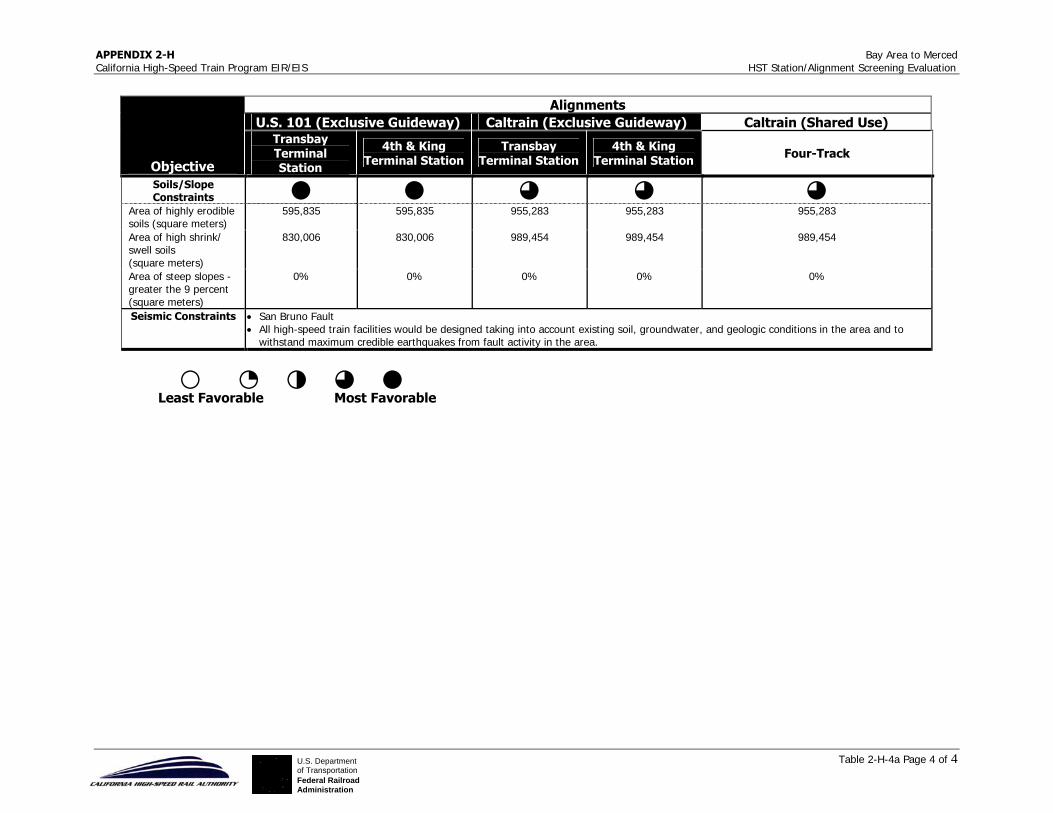
Table 2-H-4a Bay Area to Merced – High-Speed Train Alignment Evaluation Matrix
San Francisco to San Jose Segment Alignment = Alignment Carried Forward Alignment = Alignment Eliminated = Primary/Secondary Reason for Elimination
Alignments
U.S. 101 (Exclusive Guideway) Caltrain (Exclusive Guideway) Caltrain (Shared Use)
Objective
Transbay Terminal Station
4th & King Terminal Station
Transbay Terminal Station
4th & King Terminal Station Four-Track
Maximize Ridership/Revenue Potential Travel Time
5 5 5 5 4
Express 31 min. 30 min. 30 min. 28 min. 35 min.
Local 39 min. 37 min. 37 min. 36 min. 41 min.
5 5 5 5 5 Length
48.4 mi. (77.9 Km.)
47.2 mi. (76.0 Km.)
48.2 mi. (77.6 Km.)
47.0 mi. (75.7 Km.)
48.0 mi. (77.3 Km)
Minimize Operating and Capital Costs.
5 5 5 5 5 Length
48.4 mi. (77.9Km.)
47.2 mi. (76.0 Km.)
48.2 mi. (77.6 Km.)
47.0 mi. (75.7 Km.)
48.0 mi. (77.3 Km)
5 5 5 5 4 Operational Issues
• Some speed restrictions due to curves.
• Some speed restrictions due to curves.
• Some speed restrictions due to curves.
• Some speed restrictions due to curves.
• Track capacity constraints due to shared use
• Need to optimize commuter & high-speed train schedules
1 2 1 2 4 Construction Issues
• Construction adjacent to major freeway.
• Stage construction, detours, nighttime work required.
• Soft-ground tunneling to reach Transbay Terminal.
• Construction adjacent to major freeway.
• Staged construction, detours, nighttime work required.
• Terminal on aerial structure above active Caltrain yard & station.
• Construction adjacent to & above active railroad.
• Staged construction, detours, nighttime work required.
• Soft-ground tunneling to reach Transbay Terminal
• Construction adjacent to & above active railroad.
• Staged construction, detours, nighttime work required.
• Terminal on aerial structure above active Caltrain yard & station
• Construction of grade separations will require staged construction, shoo-flys, detours, & nighttime work.
• Additional aerial structures adjacent to & above active railroad will require staged construction, detours, & nighttime work.

APPENDIX 2-H Bay Area to Merced California High-Speed Train Program EIR/EIS HST Station/Alignment Screening Evaluation
Table 2-H-4a Page 2 of 4 U.S. Departmentof TransportationFederal RailroadAdministration
Alignments U.S. 101 (Exclusive Guideway) Caltrain (Exclusive Guideway) Caltrain (Shared Use)
Objective
Transbay Terminal Station
4th & King Terminal Station
Transbay Terminal Station
4th & King Terminal Station Four-Track
1 2 3 • Low cost • Approx. 400 Mil. less than U.S. 101
Exclusive Guideway • Uses existing infrastructure
Capital Cost
• Highest cost • Aerial structure • Major ROW costs
• High cost • $300 Million less than U.S. 101 • Aerial structure • Major ROW costs
• Assumes ½ cost of Caltrain Electrification & ½ cost of Caltrain San Francisco Downtown Extension
1 2 2 4 Right-of-Way Issues/Cost
• Mostly commercial and industrial. • Major ROW costs
• Mostly commercial & residential. • Less ROW costs
• Commercial, residential & industrial properties adjacent to railroad at roads to be grade separated.
• Bypass tracks take additional ROW
2 1 4 Land Use
Compatibility and Conflicts • Generally commercial with numerous
segments residential (typically behind sound walls)
• Arial portion could be incompatible with residential development
• Generally industrial with numerous segments of residential
• Passes through multiple suburban town centers
• Arial portion could be incompatible with residential development
• Generally industrial with numerous segments of residential
• Passes through multiple suburban town centers
• Critical land use & design issues associated with grade separations
1 3 Visual Quality
Impacts • Major New Visual Element – impacts on residential developments along freeway and Caltrain
corridor • Impacts from grade separations – sensitive
design critical Water Resources
1 1 4 4 4 # of crossings of alignment (linear ft of alignment centerline)
27 (1,350)
27 (1,350)
19 (950)
19 (950)
19 (950)
Floodplain Impacts 4 4 4 4 4 # of 100 yr. floodplain crossings
31 31 25 25 25
Length of alignment within 100 yr. floodplain
12,331 12,331 14,048 14,048 14,048
Percent of total length within floodplain
18.1% 18.1% 20.1% 20.1% 20.1%

APPENDIX 2-H Bay Area to Merced California High-Speed Train Program EIR/EIS HST Station/Alignment Screening Evaluation
Table 2-H-4a Page 3 of 4 U.S. Departmentof TransportationFederal RailroadAdministration
Alignments U.S. 101 (Exclusive Guideway) Caltrain (Exclusive Guideway) Caltrain (Shared Use)
Objective
Transbay Terminal Station
4th & King Terminal Station
Transbay Terminal Station
4th & King Terminal Station Four-Track
Threatened & Endangered Species
Impacts 2 2 4 4 4
# of threatened & endangered species (per CNDDB)
9 9 4 4 4
# Federal endangered 7 7 3 3 3 # Federal threatened 2 2 1 1 1 # State endangered 3 3 2 2 2 # State threatened 0 0 0 0 0 Area of alignment within sensitive habitat (per CNDDB)
526,911 526,911 383,674 383,674 383,674
Environmental Justice Impacts (Demographics)
4 4 4 4 4
# block groups >50 percent Minority
66 66 56 56 56
# block groups >50 percent low-income
1 1 1 1 1
Potentially affected minority population
20,735 20,735 18,716 18,716 18,716
Potentially affected low-income population
2 2 2 2 2
Farmland Impacts No farmland impacts
Cultural Resources Impacts 5 1 4
# of known resources within ROW
• 3 historic resources • Adverse effects on 6 historic train stations: Santa Clara, Palo Alto, Menlo Park, San Carlos, Burlingame, & Millbrae.
• Possible adverse effects on Santa Clara, Menlo Park, & Burlingame historic stations from single-track bypass structures – depending on design & location of bypass
3 4 Parks & Recreation/
Wildlife Refuge Impacts • Passes through or adjacent to 12 parks
• Need to evaluate avoidance & mitigation alternatives
• Passes through El Palo Alto Park • Need to evaluate avoidance & mitigation alternatives
Wetlands (sites/area) (12/2.2 ac) (12/2.2 ac) (7/0.6 ac) (7/0.6 ac) (7/0.6 ac)
APPENDIX 2-H Bay Area to Merced California High-Speed Train Program EIR/EIS HST Station/Alignment Screening Evaluation
Table 2-H-4a Page 4 of 4 U.S. Departmentof TransportationFederal RailroadAdministration
Alignments U.S. 101 (Exclusive Guideway) Caltrain (Exclusive Guideway) Caltrain (Shared Use)
Objective
Transbay Terminal Station
4th & King Terminal Station
Transbay Terminal Station
4th & King Terminal Station Four-Track
Soils/Slope Constraints 5 5 4 4 4
Area of highly erodible soils (square meters)
595,835 595,835 955,283 955,283 955,283
Area of high shrink/ swell soils (square meters)
830,006 830,006 989,454 989,454 989,454
Area of steep slopes - greater the 9 percent (square meters)
0% 0% 0% 0% 0%
Seismic Constraints • San Bruno Fault • All high-speed train facilities would be designed taking into account existing soil, groundwater, and geologic conditions in the area and to
withstand maximum credible earthquakes from fault activity in the area.
1 2 3 4 5
Least Favorable Most Favorable
APPENDIX 2-H Bay Area to Merced California High-Speed Train Program EIR/EIS HST Station/Alignment Screening Evaluation
Table 2-H-4b Page 1 of 6 U.S. Departmentof TransportationFederal RailroadAdministration
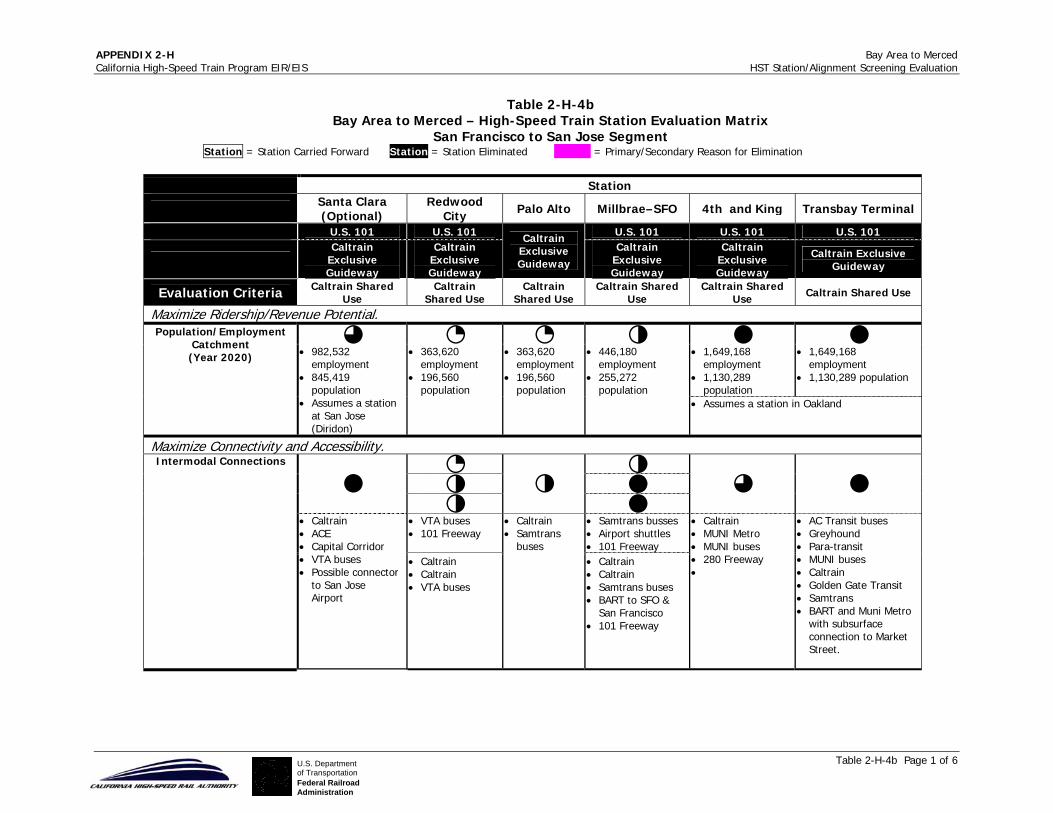
Table 2-H-4b Bay Area to Merced – High-Speed Train Station Evaluation Matrix
San Francisco to San Jose Segment Station = Station Carried Forward Station = Station Eliminated = Primary/Secondary Reason for Elimination
Station
Santa Clara (Optional)
Redwood City Palo Alto Millbrae–SFO 4th and King Transbay Terminal
U.S. 101 U.S. 101 U.S. 101 U.S. 101 U.S. 101
Caltrain
Exclusive Guideway
Caltrain Exclusive Guideway
Caltrain Exclusive Guideway
Caltrain Exclusive Guideway
Caltrain Exclusive Guideway
Caltrain Exclusive Guideway
Evaluation Criteria Caltrain Shared Use
Caltrain Shared Use
Caltrain Shared Use
Caltrain Shared Use
Caltrain Shared Use Caltrain Shared Use
Maximize Ridership/Revenue Potential.
4 2 2 3 5 5 • 1,649,168
employment • 1,130,289
population
• 1,649,168 employment
• 1,130,289 population
Population/Employment Catchment
(Year 2020) • 982,532 employment
• 845,419 population
• Assumes a station at San Jose (Diridon)
• 363,620 employment
• 196,560 population
• 363,620 employment
• 196,560 population
• 446,180 employment
• 255,272 population
• Assumes a station in Oakland
Maximize Connectivity and Accessibility.
2 3 3 5 5
3
3
5 4 5
• VTA buses • 101 Freeway
• Samtrans busses • Airport shuttles • 101 Freeway
Intermodal Connections
• Caltrain • ACE • Capital Corridor • VTA buses • Possible connector
to San Jose Airport
• Caltrain • Caltrain • VTA buses
• Caltrain • Samtrans
buses • Caltrain • Caltrain • Samtrans buses • BART to SFO &
San Francisco • 101 Freeway
• Caltrain • MUNI Metro • MUNI buses • 280 Freeway •
• AC Transit buses • Greyhound • Para-transit • MUNI buses • Caltrain • Golden Gate Transit • Samtrans • BART and Muni Metro
with subsurface connection to Market Street.
APPENDIX 2-H Bay Area to Merced California High-Speed Train Program EIR/EIS HST Station/Alignment Screening Evaluation
Table 2-H-4b Page 2 of 6 U.S. Departmentof TransportationFederal RailroadAdministration
Station
Santa Clara (Optional)
Redwood City Palo Alto Millbrae–SFO 4th and King Transbay Terminal
U.S. 101 U.S. 101 U.S. 101 U.S. 101 U.S. 101
Caltrain
Exclusive Guideway
Caltrain Exclusive Guideway
Caltrain Exclusive Guideway
Caltrain Exclusive Guideway
Caltrain Exclusive Guideway
Caltrain Exclusive Guideway
Evaluation Criteria Caltrain Shared Use
Caltrain Shared Use
Caltrain Shared Use
Caltrain Shared Use
Caltrain Shared Use Caltrain Shared Use
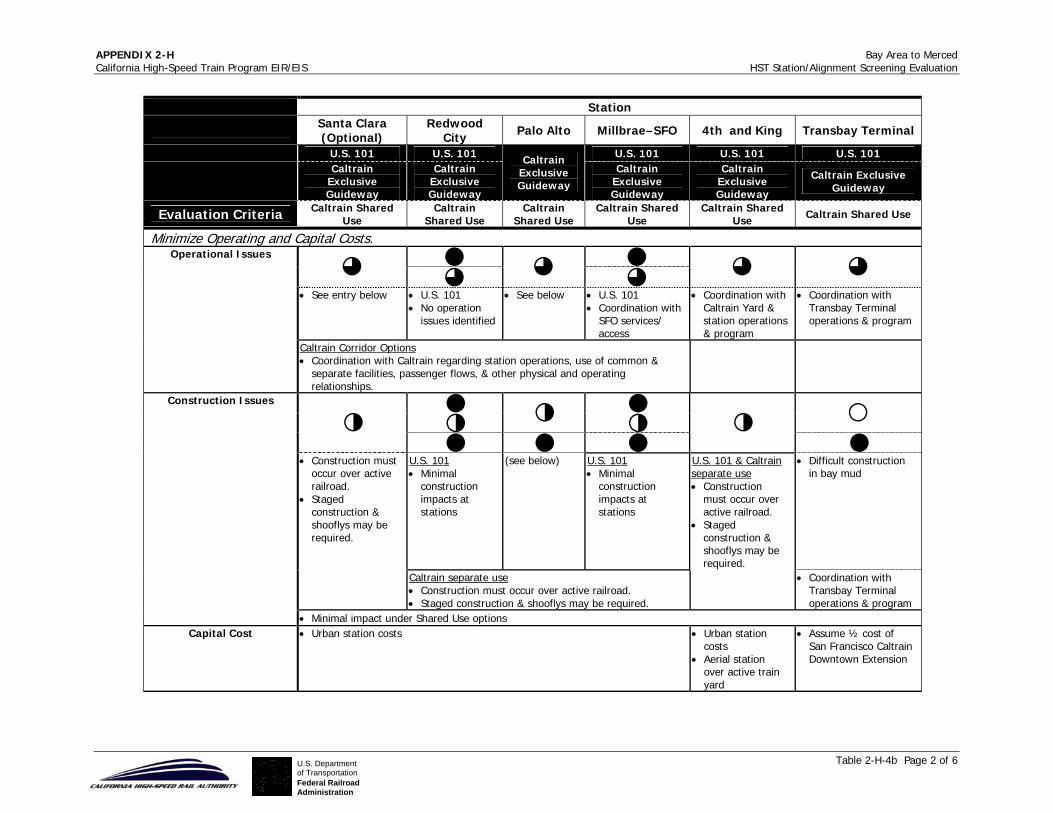
Minimize Operating and Capital Costs.
5 5 4
4 4
4 4 4
• See entry below • U.S. 101 • No operation
issues identified
• See below • U.S. 101 • Coordination with
SFO services/ access
• Coordination with Caltrain Yard & station operations & program
• Coordination with Transbay Terminal operations & program
Operational Issues
Caltrain Corridor Options • Coordination with Caltrain regarding station operations, use of common &
separate facilities, passenger flows, & other physical and operating relationships.
5 5
3 3
3 1
3
5 5 5
3
5 U.S. 101 • Minimal
construction impacts at stations
(see below) U.S. 101 • Minimal
construction impacts at stations
U.S. 101 & Caltrain separate use • Construction
must occur over active railroad.
• Staged construction & shooflys may be required.
• Difficult construction in bay mud
• Construction must occur over active railroad.
• Staged construction & shooflys may be required.
Caltrain separate use • Construction must occur over active railroad. • Staged construction & shooflys may be required.
• Coordination with Transbay Terminal operations & program
Construction Issues
• Minimal impact under Shared Use options Capital Cost • Urban station costs • Urban station
costs • Aerial station
over active train yard
• Assume ½ cost of San Francisco Caltrain Downtown Extension
APPENDIX 2-H Bay Area to Merced California High-Speed Train Program EIR/EIS HST Station/Alignment Screening Evaluation
Table 2-H-4b Page 3 of 6 U.S. Departmentof TransportationFederal RailroadAdministration
Station
Santa Clara (Optional)
Redwood City Palo Alto Millbrae–SFO 4th and King Transbay Terminal
U.S. 101 U.S. 101 U.S. 101 U.S. 101 U.S. 101
Caltrain
Exclusive Guideway
Caltrain Exclusive Guideway
Caltrain Exclusive Guideway
Caltrain Exclusive Guideway
Caltrain Exclusive Guideway
Caltrain Exclusive Guideway
Evaluation Criteria Caltrain Shared Use
Caltrain Shared Use
Caltrain Shared Use
Caltrain Shared Use
Caltrain Shared Use Caltrain Shared Use
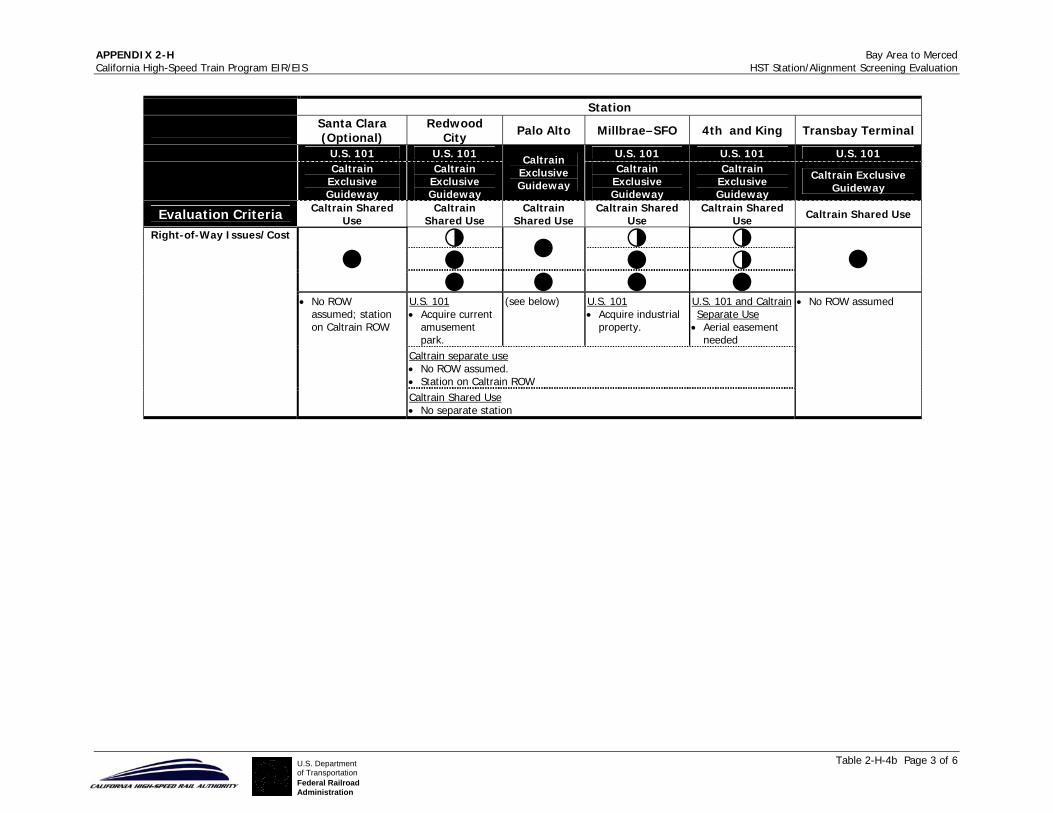
3 3 3
5 5
5 3 5
5 5 5 5
5
U.S. 101 • Acquire current
amusement park.
(see below) U.S. 101 • Acquire industrial
property.
U.S. 101 and Caltrain Separate Use
• Aerial easement needed
• No ROW assumed
Caltrain separate use • No ROW assumed. • Station on Caltrain ROW
Right-of-Way Issues/Cost
• No ROW assumed; station on Caltrain ROW
Caltrain Shared Use • No separate station
APPENDIX 2-H Bay Area to Merced California High-Speed Train Program EIR/EIS HST Station/Alignment Screening Evaluation
Table 2-H-4b Page 4 of 6 U.S. Departmentof TransportationFederal RailroadAdministration
Station
Santa Clara (Optional)
Redwood City Palo Alto Millbrae–SFO 4th and King Transbay Terminal
U.S. 101 U.S. 101 U.S. 101 U.S. 101 U.S. 101
Caltrain
Exclusive Guideway
Caltrain Exclusive Guideway
Caltrain Exclusive Guideway
Caltrain Exclusive Guideway
Caltrain Exclusive Guideway
Caltrain Exclusive Guideway
Evaluation Criteria Caltrain Shared Use
Caltrain Shared Use
Caltrain Shared Use
Caltrain Shared Use
Caltrain Shared Use Caltrain Shared Use
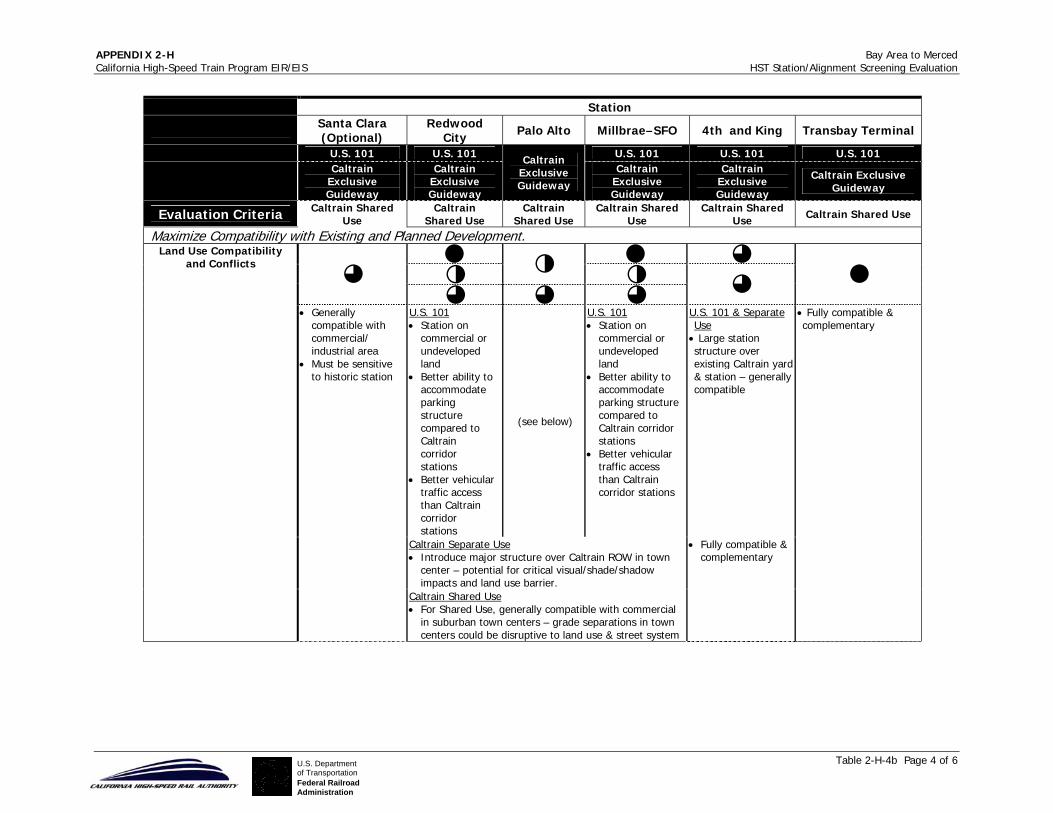
Maximize Compatibility with Existing and Planned Development.
5 5 4
3 3
3 4
4 4 4 4
5
U.S. 101 • Station on
commercial or undeveloped land
• Better ability to accommodate parking structure compared to Caltrain corridor stations
• Better vehicular traffic access than Caltrain corridor stations
(see below)
U.S. 101 • Station on
commercial or undeveloped land
• Better ability to accommodate parking structure compared to Caltrain corridor stations
• Better vehicular traffic access than Caltrain corridor stations
U.S. 101 & Separate Use
• Large station structure over existing Caltrain yard & station – generally compatible
• Fully compatible & complementary
Caltrain Separate Use • Introduce major structure over Caltrain ROW in town
center – potential for critical visual/shade/shadow impacts and land use barrier.
Land Use Compatibility and Conflicts
• Generally compatible with commercial/ industrial area
• Must be sensitive to historic station
Caltrain Shared Use • For Shared Use, generally compatible with commercial
in suburban town centers – grade separations in town centers could be disruptive to land use & street system
• Fully compatible & complementary
APPENDIX 2-H Bay Area to Merced California High-Speed Train Program EIR/EIS HST Station/Alignment Screening Evaluation
Table 2-H-4b Page 5 of 6 U.S. Departmentof TransportationFederal RailroadAdministration
Station
Santa Clara (Optional)
Redwood City Palo Alto Millbrae–SFO 4th and King Transbay Terminal
U.S. 101 U.S. 101 U.S. 101 U.S. 101 U.S. 101
Caltrain
Exclusive Guideway
Caltrain Exclusive Guideway
Caltrain Exclusive Guideway
Caltrain Exclusive Guideway
Caltrain Exclusive Guideway
Caltrain Exclusive Guideway
Evaluation Criteria Caltrain Shared Use
Caltrain Shared Use
Caltrain Shared Use
Caltrain Shared Use
Caltrain Shared Use Caltrain Shared Use
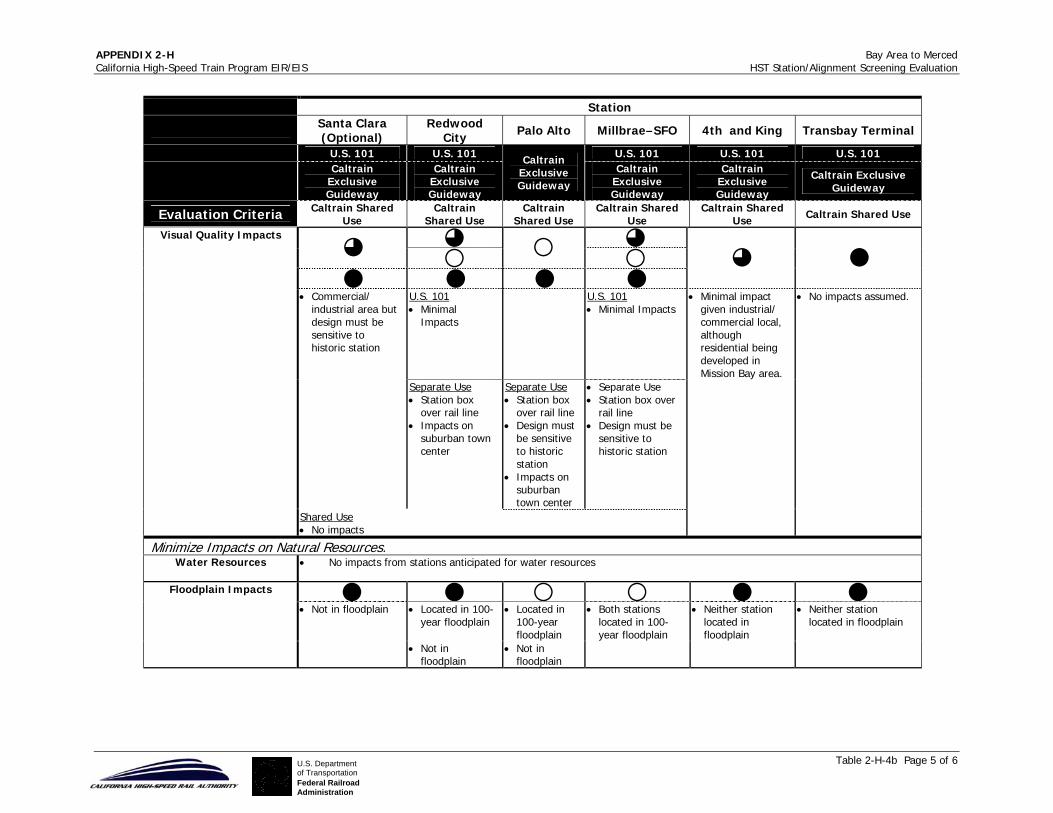
4 4 4
1 1
1
5 5 5 5 4 5
U.S. 101 • Minimal
Impacts
U.S. 101 • Minimal Impacts
• Minimal impact given industrial/ commercial local, although residential being developed in Mission Bay area.
• No impacts assumed. • Commercial/ industrial area but design must be sensitive to historic station
Separate Use • Station box
over rail line • Impacts on
suburban town center
Separate Use • Station box
over rail line • Design must
be sensitive to historic station
• Impacts on suburban town center
• Separate Use • Station box over
rail line • Design must be
sensitive to historic station
Visual Quality Impacts
Shared Use • No impacts
Minimize Impacts on Natural Resources. Water Resources
• No impacts from stations anticipated for water resources
5 5 1 1 5 5 • Located in 100-
year floodplain • Located in
100-year floodplain
Floodplain Impacts
• Not in floodplain
• Not in floodplain
• Not in floodplain
• Both stations located in 100-year floodplain
• Neither station located in floodplain
• Neither station located in floodplain

APPENDIX 2-H Bay Area to Merced California High-Speed Train Program EIR/EIS HST Station/Alignment Screening Evaluation
Table 2-H-4b Page 6 of 6 U.S. Departmentof TransportationFederal RailroadAdministration
Station
Santa Clara (Optional)
Redwood City Palo Alto Millbrae–SFO 4th and King Transbay Terminal
U.S. 101 U.S. 101 U.S. 101 U.S. 101 U.S. 101
Caltrain
Exclusive Guideway
Caltrain Exclusive Guideway
Caltrain Exclusive Guideway
Caltrain Exclusive Guideway
Caltrain Exclusive Guideway
Caltrain Exclusive Guideway
Evaluation Criteria Caltrain Shared Use
Caltrain Shared Use
Caltrain Shared Use
Caltrain Shared Use
Caltrain Shared Use Caltrain Shared Use
5 3 5 Threatened & Endangered
Species Impacts • No impacts identified on statewide database • Potential impacts
on California Clapper Rail
• No impacts identified on statewide database
Minimize Impacts on Social and Economic Resources.
5 4 5 Enviironmental Justice
Impacts (Demographics) • No disproportion
impacts anticipated
• Minority populations in station area
• No disproportion impacts anticipated
• No disproportion impacts anticipated
Farmland Impacts
No stations located in farmlands
Minimize Impacts on Cultural Resources.
5 5 5 3
5 3 3
• No known cultural resources • No known cultural resources
• Existing Historic Terminal
• No impacts anticipated at new terminal
Cultural Resource Impacts
• Historic Train Station
• Mitigation and/or sensitive design required
• No known cultural resources
• Historic Train station
• Mitigation and/or sensitive design required
• Historic Train station
• Mitigation and/or sensitive design required
Parks & Recreation/ Wildlife Refuge Impacts
• No station located in public recreation or wildlife refuge areas
1 2 3 4 5 Least Favorable Most Favorable

APPENDIX 2-H Bay Area to Merced California High-Speed Train Program EIR/EIS HST Station/Alignment Screening Evaluation
Table 2-H-4c Page 1 of 5 U.S. Departmentof TransportationFederal RailroadAdministration
Table 2-H-4c Bay Area to Merced – High-Speed Train Alignment Evaluation Matrix
Oakland to San Jose Segment Alignment = Alignment Carried Forward Alignment = Alignment Eliminated = Primary/Secondary Reason for Elimination
Alignments
Evaluation Criteria
Mulford Line (Entire
Segment)
Hayward/ Niles/
Mulford
WPRR/Niles /Mulford
Hayward/ Tunnel/ Mulford
WPRR/ Tunnel/ Mulford
I-880 (Entire
Segment)
Hayward/ I-880
WPRR/ Hayward/
I-880 Maximize Ridership/Revenue Potential.
3 2 1 4 3 3 5 4 Travel Time
31 min. 34 min. 37 min. 27 min. 30 min. 32 min. 25 min. 28 min.
5 3 3 5 4 5 5 4 Length
42.3 miles (26.4 km)
46.2 miles (28.9 km)
48.8 miles (30.5 km)
42.2 miles (26.4 km)
44.8 miles (28.0 km)
42.0 miles (26.3 km)
41.8 miles (26.1 km)
44.4 miles (27.8 km)
Minimize Operating and Capital Costs.
5 3 3 5 4 5 5 4 Length
42.3 miles (26.4 km)
46.2 miles (28.9 km)
48.8 miles (30.5 km)
42.2 miles (26.4 km)
44.8 miles (28.0 km)
42.0 miles (26.3 km)
41.8 miles (26.1 km)
44.4 miles (27.8 km)
2 2 1 3 3 3 4 4 Operational Issues
• Restrictive curves on aerial structure above residential areas.
• Passes through Wildlife Refuge
• Passes through Wildlife Refuge.
• Very restrictive curves on Niles connector.
• 2 industrial freight sidings need to be eliminated
• Passes through Wildlife Refuge.
• Very restrictive curves on the Niles connector & some speed restrictions on WPRR aerial segment
• Passes through Wildlife Refuge.
• 2 industrial freight sidings need to be eliminated
• Passes through Wildlife Refuge
• Restrictive curves on I-880 north of Fremont
• 2 industrial freight sidings need to be eliminated
• Some speed restrictions on the WPRR aerial segment
APPENDIX 2-H Bay Area to Merced California High-Speed Train Program EIR/EIS HST Station/Alignment Screening Evaluation
Table 2-H-4c Page 2 of 5 U.S. Departmentof TransportationFederal RailroadAdministration
Alignments
Evaluation Criteria
Mulford Line (Entire
Segment)
Hayward/ Niles/
Mulford
WPRR/Niles /Mulford
Hayward/ Tunnel/ Mulford
WPRR/ Tunnel/ Mulford
I-880 (Entire
Segment)
Hayward/ I-880
WPRR/ Hayward/
I-880
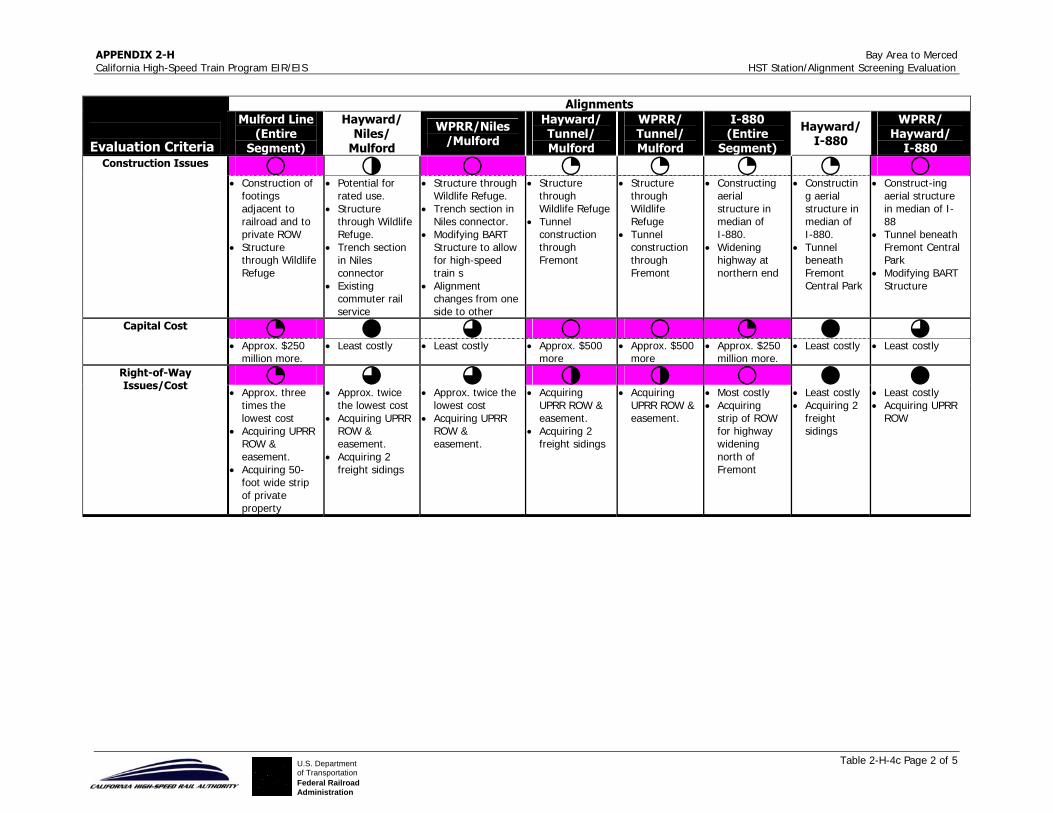
1 3 1 2 2 2 2 1 Construction Issues
• Construction of footings adjacent to railroad and to private ROW
• Structure through Wildlife Refuge
• Potential for rated use.
• Structure through Wildlife Refuge.
• Trench section in Niles connector
• Existing commuter rail service
• Structure through Wildlife Refuge.
• Trench section in Niles connector.
• Modifying BART Structure to allow for high-speed train s
• Alignment changes from one side to other
• Structure through Wildlife Refuge
• Tunnel construction through Fremont
• Structure through Wildlife Refuge
• Tunnel construction through Fremont
• Constructing aerial structure in median of I-880.
• Widening highway at northern end
• Constructing aerial structure in median of I-880.
• Tunnel beneath Fremont Central Park
• Construct-ing aerial structure in median of I-88
• Tunnel beneath Fremont Central Park
• Modifying BART Structure
2 5 4 1 1 2 5 4 Capital Cost
• Approx. $250 million more.
• Least costly • Least costly • Approx. $500 more
• Approx. $500 more
• Approx. $250 million more.
• Least costly • Least costly
2 4 4 3 3 1 5 5 Right-of-Way Issues/Cost
• Approx. three times the lowest cost
• Acquiring UPRR ROW & easement.
• Acquiring 50-foot wide strip of private property
• Approx. twice the lowest cost
• Acquiring UPRR ROW & easement.
• Acquiring 2 freight sidings
• Approx. twice the lowest cost
• Acquiring UPRR ROW & easement.
• Acquiring UPRR ROW & easement.
• Acquiring 2 freight sidings
• Acquiring UPRR ROW & easement.
• Most costly • Acquiring
strip of ROW for highway widening north of Fremont
• Least costly • Acquiring 2
freight sidings
• Least costly • Acquiring UPRR
ROW

APPENDIX 2-H Bay Area to Merced California High-Speed Train Program EIR/EIS HST Station/Alignment Screening Evaluation
Table 2-H-4c Page 3 of 5 U.S. Departmentof TransportationFederal RailroadAdministration
Alignments
Evaluation Criteria
Mulford Line (Entire
Segment)
Hayward/ Niles/
Mulford
WPRR/Niles /Mulford
Hayward/ Tunnel/ Mulford
WPRR/ Tunnel/ Mulford
I-880 (Entire
Segment)
Hayward/ I-880
WPRR/ Hayward/
I-880 Maximize Compatibility with Existing and Planned Development.
1 3 2 5 Land Use Compatibility
and Conflicts • Acquisition of
50-foot strip of private property
• Within existing transportation corridor
• Conflicts with expansion potential of existing rail service providers
• Within existing transportation corridor • Conflicts with expansion potential of
existing rail service providers
• Conflicts with expansion potential of existing rail service providers
• Requires subsurface easements for tunnel
• Within existing transportation corridor
1 3 4 4 • Visual impact to residential homes • Visual impact in Santa Clara business district & in historic Alviso
Visual Quality Impacts
• Visual impact from guideway over private property
(see above)
• Visual impact from high aerial structure in I-880 north of Fremont
• Visual impact from transition aerial structure near Mission Boulevard
Minimize Impacts on Natural Resources. Water Resources 1 1 1 3 3 5 5 5
# of crossing of alignment (linear ft of alignment centerline)
40 (2,000) 40 (2,000) 39 (1,950) 32 (1,600) 31 (1,550) 23 (1,150) 22 (1,100) 21 (1,050)
Floodplain Impacts 1 3 3 5 5 2 4 4 # of 100 yr. floodplain crossings
18 18 19 17 15 22 22 23
Length of alignment within 100 yr. floodplain
16,963 12,717 12,605 8,571 8,100 13,286 9,592 9,480
Percent of total length within floodplain
26.9% 18.3% 18.1% 13.5% 12.8% 21.2% 15.3% 15.0%

APPENDIX 2-H Bay Area to Merced California High-Speed Train Program EIR/EIS HST Station/Alignment Screening Evaluation
Table 2-H-4c Page 4 of 5 U.S. Departmentof TransportationFederal RailroadAdministration
Alignments
Evaluation Criteria
Mulford Line (Entire
Segment)
Hayward/ Niles/
Mulford
WPRR/Niles /Mulford
Hayward/ Tunnel/ Mulford
WPRR/ Tunnel/ Mulford
I-880 (Entire
Segment)
Hayward/ I-880
WPRR/ Hayward/
I-880 Threatened &
Endangered Species Impacts
1 2 2 3 3 4 3 1
# of threatened & endangered species (per CNDDB)
5 4 5 2 3 3 3 5
# Federal Endangered 3 3 4 2 2 2 3 4 # Federal Threatened 2 1 1 0 1 1 0 1 # State Endangered 1 1 2 1 1 1 1 1 # State Endangered 0 0 0 0 0 0 0 0 Area of Alignment within Sensitive Habitat (per CNDDB)
382,631 320,615 313,301 262,483 271,282 221,455 255,921 464,067
Minimize Impacts on Social and Economic Resources. Environmental Justice
Impacts (Demographics)
4 2 3 3 4 5 2 3
# Block groups >50 percent minority 63 66 63 63 59 52 59 55
# Block groups >50 percent low-Income 0 0 1 0 1 1 1 2
Potentially affected minority population 13,090 16,689 15,285 15,427 13,956 11,405 15,791 14,321
Potentially affected low-income population 0 0 0 0 0 14 14 14
Farmland Impacts 1 2 2 3 3 5 4 4 Area of prime farmland (square meters)
48,099 12,875 12,875 12,947 12,947 30,489 54,805 54,805
Area of unique farmland (square meters)
45,569 38,605 38,605 0 0 0 0 0
Area of farmland of Statewide importance (square meters)
3,988 3,988 3,988 3,988 3,988 0 0 0
Minimize Impacts on Cultural Resources. Cultrual Resources
Impacts TBD TBD TBD TBD TBD TBD TBD TBD

APPENDIX 2-H Bay Area to Merced California High-Speed Train Program EIR/EIS HST Station/Alignment Screening Evaluation
Table 2-H-4c Page 5 of 5 U.S. Departmentof TransportationFederal RailroadAdministration
Alignments
Evaluation Criteria
Mulford Line (Entire
Segment)
Hayward/ Niles/
Mulford
WPRR/Niles /Mulford
Hayward/ Tunnel/ Mulford
WPRR/ Tunnel/ Mulford
I-880 (Entire
Segment)
Hayward/ I-880
WPRR/ Hayward/
I-880
1 1 1 1 1 5 3 3 Parks & Recreation/
Wildlife Refuge Impacts • Passes through Don Edwards National Wildlife Refuge • Extremely Sensitive biological resource area • - Passes through Fremont Central
Park Lake Wetlands (sites/area) 35/60.6 ac 24/49.9 ac 24/49.9 ac 28/52.3 ac 28/52.3 ac 12/5.7 ac 13/13.8 ac 13/13.8 ac
Maximize Avoidance of Areas with Geologic and Soils Constraints. Soils/Slope Constraints 5 3 3 4 4 4 4 4 Area of Highly Erodible Soils (square meters)
759,411 1,261,971 1,271,056 1,256,284 1,270,645 1,148,815 1,270,251 1,279,336
Area of High Shrink/Swell Soils (square meters)
1,740,288 1,933,528 1,973,293 1,737,344 1,767,536 1,714,710 1,725,691 1,750,639
Area of Steep Slopes - greater the 9 percent (square meters)
0 0 0 0 0 0 0 0
4 3 2 1 1 5 3 2 Seismic Constraints
• Silver Creek Fault 3 times
• Silver Creek Fault once
• Hayward Fault twice
• Silver Creek Fault once
• Hayward Fault 3 times
• Silver Creek Fault once & adjacent to Hayward Fault in Fremont
• Silver Creek Fault once & adjacent to Hayward Fault for several miles
• Cross Silver Creek Fault once
• Silver Creek Fault once
• Hayward Faulttwice
• Silver Creek Fault once
• Hayward Fault 3 times
• All high-speed train facilities would be designed taking into account existing soil, groundwater, and geologic conditions in the area and to withstand maximum credible earthquakes from fault activity in the area.
1 2 3 4 5 Least Favorable Most Favorable

APPENDIX 2-H Bay Area to Merced California High-Speed Train Program EIR/EIS HST Station/Alignment Screening Evaluation
Table 2-H-4d Page 1 of 5 U.S. Departmentof TransportationFederal RailroadAdministration
Table 2-H-4d Bay Area to Merced – High-Speed Train Station Evaluation Matrix
Oakland to San Jose Segment Station = Station Carried Forward Station = Station Eliminated = Primary/Secondary Reason for Elimination
Stations
South Alameda Co. Oakland Airport/ Coliseum
Oakland Terminus Station
Mowry Avenue (I-880 Alignment Only)
Coliseum BART Station (Hayward/Mulford Alignment Only)
West Oakland
Fremont Auto Mall Parkway (Mulford Alignments Only)
Coliseum BART Station (WPRR/Tunnel/Mulford
Alignment Only) Lake Merritt
Warm Springs (I-880/Hayward & WPRR
Alignments Only)
12th/City Center
Evaluation Criteria
Union City (Hayward/I-880 & WPRR
Alignments Only)
I-880/Hegenberger (I-880 Alignment Only)
Jack London Square
Maximize Ridership/Revenue Potential.
4 3 5 Population/Employment
Catchment (Year 2020) • 808,533 employment
• 462,395 population • 593,747 employment • 250,185 population
• 2,565,241 employment • 1,244,401 population • (Assumes station in downtown
San Francisco)
Maximize Connectivity and Accessibility.
4 5 5
5 5 3
5 5
5 4
3 • I-880 Freeway • BART
• Capital commuter rail • AC Transit buses • Connector to Oakland Airport
• All BART lines • AC Transit buses
• I-880 Freeway (1.5 mi.) • Capitol commuter rail • ACE commuter rail • AC Transit buses
• BART • Capital commuter rail • AC Transit buses • Connector to Oakland Airport
• 2 BART lines • AC Transit buses
Intermodal Connections
• BART • AC Transit buses
• AC Transit buses • Connector to Oakland Airport
• All BART lines • AC Transit buses

APPENDIX 2-H Bay Area to Merced California High-Speed Train Program EIR/EIS HST Station/Alignment Screening Evaluation
Table 2-H-4d Page 2 of 5 U.S. Departmentof TransportationFederal RailroadAdministration
Stations
South Alameda Co. Oakland Airport/ Coliseum
Oakland Terminus Station
Mowry Avenue (I-880 Alignment Only)
Coliseum BART Station (Hayward/Mulford Alignment Only)
West Oakland
Fremont Auto Mall Parkway (Mulford Alignments Only)
Coliseum BART Station (WPRR/Tunnel/Mulford
Alignment Only) Lake Merritt
Warm Springs (I-880/Hayward & WPRR
Alignments Only)
12th/City Center
Evaluation Criteria
Union City (Hayward/I-880 & WPRR
Alignments Only)
I-880/Hegenberger (I-880 Alignment Only)
Jack London Square
• BART • Capital commuter rail • AC Transit buses
• Amtrak • Capitol commuter rail • AC transit buses
Minimize Operating and Capital Costs.
5 5 4 • Potential joint use by rail transit
providers for Mulford and Hayward
Operational Issues
• None apparent at this time
• None apparent at this time
• All terminals are designed as two track terminals. All can be expanded to four tracks – West Oakland at 1 level & the others at 2 levels. All terminals have tailtracks for storage & inspection, minor servicing & catering
1 4 2
5 5 3
1 2
5 5
1 • Construction over active freeway • Deep tunneling through
Embarcadero area • None apparent at this time • Tunneling beneath Laney College
Construction Issues
• Relocation of BART & constructing between two operating railroads
• WPRR would require construction of aerial structure & station directly adjacent to the BART aerial station • Cut-and-cover, deep tunneling, &
deep excavation. Construction under BART station

APPENDIX 2-H Bay Area to Merced California High-Speed Train Program EIR/EIS HST Station/Alignment Screening Evaluation
Table 2-H-4d Page 3 of 5 U.S. Departmentof TransportationFederal RailroadAdministration
Stations
South Alameda Co. Oakland Airport/ Coliseum
Oakland Terminus Station
Mowry Avenue (I-880 Alignment Only)
Coliseum BART Station (Hayward/Mulford Alignment Only)
West Oakland
Fremont Auto Mall Parkway (Mulford Alignments Only)
Coliseum BART Station (WPRR/Tunnel/Mulford
Alignment Only) Lake Merritt
Warm Springs (I-880/Hayward & WPRR
Alignments Only)
12th/City Center
Evaluation Criteria
Union City (Hayward/I-880 & WPRR
Alignments Only)
I-880/Hegenberger (I-880 Alignment Only)
Jack London Square
• None apparent at this time • Deep tunneling through Embarcadero area & mining of concourse area in Bay mud.
• Construction under active railroad
• Highest cost • Less cost • Lowest cost • Lowest cost • Less cost • Less cost
Capital Cost
• Less cost
• Similar costs
• Highest cost • Highest cost • Highest cost • Highest cost • Highest cost • Highest cost • Lowest cost
Right-of-Way Issues/Costs
• Lowest cost
• Similar costs
• Highest cost
Maximize Compatibility with Existing and Planned Development.
3
3
5 5 5
5 • Compatible land uses • Mowry Station requires taking
commercial property – compatible
• Compatible land uses • Adjacent to BART in mixed-use area, including residential, commercial & light industrial
• Compatible land uses • Compatible land uses • Underground in mixed use area, including residential & commercial
Land Use Compatibility And Conflicts
• Compatible land uses • Requires taking commercial property
• In highly developed commercial area – compatible

APPENDIX 2-H Bay Area to Merced California High-Speed Train Program EIR/EIS HST Station/Alignment Screening Evaluation
Table 2-H-4d Page 4 of 5 U.S. Departmentof TransportationFederal RailroadAdministration
Stations
South Alameda Co. Oakland Airport/ Coliseum
Oakland Terminus Station
Mowry Avenue (I-880 Alignment Only)
Coliseum BART Station (Hayward/Mulford Alignment Only)
West Oakland
Fremont Auto Mall Parkway (Mulford Alignments Only)
Coliseum BART Station (WPRR/Tunnel/Mulford
Alignment Only) Lake Merritt
Warm Springs (I-880/Hayward & WPRR
Alignments Only)
12th/City Center
Evaluation Criteria
Union City (Hayward/I-880 & WPRR
Alignments Only)
I-880/Hegenberger (I-880 Alignment Only)
Jack London Square
• Compatible land uses • Below existing train terminal – compatible
3 5
5 5
5
5 3
5
Visual Quality Impacts
• Minimal visual impact except Mowry Avenue with high visual impact.
• High visual impact for approach structure for I-880 Station
• Other stations directly adjacent to existing major transit stations – minimal visual impact
• Minimal visual impact except for entryways that would need to designed to be attractive and easily distinguished
Minimize Impacts on Natural Resources.
5 Water Resources
• None of the stations are expected to have impacts on critical water resources
5
4
5
5
5
Floodplain Impacts
• Auto Mall Parkway Station in floodplain
• No stations in floodplain
5 Threatened & Endangered
Species Impacts • No threatened or endangered species were identified for the station areas
APPENDIX 2-H Bay Area to Merced California High-Speed Train Program EIR/EIS HST Station/Alignment Screening Evaluation
Table 2-H-4d Page 5 of 5 U.S. Departmentof TransportationFederal RailroadAdministration
Stations
South Alameda Co. Oakland Airport/ Coliseum
Oakland Terminus Station
Mowry Avenue (I-880 Alignment Only)
Coliseum BART Station (Hayward/Mulford Alignment Only)
West Oakland
Fremont Auto Mall Parkway (Mulford Alignments Only)
Coliseum BART Station (WPRR/Tunnel/Mulford
Alignment Only) Lake Merritt
Warm Springs (I-880/Hayward & WPRR
Alignments Only)
12th/City Center
Evaluation Criteria
Union City (Hayward/I-880 & WPRR
Alignments Only)
I-880/Hegenberger (I-880 Alignment Only)
Jack London Square
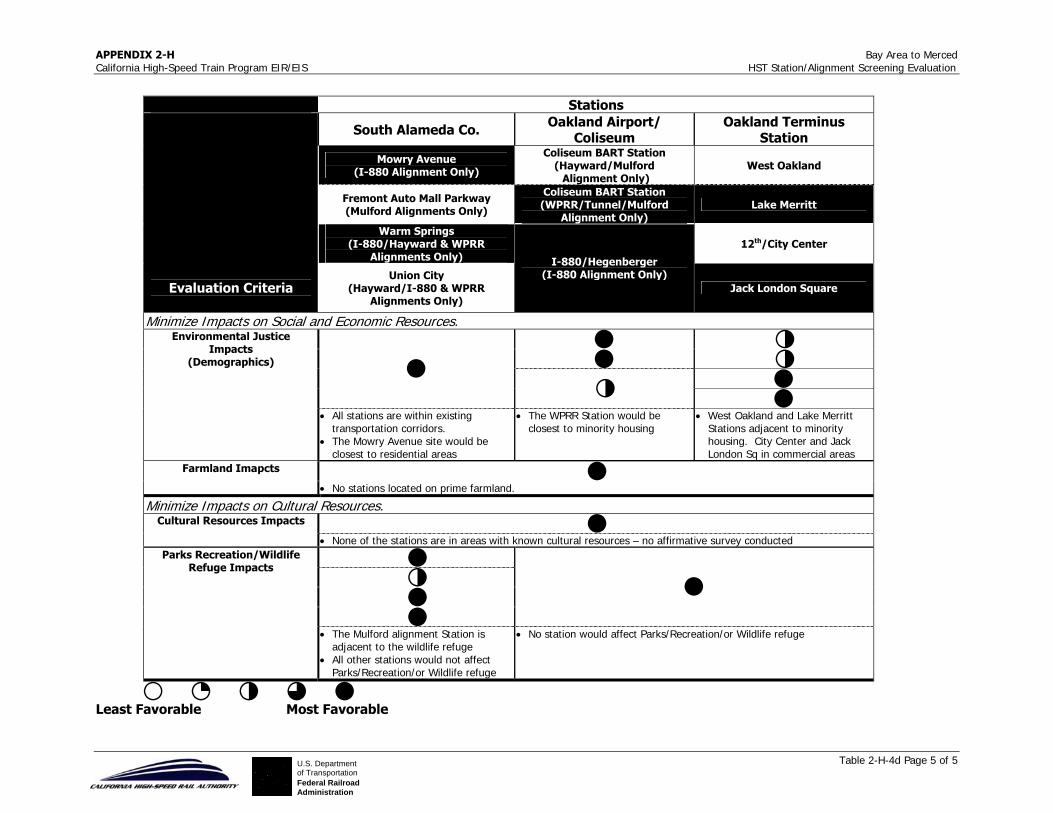
Minimize Impacts on Social and Economic Resources.
5 3
5 3
5 5
3 5
Environmental Justice Impacts
(Demographics)
• All stations are within existing transportation corridors.
• The Mowry Avenue site would be closest to residential areas
• The WPRR Station would be closest to minority housing
• West Oakland and Lake Merritt Stations adjacent to minority housing. City Center and Jack London Sq in commercial areas
5 Farmland Imapcts
• No stations located on prime farmland.
Minimize Impacts on Cultural Resources.
5 Cultural Resources Impacts
• None of the stations are in areas with known cultural resources – no affirmative survey conducted
5
3
5
5
5
Parks Recreation/Wildlife Refuge Impacts
• The Mulford alignment Station is adjacent to the wildlife refuge
• All other stations would not affect Parks/Recreation/or Wildlife refuge
• No station would affect Parks/Recreation/or Wildlife refuge
1 2 3 4 5 Least Favorable Most Favorable
APPENDIX 2-H Bay Area to Merced California High-Speed Train Program EIR/EIS HST Station/Alignment Screening Evaluation
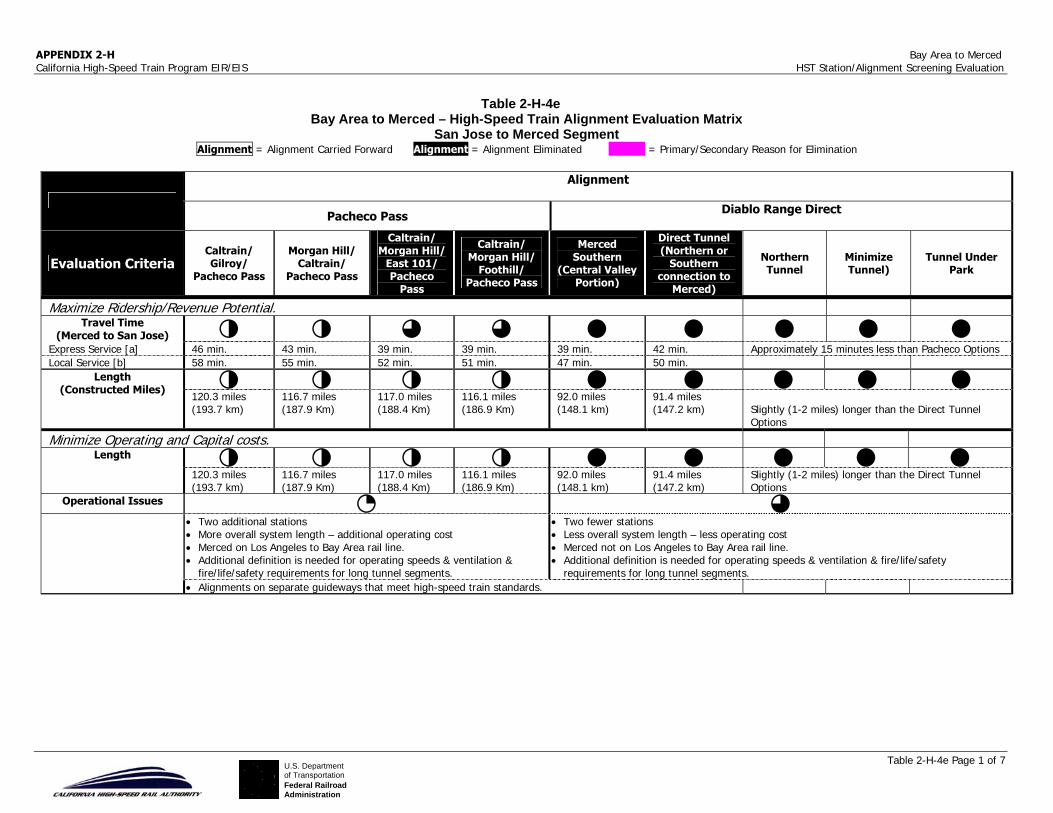
Table 2-H-4e Page 1 of 7 U.S. Departmentof TransportationFederal RailroadAdministration
Table 2-H-4e Bay Area to Merced – High-Speed Train Alignment Evaluation Matrix
San Jose to Merced Segment Alignment = Alignment Carried Forward Alignment = Alignment Eliminated = Primary/Secondary Reason for Elimination
Alignment
Pacheco Pass Diablo Range Direct
Evaluation Criteria Caltrain/ Gilroy/
Pacheco Pass
Morgan Hill/ Caltrain/
Pacheco Pass
Caltrain/ Morgan Hill/
East 101/ Pacheco
Pass
Caltrain/ Morgan Hill/
Foothill/ Pacheco Pass
Merced Southern
(Central Valley Portion)
Direct Tunnel (Northern or
Southern connection to
Merced)
Northern Tunnel
Minimize Tunnel)
Tunnel Under Park
Maximize Ridership/Revenue Potential. Travel Time
(Merced to San Jose) 3 3 4 4 5 5 5 5 5 Express Service [a] 46 min. 43 min. 39 min. 39 min. 39 min. 42 min. Approximately 15 minutes less than Pacheco Options Local Service [b] 58 min. 55 min. 52 min. 51 min. 47 min. 50 min.
3 3 3 3 5 5 5 5 5 Length
(Constructed Miles) 120.3 miles (193.7 km)
116.7 miles (187.9 Km)
117.0 miles (188.4 Km)
116.1 miles (186.9 Km)
92.0 miles (148.1 km)
91.4 miles (147.2 km)
Slightly (1-2 miles) longer than the Direct Tunnel Options
Minimize Operating and Capital costs.
3 3 3 3 5 5 5 5 5 Length
120.3 miles (193.7 km)
116.7 miles (187.9 Km)
117.0 miles (188.4 Km)
116.1 miles (186.9 Km)
92.0 miles (148.1 km)
91.4 miles (147.2 km)
Slightly (1-2 miles) longer than the Direct Tunnel Options
Operational Issues 2 4 • Two additional stations • More overall system length – additional operating cost • Merced on Los Angeles to Bay Area rail line. • Additional definition is needed for operating speeds & ventilation &
fire/life/safety requirements for long tunnel segments.
• Two fewer stations • Less overall system length – less operating cost • Merced not on Los Angeles to Bay Area rail line. • Additional definition is needed for operating speeds & ventilation & fire/life/safety
requirements for long tunnel segments.
• Alignments on separate guideways that meet high-speed train standards.

APPENDIX 2-H Bay Area to Merced California High-Speed Train Program EIR/EIS HST Station/Alignment Screening Evaluation
Table 2-H-4e Page 2 of 7 U.S. Departmentof TransportationFederal RailroadAdministration
Alignment
Pacheco Pass Diablo Range Direct
Evaluation Criteria Caltrain/ Gilroy/
Pacheco Pass
Morgan Hill/ Caltrain/
Pacheco Pass
Caltrain/ Morgan Hill/
East 101/ Pacheco
Pass
Caltrain/ Morgan Hill/
Foothill/ Pacheco Pass
Merced Southern
(Central Valley Portion)
Direct Tunnel (Northern or
Southern connection to
Merced)
Northern Tunnel
Minimize Tunnel)
Tunnel Under Park
4 4 4 2 1 4 Construction Issues
• Need to determine type of structure for wetland areas • For tunnels:
- Highly variable soil types & faults - Need to determine best tunneling approach - Ventilation/fire/life/safety issues
• Major cuts required for Foothills Alignment. • Monterey Highway corridor would need to be reconstructed to
accommodate highway, Caltrain, UPRR, & high-speed train needs. Maintenance of vehicular & train traffic will be critical.
• Constructing aerial structure and stations in Gilroy and Morgan Hill over or near active railroad tracks will require staging, detours and additional ROW
• Type of structure for wetland areas • For tunnels:
- Long tunnels - Highly variable soil types
- Multiple faults - Ventilation/fire/life/safety issues
• Impracticable to construct 30+ mile tunnel with California’s geology/seismic conditions
• Need to determine type of structure for wetland areas
• For tunnels: - Highly variable soil types & faults - Need to determine best tunneling approach - Ventilation/fire/life/safety issues
• Major cuts required for Foothills Alignment. • Tunnels substantially less length than Direct Tunnel
Option (11-16 miles of total tunneling) • Minimize Tunnel and Tunnel Under Park option
allow for no highway access for construction • Northern Tunnel Option allows for construction
access from Highway 130.
4 4 4 4 2 2 3 4 3 Capital Cost
Approx. $200 Million more than Pacheco Pass/Foothills
Least Costly Quantm study estimated nearly $3 billion more than Minimize Tunnel option
Higher cost than the Minimize Tunnel Option (Quantm study estimated at $480 million more)
Least Costly. Approximately the same level of cost as or less then the cost of the Pacheco Pass/Gilroy/ Caltrain Option
Higher cost than the Minimize Tunnel Option (Quantm study estimated at $360 million more)

APPENDIX 2-H Bay Area to Merced California High-Speed Train Program EIR/EIS HST Station/Alignment Screening Evaluation
Table 2-H-4e Page 3 of 7 U.S. Departmentof TransportationFederal RailroadAdministration
Alignment
Pacheco Pass Diablo Range Direct
Evaluation Criteria Caltrain/ Gilroy/
Pacheco Pass
Morgan Hill/ Caltrain/
Pacheco Pass
Caltrain/ Morgan Hill/
East 101/ Pacheco
Pass
Caltrain/ Morgan Hill/
Foothill/ Pacheco Pass
Merced Southern
(Central Valley Portion)
Direct Tunnel (Northern or
Southern connection to
Merced)
Northern Tunnel
Minimize Tunnel)
Tunnel Under Park
2 2 3 3 5 4 Right-of-Way Issues
• Farmland east of I-5 & south of Gilroy.
• Properties around Gilroy Station & Caltrain corridor for UPRR & highway relocation.
• Farmland east of I-5.
• Properties around Morgan Hill Station & Caltrain corridor for UPRR & highway relocation.
• Farmland east of I-5.
• Properties for Morgan Hill Station & commercial property along Freeway.
• Properties along Caltrain corridor for UPRR & highway relocation.
• Farmland east of I-5.
• Properties for Morgan Hill Station & and residential an open space properties in foothills
• Properties along Caltrain corridor for UPRR & highway relocation.
• Least impact due to long tunnel • Farmland north and east of Merced • Properties near 101 and crossing of
SR-87
• Low Impact due to shorter length of alignment. • Only small portion of alignment in developed rights
of way. • Farmland north and east of Merced • Properties near 101 and crossing of SR-87
Maximize Compatibility with Existing and Planned Development.
3 2 1 4 3 Land Use Compatibility
and Conflicts • Alignment generally compatible with rail & highway
corridors. • Rail alignment
less compatible with rural/ residential land uses in foothills
• Fewer land use compatibility issues due to long tunnel
• Similar levels of compatibility as compared with the Pacheco Options.

APPENDIX 2-H Bay Area to Merced California High-Speed Train Program EIR/EIS HST Station/Alignment Screening Evaluation
Table 2-H-4e Page 4 of 7 U.S. Departmentof TransportationFederal RailroadAdministration
Alignment
Pacheco Pass Diablo Range Direct
Evaluation Criteria Caltrain/ Gilroy/
Pacheco Pass
Morgan Hill/ Caltrain/
Pacheco Pass
Caltrain/ Morgan Hill/
East 101/ Pacheco
Pass
Caltrain/ Morgan Hill/
Foothill/ Pacheco Pass
Merced Southern
(Central Valley Portion)
Direct Tunnel (Northern or
Southern connection to
Merced)
Northern Tunnel
Minimize Tunnel)
Tunnel Under Park
2 3 3 1 4 3 Visual Quality Impacts
• Tunnel segments minimize visual impacts.
• Surface & aerial sections in Pass create visual change in natural environment
• Although on berm or structure to Gilroy, visual effects on flat valley (farmlands, rural, & wetland/ natural habitat
• Tunnel segments minimize visual impacts.
• Surface and aerial sections in Pass create visual change in natural environment. Impacts less severe than Gilroy alignment.
• Tunnel segments minimize visual impacts.
• Surface and aerial sections in the Pass create visual change in natural environment.
• Impacts less severe than Gilroy alignment.
• Tunnel segments minimize visual impacts.
• Surface and aerial sections in Pass create visual change in natural environment.
• Travels through natural foothills introducing new major visual element.
• Area in tunnel will minimize visual impacts.
• Even though on low berm or structure, will have visual effects on flat San Joaquin Valley characterized by farmlands, sparse rural development, & wetlands/ natural habitat areas.
• New structures crossing U.S. 101 & SR-87 will be a new visual element.
• Tunnel segments minimize visual impacts. • Surface & aerial sections in Pass create visual
change in natural environment. • No roads or other developed viewing points. • Minimize Tunnel option has less tunnel length than
Northern Tunnel and Tunnel under Park Option. • Even though on low berm or structure, will have
visual effects on flat San Joaquin Valley characterized by farmlands, sparse rural development, & wetlands/ natural habitat areas.
• New structures crossing U.S. 101 & SR-87 will be a new visual element.
Minimize Impacts on Natural Resources. Water Resources 1 2 1 2 5 5 5
# of crossing of alignments (linear ft of alignment centerline)
77 (3,850) 65 (3,250) 78 (3,900) 70 (3,500) 27 (1,350) 27 (1,350) Over 30% less potential impacts on surface waters than Pacheco Options
Floodplain Impacts 1 2 2 2 5 5 5 5 5 # of 100 yr. floodplain crossings
40 36 51 40 21 16
Total length of alignment (meters)
256,432 250,640 251,000 249,500 176,316 178,474 Slightly (1-2 miles) longer than the Direct Tunnel Options

APPENDIX 2-H Bay Area to Merced California High-Speed Train Program EIR/EIS HST Station/Alignment Screening Evaluation
Table 2-H-4e Page 5 of 7 U.S. Departmentof TransportationFederal RailroadAdministration
Alignment
Pacheco Pass Diablo Range Direct
Evaluation Criteria Caltrain/ Gilroy/
Pacheco Pass
Morgan Hill/ Caltrain/
Pacheco Pass
Caltrain/ Morgan Hill/
East 101/ Pacheco
Pass
Caltrain/ Morgan Hill/
Foothill/ Pacheco Pass
Merced Southern
(Central Valley Portion)
Direct Tunnel (Northern or
Southern connection to
Merced)
Northern Tunnel
Minimize Tunnel)
Tunnel Under Park
Length of alignment within 100 year floodplain
31,023 29,432 32,514 24,269 14,780 10,367 Approximately 60-80% less potential floodplain encroachment than Pacheco Pass Options
Percent of total length within floodplain
12.1% 11.7% 13.0% 9.7% 8.4% 5.8%
Threatened & Endangered Species
Impacts 2 2 1 1 5 5 3 3 3
# of threatened & endangered species (per CNDDB)
3 4 5 5 5 3 No significant difference in the number of special status species occurrence as compared with Pacheco Pass options.
# Federal endangered 2 3 3 3 2 2 # Federal threatened 1 1 2 2 1 0 # State endangered 0 1 1 0 1 0 # State endangered 2 2 2 2 2 2 Area of Alignment within Sensitive Habitat (per CNDDB)
1,053,770 1,065,527 1,210,685 1,309,607 788,199 766,289 2400 – 3000 acres (or 24-30%) less encroachment on Special status species habitat than Pacheco Pass options
Minimize Impacts on Social and Economic Resources. Environmental Justice
Impacts (Demographics)
4 5 5 5 5 5 5
# block groups >50 percent minority
38 32 31 26 27 30
# block groups >50 percent low-Income
0 0 0 0 0 0
Potentially affected minority population
7,462 4,399 4,097 4,020 4,341 4,251
Potentially affected low-income population
0 0 0 0 0 0
These alignment options have very similar potential impacts on environmental justice communities, since they do not pass through Gilroy.
Farmland Impacts 1 3 3 3 5 5 4 4 4 Area of prime farmland (square meters)
1,718,152 1,723,213 1,673,135 1,280,980 418,636 491,598 16-27% reduction in potential impact to Prime farmland compared to Pacheco Pass Options.
Area of unique farmland (square meters)
456,833 456,833 454,120 473,200 36,291 92,857 70% reduction in potential impact to Unique farmland compared to Pacheco Pass Options.
Area of farmland of statewide importance
855,365 657,124 649,175 632,244 748,199 660,366 19-42% increase in potential impact to farmlands of statewide importance compared to Pacheco Pass
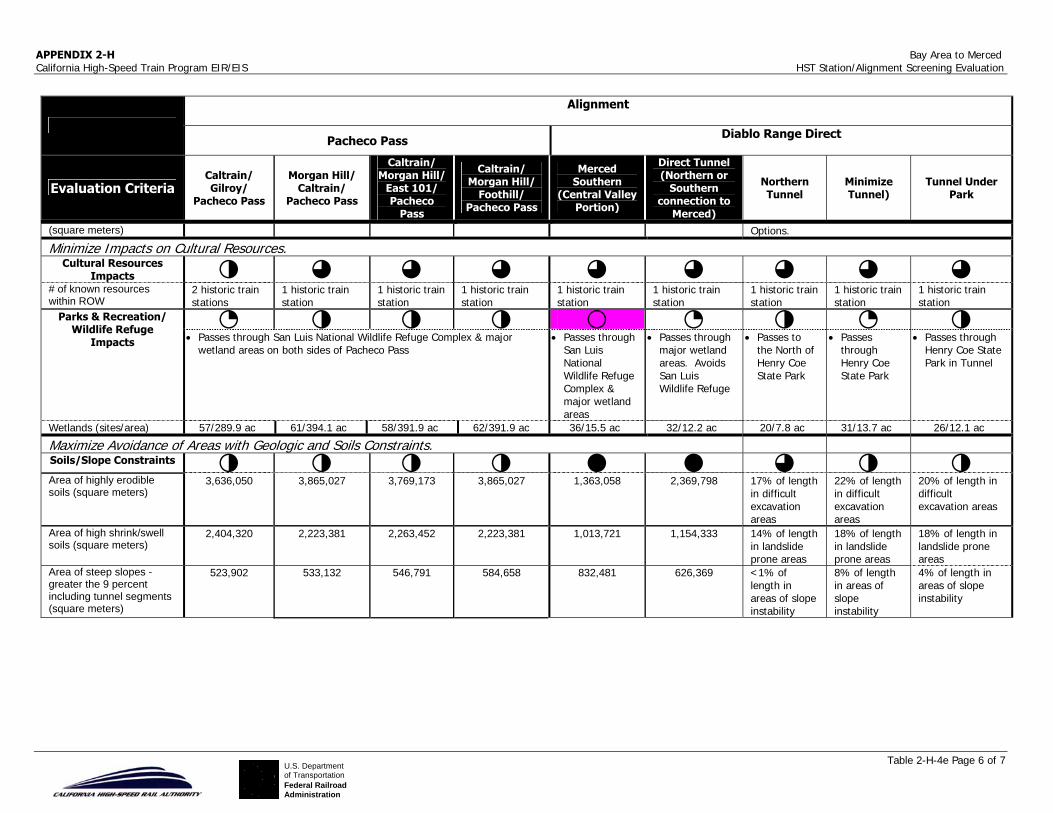
APPENDIX 2-H Bay Area to Merced California High-Speed Train Program EIR/EIS HST Station/Alignment Screening Evaluation
Table 2-H-4e Page 6 of 7 U.S. Departmentof TransportationFederal RailroadAdministration
Alignment
Pacheco Pass Diablo Range Direct
Evaluation Criteria Caltrain/ Gilroy/
Pacheco Pass
Morgan Hill/ Caltrain/
Pacheco Pass
Caltrain/ Morgan Hill/
East 101/ Pacheco
Pass
Caltrain/ Morgan Hill/
Foothill/ Pacheco Pass
Merced Southern
(Central Valley Portion)
Direct Tunnel (Northern or
Southern connection to
Merced)
Northern Tunnel
Minimize Tunnel)
Tunnel Under Park
(square meters) Options.
Minimize Impacts on Cultural Resources. Cultural Resources
Impacts 3 4 4 4 4 4 4 4 4 # of known resources within ROW
2 historic train stations
1 historic train station
1 historic train station
1 historic train station
1 historic train station
1 historic train station
1 historic train station
1 historic train station
1 historic train station
2 3 3 3 1 2 3 2 3 Parks & Recreation/
Wildlife Refuge Impacts • Passes through San Luis National Wildlife Refuge Complex & major
wetland areas on both sides of Pacheco Pass • Passes through
San Luis National Wildlife Refuge Complex & major wetland areas
• Passes through major wetland areas. Avoids San Luis Wildlife Refuge
• Passes to the North of Henry Coe State Park
• Passes through Henry Coe State Park
• Passes through Henry Coe State Park in Tunnel
Wetlands (sites/area) 57/289.9 ac 61/394.1 ac 58/391.9 ac 62/391.9 ac 36/15.5 ac 32/12.2 ac 20/7.8 ac 31/13.7 ac 26/12.1 ac
Maximize Avoidance of Areas with Geologic and Soils Constraints.
Soils/Slope Constraints 3 3 3 3 5 5 4 3 3 Area of highly erodible soils (square meters)
3,636,050 3,865,027 3,769,173 3,865,027 1,363,058 2,369,798 17% of length in difficult excavation areas
22% of length in difficult excavation areas
20% of length in difficult excavation areas
Area of high shrink/swell soils (square meters)
2,404,320 2,223,381 2,263,452 2,223,381 1,013,721 1,154,333 14% of length in landslide prone areas
18% of length in landslide prone areas
18% of length in landslide prone areas
Area of steep slopes - greater the 9 percent including tunnel segments (square meters)
523,902 533,132 546,791 584,658 832,481 626,369 <1% of length in areas of slope instability
8% of length in areas of slope instability
4% of length in areas of slope instability

APPENDIX 2-H Bay Area to Merced California High-Speed Train Program EIR/EIS HST Station/Alignment Screening Evaluation
Table 2-H-4e Page 7 of 7 U.S. Departmentof TransportationFederal RailroadAdministration
Alignment
Pacheco Pass Diablo Range Direct
Evaluation Criteria Caltrain/ Gilroy/
Pacheco Pass
Morgan Hill/ Caltrain/
Pacheco Pass
Caltrain/ Morgan Hill/
East 101/ Pacheco
Pass
Caltrain/ Morgan Hill/
Foothill/ Pacheco Pass
Merced Southern
(Central Valley Portion)
Direct Tunnel (Northern or
Southern connection to
Merced)
Northern Tunnel
Minimize Tunnel)
Tunnel Under Park
5 3 1 5 • Cross
Ortigalita Fault in tunnel.
• Cross Silver Creek & Calaveras faults at-grade.
• Cross Ortigalita Fault in tunnel. • Cross Silver Creek and Calaveras faults in aerial.
• Cross San Joaquin, Ortigalita, Greenville, Piercy, and Calaveras faults in tunnel.
• Cross Ortigalita and Calaveras faults at-grade.
Seismic Constraints
• All high-speed train facilities would be designed taking into account existing soil, groundwater, and geologic conditions in the area and to withstand maximum credible earthquakes from fault activity in the area.
Notes: [a] Express trains would not stop in Merced but would travel non-stop to San Jose [b] Local trains would stop in Merced and at Gilroy or Morgan Hill stations for the Pacheco Pass alignments
1 2 3 4 5 Least Favorable Most Favorable
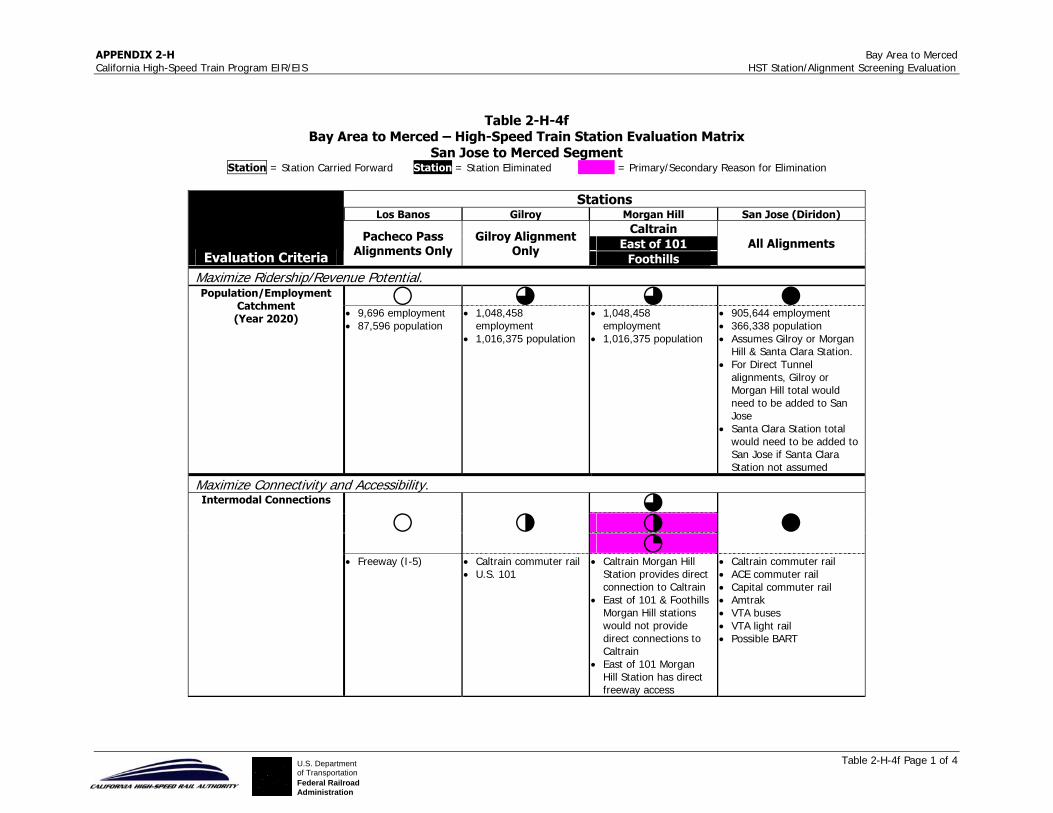
APPENDIX 2-H Bay Area to Merced California High-Speed Train Program EIR/EIS HST Station/Alignment Screening Evaluation
Table 2-H-4f Page 1 of 4 U.S. Departmentof TransportationFederal RailroadAdministration
Table 2-H-4f
Bay Area to Merced – High-Speed Train Station Evaluation Matrix San Jose to Merced Segment
Station = Station Carried Forward Station = Station Eliminated = Primary/Secondary Reason for Elimination
Stations Los Banos Gilroy Morgan Hill San Jose (Diridon)
Caltrain East of 101
Evaluation Criteria
Pacheco Pass Alignments Only
Gilroy Alignment Only
Foothills All Alignments
Maximize Ridership/Revenue Potential.
1 4 4 5 Population/Employment
Catchment (Year 2020) • 9,696 employment
• 87,596 population • 1,048,458
employment • 1,016,375 population
• 1,048,458 employment
• 1,016,375 population
• 905,644 employment • 366,338 population • Assumes Gilroy or Morgan
Hill & Santa Clara Station. • For Direct Tunnel
alignments, Gilroy or Morgan Hill total would need to be added to San Jose
• Santa Clara Station total would need to be added to San Jose if Santa Clara Station not assumed
Maximize Connectivity and Accessibility.
4 3 1 3
2 5
Intermodal Connections
• Freeway (I-5) • Caltrain commuter rail • U.S. 101
• Caltrain Morgan Hill Station provides direct connection to Caltrain
• East of 101 & Foothills Morgan Hill stations would not provide direct connections to Caltrain
• East of 101 Morgan Hill Station has direct freeway access
• Caltrain commuter rail • ACE commuter rail • Capital commuter rail • Amtrak • VTA buses • VTA light rail • Possible BART

APPENDIX 2-H Bay Area to Merced California High-Speed Train Program EIR/EIS HST Station/Alignment Screening Evaluation
Table 2-H-4f Page 2 of 4 U.S. Departmentof TransportationFederal RailroadAdministration
Stations Los Banos Gilroy Morgan Hill San Jose (Diridon)
Caltrain East of 101
Evaluation Criteria
Pacheco Pass Alignments Only
Gilroy Alignment Only
Foothills All Alignments
Minimize Operating and Capital Costs.
3
5 2 3
5 2
• Grade separated pedestrian connection to platforms and Caltrain
• None
Operational Issues
• None • Grade separated pedestrian connections needed to platforms & Caltrain.
• None
• Station would feed both San Francisco & Oakland lines. Track designations needed.
• Grade separated pedestrian connections needed to platforms & Caltrain.
3
5 5 3
5 2
• Constructing over or near active railroad tracks
• None
Construction Issues
• None • Constructing over or near active railroad tracks
• None
• Constructing over active railroad platforms and tracks
Capital Cost
Least Costly Moderate Costs Moderate Costs Most Costly
3
3 5 3
4 5
• Commercial property • Commercial property
Right-of-Way Issues/Cost
• Currently vacant land
• Commercial property required
• Rural property
• No ROW cost assumed

APPENDIX 2-H Bay Area to Merced California High-Speed Train Program EIR/EIS HST Station/Alignment Screening Evaluation
Table 2-H-4f Page 3 of 4 U.S. Departmentof TransportationFederal RailroadAdministration
Stations Los Banos Gilroy Morgan Hill San Jose (Diridon)
Caltrain East of 101
Evaluation Criteria
Pacheco Pass Alignments Only
Gilroy Alignment Only
Foothills All Alignments
Maximize Compatibility with Existing and Planned Development.
5
5 5 5
3
5
• No apparent conflicts in Morgan Hill
• Design high-speed train station to function efficiently with Caltrain station
• No apparent conflicts
Land Use Compatibility and Conflicts
• No conflicts • No apparent conflicts • Design high-speed
train station to function efficiently with Caltrain station
• More suburban in nature with residential
• Compatible with City of San Jose’s strategic downtown plan.
• Buffer needed between aerial high-speed train station & the new residential west of the station.
4
5 5 4
1
3
• Large aerial structure in Morgan Hill
• Minimal impacts
Visual Quality Impacts
• Minimal impacts • Large aerial structure in Gilroy and farmland embankment south of Gilroy • Adverse impacts
• Moderate impacts due to size and residential to the west
Minimize Impacts on Natural Resources.
3 5 Water Resources
• Potential impacts on San Luis Waterway
• No impacts anticipated
1 1 5 5 Floodplain Impacts
• Located in 100-year floodplain
• Located in 100-year floodplain
• Not in floodplain • Not in floodplain

APPENDIX 2-H Bay Area to Merced California High-Speed Train Program EIR/EIS HST Station/Alignment Screening Evaluation
Table 2-H-4f Page 4 of 4 U.S. Departmentof TransportationFederal RailroadAdministration
Stations Los Banos Gilroy Morgan Hill San Jose (Diridon)
Caltrain East of 101
Evaluation Criteria
Pacheco Pass Alignments Only
Gilroy Alignment Only
Foothills All Alignments
5
5 1 5
1 4
• None identified by statewide GIS
• None identified by statewide GIS
Threatened & Endangered Species Impacts
• San Joaquin Kit Fox • None identified by statewide GIS
• California Tiger Salamander
• California Tiger Salamander
• Highly urban area
Minimize Impacts on Social and Economic Resources. Environmental Justice
Impacts (Demographics)
• Disproportionate impacts not anticipated for any station
5 5 5 5 • Not in farmland area
• In Prime Farmland Area although effects minimal due to station location.
Farmland Impacts
• In Prime Farmland Area although effects minimal due to station location.
• Not in farmland area
• Not in farmland area
• Not in farmland area
Minimize Impacts on Cultural Resources.
3 4 4 4 Cultural Resources
Impacts • San Jose (Diridon)
Station • Gilroy Station
• San Jose (Diridon) Station
• San Jose (Diridon) Station
• San Jose (Diridon) Station
Parks & Recreation/ Wildlife Refuge Impacts
• No impacts on parks, recreation, or wildlife refuge areas for stations in this segment.
geologic and soils constraints
• All high-speed train facilities would be designed taking into account existing soil, groundwater, and geologic conditions in the area and to withstand maximum credible earthquakes from fault activity in the area.
1 2 3 4 5
Least Favorable Most Favorable

APPENDIX 2H Sacramento to Bakersfield California High-Speed Train Program EIR/EIS HST Alignment/Station Screening Evaluation
Table 2-H-5 Page 1 of 4 U.S. Departmentof TransportationFederal RailroadAdministration
Table 2-H-5 Sacramento to Bakersfield – High-Speed Train Alignment Evaluation Matrix
Sacramento to Stockton Alignment Alignment = Alignment Carried Forward Alignment = Alignment Eliminated = Primary or Secondary Reason for Elimination
Evaluation Criteria
Southern Pacific River Line/Western Pacific
(WPRR) (Downtown Sacramento to
Downtown Stockton)
Union Pacific Railroad (UPRR)
(Downtown Sacramento to Downtown Stockton)
Central California Traction (CCT)
(Downtown Sacramento to Downtown Stockton)
Maximize Ridership/Revenue Potential. Travel Time
VHS 16 minutes
VHS 19.2 minutes
VHS 19.6 minutes
5 3 3
Length
45.88 miles 73.84 km
46.40 miles 74.67 km
48.20 miles 77.56 km
5 4 3
Population/Employment Catchment
Not Applicable
Not Applicable
Not Applicable
Maximize Connectivity and Accessibility. Intermodal Connections
Not Applicable
Not Applicable
Not Applicable
Minimize Operating and Capital Costs.
Length
Shortest and least costly of the three A1122 alternatives
Most costly of the three A1122 alternatives
Longest of the three A1122 alternatives
5 2 2
Operational Issues
Sub std curve ±2 miles from Sac. Sta. 90 mph. Requires HSR through track @ Stockton
Structure and ROW first 6 miles from Sac. Requires HSR through track @ Stockton.
Structure and ROW first 6 miles from Sac. Requires HSR through track @ Stockton.
2 2 2
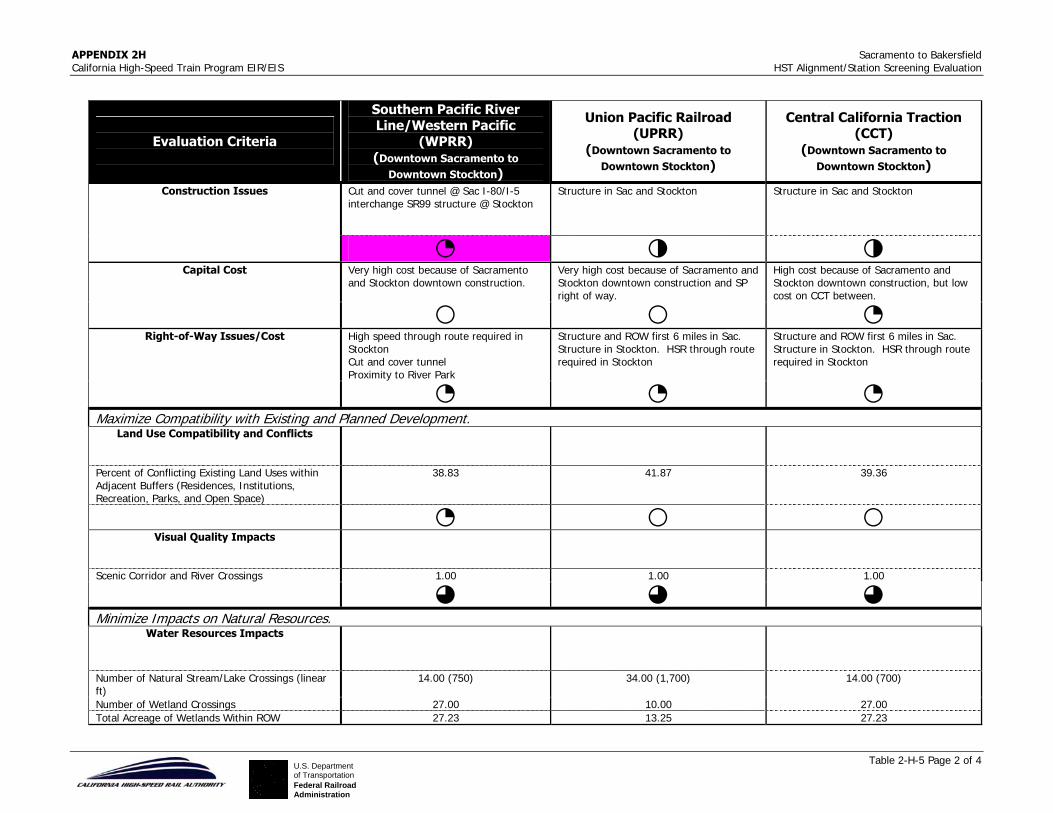
APPENDIX 2H Sacramento to Bakersfield California High-Speed Train Program EIR/EIS HST Alignment/Station Screening Evaluation
Table 2-H-5 Page 2 of 4 U.S. Departmentof TransportationFederal RailroadAdministration
Evaluation Criteria
Southern Pacific River Line/Western Pacific
(WPRR) (Downtown Sacramento to
Downtown Stockton)
Union Pacific Railroad (UPRR)
(Downtown Sacramento to Downtown Stockton)
Central California Traction (CCT)
(Downtown Sacramento to Downtown Stockton)
Construction Issues
Cut and cover tunnel @ Sac I-80/I-5 interchange SR99 structure @ Stockton
Structure in Sac and Stockton Structure in Sac and Stockton
2 3 3
Capital Cost
Very high cost because of Sacramento and Stockton downtown construction.
Very high cost because of Sacramento and Stockton downtown construction and SP right of way.
High cost because of Sacramento and Stockton downtown construction, but low cost on CCT between.
1 1 2
Right-of-Way Issues/Cost
High speed through route required in Stockton Cut and cover tunnel Proximity to River Park
Structure and ROW first 6 miles in Sac. Structure in Stockton. HSR through route required in Stockton
Structure and ROW first 6 miles in Sac. Structure in Stockton. HSR through route required in Stockton
2 2 2
Maximize Compatibility with Existing and Planned Development. Land Use Compatibility and Conflicts
Percent of Conflicting Existing Land Uses within Adjacent Buffers (Residences, Institutions, Recreation, Parks, and Open Space)
38.83 41.87 39.36
2 1 1
Visual Quality Impacts
Scenic Corridor and River Crossings 1.00 1.00 1.00
4 4 4 Minimize Impacts on Natural Resources.
Water Resources Impacts
Number of Natural Stream/Lake Crossings (linear ft)
14.00 (750) 34.00 (1,700) 14.00 (700)
Number of Wetland Crossings 27.00 10.00 27.00 Total Acreage of Wetlands Within ROW 27.23 13.25 27.23
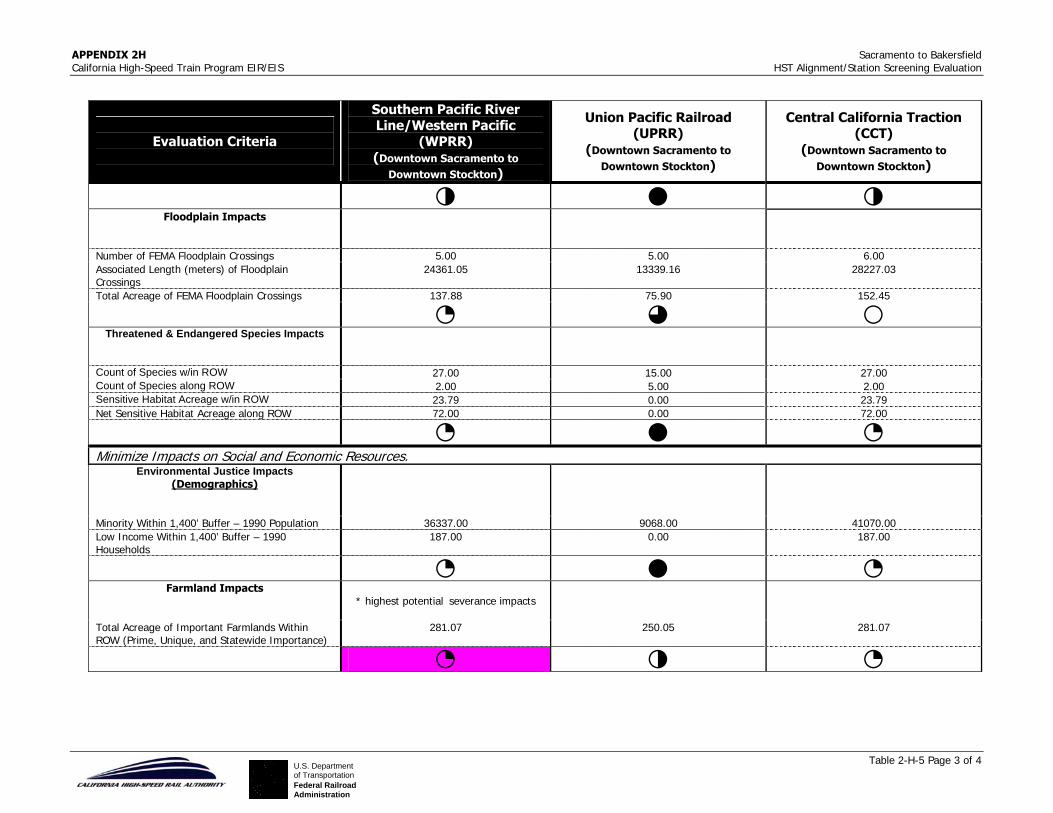
APPENDIX 2H Sacramento to Bakersfield California High-Speed Train Program EIR/EIS HST Alignment/Station Screening Evaluation
Table 2-H-5 Page 3 of 4 U.S. Departmentof TransportationFederal RailroadAdministration
Evaluation Criteria
Southern Pacific River Line/Western Pacific
(WPRR) (Downtown Sacramento to
Downtown Stockton)
Union Pacific Railroad (UPRR)
(Downtown Sacramento to Downtown Stockton)
Central California Traction (CCT)
(Downtown Sacramento to Downtown Stockton)
3 5 3 Floodplain Impacts
Number of FEMA Floodplain Crossings 5.00 5.00 6.00 Associated Length (meters) of Floodplain Crossings
24361.05 13339.16 28227.03
Total Acreage of FEMA Floodplain Crossings 137.88 75.90 152.45
2 4 1 Threatened & Endangered Species Impacts
Count of Species w/in ROW 27.00 15.00 27.00 Count of Species along ROW 2.00 5.00 2.00 Sensitive Habitat Acreage w/in ROW 23.79 0.00 23.79 Net Sensitive Habitat Acreage along ROW 72.00 0.00 72.00
2 5 2 Minimize Impacts on Social and Economic Resources.
Environmental Justice Impacts (Demographics)
Minority Within 1,400’ Buffer – 1990 Population 36337.00 9068.00 41070.00 Low Income Within 1,400’ Buffer – 1990 Households
187.00 0.00 187.00
2 5 2
Farmland Impacts
* highest potential severance impacts
Total Acreage of Important Farmlands Within ROW (Prime, Unique, and Statewide Importance)
281.07 250.05 281.07
2 3 2

APPENDIX 2H Sacramento to Bakersfield California High-Speed Train Program EIR/EIS HST Alignment/Station Screening Evaluation
Table 2-H-5 Page 4 of 4 U.S. Departmentof TransportationFederal RailroadAdministration
Evaluation Criteria
Southern Pacific River Line/Western Pacific
(WPRR) (Downtown Sacramento to
Downtown Stockton)
Union Pacific Railroad (UPRR)
(Downtown Sacramento to Downtown Stockton)
Central California Traction (CCT)
(Downtown Sacramento to Downtown Stockton)
Cultural Resources Impacts
Number of National Register Resources Within ROW
0.00 0.00 0.00
Number of National Register Resources along ROW
1.00 0.00 1.00
5 5 4
Parks & Recreation/Wildlife Refuge Impacts
* highest alignment impacts on new corridor
Total Acreage Parks/Recreation Areas in ROW 36.71 0.02 36.71 Total Acreage of Parks/Recreation Areas along ROW
116.78 0.12 116.78
Incidences of Parks/Recreation Areas in ROW 4.00 1.00 4.00 Incidences of Parks/Recreation Areas along ROW 0.00 1.00 0.00
1 5 1 Soils/Slope Constraints
Not a Distinguishing Factor
Seismic Constraints
Not a Distinguishing Factor
Hazardous Materials/Waste Constraints
Not a Distinguishing Factor
1 2 3 4 5
Least Favorable Most Favorable

APPENDIX 2-H Sacramento to Bakersfield California High-Speed Train Program EIR/EIS HST Alignment/Station Screening Evaluation
Table 2-H-6 Page 1 of 9 U.S. Departmentof TransportationFederal RailroadAdministration
Table 2-H-6 Sacramento to Bakersfield – High-Speed Train Station Evaluation Matrix
Sacramento Stations Station Name = Station Carried Forward Station Name = Station Eliminated = Primary or Secondary Reason for Elimination
Evaluation Criteria
Sacramento Downtown Curtis Park Executive Airport Power Inn Road
Maximize Ridership/Revenue Potential. Travel Time
Not
Applicable Not
Applicable Not
Applicable Not
Applicable
Length
Not Applicable
Not Applicable
Not Applicable
Not Applicable
Population/Employment Catchment
5 3 3 3 Maximize Connectivity and Accessibility.
Intermodal Connections
• Downtown station. • Freeway access: ¼ mile
from I-5 • Street access: On street
grid as planned by city • Parking: Parking area
adequate, but not adjacent to station.
• Transit: RT LRT and bus to be at site.
• Other rail: Amtrak Capital service to Bay Area and Sierra foothills
• Near downtown station site.
• Freeway access: to east from SR99
• Street access: Arterial access from Sutterville Rd/12th St. Limited street grid.
• Parking: Parking adequate at site.
• Transit: RT LRT line and Sacramento City College station under construction in same r-o-w.
• Other rail:
• Suburban location • Freeway access: I-5
Florin and Fruitridge ramps ca. 2 miles
• Street access: Arterial access from Freeport Bl
• Parking on airport site. • Transit: Bus access only.
• Suburban industrial site. • Freeway access: US 50,
1 ½ mi • Arterial access: Power
Inn Road, Folsom Road (1 mi)
• Parking adequate at site. • Transit: RT Folsom line
1 mi.
5 3 2 2 Minimize Operating and Capital Costs.
Length
Not Applicable
Not Applicable
Not Applicable
Not Applicable

APPENDIX 2-H Sacramento to Bakersfield California High-Speed Train Program EIR/EIS HST Alignment/Station Screening Evaluation
Table 2-H-6 Page 2 of 9 U.S. Departmentof TransportationFederal RailroadAdministration
Evaluation Criteria
Sacramento Downtown Curtis Park Executive Airport Power Inn Road
Operational Issues
• Terminal station: maintenance yard can be east of station on through track ladder.
• HSR on lower level; Amtrak and RT on street level; needs design coordination.
• Terminal station must be stub ended at the site; maintenance facilities must be accessed through station track throat.
• Must accommodate RT LRT and through freight traffic.
• Terminal station must be stub ended at the site;
• maintenance facilities must be accessed through station track throat.
• Existing freight on both SP and CCT lines.
5 4 4 3
Construction Issues
• Lower level station on high watertable site requires retaining walls/levees and pumping equip.
• Cut and cover tunnels on 3rd St.
• Phasing with Amtrak and RT makes design coordination essential.
• Area is flat land in a former rail yard of the Western Pacific (UP).
• Surrounding uses, including LRT and though freight, trains must be accommodated.
• No exceptional problems on the ground. Some relocation of aviation outbuildings and airport parking.
• Reconfiguration of freight routes and siding access.
1 3 4 3
Capital Cost
$220 million Very high costs, due to underground location, tunneling and design coordination
$110 million Moderate costs
$110 million Moderate costs
$110 million Moderate costs
1 3 3 3
Right-of-Way Issues/Cost
Historical site with railroad uses. Cut and cover under city streets.
No right-of-way problems. UP and RT ownership.
No right-of-way problems. City-owned land.
Existing railroad land.
2 4 4 2

APPENDIX 2-H Sacramento to Bakersfield California High-Speed Train Program EIR/EIS HST Alignment/Station Screening Evaluation
Table 2-H-6 Page 3 of 9 U.S. Departmentof TransportationFederal RailroadAdministration
Evaluation Criteria
Sacramento Downtown Curtis Park Executive Airport Power Inn Road
Maximize Compatibility with Existing and Planned Development. Land Use Compatibility and Conflicts
Percent of Conflicting Existing Land Uses (Residences, Institutions, Recreational Areas, and Open Space) within Station Area
30.68 97.46 14.63 42.17
Primary Land Uses (acreage) within station area Industrial (51); Institutional (101); Transportation (220)
Institutional (85); Open Space (97); Residential (202)
Residential (65); Transportation (388)
Industrial (221); Open Space (48); Residential (106)
4 1 5 3
Visual Quality Impacts
Percent of Visually Sensitive Existing Land Uses (Residential, Institutional, Recreational Areas, and Open Space)
30.68 97.46 14.63 42.17
Number of scenic corridor and scenic river crossings
0 0 0 0
4 1 5 3
Minimize Impacts on Natural Resources. Water Resources Impacts
Number of Natural Stream 0 0 0 0 Number of Wetland Crossings 0 0 0 0 Total Acreage of Wetlands within Station Area 0 0 0 0 5 5 5 5
Floodplain Impacts
Number of FEMA Floodplain Crossings 3 1 1 1 Total Acreage of FEMA Floodplain Crossings within Station Area
241.11 443.87 503.02 497.26
5 3 1 2
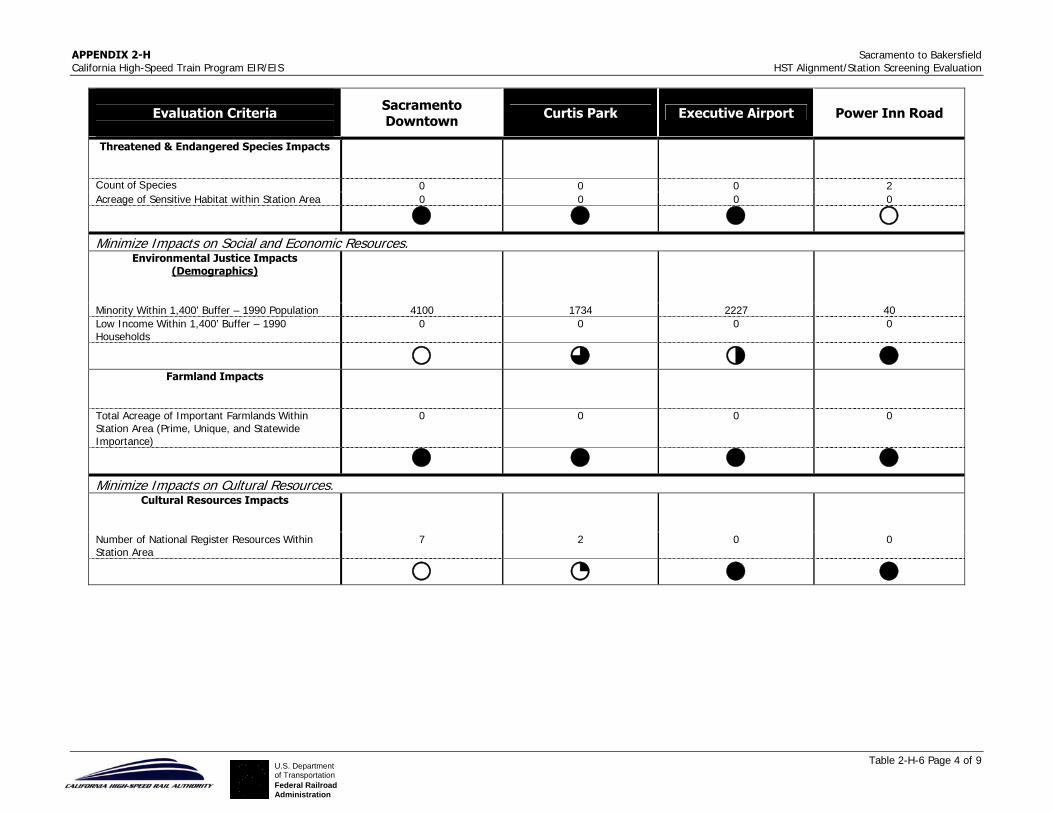
APPENDIX 2-H Sacramento to Bakersfield California High-Speed Train Program EIR/EIS HST Alignment/Station Screening Evaluation
Table 2-H-6 Page 4 of 9 U.S. Departmentof TransportationFederal RailroadAdministration
Evaluation Criteria
Sacramento Downtown Curtis Park Executive Airport Power Inn Road
Threatened & Endangered Species Impacts
Count of Species 0 0 0 2 Acreage of Sensitive Habitat within Station Area 0 0 0 0 5 5 5 1 Minimize Impacts on Social and Economic Resources.
Environmental Justice Impacts (Demographics)
Minority Within 1,400’ Buffer – 1990 Population 4100 1734 2227 40 Low Income Within 1,400’ Buffer – 1990 Households
0 0 0 0
1 4 3 5
Farmland Impacts
Total Acreage of Important Farmlands Within Station Area (Prime, Unique, and Statewide Importance)
0 0 0 0
5 5 5 5 Minimize Impacts on Cultural Resources.
Cultural Resources Impacts
Number of National Register Resources Within Station Area
7 2 0 0
1 2 5 5

APPENDIX 2-H Sacramento to Bakersfield California High-Speed Train Program EIR/EIS HST Alignment/Station Screening Evaluation
Table 2-H-6 Page 5 of 9 U.S. Departmentof TransportationFederal RailroadAdministration
Evaluation Criteria
Sacramento Downtown Curtis Park Executive Airport Power Inn Road
Parks & Recreation/Wildlife Refuge Impacts
Count of Parks/Recreation Areas 1 8 0 10 Total Acreage Parks/Recreation Areas in Station Area
0.01 20.67 0 0.05
4 1 5 2 Maximize Avoidance of Areas with Geologic and Soils Constraints.
Soils/Slope Constraints
Not a Distinguishing Factor
Seismic Constraints
Not a Distinguishing Factor
Maximize Avoidance of Areas with Potential Hazardous Materials. Hazardous Materials/Waste Constraints
Not a Distinguishing Factor
1 2 3 4 5
Least Favorable Most Favorable