hsm @lhy -puhujphs 9lwvy[ - indesit company - lem€¦ · net working capital 159.3 (10.0) ......
TRANSCRIPT
2014�/HSM�@LHY�-
PUHUJPHS�9LWVY[
^^ �̂PUKLZP[JVTWHU �̀JVT

1
2014 Half Year
Financial Report
2
Contents
Financial highlights for the first half of 2014 and the second
quarter of 2014 3
Interim report on operations 4
Introduction 4
Market trends 5
Currency movements 5
Consolidated results 6
Results by geographical segment 8
Cash flows 17
Balance Sheet 18
Financial position 19
Significant events during the first half of 2014 and subsequent to
period end 20
Reconciliation with the equity and results for the period of the
Parent 20
Intercompany and related party transactions, and significant,
atypical or unusual transactions 21
Corporate governance and ownership structure 21
Outlook for 2014 and forecast for operations 22
Company bodies 23
Interim condensed consolidated financial statements at 30 June
2014 24
Consolidated financial statements 25
Explanatory notes 31
Attachments 62
2014 Half Year Financial Report - Interim report on operations
3
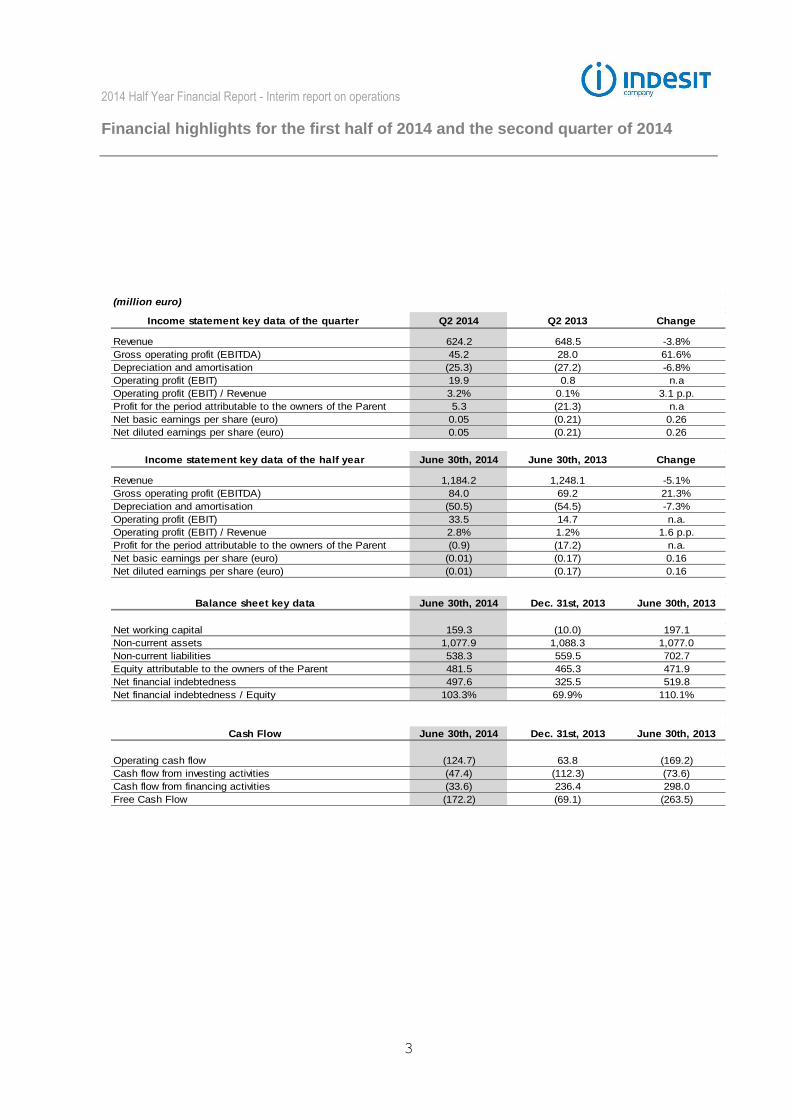
Financial highlights for the first half of 2014 and the second quarter of 2014
(million euro)
Income statement key data of the quarter Q2 2014 Q2 2013 Change
Revenue 624.2 648.5 -3.8%
Gross operating profit (EBITDA) 45.2 28.0 61.6%
Depreciation and amortisation (25.3) (27.2) -6.8%
Operating profit (EBIT) 19.9 0.8 n.a
Operating profit (EBIT) / Revenue 3.2% 0.1% 3.1 p.p.
Profit for the period attributable to the owners of the Parent 5.3 (21.3) n.a
Net basic earnings per share (euro) 0.05 (0.21) 0.26
Net diluted earnings per share (euro) 0.05 (0.21) 0.26
Income statement key data of the half year June 30th, 2014 June 30th, 2013 Change
Revenue 1,184.2 1,248.1 -5.1%
Gross operating profit (EBITDA) 84.0 69.2 21.3%
Depreciation and amortisation (50.5) (54.5) -7.3%
Operating profit (EBIT) 33.5 14.7 n.a.
Operating profit (EBIT) / Revenue 2.8% 1.2% 1.6 p.p.
Profit for the period attributable to the owners of the Parent (0.9) (17.2) n.a.
Net basic earnings per share (euro) (0.01) (0.17) 0.16
Net diluted earnings per share (euro) (0.01) (0.17) 0.16
Balance sheet key data June 30th, 2014 Dec. 31st, 2013 June 30th, 2013
Net working capital 159.3 (10.0) 197.1
Non-current assets 1,077.9 1,088.3 1,077.0
Non-current liabilities 538.3 559.5 702.7
Equity attributable to the owners of the Parent 481.5 465.3 471.9
Net financial indebtedness 497.6 325.5 519.8
Net financial indebtedness / Equity 103.3% 69.9% 110.1%
Cash Flow June 30th, 2014 Dec. 31st, 2013 June 30th, 2013
Operating cash flow (124.7) 63.8 (169.2)
Cash flow from investing activities (47.4) (112.3) (73.6)
Cash flow from financing activities (33.6) 236.4 298.0
Free Cash Flow (172.2) (69.1) (263.5)
2014 Half Year Financial Report - Interim report on operations
4
Introduction
The Half year financial report at 30 June 2014, prepared pursuant to para. 2 of Art. 154-ter of the Consolidated Finance Law, comprises this interim report on operations, the condensed interim consolidated financial statements and the statement required by para. 5 of Art. 154-bis of the Consolidated Finance Law. The condensed interim consolidated financial statements, prepared in accordance with International Financial Reporting Standards (IFRS) and, more specifically, with IAS 34 – Interim Financial Reporting, have been subjected to a limited examination by Reconta Ernst & Young S.p.A. The consolidation principles and measurement criteria are consistent with those reported in the consolidated financial statements at 31 December 2013. All the amounts presented below are stated in millions of euro, and the comparisons made (in brackets) relate to information for the corresponding period in the prior year. Percentages (margins and changes) are determined with reference to amounts stated in thousands of euro. Totals are calculated with reference to amounts stated in euro. The Group reporting to Indesit Company S.p.A. is hereafter referred to as “Indesit Company” or "Indesit" or simply the “Group”; when the commentary relates to the parent company or individual subsidiaries, their names and legal form are stated in full. The amounts presented at constant exchange rates with respect to 2013 were estimated by taking account of the transaction effects and the effect of translating to euro (the Group's functional currency) the operations reported in foreign currency financial statements. Certain economic information presented below by the Group makes reference to intermediate indicators of profitability, such as EBITDA (gross operating profit). Management believes that this indicator is an important parameter for monitoring and measuring the Group's operating performance, since it is not influenced by the effects of differing criteria for the determination of taxable income, or by the related depreciation policies. Nevertheless, EBITDA is not identified as an accounting measure in the IFRS endorsed by the European Commission. Consequently, the criteria applied for determining this indicator might not be consistent with those adopted by other groups or companies and, accordingly, its value might not be comparable with that determined by them.
2014 Half Year Financial Report - Interim report on operations
5
Market trends
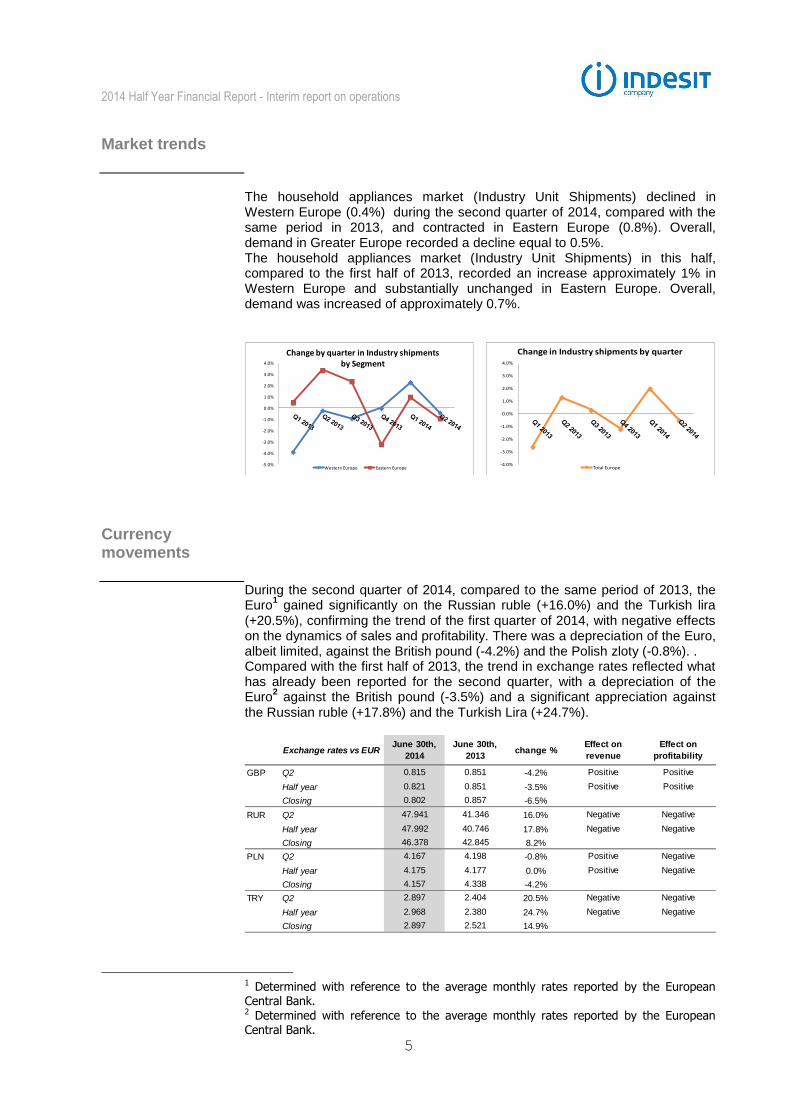
The household appliances market (Industry Unit Shipments) declined in Western Europe (0.4%) during the second quarter of 2014, compared with the same period in 2013, and contracted in Eastern Europe (0.8%). Overall, demand in Greater Europe recorded a decline equal to 0.5%. The household appliances market (Industry Unit Shipments) in this half, compared to the first half of 2013, recorded an increase approximately 1% in Western Europe and substantially unchanged in Eastern Europe. Overall, demand was increased of approximately 0.7%.
-5.0%
-4.0%
-3.0%
-2.0%
-1.0%
0.0%
1.0%
2.0%
3.0%
4.0%
Change by quarter in Industry shipments by Segment
Western Europe Eastern Europe
-4.0%
-3.0%
-2.0%
-1.0%
0.0%
1.0%
2.0%
3.0%
4.0%
Change in Industry shipments by quarter
Total Europe
Currency movements
During the second quarter of 2014, compared to the same period of 2013, the Euro
1 gained significantly on the Russian ruble (+16.0%) and the Turkish lira
(+20.5%), confirming the trend of the first quarter of 2014, with negative effects on the dynamics of sales and profitability. There was a depreciation of the Euro, albeit limited, against the British pound (-4.2%) and the Polish zloty (-0.8%). . Compared with the first half of 2013, the trend in exchange rates reflected what has already been reported for the second quarter, with a depreciation of the Euro
2 against the British pound (-3.5%) and a significant appreciation against
the Russian ruble (+17.8%) and the Turkish Lira (+24.7%).
GBP Q2 0.815 0.851 -4.2% Positive Positive
Half year 0.821 0.851 -3.5% Positive Positive
Closing 0.802 0.857 -6.5%
RUR Q2 47.941 41.346 16.0% Negative Negative
Half year 47.992 40.746 17.8% Negative Negative
Closing 46.378 42.845 8.2%
PLN Q2 4.167 4.198 -0.8% Positive Negative
Half year 4.175 4.177 0.0% Positive Negative
Closing 4.157 4.338 -4.2%
TRY Q2 2.897 2.404 20.5% Negative Negative
Half year 2.968 2.380 24.7% Negative Negative
Closing 2.897 2.521 14.9%
Exchange rates vs EUREffect on
profitability
Effect on
revenuechange %
June 30th,
2013
June 30th,
2014
1 Determined with reference to the average monthly rates reported by the European Central Bank. 2 Determined with reference to the average monthly rates reported by the European Central Bank.
2014 Half Year Financial Report - Interim report on operations
6
Consolidated results
Revenue
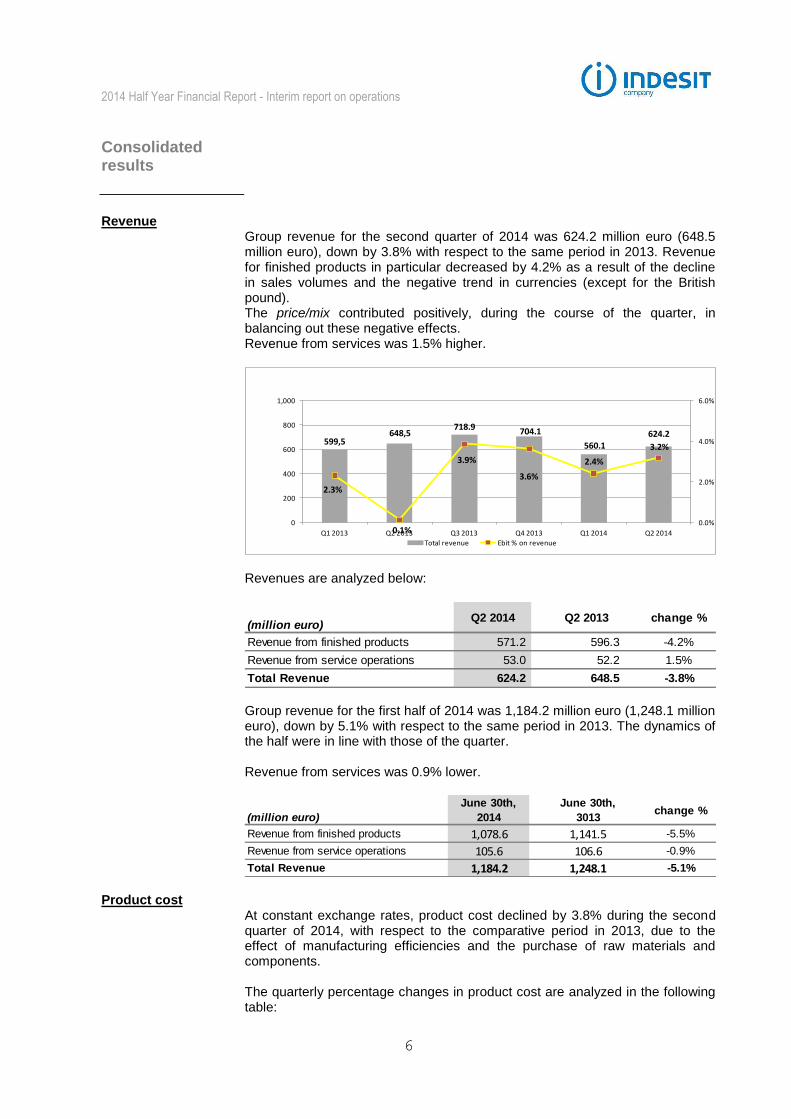
Group revenue for the second quarter of 2014 was 624.2 million euro (648.5 million euro), down by 3.8% with respect to the same period in 2013. Revenue for finished products in particular decreased by 4.2% as a result of the decline in sales volumes and the negative trend in currencies (except for the British pound). The price/mix contributed positively, during the course of the quarter, in balancing out these negative effects. Revenue from services was 1.5% higher.
599,5 648,5
718.9 704.1
560.1 624.2
2.3%
0.1%
3.9%
3.6%
2.4%
3.2%
0.0%
2.0%
4.0%
6.0%
0
200
400
600
800
1,000
Q1 2013 Q2 2013 Q3 2013 Q4 2013 Q1 2014 Q2 2014
Total revenue Ebit % on revenue
Revenues are analyzed below:
(million euro)Q2 2014 Q2 2013 change %
Revenue from finished products 571.2 596.3 -4.2%
Revenue from service operations 53.0 52.2 1.5%
Total Revenue 624.2 648.5 -3.8% Group revenue for the first half of 2014 was 1,184.2 million euro (1,248.1 million euro), down by 5.1% with respect to the same period in 2013. The dynamics of the half were in line with those of the quarter. Revenue from services was 0.9% lower.
(million euro)
June 30th,
2014
June 30th,
3013change %
Revenue from finished products 1,078.6 1,141.5 -5.5%
Revenue from service operations 105.6 106.6 -0.9%
Total Revenue 1,184.2 1,248.1 -5.1% Product cost
At constant exchange rates, product cost declined by 3.8% during the second quarter of 2014, with respect to the comparative period in 2013, due to the effect of manufacturing efficiencies and the purchase of raw materials and components. The quarterly percentage changes in product cost are analyzed in the following table:

2014 Half Year Financial Report - Interim report on operations
7
Q1 2013 Q2 2013 Q3 2013 Q4 2013 Q1 2014 Q2 2014
Sourcing cost 0.7% 0.4% -0.9% -0.2% -0.6% -2.3%
Manufacturing cost -2.0% -0.8% 0.0% 0.5% -1.8% -1.4%
Total product cost -1.3% -0.4% -0.9% 0.3% -2.5% -3.8% At constant exchange rates, product cost was 3.1% lower in the first half of 2014 than in the comparative period of 2013, as a result of savings in production and supply costs.
Other operating costs At current exchange rates, advertising and promotion expenses totaled 15.9 million euro in the second quarter of 2014 (13.9 million euro). At current exchange rates, advertising and promotion expenses totaled 21.5 million euro in the first half of 2014 (18.8 million euro).
4.8
13.913.0 12.6
5.5
15.9
0.0
2.0
4.0
6.0
8.0
10.0
12.0
14.0
16.0
18.0
Q1 2013 Q2 2013 Q3 2013 Q4 2013 Q1 2014 Q2 2014
Advertising and Promo
0.8%
2.1%1.8% 1.8%
1.0%
2.8%
0.0%
0.5%
1.0%
1.5%
2.0%
2.5%
3.0%
Q1 2013 Q2 2013 Q3 2013 Q4 2013 Q1 2014 Q2 2014
Advertising and Promo incidence on revenue
Operating profitability
EBIT, with reference both to the quarterly and to the Half yearly figures, reveals similar evolutionary dynamics. The significant improvement compared to 2013 is due to the considerable performance of the price/mix and the incessant activity of reducing the purchasing and production costs, in addition to the lesser impact of the recorded non-recurring net expenses compared to 2013. Negative effects on the operating margin were determined by the reduction in sales volumes in some significant markets for Indesit and by the unfavorable trend of the major currencies in which the Group operates. Operating profit (EBIT), gross of non-recurring items, is analyzed by quarter in the following chart:
12.3 13.0
29.6 29.0
13.920.8
2.0%
2.0%
4.1%4.1%
2.5%
3.7%
0
20
40
60
80
100
0.0%
2.0%
4.0%
6.0%
8.0%
10.0%
Q12013 Q2 2013 Q3 2013 Q4 2013 Q1 2014 Q2 2014
EBIT gross of non recurring items EBIT % gross of non recurring items
2014 Half Year Financial Report - Interim report on operations
8
Results by geographical segment
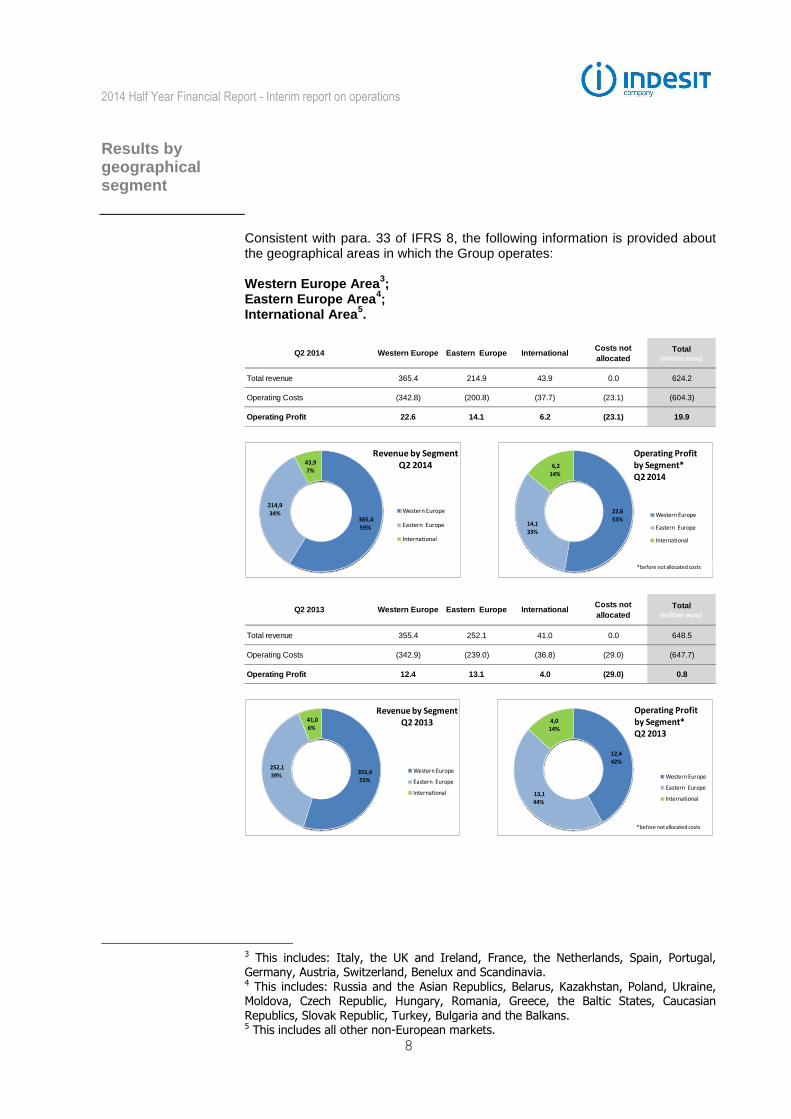
Consistent with para. 33 of IFRS 8, the following information is provided about the geographical areas in which the Group operates: Western Europe Area
3;
Eastern Europe Area4;
International Area5.
Q2 2014 Western Europe Eastern Europe InternationalCosts not
allocated
Total(million euro)
Total revenue 365.4 214.9 43.9 0.0 624.2
Operating Costs (342.8) (200.8) (37.7) (23.1) (604.3)
Operating Profit 22.6 14.1 6.2 (23.1) 19.9
365,4 59%
214,9
34%
43,9
7%
Revenue by Segment Q2 2014
Western Europe
Eastern Europe
International
22,653%
14,1
33%
6,214%
Operating Profit by Segment*Q2 2014
Western Europe
Eastern Europe
International
*before not allocated costs
Q2 2013 Western Europe Eastern Europe InternationalCosts not
allocated
Total(million euro)
Total revenue 355.4 252.1 41.0 0.0 648.5
Operating Costs (342.9) (239.0) (36.8) (29.0) (647.7)
Operating Profit 12.4 13.1 4.0 (29.0) 0.8
355,4
55%
252,1
39%
41,0 6%
Revenue by Segment Q2 2013
Western Europe
Eastern Europe
International
12,4
42%
13,144%
4,014%
Operating Profit by Segment*Q2 2013
Western Europe
Eastern Europe
International
*before not allocated costs
3 This includes: Italy, the UK and Ireland, France, the Netherlands, Spain, Portugal, Germany, Austria, Switzerland, Benelux and Scandinavia. 4 This includes: Russia and the Asian Republics, Belarus, Kazakhstan, Poland, Ukraine, Moldova, Czech Republic, Hungary, Romania, Greece, the Baltic States, Caucasian Republics, Slovak Republic, Turkey, Bulgaria and the Balkans. 5 This includes all other non-European markets.
2014 Half Year Financial Report - Interim report on operations
9
June 30th, 2014 Western Europe Eastern Europe InternationalCosts not
allocated
Total
(million euro)
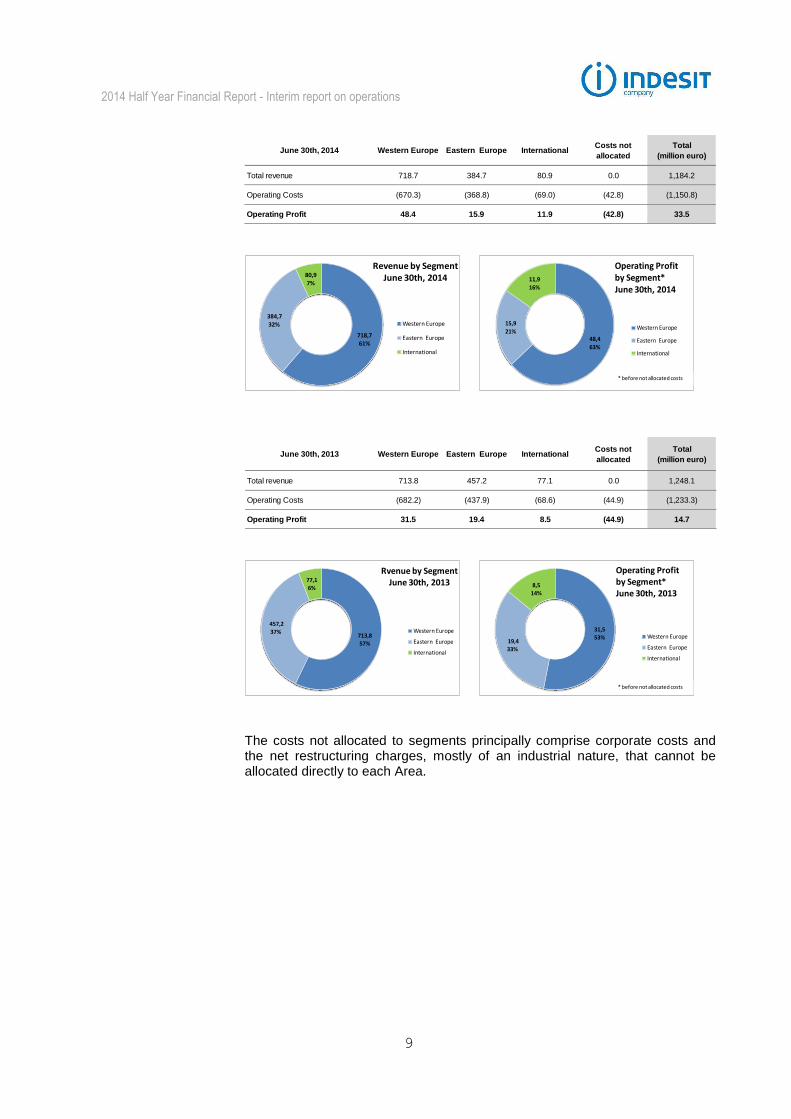
Total revenue 718.7 384.7 80.9 0.0 1,184.2
Operating Costs (670.3) (368.8) (69.0) (42.8) (1,150.8)
Operating Profit 48.4 15.9 11.9 (42.8) 33.5
718,7
61%
384,7 32%
80,97%
Revenue by SegmentJune 30th, 2014
Western Europe
Eastern Europe
International
48,463%
15,921%
11,9 16%
Operating Profit by Segment*June 30th, 2014
Western Europe
Eastern Europe
International
* before not allocated costs
June 30th, 2013 Western Europe Eastern Europe InternationalCosts not
allocated
Total
(million euro)
Total revenue 713.8 457.2 77.1 0.0 1,248.1
Operating Costs (682.2) (437.9) (68.6) (44.9) (1,233.3)
Operating Profit 31.5 19.4 8.5 (44.9) 14.7
713,8
57%
457,2
37%
77,1
6%
Rvenue by SegmentJune 30th, 2013
Western Europe
Eastern Europe
International
31,553%
19,4
33%
8,5 14%
Operating Profit by Segment*June 30th, 2013
Western Europe
Eastern Europe
International
* before not allocated costs
The costs not allocated to segments principally comprise corporate costs and the net restructuring charges, mostly of an industrial nature, that cannot be allocated directly to each Area.
2014 Half Year Financial Report - Interim report on operations
10
Western Europe Area
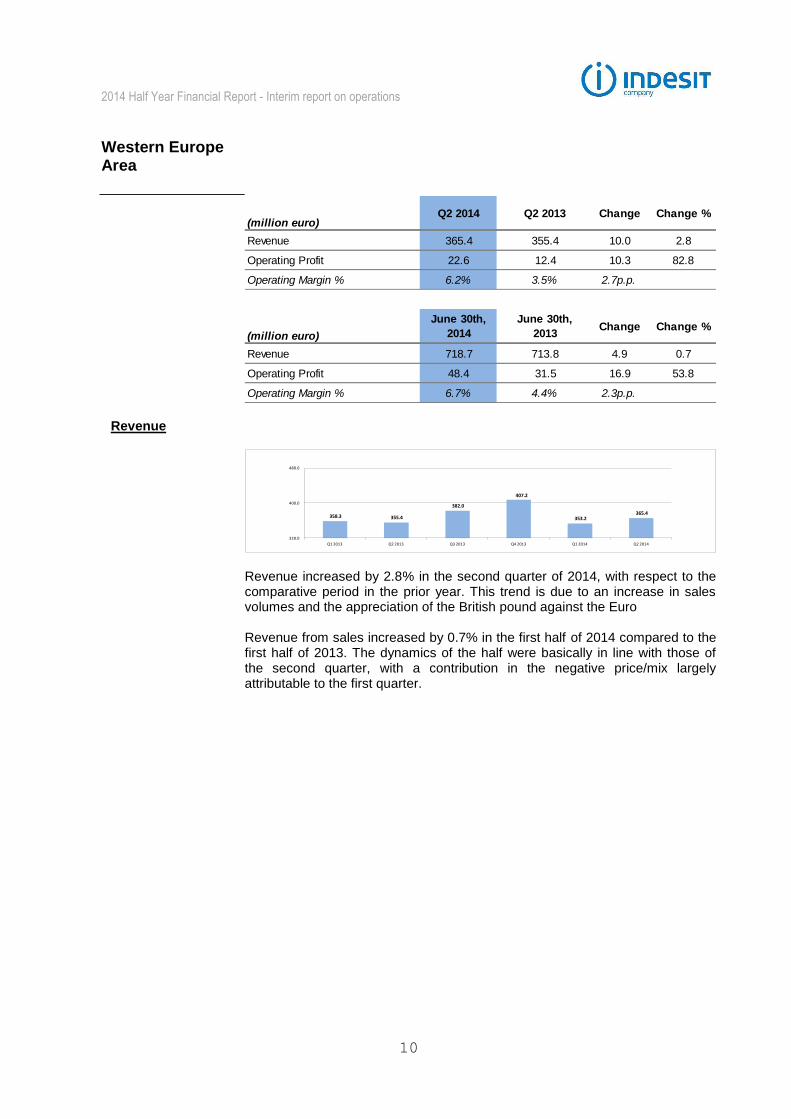
(million euro)Q2 2014 Q2 2013 Change Change %
Revenue 365.4 355.4 10.0 2.8
Operating Profit 22.6 12.4 10.3 82.8
Operating Margin % 6.2% 3.5% 2.7p.p.
(million euro)
June 30th,
2014
June 30th,
2013Change Change %
Revenue 718.7 713.8 4.9 0.7
Operating Profit 48.4 31.5 16.9 53.8
Operating Margin % 6.7% 4.4% 2.3p.p.
Revenue
358.3 355.4
382.0
407.2
353.2 365.4
320.0
400.0
480.0
Q1 2013 Q2 2013 Q3 2013 Q4 2013 Q1 2014 Q2 2014
Revenue increased by 2.8% in the second quarter of 2014, with respect to the comparative period in the prior year. This trend is due to an increase in sales volumes and the appreciation of the British pound against the Euro Revenue from sales increased by 0.7% in the first half of 2014 compared to the first half of 2013. The dynamics of the half were basically in line with those of the second quarter, with a contribution in the negative price/mix largely attributable to the first quarter.

2014 Half Year Financial Report - Interim report on operations
11
Profitability
19.1
12.4
18.5
30.6 25.7
22.6
5.3%
3.5%
4.9%
7.5% 7.3%
6.2%
0.0%
1.0%
2.0%
3.0%
4.0%
5.0%
6.0%
7.0%
8.0%
-
5.0
10.0
15.0
20.0
25.0
30.0
35.0
Q1 2013 Q2 2013 Q3 2013 Q4 2013 Q1 2014 Q2 2014Operating Profit
Operating Margin % Profitability in Western Europe in the second quarter of 2014 almost doubled compared with the same period in 2013. This result was helped by major savings in the costs of goods sold, in addition to the positive trend recorded by the British pound. Negative affects on the profitability of the Area were caused substantially by the price/mix. The profitability of the Area during the first half of 2014 was basically in line with that for the second quarter.
2014 Half Year Financial Report - Interim report on operations
12
Eastern Europe Area
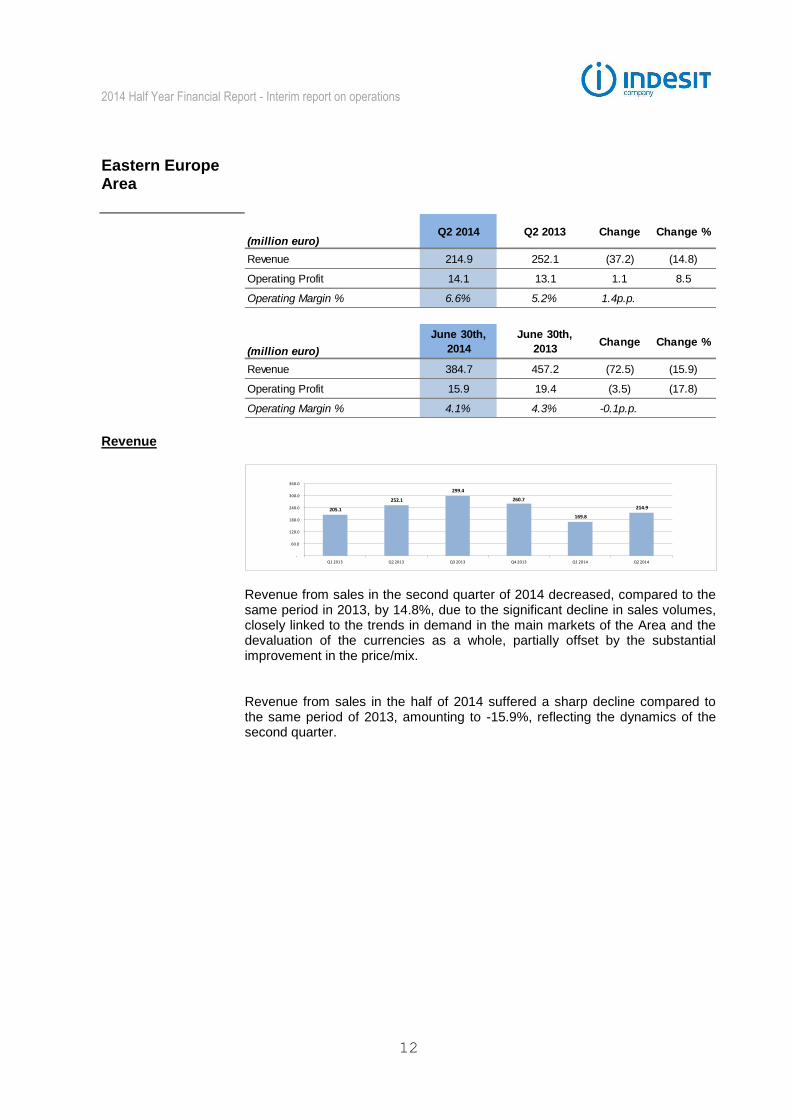
(million euro)Q2 2014 Q2 2013 Change Change %
Revenue 214.9 252.1 (37.2) (14.8)
Operating Profit 14.1 13.1 1.1 8.5
Operating Margin % 6.6% 5.2% 1.4p.p.
(million euro)
June 30th,
2014
June 30th,
2013Change Change %
Revenue 384.7 457.2 (72.5) (15.9)
Operating Profit 15.9 19.4 (3.5) (17.8)
Operating Margin % 4.1% 4.3% -0.1p.p. Revenue
205.1
252.1
299.4
260.7
169.8
214.9
-
60.0
120.0
180.0
240.0
300.0
360.0
Q1 2013 Q2 2013 Q3 2013 Q4 2013 Q1 2014 Q2 2014
Revenue from sales in the second quarter of 2014 decreased, compared to the same period in 2013, by 14.8%, due to the significant decline in sales volumes, closely linked to the trends in demand in the main markets of the Area and the devaluation of the currencies as a whole, partially offset by the substantial improvement in the price/mix. Revenue from sales in the half of 2014 suffered a sharp decline compared to the same period of 2013, amounting to -15.9%, reflecting the dynamics of the second quarter.

2014 Half Year Financial Report - Interim report on operations
13
Profitability
6.3
13.1
20,1
5,0 1.7
14.1
3.1%
5.2%
6.7%
1.9% 1.0%
6.6%
0.0%
1.0%
2.0%
3.0%
4.0%
5.0%
6.0%
7.0%
8.0%
-
5.0
10.0
15.0
20.0
25.0
Q1 2013 Q2 2013 Q3 2013 Q4 2013 Q1 2014 Q2 2014Operating Profit
Operating Margin % The operating profit generated by the Area in the second quarter of 2014 is basically in line, in absolute value, with the same period in 2013 and an improvement in percentage terms. Positive effects such as the improvement in the price/mix, savings in the cost of goods sold and lower non-recurring costs were offset by the negative effect caused by the currencies and by lower sales volumes. The operating profit generated by the Area in the half of 2014, compared to 2013, experienced a slight decrease in absolute value and is stable in percentage terms due to lower volumes while, as well as in the first quarter, the heavy negative currency effect was completely offset by a positive price mix.

2014 Half Year Financial Report - Interim report on operations
14
International Area
(million euro)Q2 2014 Q2 2013 Change Change %
Revenue 43.9 41.0 2.9 7.0
Operating Profit 6.2 4.0 2.2 53.3
Operating Margin % 14.1% 9.7% 4.4p.p.
(million euro)
June 30th,
2014
June 30th,
2013Change Change %
Revenue 80.9 77.1 3.8 4.9
Operating Profit 11.9 8.5 3.4 40.4
Operating Margin % 14.8% 11.1% 3.7p.p. Revenue
36.1 41.0
37.5 36.2 37.1
43.9
-
10.0
20.0
30.0
40.0
50.0
Q1 2013 Q2 2013 Q3 2013 Q4 2013 Q1 2014 Q2 2014
In the second quarter of 2014, revenues were broadly stable in absolute terms. The Area recorded a significant increase in sales volumes, offset by the negative impact of the currencies (in particular the Argentine Peso) and the price/mix. In the first half, revenues were up 4.9% compared to 2013, with the same factors present in the second quarter.
2014 Half Year Financial Report - Interim report on operations
15
Profitability
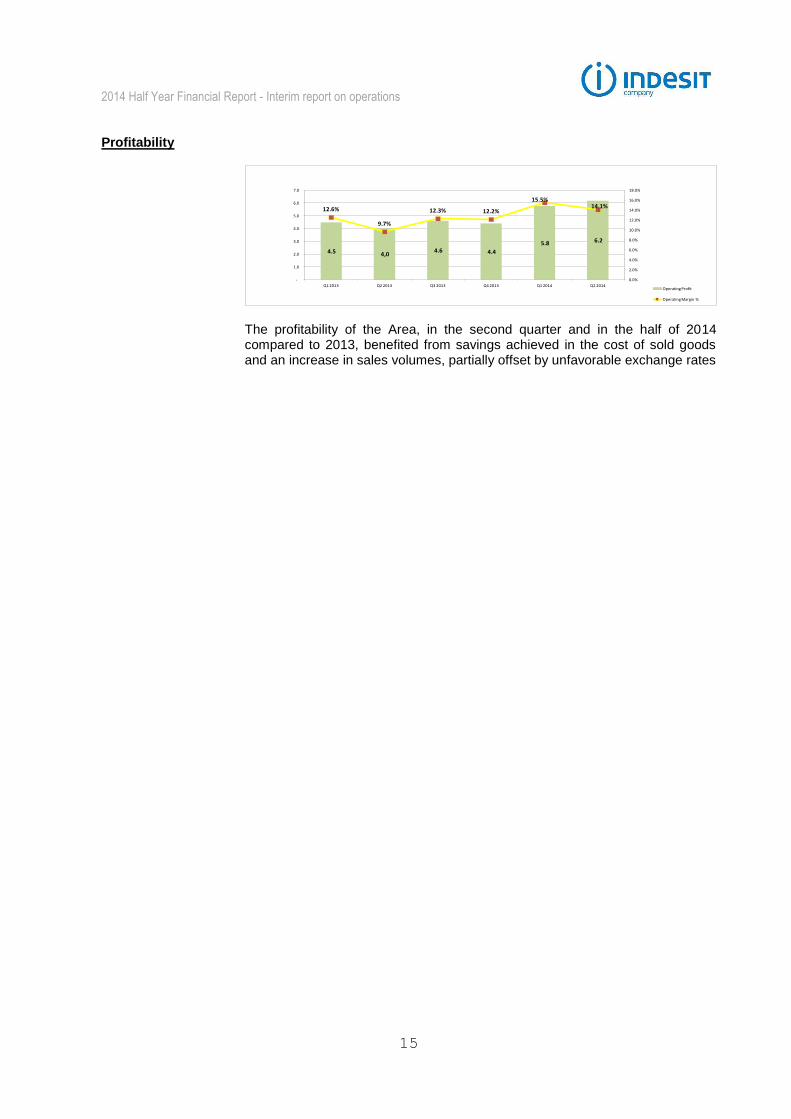
4.5 4,0 4.6 4.4
5.8 6.2
12.6%
9.7%
12.3% 12.2%
15.5%14.1%
0.0%
2.0%
4.0%
6.0%
8.0%
10.0%
12.0%
14.0%
16.0%
18.0%
-
1.0
2.0
3.0
4.0
5.0
6.0
7.0
Q1 2013 Q2 2013 Q3 2013 Q4 2013 Q1 2014 Q2 2014Operating Profit
Operating Margin % The profitability of the Area, in the second quarter and in the half of 2014 compared to 2013, benefited from savings achieved in the cost of sold goods and an increase in sales volumes, partially offset by unfavorable exchange rates
2014 Half Year Financial Report - Interim report on operations
16
Non-recurring items
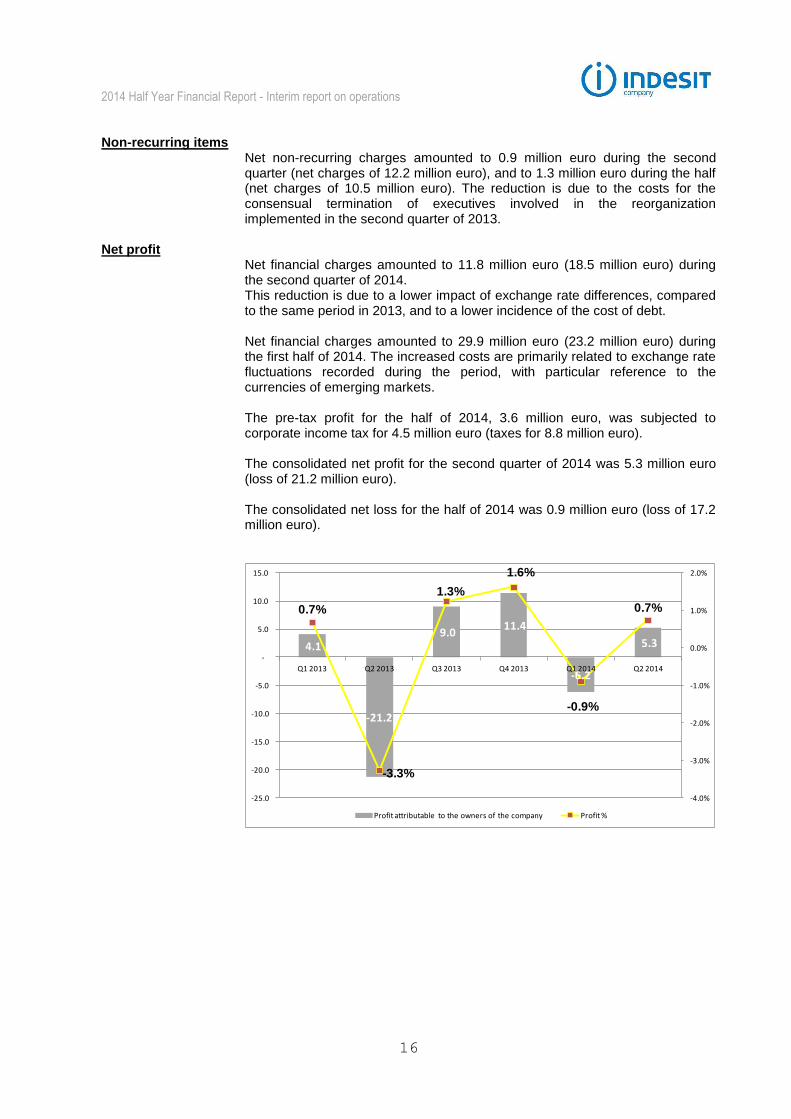
Net non-recurring charges amounted to 0.9 million euro during the second quarter (net charges of 12.2 million euro), and to 1.3 million euro during the half (net charges of 10.5 million euro). The reduction is due to the costs for the consensual termination of executives involved in the reorganization implemented in the second quarter of 2013.
Net profit Net financial charges amounted to 11.8 million euro (18.5 million euro) during the second quarter of 2014. This reduction is due to a lower impact of exchange rate differences, compared to the same period in 2013, and to a lower incidence of the cost of debt. Net financial charges amounted to 29.9 million euro (23.2 million euro) during the first half of 2014. The increased costs are primarily related to exchange rate fluctuations recorded during the period, with particular reference to the currencies of emerging markets. The pre-tax profit for the half of 2014, 3.6 million euro, was subjected to corporate income tax for 4.5 million euro (taxes for 8.8 million euro). The consolidated net profit for the second quarter of 2014 was 5.3 million euro (loss of 21.2 million euro). The consolidated net loss for the half of 2014 was 0.9 million euro (loss of 17.2 million euro).
4.1
-21.2
9.0 11.4
-6.2
5.3
0.7%
-3.3%
1.3%
1.6%
-0.9%
0.7%
-4.0%
-3.0%
-2.0%
-1.0%
0.0%
1.0%
2.0%
-25.0
-20.0
-15.0
-10.0
-5.0
-
5.0
10.0
15.0
Q1 2013 Q2 2013 Q3 2013 Q4 2013 Q1 2014 Q2 2014
Profit attributable to the owners of the company Profit %
2014 Half Year Financial Report - Interim report on operations
17
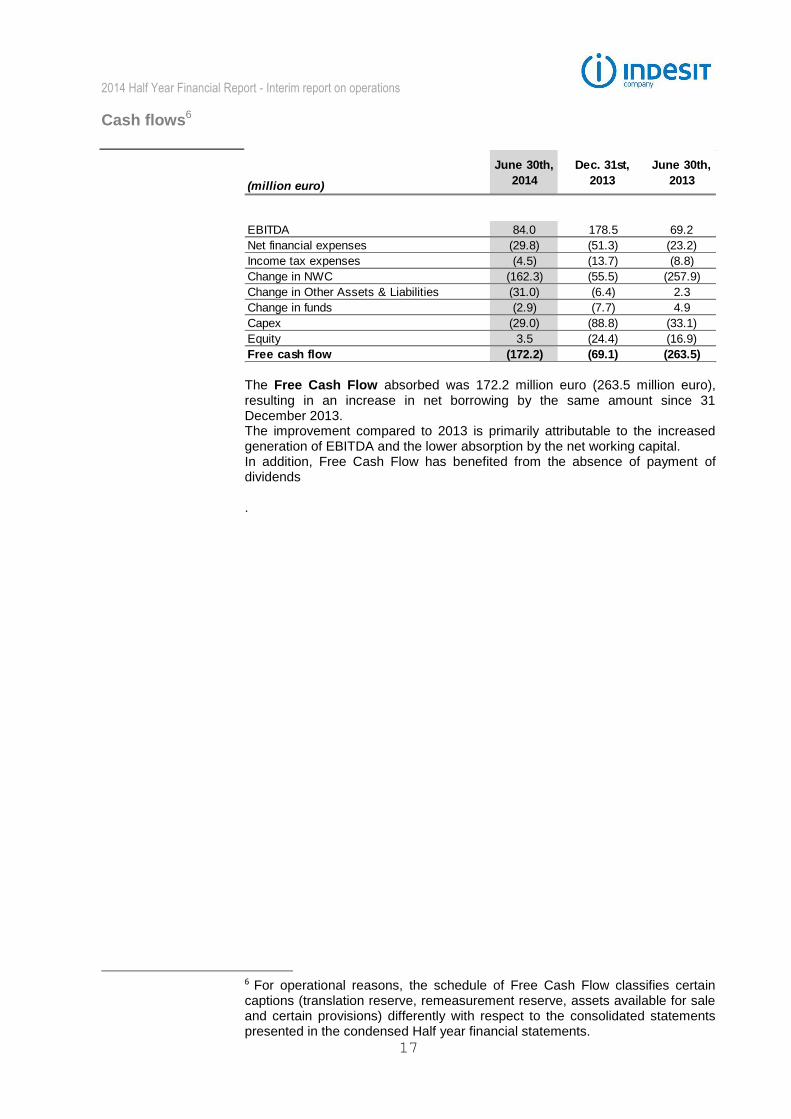
Cash flows6
(million euro)
June 30th,
2014
Dec. 31st,
2013
June 30th,
2013
EBITDA 84.0 178.5 69.2
Net financial expenses (29.8) (51.3) (23.2)
Income tax expenses (4.5) (13.7) (8.8)
Change in NWC (162.3) (55.5) (257.9)
Change in Other Assets & Liabilities (31.0) (6.4) 2.3
Change in funds (2.9) (7.7) 4.9
Capex (29.0) (88.8) (33.1)
Equity 3.5 (24.4) (16.9)
Free cash flow (172.2) (69.1) (263.5)
The Free Cash Flow absorbed was 172.2 million euro (263.5 million euro), resulting in an increase in net borrowing by the same amount since 31 December 2013. The improvement compared to 2013 is primarily attributable to the increased generation of EBITDA and the lower absorption by the net working capital. In addition, Free Cash Flow has benefited from the absence of payment of dividends .
6 For operational reasons, the schedule of Free Cash Flow classifies certain captions (translation reserve, remeasurement reserve, assets available for sale and certain provisions) differently with respect to the consolidated statements presented in the condensed Half year financial statements.

2014 Half Year Financial Report - Interim report on operations
18
Balance sheet7
(million euro)
June 30th,
2014
Dec. 31st,
2013
June 30th,
2013
Trade receivables 490.2 426.5 529.2
Inventories 378.4 302.4 403.0
Trade payables (709.2) (738.9) (735.1)
Net working capital 159.3 (10.0) 197.1
Non-current assets 940.2 954.2 956.3
Other current assets and liabilities and non-current liabilities (120.5) (153.4) (161.7)
Net invested capital 979.1 790.7 991.7
Net financial indebtedness 497.6 325.5 519.8
Equity attributable to the owners of the Parent 481.5 465.3 471.9
Non-controlling interests 0.0 0.0 0.0
Equity and financial liabilities 979.1 790.7 991.7 The decrease in net working capital since 30 June 2013 mainly reflects the improvement in the credit rating and efficient inventory management. Certain trade receivables in the UK and Poland have been sold without recourse. The amounts sold but not collected at 30 June 2014 total 28.4 million euro.
(% on revenue)
June 30th,
2014
Dec. 31st,
2013
June 30th,
2013
Trade receivables 18.8% 16.0% 18.7%
Inventories 14.5% 11.3% 14.2%
Trade payables 27.2% 27.7% 26.0%
Net working capital 6.1% -0.4% 7.0% The Shareholders' equity attributable to the shareholders of the parent company increased compared to 31 December 2013 by 16.2 million euro in particular due to the positive effect of the currency conversion and the positive trend of the Cash Flow Hedge reserve.
7 The trade receivables and payables, inventories and equity reported in the above reclassified statement of financial position are the same as the amounts reported in the consolidated statement of financial position. Net financial indebtedness is analyzed in the
following table. “Non-current assets” and “Other current assets and liabilities and non-
current liabilities” comprise the captions of the consolidated statement of financial
position that are not mentioned above or included as part of net financial indebtedness.

2014 Half Year Financial Report - Interim report on operations
19
Financial position
(million euro)
June 30th,
2014
Dec. 31st,
2013
June 30th,
2013
Current financial assets 11.0 17.9 31.2
Cash and cash equivalents 125.0 330.8 197.9
Banks and other financial payables (294.8) (307.4) (232.5)
Net financial indebtedness position - short term (158.8) 41.3 (3.3)
Medium/long-term financial payables (340.8) (368.6) (518.4)
Net financial position (*) (499.6) (327.4) (521.7)
Other non-current financial assets 2.0 1.9 1.9
Net financial indebtedness (497.6) (325.5) (519.8)
(*) As defined in CONSOB Communication DEM /6064293 dated 28 July 2006, applying the CESR recommendations dated 10 February
2005
Net financial indebtedness amounts to 497.6 million euro (519.8 million euro). Gross financial indebtedness totals 635.6 million euro (750.8 million euro), of which 53.6% is classified as long term (69.0% at 30 June 2013). The maturity profile of gross long-term financial payables is presented below:
2015 2016 2017 2018 TOTAL
EUROBOND 296.8 0.0 0.0 0.0 296.8 296.8
DUE TO BANKS AND OTHER FINANCIAL PAYABLES 44.0 6.1 12.5 12.8 12.8 44.0
Total 340.8 6.1 12.5 12.8 309.5 340.8
Medium/long-term
financial payables

2014 Half Year Financial Report - Interim report on operations
20
Significant events during the first half of 2014 and subsequent to period end
Starting from 1/1/2014 the Group as a result of the revision of the invoice flows and the evolution of functional and risk profiles of the various companies of the group, has adopted a new transfer pricing policy to adjust intercompany transactions and ensure that these continue to be regulated at market conditions, ie conditions similar to those offered to non-related parties. In June 2014 the Group repaid the bond (USPP) in full and in advance, including the installments due in September 2014 and in September 2016, for an amount of approx. 145 million euro. On 10 July 2014, Whirlpool Corporation and Fineldo S.p.A. (a holding company whose holdings include a controlling stake in Indesit Company SpA) announced that they had signed an agreement for the sale of the stake held by Fineldo in Indesit Company SpA. Whirlpool Corporation also signed further agreements with some members of the Merloni family for the purchase of the shares they held in Indesit. Under these agreements, Whirlpool would acquire a total number of shares representing 66.8% of the voting rights. The acquisition of the control of Indesit is subject to the authorization of the Court of Ancona and the antitrust authorities and is expected to be concluded by the end of 2014. At present, and based on the information available to the Board of Directors such agreements do not produce effects that should be reflected in the financial and economic situation of the Indesit Group as at 30 June 2014. There have not been any other significant events subsequent to the end of the period.
Reconciliation with the equity and results for the period of the Parent
In accordance with Consob Communication DEM/6064293 dated 28 July 2006, the equity and results for the period of the parent company are reconciled below with the related consolidated amounts. (million euro)
Profit (Loss) Equity Profit (Loss) Equity
Financial statements of the parent company (12.1) 482.7 2.3 489.9
Consolidated adjustments
Difference between carrying amount and equity of group
companies17.2 14.0 13.3 (3.0)
Dividends received from subsidiaries 0.0 0.0 (30.0) -
Effect of aligning separate financial statements with group 1.2 4.3 2.4 5.3
Elimination of intercompany profits (6.5) (18.0) (1.3) (15.3)
Other effects (0.7) (1.5) (3.9) (5.0)
Total consolidation adjustments 11.2 (1.2) (19.5) (18.0)
Consolidated financial statements (0.9) 481.5 (17.2) 471.9
June 30th, 2014 June 30th, 2013

2014 Half Year Financial Report - Interim report on operations
21
Intercompany and related party transactions, and significant, atypical or unusual transactions
Transactions between Group companies are settled on arms'-length terms, having regard for the quality of the goods and services provided. The notes to the condensed interim consolidated financial statements describe the nature of the principal transactions arranged by the parent and other Group companies with related parties. They also contain the detailed information required by Consob regulations and IAS 24. Pursuant to Consob regulations
8, Attachments
3 and 4 to the condensed interim consolidated financial statements present the consolidated income statement and statement of financial position, showing non-recurring items and transactions with related parties separately, together with their percentage incidence with respect to each account caption. Starting from 1 January 2014, the Group's intercompany transfer prices are determined using the Transactional Net Margin Method (TNMM), as required by the regulations, normal practice in Italy and the OECD Guidelines (or Directives). This method was applied using as an indicator of profit, the producers of the Group, the ratio of operating profit and total costs, and for the Group's distributors, the ratio of operating profit and sales revenues. Transactions with related parties are not significant to the economic and financial position of the Group. There were no unusual or non-business transactions during the first half of 2014.
Corporate governance and ownership structure
The system of Corporate Governance adopted by Indesit Company S.p.A. is essentially consistent with the principles established in the Code of Conduct for Listed Companies (the Code) and with international best practice. On 21 March 2014, the Board of Directors approved the 2013 Annual report on corporate governance and the ownership structure, prepared pursuant to art. 123-bis of the consolidated law on financial intermediation (TUIF). This report is published on the Company's website in the “Company” section, sub-section “Governance”
9. Reference is made to this report for the disclosures
required by law. Indesit Company S.p.A. has adopted the ordinary model of administration and control (envisaged under Italian law), with the presence of a Shareholders'
8 Consob Decision 15519 dated 27 July 2006 and Consob Communication DEM/6064293 dated 28 July 2006.
9 At the address http://www.indesitcompany.com/inst/en/vision/corporate_governance/cGHome.action
2014 Half Year Financial Report - Interim report on operations
22
Meeting, a Board of Directors, a Board of Statutory Auditors and Independent Auditors. The directors and officers are appointed at the Shareholders' Meeting and remain in office for a period of three years. The significant presence of Independent Directors, as defined in the Code, and the important role they play on both the Board and Board Committees (Human Resources Committee, Audit Committee, Strategic Development Committee and Related-party transactions Committee), ensures that the interests of all shareholders are appropriately balanced and guarantees a high level of discussion at Board meetings.
Outlook for 2014 and forecast for operations
Although during the first half of the year, the Euro has appreciated significantly against the Russian ruble, Hryvna and Turkish lira, the actions of selective increase in prices should allow Indesit undertaken to achieve, in the current year, a level of sales in line with 2013. The Group, in the light of the above the activity of containment of production costs, is estimated to achieve an operating profit (Operating Margin net of non recurring items and EBIT adjusted), which stands at around 3.5%. Milan, 30 July 2014 for the Board of Directors The Chairman Marco Milani
2014 Half Year Financial Report - Interim report on operations
23
Chairman
Chief Executive Officer and General
Director
Directors Luigi Abete
Paolo Amato
Franca Carloni
Guido Corbetta
Andrea Merloni
Antonella Merloni
Aristide Merloni
Maria Paola Merloni
Libero Milone
Paolo Monferino
Board of Statutory Auditors
Chairman Graziano Visentin
Auditors Rosalba Casiraghi
Francesco Di Carlo
Alternate Auditors Paola Spoldi
Guido Cesarini
Gianpaolo Davide Rossetti
Human Resources Committee
Guido Corbetta (Chairman)
Andrea Merloni
Maria Paola Merloni
Libero Milone
Paolo Monferino
Control and Risk Committee
Libero Milone (Chairman)
Luigi Abete
Paolo Amato
Antonella Merloni
Aristide Merloni
Reconta Ernst & Young S.p.A.
Stefano Cavacini
Manager charged with preparing the company's financial reports
Board of Directors
Marco Milani
Indipendent Auditors

2014 Half Year Financial Report - Interim report on operations
24
Interim condensed consolidated
financial statements at 30 June 2014
2014 Half Year Financial Report - Interim report on operations
25
Consolidated financial statements

2014 Half Year Financial Report - Consolidated financial statements
26
Consolidated income statement for the first half of 201410
(million euro) NoteJune 30th,
2014
June 30th,
2013
Revenue 8.1 1,184.2 1,248.1
Cost of sales 8.2 (893.2) (954.0)
Selling and distribution expenses 8.3 (209.3) (218.4)
General and administrative expenses 8.4 (48.3) (60.9)
Operating profit 8.5 33.5 14.7
Net interest (12.8) (12.7)
Exchange rate 8.6 (14.9) (8.2)
Fees and other net financial expenses 8.6 (2.2) (2.3)
Share of profit (losses) of associates and other 8.6 0.0 0.0
Profit before tax 3.6 (8.4)
Income taxes 8.7 (4.5) (8.8)
Profit for the year (0.9) (17.2)
Attributable to non-controlling interests 0.0 (0.0)
Attributable to the owners of the Parent (0.9) (17.2)
Basic earnings per share (euro) 8.14 (0.01) (0.17)
Diluted earnings per share (euro) 8.14 (0.01) (0.17)
10
Pursuant to Consob Resolution no. 15519 dated 27 July 2006, the effects of related-party and non-recurring
transactions on the consolidated income statement are reported in Attachment 3 and in notes 8.5 and 10, respectively.

2014 Half Year Financial Report - Consolidated financial statements
27
Consolidated Statement of Comprehensive Income for the first half of 2014
(million euro)
Note June 30th, 2014 June 30th, 2013
Profit (loss) for the year (A) (0.9) (17.2)
Effects with possible future impact on the income statement 18.1 (51.0)
Profit / (loss) on the cash flow hedge 8.14 4.6 5.0
Tax effect 8.14 (1.0) (1.3)
Total profit / (loss) on the cash flow hedge 8.14 3.5 3.7
Total profit / (loss) arising from the translation of foreign operations 8.14 14.6 (54.6)
Effects that do not have future impact on the income statement (0.9) 2.2
Profit / (loss) from the effects of remeasurement 8.14 (1.4) 3.3
Tax effect 8.14 0.5 (1.1)
Total profit / (loss) from the effects of remeasurement 8.14 (0.9) 2.2
Total other comprehensive income/(loss), net of tax (B) 17.2 (48.8)
Total comprehensive income/(loss) (A+B) 16.2 (66.0)
Attributable to non-controlling interests (0.0) 0.0
Attributable to owners of the Parent 16.2 (66.0)

2014 Half Year Financial Report - Consolidated financial statements
28
Consolidated balance sheet as of 30 June 201411
(million euro) Note June 30th, 2014 Dec. 31st, 2013 June 30th, 2013
Assets
Property, plant and equipment 8.8 594.6 615.4 624.4
Goodwill and other intangible assets with an indefinite
useful life8.9 249.6 240.1 233.6
Other intangible assets with a finite useful life 8.10 96.0 98.7 98.3
Investments in associates 0.5 0.5 0.5
Other non-current assets 2.2 2.3 1.5
Deferred tax assets 133.0 129.5 116.8
Other non-current financial assets 8.15.5 2.0 1.9 1.9
Total non-current assets 1,077.9 1,088.3 1,077.0
Inventories 8.11 378.4 302.4 403.0
Trade receivables 8.12 490.2 426.5 529.2
Current financial assets 8.15.1 11.0 17.9 31.2
Tax receivables 17.5 14.1 14.8
Other receivables and current assets 8.13 87.2 63.2 75.1
Cash and cash equivalents 8.15.2 125.0 330.8 197.9
Assets held for sale - 2.1 2.9
Total current assets 1,109.2 1,157.0 1,254.1
Total assets 2,187.1 2,245.4 2,331.2
Equity
Share capital 8.14 92.9 92.8 92.8
Reserves 8.14 (173.8) (190.9) (162.6)
Retained earnings 8.14 563.4 560.2 558.9
Profit attributable to owners of the Parent 8.14 (0.9) 3.2 (17.2)
Equity attributable to owners of the Parent 481.5 465.3 471.9
Non-controlling interests 0.0 0.0 0.0
Total equity 481.5 465.3 471.9
Liabilities
Medium and long-term loans and borrowings 8.15.4 340.8 368.6 518.4
Employee benefits 8.16 79.5 81.0 72.3
Provisions for risks and charges 8.17 59.0 56.7 54.8
Deferred tax liabilities 41.1 30.5 32.3
Other non-current liabilities 8.18 17.8 22.6 24.9
Total non-current liabilities 538.3 559.5 702.7
Banks and other short-term loans and borrowings 8.15.3 294.8 307.4 232.5
Provisions for risks and charges 8.17 48.8 52.3 52.7
Trade payables 709.2 738.9 735.1
Tax payables 10.5 25.3 23.7
Other payables 8.19 104.1 96.8 112.6
Total current liabilities 1,167.4 1,220.6 1,156.6
Total liabilities 1,705.7 1,780.1 1,859.2
Total equity and liabilities 2,187.1 2,245.4 2,331.2
11
Pursuant to Consob Resolution no. 15519 dated 27 July 2006, the effects of related-party transactions on the
separate statement of financial position are reported in Attachment 4 and in note 10.

2014 Half Year Financial Report - Consolidated financial statements
29
Consolidated Cash Flow Statement for the period ended 30 June 201412
(million euro) Note June 30th, 2014 Dec. 31st, 2013 June 30th, 2013
Profit for the year 8.20 (0.9) 3.2 (17.2)
Income taxes 8.20 4.5 13.7 8.8
Depreciation and amortisation 8.20 50.5 110.3 54.5
Other non-monetary income and expenses, net 8.21 27.2 10.7 18.5
Change in trade receivables 8.22 (63.7) 38.8 (63.9)
Change in inventories 8.22 (76.0) 29.4 (71.2)
Change in trade payables 8.22 (11.3) (81.8) (68.6)
Change in other assets and liabilities 8.23 (21.7) (26.9) (11.4)
Taxes paid 8.20 (12.1) (18.4) (10.6)
Interest paid 8.21 (32.9) (27.7) (14.2)
Interest received 8.21 11.5 12.5 6.1
Cash flows from/(used in) operating activities (124.7) 63.8 (169.2)
Acquisition of property, plant and equipment 8.24 (34.6) (82.7) (61.2)
Proceeds from sale of property, plant and equipment 8.24 0.1 1.4 1.3
Acquisition of intangible assets 8.25 (12.9) (31.0) (14.1)
Proceeds from sale of intangible assets 8.25 0.0 0.0 0.5
Cash flows from/(used in) investing activities (47.4) (112.3) (73.6)
Increase in share capital - - -
Dividends paid 8.26 (0.0) (20.6) (20.6)
New medium/long-term financial liabilities - - -
Repayments of medium/long-term financial liabilities and bond issue 8.27 (6.4) (14.1) (6.4)
Change in short, medium and long-term financial liabilities 8.28 (27.2) 271.1 324.9
Cash flows from/(used in) financing activities (33.6) 236.4 298.0
Net cash flows from/(used in) (205.7) 188.0 55.1
Cash and cash equivalents, start of year 8.15.2 330.8 142.8 142.8
Cash and cash equivalents, end of year 8.15.2 125.0 330.8 197.9
Total change in cash and cash equivalents (205.7) 188.0 55.1
12
Pursuant to Consob Resolution no. 15519 dated 27 July 2006, the financial effects of related-party transactions
are reported in note 10. In addition, the financial effects of non-recurring transactions are described in note 8.5.
2014 Half Year Financial Report - Consolidated financial statements
30
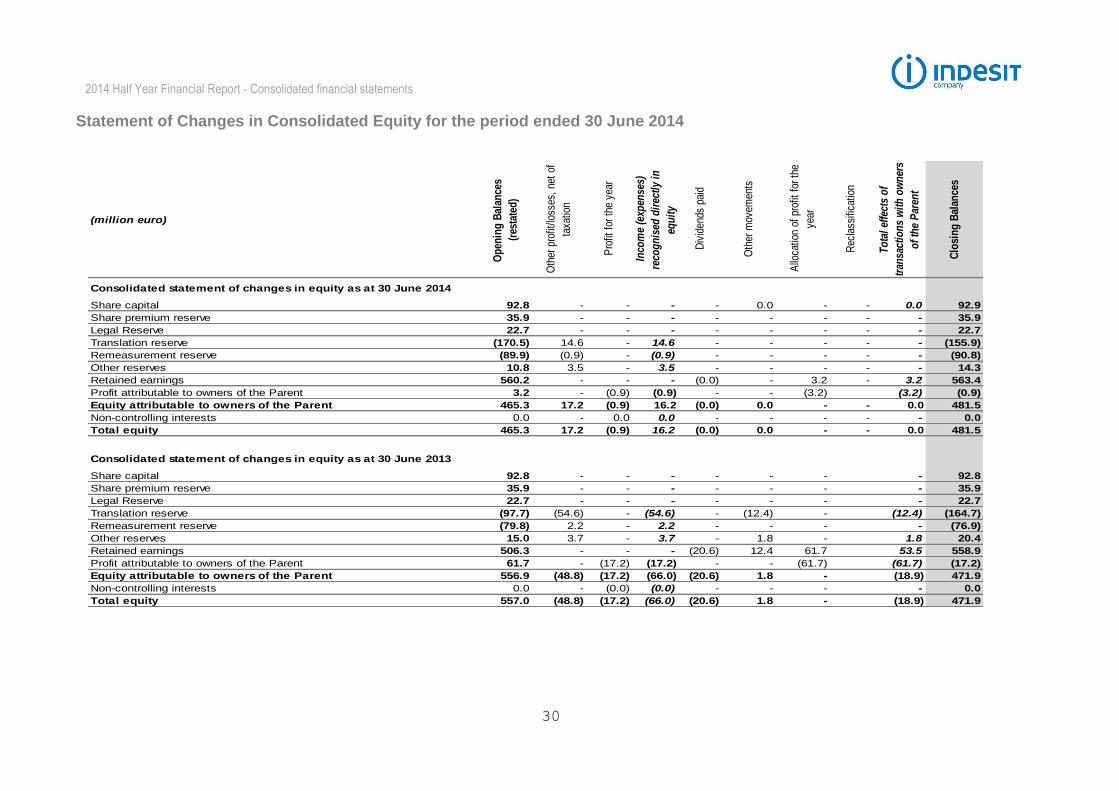
Statement of Changes in Consolidated Equity for the period ended 30 June 2014
(million euro)
Op
enin
g B
alan
ces
(res
tate
d)
Oth
er p
rofit
/loss
es,
net
of
taxa
tion
Pro
fit f
or t
he y
ear
Inco
me
(exp
ense
s)
reco
gn
ised
dir
ectl
y in
equ
ity
Div
iden
ds p
aid
Oth
er m
ovem
ents
Allo
catio
n of
pro
fit f
or t
he
year
Rec
lass
ifica
tion
To
tal
effe
cts
of
tran
sact
ion
s w
ith
ow
ner
s
of
the
Par
ent
Clo
sin
g B
alan
ces
Consolidated statement of changes in equity as at 30 June 2014
Share capital 92.8 - - - - 0.0 - - 0.0 92.9
Share premium reserve 35.9 - - - - - - - - 35.9
Legal Reserve 22.7 - - - - - - - - 22.7
Translation reserve (170.5) 14.6 - 14.6 - - - - - (155.9)
Remeasurement reserve (89.9) (0.9) - (0.9) - - - - - (90.8)
Other reserves 10.8 3.5 - 3.5 - - - - - 14.3
Retained earnings 560.2 - - - (0.0) - 3.2 - 3.2 563.4
Profit attributable to owners of the Parent 3.2 - (0.9) (0.9) - - (3.2) (3.2) (0.9)
Equity attributable to owners of the Parent 465.3 17.2 (0.9) 16.2 (0.0) 0.0 - - 0.0 481.5
Non-controlling interests 0.0 - 0.0 0.0 - - - - - 0.0
Total equity 465.3 17.2 (0.9) 16.2 (0.0) 0.0 - - 0.0 481.5
Consolidated statement of changes in equity as at 30 June 2013
Share capital 92.8 - - - - - - - 92.8
Share premium reserve 35.9 - - - - - - - 35.9
Legal Reserve 22.7 - - - - - - - 22.7
Translation reserve (97.7) (54.6) - (54.6) - (12.4) - (12.4) (164.7)
Remeasurement reserve (79.8) 2.2 - 2.2 - - - - (76.9)
Other reserves 15.0 3.7 - 3.7 - 1.8 - 1.8 20.4
Retained earnings 506.3 - - - (20.6) 12.4 61.7 53.5 558.9
Profit attributable to owners of the Parent 61.7 - (17.2) (17.2) - - (61.7) (61.7) (17.2)
Equity attributable to owners of the Parent 556.9 (48.8) (17.2) (66.0) (20.6) 1.8 - (18.9) 471.9
Non-controlling interests 0.0 - (0.0) (0.0) - - - - 0.0
Total equity 557.0 (48.8) (17.2) (66.0) (20.6) 1.8 - (18.9) 471.9

2014 Half Year Financial Report – Explanatory notes
31
Explanatory notes

2014 Half Year Financial Report – Explanatory notes
32
1. Group structure and activities
Indesit Company is a Group led by Indesit Company S.p.A., an Italian company based in Fabriano (Italy) that is listed on the Milan Stock Exchange. The Group is active in the production and sale of white goods, namely household appliances for the cooking sector (cookers, ovens and hobs), the cooling sector (refrigerators and freezers), and the washing sector (washing machines, combined washer-dryers, dryers and dishwashers). From 2013, the Group also sells small domestic appliances. Indesit identifies the Group as its sole operating segment pursuant to IFRS 8. Consistent with para. 33 of IFRS 8, information is provided about the geographical areas in which the Group operates. It should be noted that due to the cyclical nature of the Household Appliance sector, revenues and operating profit are higher in the second half of the year.
2. Approval of the consolidated Half year financial report at 30 June 2014
The consolidated Half year financial report at 30 June 2014 was approved by the Board of Directors on 30 July 2014. The attached condensed interim consolidated financial statements have been subjected to a limited examination by the auditing firm.
3. Declaration of compliance with international accounting standards and basis of presentation
These condensed interim consolidated financial statements have been prepared in compliance with IAS 34 and the requirements of art.154-ter of Decree 58 dated 24 February 1998 (Consolidated Finance Law) and subsequent amendments. They do not include all the information required for annual financial statements and should be read together with the consolidated financial statements as of 31 December 2013. In particular, the income statement, the statement of comprehensive income, the statement of financial position, the cash flow statement and the statement of changes in equity are presented in extended form, using the formats adopted for the consolidated financial statements at 31 December 2013. On the other hand, the following notes are presented in summary form and, accordingly, do not include all the information required for annual financial statements. In particular, as envisaged by IAS 34 in order to avoid repeating the information already published, the explanatory notes relate solely to those elements of the income statement, the statement of comprehensive income, the statement of financial position, the cash flow statement and the statement of changes in equity whose content or change, in terms of nature or amount or because unusual, must be known in order to understand the economic and financial position of the Group. The condensed interim consolidated financial statements at 30 June 2014 comprise the income statement, the statement of comprehensive income, the

2014 Half Year Financial Report – Explanatory notes
33
statement of financial position, the cash flow statement, the statement of changes in equity and these notes. The comparative figures presented in the statement of financial position and the cash flow statement include those at 30 June 2013 for the statement of financial position and at 31 December 2013 for the cash flow statement, together with those required by IAS 34 (31 December 2013 for the statement of financial position and 30 June 2013 for the cash flow statement). This decision was made to permit the consistent comparison of data that is significantly affected by the seasonality of the sector. The income statement presents figures for the first half of 2014 and the first half of 2013, since the Group has adopted the six-month period for interim reference purposes. The consolidated income statement is classified with reference to the reasons for which costs were incurred, the statement of financial position distinguishes between current and non-current assets and liabilities, the cash flow statement is presented using the indirect method, and the Statement of Changes in Equity format has been adopted. In addition, a separate consolidated statement of comprehensive income is presented. This statement comprises the various components forming the results for the period, together with the income and charges deriving from transactions not carried out with owners that were recognized directly in equity. The transactions carried out with owners are presented in the statement of changes in equity, together with the equity transactions reported in the statement of comprehensive income. The format adopted for the classification of the consolidated income statement was chosen to help the market understand more clearly the profitability of the Group; in particular, performance can be measured better with reference to the profit and cost centers used for the allocation of income and expenses. Additionally, this format assures the provision of precise segment information that is consistent with the way results are normally measured for management accounting purposes. This approach also ensures greater comparability with direct competitors and the multinationals operating in related sectors, since classification of the income statement by purpose is the format most widely used in international practice. In addition, the notes provide information on the nature of expenditure and the other disclosures necessary for the market, investors and all stakeholders. With reference to the calculation of taxes in interim financial statements, the Group uses the criterion of calculation according to the effective year to date as the best estimate of the actual annual taxation.
4. Accounting policies 4.1 Basis of preparation and accounting policies adopted
The consolidation principles and measurement criteria are consistent with those reported in the consolidated financial statements at 31 December 2013.
Basis of preparation The currency of presentation of the condensed interim consolidated financial statements is the euro, and the financial statement balances are expressed in millions of euro (except where stated otherwise). The condensed interim consolidated financial statements are prepared on an historical cost basis, except for derivative financial instruments, financial assets held for sale and financial instruments classified as available for sale, which are stated at their fair value. They also presume business continuity, which the Group believes to be reasonably certain. The accounting policies are applied on a consistent basis by all Group
2014 Half Year Financial Report – Explanatory notes
34
companies. There are no financial assets held to maturity. Financial transactions are recorded with reference to the trade date. The accounting policies adopted for the preparation of the condensed interim consolidated financial statements at 30 June 2014 have also been applied on a consistent basis to all the comparative financial information.
Accounting estimates
The preparation of the condensed interim consolidated financial statements involves making assumptions and estimates that affect the value of assets and liabilities and the related explanatory information, as well as the value of contingent assets and liabilities at the reporting date. These estimates are used to measure the property, plant and equipment and intangible assets subject to impairment, as well as to recognize provisions for doubtful accounts, inventory obsolescence, depreciation and amortization and the write-down of assets, employee benefits, taxation, and risks and charges. The estimates and underlying assumptions are based on historical experience and various other factors believed reasonable at the time. Estimates and assumptions are reviewed regularly and, if later estimates differ from those made initially, the effects - which obviously cannot be estimated or forecast at this time - are immediately reflected in the income statement. If the changes in estimate relate to both the current and future periods, their effects are reflected in the income statements for the periods concerned.
4.2 Amendments and revised accounting standards applied for the first time by the Group
Investment entities - Amendments to IFRS 10, IFRS 12 and IAS 27
These amendments provide an exception to the consolidation for entities that fall within the definition of investment entities pursuant to IFRS 10 - Consolidated Financial Statements. This exception to the consolidation requires that the investment entities evaluate subsidiaries at their fair value acknowledged in the income statement. These amendments have had no impact on the Group. Offsetting financial assets and financial liabilities - Amendments to IAS 32 These amendments clarify the meaning of "currently has a legally enforceable right to compensate" and the criterion of compensation in the case of settlement systems (such as central clearing houses) which apply non-simultaneous gross settlement mechanisms. These amendments have had no effect on the financial statements of the Group. Novation of derivatives and continuation of hedge accounting - Amendments to IAS 39 These amendments allow the continuation of hedge accounting when the novation of a hedge derivative meets certain criteria. These amendments have had no impact as the Group has not replaced its derivatives either in the current year or in prior years. IFRIC 21 Taxes IFRIC 21 is effective for annual periods beginning on or after 1 January 2014 and applies retrospectively. It is applicable to all payments imposed by law by the Government other than those already covered by other standards (eg IAS 12 income taxes) and those for fines or other penalties for breaches of the law. The interpretation clarifies that an entity recognizes a liability at the earliest

2014 Half Year Financial Report – Explanatory notes
35
upon occurrence of the event that is related to the payment, in accordance with applicable law. The interpretation also clarifies that the liability matures gradually only if the event to which the payment is related occurs over a period of time provided for by the law. For payments that are due only on exceeding a certain minimum threshold, the liability is recorded only on reaching this threshold. The interpretation requires these principles to be applied also to interim financial statements. Additional information on the recoverable value of non-financial assets - Amendments to IAS 36 These amendments remove the consequences inadvertently introduced by IFRS 13 about the disclosures required by IAS 36. Moreover, these changes require information on the recoverable amount of the asset or CGU to which was recognized during the year or "reversed" impairment (impairment losses).
5. Reclassifications
In 2013, the current and the non-current portions of the tax credits relating to the Polish Special Economic Zone (incentives for the construction of factories) have been reallocated among the deferred tax assets, with an according reclassification of the opening financial position. It should also be noted that, in order to provide a better economic representation, the costs of installation and the special consumption tax referring to the turkish market have been reclassified within the income statement. The increase in sales and cost of sales for the SCT, in relation to the first two quarters of 2013, respectively, equal to 1.4 million euro and 2.0 million euro. The decrease in cost of sales and the increase in selling and distribution expenses for the cost of installation, in relation to the first two quarters of 2013 amounted respectively to 0.5 million euro and 0.8 million euro.
6. Changes in the scope of consolidation
Except for the above, there were no other changes in the scope of consolidation during the first semester.

2014 Half Year Financial Report – Explanatory notes
36
7. Operating segments
Indesit Company identifies the Group as its sole operating segment. Consistent with IFRS 8 para. 33, the following information is provided about the geographical areas in which the Group operates: Western Europe Area
13;
Eastern Europe Area
14;
International Area
15.
Segment revenue is calculated based on the final destination of the products and segment results take account of all expenses that can be directly allocated to the geographical areas concerned. The costs not allocated to geographical areas include non-recurring industrial charges and corporate costs. Similarly, financial income and expenses and taxation are not allocated to the various geographical areas. Except for trade receivables, assets, liabilities and investments are not allocated to geographical areas and are examined by senior management on a combined basis. The trade receivables allocated to geographical areas and reviewed by the most senior decision makers comprise those deriving from the sale of finished products. They do not include receivables deriving from the provision of services (with the exception of UK service activities), advances to suppliers or the effects of any disposals of receivables. The following tables present the Group's operating information analyzed by geographical area based on the final destination of the products.
Analysis by operating segment at 30 June 2014
June 30th, 2014 Western Europe Eastern Europe InternationalCosts not
allocated
Total(million euro)
Total revenue 718.7 384.7 80.9 0.0 1,184.2
Cost of sales (525.6) (304.1) (60.5) (3.0) (893.2)
Selling and distribution expenses (129.6) (56.5) (7.8) (15.4) (209.3)
General and administrative expenses (15.0) (8.1) (0.7) (24.4) (48.3)
Operative costs (670.3) (368.8) (69.0) (42.8) (1,150.8)
Operating Profit 48.4 15.9 11.9 (42.8) 33.5
Interest expenses (12.8)
Interest income (14.9)
Exchange rate differences and other net financial expenses (2.2)
Share of profit (losses) of associates 0.0
Income taxes (4.5)
Profit attribuable to owners of the company (0.9)
13 This includes: Italy, the UK and Ireland, France, the Netherlands, Spain, Portugal, Germany, Austria, Switzerland, Benelux, Scandinavia. 14 This includes: Russia and the Asian Republics, Belarus, Kazakhstan, Poland, Ukraine, Moldova, Czech Republic,
Hungary, Romania, Greece, the Baltic States, Caucasian Republics, Slovak Republic, Turkey, Bulgaria and the Balkans.
15 This includes all other non-European markets.

2014 Half Year Financial Report – Explanatory notes
37
Analysis by operating segment at 30 June 2013
June 30th, 2013 Western Europe Eastern Europe InternationalCosts not
allocated
Total(million euro)
Total revenue 713.8 457.2 77.1 0.0 1,248.1
Cost of sales (539.6) (362.1) (58.2) 5.9 (954.0)
Selling and distribution expenses (127.1) (66.6) (9.5) (15.1) (218.4)
General and administrative expenses (15.5) (9.2) (0.6) (35.6) (60.9)
Operative costs (682.2) (437.9) (68.3) (44.9) (1,233.3)
Operating Profit 31.5 19.4 8.5 (44.9) 14.7
Interest expenses (12.7)
Interest income (8.2)
Exchange rate differences and other net financial expenses (2.3)
Share of profit (losses) of associates 0.0
Income taxes (8.8)
Profit attribuable to owners of the company (17.2)
Trade receivables analyzed by operating segment
(million euro)
June 30th, 2014
% of rolling
sales (12
months)
Dec. 31st, 2013
% of rolling
sales (12
months)June 30th, 2013
% of rolling
sales (12
months)
Western Europe 224.0 8.6% 218.5 8.2% 223.4 7.9%
Eastern Europe 197.0 7.6% 157.0 5.9% 217.9 7.7%
International 32.6 1.3% 19.0 0.7% 30.9 1.1%
Not allocated trade receivables 36.5 - 32.0 - 57.0 -
Total 490.2 18.8% 426.5 15.6% 529.2 18.7%
2014 Half Year Financial Report – Explanatory notes
38
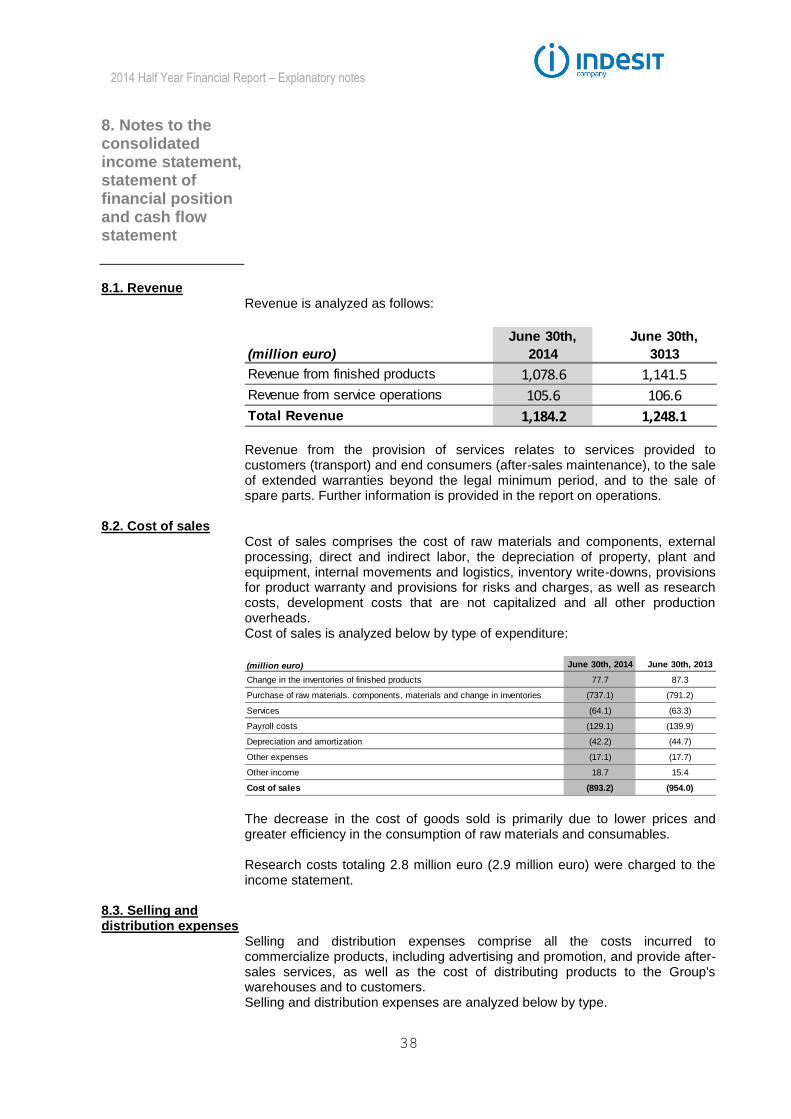
8. Notes to the consolidated income statement, statement of financial position and cash flow statement 8.1. Revenue
Revenue is analyzed as follows:
(million euro)
June 30th,
2014
June 30th,
3013
Revenue from finished products 1,078.6 1,141.5
Revenue from service operations 105.6 106.6
Total Revenue 1,184.2 1,248.1 Revenue from the provision of services relates to services provided to customers (transport) and end consumers (after-sales maintenance), to the sale of extended warranties beyond the legal minimum period, and to the sale of spare parts. Further information is provided in the report on operations.
8.2. Cost of sales Cost of sales comprises the cost of raw materials and components, external processing, direct and indirect labor, the depreciation of property, plant and equipment, internal movements and logistics, inventory write-downs, provisions for product warranty and provisions for risks and charges, as well as research costs, development costs that are not capitalized and all other production overheads. Cost of sales is analyzed below by type of expenditure:
(million euro) June 30th, 2014 June 30th, 2013
Change in the inventories of finished products 77.7 87.3
Purchase of raw materials. components, materials and change in inventories (737.1) (791.2)
Services (64.1) (63.3)
Payroll costs (129.1) (139.9)
Depreciation and amortization (42.2) (44.7)
Other expenses (17.1) (17.7)
Other income 18.7 15.4
Cost of sales (893.2) (954.0) The decrease in the cost of goods sold is primarily due to lower prices and greater efficiency in the consumption of raw materials and consumables. Research costs totaling 2.8 million euro (2.9 million euro) were charged to the income statement.
8.3. Selling and distribution expenses
Selling and distribution expenses comprise all the costs incurred to commercialize products, including advertising and promotion, and provide after-sales services, as well as the cost of distributing products to the Group's warehouses and to customers. Selling and distribution expenses are analyzed below by type.

2014 Half Year Financial Report – Explanatory notes
39
(million euro) June 30th, 2014 June 30th, 2013
Change in the inventories of finished products 0.4 (0.0)
Purchase of raw materials. components, materials and change in inventories (2.9) (3.1)
Services (141.7) (143.9)
Payroll costs (54.1) (56.6)
Depreciation and amortization (3.1) (3.7)
Other expenses (11.2) (12.8)
Other income 3.2 1.8
Selling and distribution expenses (209.3) (218.4)
Selling expenses decreased slightly during the half. 8.4. General and administrative expenses
General and administrative expenses include all general management and administrative costs, and all expenditure not directly attributable to production or sales units or to research and development. General and administrative expenses are analyzed below by type:
(million euro) June 30th, 2014 June 30th, 2013
Purchase of raw materials. components, materials and change in inventories (0.1) 0.0
Services (21.9) (22.7)
Payroll costs (24.5) (22.2)
Depreciation and amortization (5.3) (6.1)
Other expenses (5.2) (19.2)
Other income 8.7 9.2
General and administrative expenses (48.3) (60.9) Other costs have decreased by 14.0 million euro as a consequence of the lower redundancy expenses incurred compared to 2013.
8.5. Operating profit Operating profit is analyzed below by type of cost:
(million euro) June 30th, 2014 June 30th, 2013
Revenue 1,184.2 1,248.1
Change in the inventories of finished products 78.1 87.3
Purchase of raw materials. components, materials and change in inventories (740.1) (794.3)
Services (227.8) (230.0)
Payroll costs (207.6) (218.7)
Depreciation and amortization (50.5) (54.5)
Other income and expenses (2.8) (23.2)
Operating profit 33.5 14.7
Operating profit is analyzed further in the Report on operations. The number of employees at 30 June 2014 is 15,451 (16,270). As required by Consob Communication DEM/6064293 dated 28 July 2006, non-operating income and expenses are detailed in the following table. They mainly comprise restructuring charges.

2014 Half Year Financial Report – Explanatory notes
40
(million euro)
Cost of sales
Selling and
distribution
expenses
General and
administrative
expenses
June 30th, 2014
Restructuring expenses (0.6) (0.4) (0.5) (1.5)
Other non-recurring income and expenses 0.3 (0.0) (0.0) 0.2
Total non-recurring income and expenses (0.3) (0.4) (0.5) (1.3)
(million euro)
Cost of sales
Selling and
distribution
expenses
General and
administrative
expenses
June 30th, 2013
Restructuring expenses (0.3) (1.7) (12.9) (14.9)
Other non-recurring income and expenses (0.9) 0.0 5.3 4.4
Total non-recurring income and expenses (1.3) (1.7) (7.6) (10.5) Total payables and provisions for non-recurring transactions at 30 June 2014 amount to 16.3 million euro (25.5 million euro) and the cash flow effect was 1.1 million euro (absorption of 12.6 million euro).
8.6. Net interest, commissions, exchange differences and other financial expenses and share of profit/loss of associates and others
Interest expense comprises:
(million euro) June 30th, 2014 June 30th, 2013
Bond interests (8.3) (3.3)
Interest on medium-and long-term bank loans (0.4) (0.4)
Interest on short–term bank, loan and borrowings (3.9) (5.6)
Other interest expenses (2.0) (2.1)
Mark–to–market derivatives related to loans 0.4 (0.9)
Interest expenses on TFR and pension fund UK (1.4) (1.2)
Interest expenses (15.6) (13.6) Interest expense is primarily in line with 2013, recording higher USPP interest in relation to its early settlement and recording lower costs relating to derivatives for hedging the risk associated with interest rates. Interest income is analyzed below:
(million euro) June 30th, 2014 June 30th, 2013
Interest income on deposits 2.8 0.9
Interest income on pension fund UK 0.0 0.0
Interest income 2.8 0.9 Exchange differences are analyzed as follows:
(million euro) June 30th, 2014 June 30th, 2013
Net realised exchange rate differences (13.0) (6.6)
Net unrealised exchange rate differences (1.9) (1.6)
Exchange rate differences and other financial expenses (14.9) (8.2) The increase in exchange losses was almost entirely due to the unfavorable trend of Ukraine Hryvna. . See note 9 for information about the derivatives outstanding at 30 June 2014. Financial fees were 2.2 million euro (2.3 million euro). In line with 2013.

2014 Half Year Financial Report – Explanatory notes
41
8.7. Income tax Income taxes were 4.5 million euro (8.8 million euro).
8.8. Property, plant and equipment
Property, plant and equipment are analyzed as follows:
(million euro) June 30th, 2014 Dec. 31st, 2013 June 30th, 2013
Land and buildings 228.3 236.7 240.7
Plant and machinery 223.5 240.6 238.2
Industrial and commercial equipment 87.9 96.2 94.6
Assets under construction 34.0 20.4 29.0
Other assets 20.8 21.5 22.0
Total property, plant and equipment 594.6 615.4 624.4 The ownership of property is not restricted by liens and charges.
The change in the historical cost of property, plant and equipment is shown below:
(million euro)Dec. 31st, 2013 Additions Decreases
Exchange rate
differencesReclassifications June 30th, 2014
Land and buildings 369.0 0.9 (0.1) (1.6) (3.0) 365.2
Plant and machinery 732.3 3.7 (12.7) (22.6) 4.3 705.0
Industrial and commercial equipment 432.9 2.7 (5.5) (4.5) 2.6 428.1
Assets under construction 20.4 9.5 - 8.0 (3.9) 34.0
Other assets 91.5 1.2 (0.7) 0.1 0.0 92.2
Total 1,646.1 17.9 (18.9) (20.6) (0.0) 1,624.4
(million euro)Dec. 31st, 2012 Additions Decreases
Exchange rate
differencesReclassifications June 30th, 2013
Land and buildings 406.7 0.2 (1.3) (14.7) (20.2) 370.8
Plant and machinery 738.3 2.6 (0.7) (33.4) 14.6 721.4
Industrial and commercial equipment 418.1 4.2 (1.2) (13.9) 15.7 422.9
Assets under construction 50.1 11.8 - 1.1 (34.0) 29.0
Other assets 93.1 1.3 (1.1) (2.3) 0.7 91.7
Total 1,706.2 20.1 (4.3) (63.2) (23.1) 1,635.7 The changes in the related accumulated depreciation were as follows:
(million euro)
Dec. 31st, 2013
Depreciation
and Impairment
losses
DecreasesExchange rate
differencesReclassifications June 30th, 2014
Land and buildings (132.3) (5.1) 0.1 0.4 (0.0) (136.9)
Plant and machinery (491.7) (16.4) 12.7 14.0 (0.0) (481.5)
Industrial and commercial equipment (336.6) (12.8) 5.3 3.9 0.0 (340.2)
Other assets (70.1) (1.8) 0.7 (0.1) 0.0 (71.3)
Total (1,030.7) (36.2) 18.8 18.2 (0.0) (1,029.9)
(million euro)
Dec. 31st, 2012
Depreciation
and Impairment
losses
DecreasesExchange rate
differencesReclassifications June 30th, 2013
Land and buildings (151.2) (5.6) 0.2 4.3 22.3 (130.1)
Plant and machinery (487.2) (18.0) 0.7 21.4 0.0 (483.2)
Industrial and commercial equipment (324.2) (13.3) 1.2 7.5 0.3 (328.4)
Other assets (70.6) (1.9) 0.9 1.8 0.0 (69.7)
Total (1,033.2) (38.8) 3.0 35.1 22.6 (1,011.3)
The changes in the net carrying amount of property, plant and equipment are summarized in the following table:

2014 Half Year Financial Report – Explanatory notes
42
(million euro)
Dec. 31st, 2013 Additions
Depreciation
and Impairment
losses
DecreasesExchange rate
differencesReclassifications June 30th, 2014
Land and buildings 236.7 0.9 (5.1) - (1.2) (3.0) 228.3
Plant and machinery 240.6 3.7 (16.4) (0.0) (8.6) 4.3 223.5
Industrial and commercial equipment 96.2 2.7 (12.8) (0.1) (0.6) 2.6 87.9
Assets under construction 20.4 9.5 - - 8.0 (3.9) 34.0
Other assets 21.5 1.2 (1.8) (0.0) (0.0) 0.0 20.8
Total 615.6 17.9 (36.2) (0.1) (2.4) (0.0) 594.6
(million euro)
Dec. 31st, 2012 Additions
Depreciation
and Impairment
losses
DecreasesExchange rate
differencesReclassifications June 30th, 2013
Land and buildings 255.5 0.2 (5.6) (1.1) (10.4) 2.1 240.7
Plant and machinery 251.0 2.6 (18.0) 0.0 (12.0) 14.6 238.2
Industrial and commercial equipment 93.9 4.2 (13.3) (0.0) (6.4) 16.0 94.6
Assets under construction 50.1 11.8 - - 1.1 (34.0) 29.0
Other assets 22.5 1.3 (1.9) (0.2) (0.5) 0.7 22.0
Total 673.1 20.1 (38.8) (1.3) (28.1) (0.5) 624.4
The additions to property, plant and equipment principally involved the replacement of plant and investment in new production lines.
8.9. Goodwill and other intangible assets with an indefinite useful life
Goodwill and other intangible assets with an indefinite useful life are analyzed as follows:
(million euro) June 30th, 2014 Dec. 31st, 2013 June 30th, 2013
Goodwill 137.9 132.6 128.9
Brands with an indefinite useful life 111.7 107.6 104.7
Total goodwill and other intangible assets with an indefinite useful life 249.6 240.1 233.6
The changes in the net carrying amount of goodwill and other intangible assets with an indefinite useful life are summarized in the following table:
(million euro)Dec. 31st, 2013 Investments
Exchange rate
differencesJune 30th, 2014
Goodwill 132.6 5.3 137.9
Brands with an indefinite useful life 107.6 4.2 111.7
Total 240.1 - 9.5 249.6
(million euro)Dec. 31st, 2012 Investments
Exchange rate
differencesJune 30th, 2013
Goodwill 135.4 - (6.5) 128.9
Brands with an indefinite useful life 106.8 3.0 (5.1) 104.7
Total 242.2 3.0 (11.6) 233.6
The Hotpoint brand name with an indefinite useful life and the goodwill derive from the purchase of General Domestic Appliances Holding Ltd. It should be noted that 30 June 2014 Indesit has not seen any internal or external trigger events to draw up such that an impairment test on that date.
2014 Half Year Financial Report – Explanatory notes
43
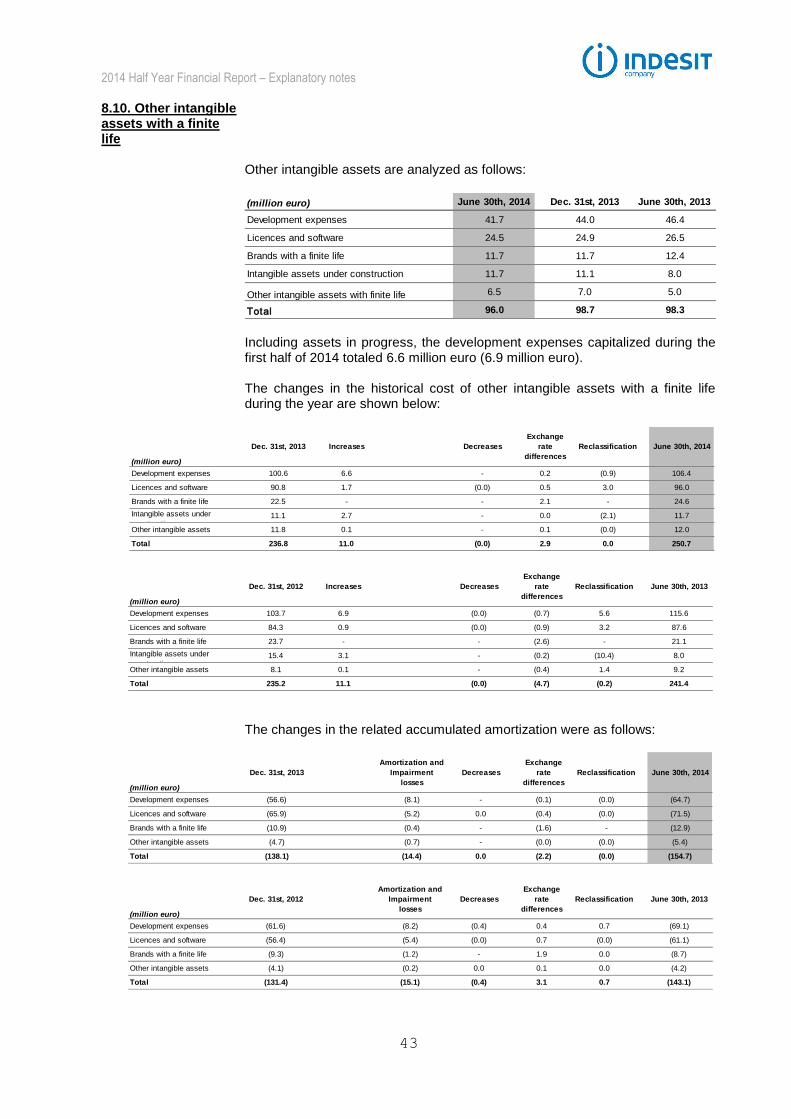
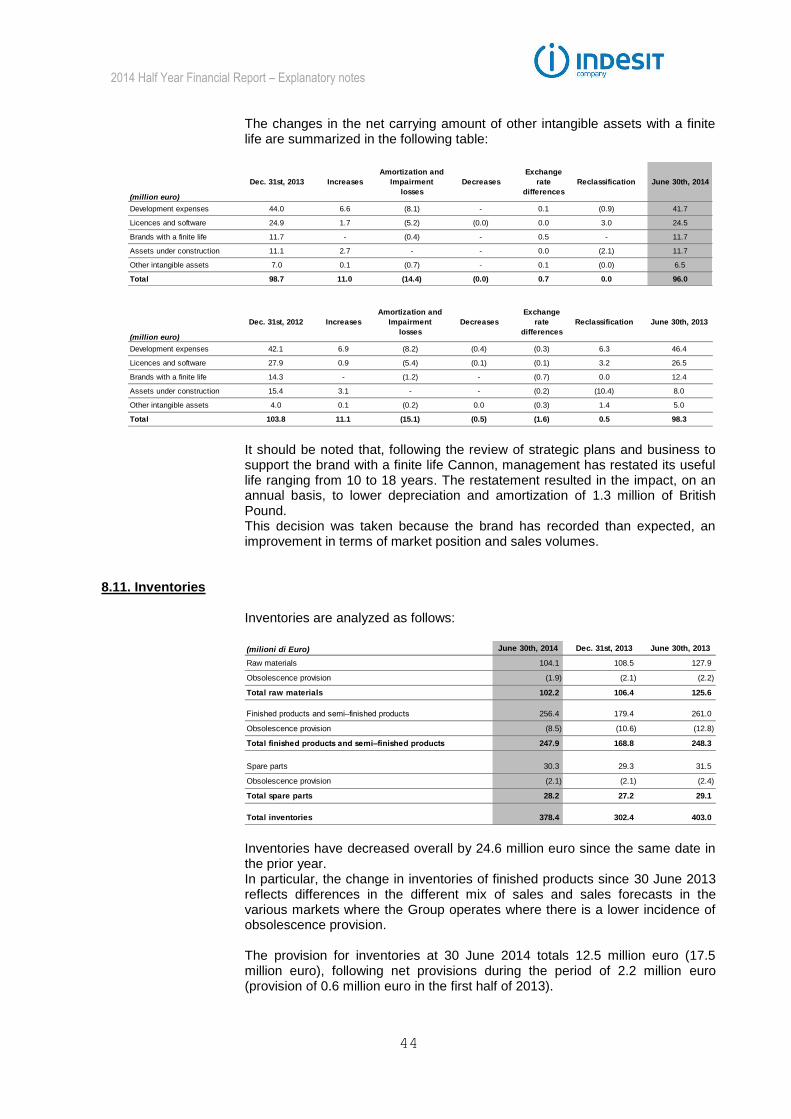
8.10. Other intangible assets with a finite life
Other intangible assets are analyzed as follows:
(million euro) June 30th, 2014 Dec. 31st, 2013 June 30th, 2013
Development expenses 41.7 44.0 46.4
Licences and software 24.5 24.9 26.5
Brands with a finite life 11.7 11.7 12.4
Intangible assets under construction 11.7 11.1 8.0
Other intangible assets with finite life 6.5 7.0 5.0
Total 96.0 98.7 98.3
Including assets in progress, the development expenses capitalized during the first half of 2014 totaled 6.6 million euro (6.9 million euro). The changes in the historical cost of other intangible assets with a finite life during the year are shown below:
(million euro)
Dec. 31st, 2013 Increases Decreases
Exchange
rate
differences
Reclassification June 30th, 2014
Development expenses 100.6 6.6 - 0.2 (0.9) 106.4
Licences and software 90.8 1.7 (0.0) 0.5 3.0 96.0
Brands with a finite life 22.5 - - 2.1 - 24.6
Intangible assets under
construction11.1 2.7 - 0.0 (2.1) 11.7
Other intangible assets 11.8 0.1 - 0.1 (0.0) 12.0
Total 236.8 11.0 (0.0) 2.9 0.0 250.7
(million euro)
Dec. 31st, 2012 Increases Decreases
Exchange
rate
differences
Reclassification June 30th, 2013
Development expenses 103.7 6.9 (0.0) (0.7) 5.6 115.6
Licences and software 84.3 0.9 (0.0) (0.9) 3.2 87.6
Brands with a finite life 23.7 - - (2.6) - 21.1
Intangible assets under
construction15.4 3.1 - (0.2) (10.4) 8.0
Other intangible assets 8.1 0.1 - (0.4) 1.4 9.2
Total 235.2 11.1 (0.0) (4.7) (0.2) 241.4
The changes in the related accumulated amortization were as follows:
(million euro)
Dec. 31st, 2013
Amortization and
Impairment
losses
Decreases
Exchange
rate
differences
Reclassification June 30th, 2014
Development expenses (56.6) (8.1) - (0.1) (0.0) (64.7)
Licences and software (65.9) (5.2) 0.0 (0.4) (0.0) (71.5)
Brands with a finite life (10.9) (0.4) - (1.6) - (12.9)
Other intangible assets (4.7) (0.7) - (0.0) (0.0) (5.4)
Total (138.1) (14.4) 0.0 (2.2) (0.0) (154.7)
(million euro)
Dec. 31st, 2012
Amortization and
Impairment
losses
Decreases
Exchange
rate
differences
Reclassification June 30th, 2013
Development expenses (61.6) (8.2) (0.4) 0.4 0.7 (69.1)
Licences and software (56.4) (5.4) (0.0) 0.7 (0.0) (61.1)
Brands with a finite life (9.3) (1.2) - 1.9 0.0 (8.7)
Other intangible assets (4.1) (0.2) 0.0 0.1 0.0 (4.2)
Total (131.4) (15.1) (0.4) 3.1 0.7 (143.1)
2014 Half Year Financial Report – Explanatory notes
44
The changes in the net carrying amount of other intangible assets with a finite life are summarized in the following table:
(million euro)
Dec. 31st, 2013 Increases
Amortization and
Impairment
losses
Decreases
Exchange
rate
differences
Reclassification June 30th, 2014
Development expenses 44.0 6.6 (8.1) - 0.1 (0.9) 41.7
Licences and software 24.9 1.7 (5.2) (0.0) 0.0 3.0 24.5
Brands with a finite life 11.7 - (0.4) - 0.5 - 11.7
Assets under construction 11.1 2.7 - - 0.0 (2.1) 11.7
Other intangible assets 7.0 0.1 (0.7) - 0.1 (0.0) 6.5
Total 98.7 11.0 (14.4) (0.0) 0.7 0.0 96.0
(million euro)
Dec. 31st, 2012 Increases
Amortization and
Impairment
losses
Decreases
Exchange
rate
differences
Reclassification June 30th, 2013
Development expenses 42.1 6.9 (8.2) (0.4) (0.3) 6.3 46.4
Licences and software 27.9 0.9 (5.4) (0.1) (0.1) 3.2 26.5
Brands with a finite life 14.3 - (1.2) - (0.7) 0.0 12.4
Assets under construction 15.4 3.1 - - (0.2) (10.4) 8.0
Other intangible assets 4.0 0.1 (0.2) 0.0 (0.3) 1.4 5.0
Total 103.8 11.1 (15.1) (0.5) (1.6) 0.5 98.3
It should be noted that, following the review of strategic plans and business to support the brand with a finite life Cannon, management has restated its useful life ranging from 10 to 18 years. The restatement resulted in the impact, on an annual basis, to lower depreciation and amortization of 1.3 million of British Pound. This decision was taken because the brand has recorded than expected, an improvement in terms of market position and sales volumes.
8.11. Inventories
Inventories are analyzed as follows:
(milioni di Euro) June 30th, 2014 Dec. 31st, 2013 June 30th, 2013
Raw materials 104.1 108.5 127.9
Obsolescence provision (1.9) (2.1) (2.2)
Total raw materials 102.2 106.4 125.6
Finished products and semi–finished products 256.4 179.4 261.0
Obsolescence provision (8.5) (10.6) (12.8)
Total finished products and semi–finished products 247.9 168.8 248.3
Spare parts 30.3 29.3 31.5
Obsolescence provision (2.1) (2.1) (2.4)
Total spare parts 28.2 27.2 29.1
Total inventories 378.4 302.4 403.0 Inventories have decreased overall by 24.6 million euro since the same date in the prior year. In particular, the change in inventories of finished products since 30 June 2013 reflects differences in the different mix of sales and sales forecasts in the various markets where the Group operates where there is a lower incidence of obsolescence provision. The provision for inventories at 30 June 2014 totals 12.5 million euro (17.5 million euro), following net provisions during the period of 2.2 million euro (provision of 0.6 million euro in the first half of 2013).
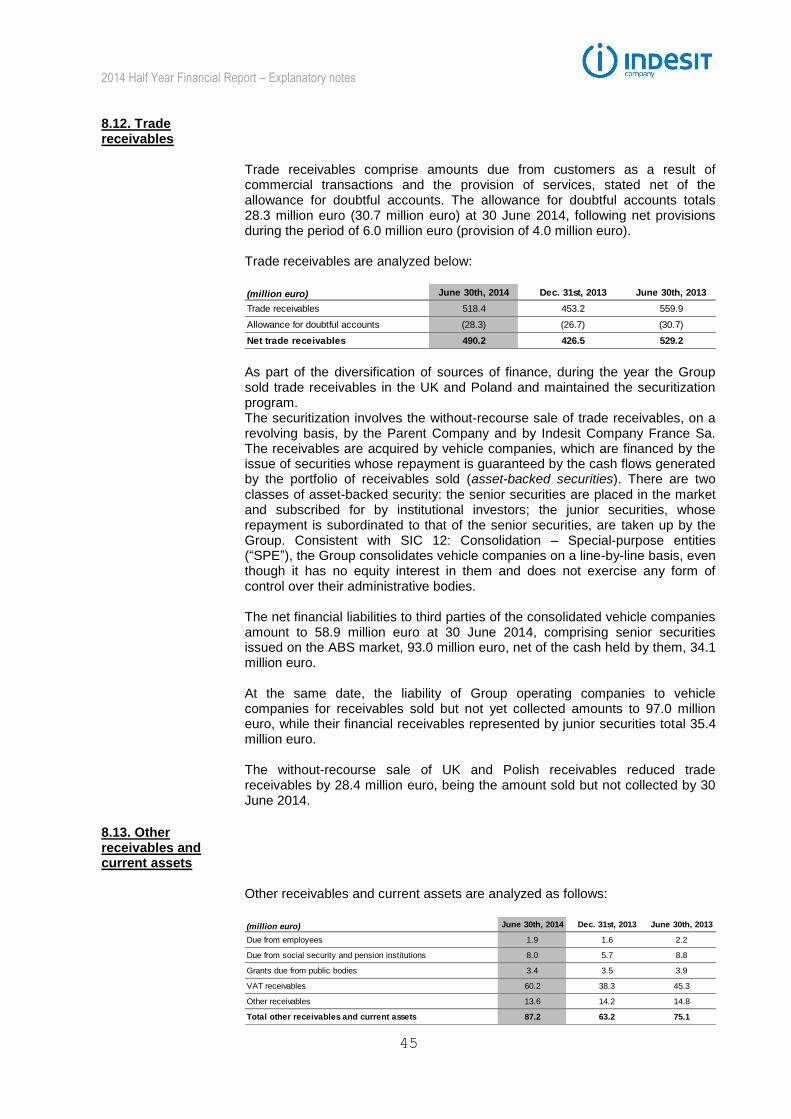
2014 Half Year Financial Report – Explanatory notes
45
8.12. Trade receivables
Trade receivables comprise amounts due from customers as a result of commercial transactions and the provision of services, stated net of the allowance for doubtful accounts. The allowance for doubtful accounts totals 28.3 million euro (30.7 million euro) at 30 June 2014, following net provisions during the period of 6.0 million euro (provision of 4.0 million euro). Trade receivables are analyzed below:
(million euro) June 30th, 2014 Dec. 31st, 2013 June 30th, 2013
Trade receivables 518.4 453.2 559.9
Allowance for doubtful accounts (28.3) (26.7) (30.7)
Net trade receivables 490.2 426.5 529.2 As part of the diversification of sources of finance, during the year the Group sold trade receivables in the UK and Poland and maintained the securitization program. The securitization involves the without-recourse sale of trade receivables, on a revolving basis, by the Parent Company and by Indesit Company France Sa. The receivables are acquired by vehicle companies, which are financed by the issue of securities whose repayment is guaranteed by the cash flows generated by the portfolio of receivables sold (asset-backed securities). There are two classes of asset-backed security: the senior securities are placed in the market and subscribed for by institutional investors; the junior securities, whose repayment is subordinated to that of the senior securities, are taken up by the Group. Consistent with SIC 12: Consolidation – Special-purpose entities (“SPE”), the Group consolidates vehicle companies on a line-by-line basis, even though it has no equity interest in them and does not exercise any form of control over their administrative bodies. The net financial liabilities to third parties of the consolidated vehicle companies amount to 58.9 million euro at 30 June 2014, comprising senior securities issued on the ABS market, 93.0 million euro, net of the cash held by them, 34.1 million euro. At the same date, the liability of Group operating companies to vehicle companies for receivables sold but not yet collected amounts to 97.0 million euro, while their financial receivables represented by junior securities total 35.4 million euro. The without-recourse sale of UK and Polish receivables reduced trade receivables by 28.4 million euro, being the amount sold but not collected by 30 June 2014.
8.13. Other receivables and current assets
Other receivables and current assets are analyzed as follows:
(million euro) June 30th, 2014 Dec. 31st, 2013 June 30th, 2013
Due from employees 1.9 1.6 2.2
Due from social security and pension institutions 8.0 5.7 8.8
Grants due from public bodies 3.4 3.5 3.9
VAT receivables 60.2 38.3 45.3
Other receivables 13.6 14.2 14.8
Total other receivables and current assets 87.2 63.2 75.1
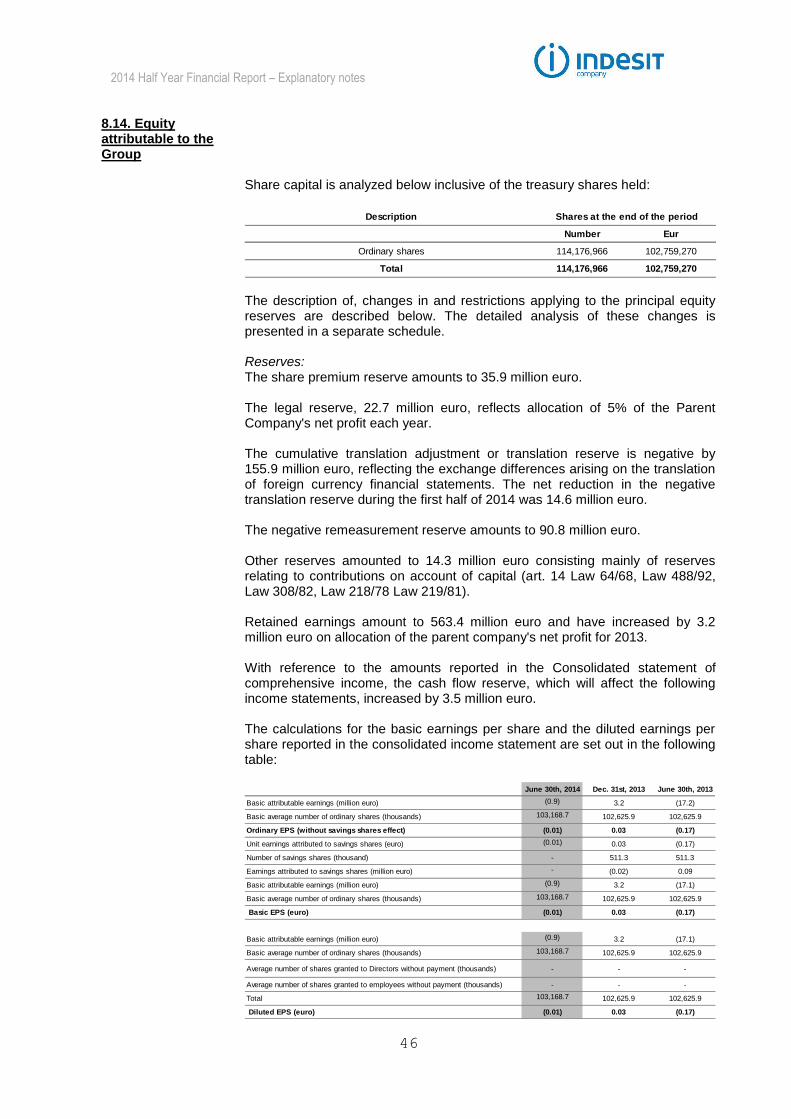
2014 Half Year Financial Report – Explanatory notes
46
8.14. Equity attributable to the Group
Share capital is analyzed below inclusive of the treasury shares held:
Description
Number Eur
Ordinary shares 114,176,966 102,759,270
Total 114,176,966 102,759,270
Shares at the end of the period
The description of, changes in and restrictions applying to the principal equity reserves are described below. The detailed analysis of these changes is presented in a separate schedule. Reserves: The share premium reserve amounts to 35.9 million euro. The legal reserve, 22.7 million euro, reflects allocation of 5% of the Parent Company's net profit each year. The cumulative translation adjustment or translation reserve is negative by 155.9 million euro, reflecting the exchange differences arising on the translation of foreign currency financial statements. The net reduction in the negative translation reserve during the first half of 2014 was 14.6 million euro. The negative remeasurement reserve amounts to 90.8 million euro. Other reserves amounted to 14.3 million euro consisting mainly of reserves relating to contributions on account of capital (art. 14 Law 64/68, Law 488/92, Law 308/82, Law 218/78 Law 219/81). Retained earnings amount to 563.4 million euro and have increased by 3.2 million euro on allocation of the parent company's net profit for 2013. With reference to the amounts reported in the Consolidated statement of comprehensive income, the cash flow reserve, which will affect the following income statements, increased by 3.5 million euro. The calculations for the basic earnings per share and the diluted earnings per share reported in the consolidated income statement are set out in the following table:
June 30th, 2014 Dec. 31st, 2013 June 30th, 2013
Basic attributable earnings (million euro) (0.9) 3.2 (17.2)
Basic average number of ordinary shares (thousands) 103,168.7 102,625.9 102,625.9
Ordinary EPS (without savings shares effect) (0.01) 0.03 (0.17)
Unit earnings attributed to savings shares (euro) (0.01) 0.03 (0.17)
Number of savings shares (thousand) - 511.3 511.3
Earnings attributed to savings shares (million euro) - (0.02) 0.09
Basic attributable earnings (million euro) (0.9) 3.2 (17.1)
Basic average number of ordinary shares (thousands) 103,168.7 102,625.9 102,625.9
Basic EPS (euro) (0.01) 0.03 (0.17)
Basic attributable earnings (million euro) (0.9) 3.2 (17.1)
Basic average number of ordinary shares (thousands) 103,168.7 102,625.9 102,625.9
Average number of shares granted to Directors without payment (thousands) - - -
Average number of shares granted to employees without payment (thousands) - - -
Total 103,168.7 102,625.9 102,625.9
Diluted EPS (euro) (0.01) 0.03 (0.17)

2014 Half Year Financial Report – Explanatory notes
47
8.15. Net financial indebtedness
The net financial indebtedness of the Group is analyzed below:
(million euro) note June 30th, 2014 Dec. 31st, 2013 June 30th, 2013
Current financial assets 8.15.1 11.0 17.9 31.2
Cash and cash equivalents 8.15.2 125.0 330.8 197.9
Banks and other loans and borrowings 8.15.3 (294.8) (307.4) (232.5)
Net financial indebtedness position — short term (158.8) 41.3 (3.3)
Medium/long–term financial payables 8.15.4 (340.8) (368.6) (518.4)
Net financial position 1 (499.6) (327.4) (521.7)
Other non–current financial assets 8.15.5 2.0 1.9 1.9
Total net financial indebtedness (497.6) (325.5) (519.8)
1) As defined in CONSOB Communication DEM /6064293 dated 28.07.2006, applying the CESR recommendations dated 10.02.2005.
8.15.1 Current financial assets
Current financial assets include the fair value adjustment of derivative financial instruments, 4.5 million euro (23.2 million euro), and other current financial receivables, 6.5 million euro (8.0 million euro).
8.15.2 Cash and cash equivalents
Cash and cash equivalents include bank and postal deposits, as well as checks and other amounts on hand. The changes in liquidity during the year are analyzed in the consolidated cash flow statement. This caption includes liquidity of 34.1 million euro held by the vehicle companies for the securitization that will be used to settle the financial payables (classified as current financial liabilities) arising under the program.
8.15.3 Current financial payables
Current financial payables comprise amounts due within one year. This caption is analyzed below:
(million euro) June 30th, 2014 Dec. 31st, 2013 June 30th, 2013
Current portion of bank, loans and borrowings 171.0 27.0 103.0
Short–term advances for securitization 91.5 96.6 90.5
Liability from the measurement of derivative instruments 16.7 28.5 13.4
Current portion of bond and Eurobond 2.4 142.1 10.5
Current portion of medium/long–term bank, loans and borrowings 12.8 12.9 14.1
Current portion of other medium/long–term bank, loans and borrowings 0.4 0.4 1.0
Total 294.8 307.4 232.5
The current portion of bank loans and borrowings comprises bank overdrafts, the draw down against revolving lines of credit and other short-term advances in various forms. The short-term advances for securitization relate to the amounts payable for securities issued as part of the securitization program.

2014 Half Year Financial Report – Explanatory notes
48
8.15.4 Medium/long-term financial payables
The medium/long-term financial payables are analyzed as follows:
(million euro) June 30th, 2014 Dec. 31st, 2013 June 30th, 2013
Bonds - 19.6 154.5
Due to banks and other financial backers 44.0 52.7 67.9
Eurobond 296.8 296.4 296.0
Total 340.8 368.6 518.4 As already discussed in the Report on operations, it is noted that the bond was fully repaid during the half of 2014. The Eurobond, denominated in euro, relates to a loan subscribed for by institutional investors that is listed in Luxembourg. Further information about the cross currency swap is provided in note 9 on financial instruments. Medium/long-term financial payables are analyzed by maturity in the following table:
(million euro) 2015 2016 2017 2018 Total
Eurobond 0.0 0.0 0.0 296.8 296.8
Due to banks and other financial payables 6.1 12.5 12.8 12.8 44.0
TOTAL 6.1 12.5 12.8 309.5 340.8 Among other obligations, the bonds and the committed bank loans require compliance with certain financial covenants. In particular, the following parameters must be met:
Revolving Facility
Net financial indebtedness/EBITDA 3.0 4.0
EBITDA/Net financial expenses 3.5 3.5
BEI
Net financial indebtedness/EBITDA 3.0 na
EBITDA/Net financial expenses 3.5 3.5
Equity 320 milioni di euro 320 milioni di euro
Securitization
Net financial indebtedness/EBITDA 3.0 4.0
Covenant limit at
31 December
Covenant limit at
30 June
Covenant limit at
31 December
Covenant limit at
30 June
Covenant limit at
31 December
Covenant limit at
30 June
In addition to the financial covenants, the committed lines of credit require Indesit Company S.p.A. and, in certain cases, a number of Group companies to comply with other affirmative and negative covenants that are consistent with market standards for transactions of a similar nature, amount, maturity and risk profile.

2014 Half Year Financial Report – Explanatory notes
49
Failure to comply with these covenants would, following the elapse of a given period of time available to correct such non-compliance, give the counterparts a right to require the early repayment of the related borrowings. The above parameters are monitored constantly by the Group and, as of 30 June 2014, all the covenants have been respected.
8.15.5 Other non-current financial assets
Other non-current financial assets are analyzed as follows:
(million euro) June 30th, 2014 Dec. 31st, 2013 June 30th, 2013
Bind deposits 1.2 1.9 1.6
Assets for the measurement of derivative instruments 0.8 - 0.4
Total 2.0 1.9 1.9
Other non-current financial assets are analyzed by maturity in the following table:
(million euro)Total long term Within 1 year
Between 1 amd 5
years Beyond 5 years
Bind deposits 1.2 - 0.3 0.9
Assets for the measurement of derivative instruments 0.8 - 0.8 -
Total 2.0 0.0 1.1 0.9 8.16. Employee benefits
Employee benefits reflect the provisions recorded for such post-employment benefits as severance indemnities (TFR) and pensions. This caption consists solely of the liability for defined benefit plans: these plans principally relate to the TFR accrued by Italian companies up to 31 December 2006, 38.3 million euro; the pension funds of the UK companies, 36.7 million euro, and other smaller plans, 4.5 million euro. The ―deficit‖ related to pension funds of the British Society accounted for in accordance with IFRS turns out to be less than the ―deficit‖ arising from the calculation provided for in the English Pension Act. The Group is committed to fill this "deficit" through annual contributions of 8.4 million of euro. Indesit also has determined that, based on the terms of the plan, the non-application of the 'IFRIC 14 has no impact on the balance sheet.
8.17. Provisions for risks and charges
The provisions for risks and charges are analyzed as follows:
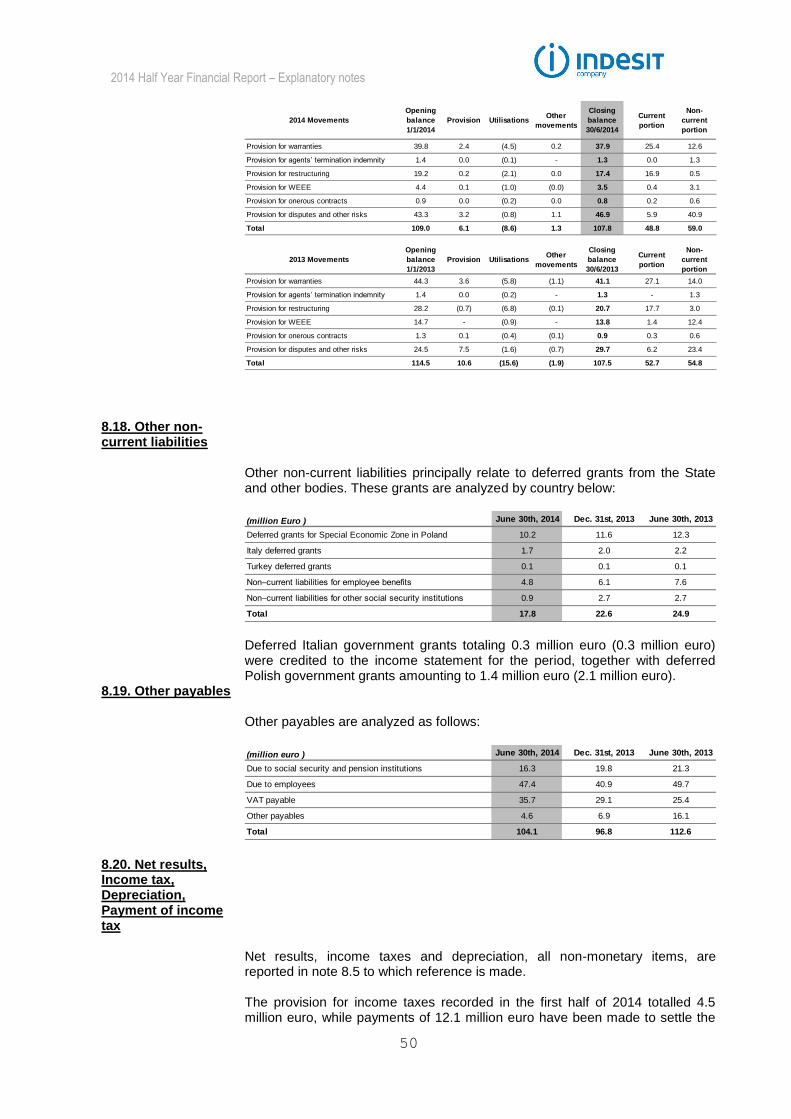
2014 Half Year Financial Report – Explanatory notes
50
2014 Movements
Opening
balance
1/1/2014
Provision UtilisationsOther
movements
Closing
balance
30/6/2014
Current
portion
Non-
current
portion
Provision for warranties 39.8 2.4 (4.5) 0.2 37.9 25.4 12.6
Provision for agents’ termination indemnity 1.4 0.0 (0.1) - 1.3 0.0 1.3
Provision for restructuring 19.2 0.2 (2.1) 0.0 17.4 16.9 0.5
Provision for WEEE 4.4 0.1 (1.0) (0.0) 3.5 0.4 3.1
Provision for onerous contracts 0.9 0.0 (0.2) 0.0 0.8 0.2 0.6
Provision for disputes and other risks 43.3 3.2 (0.8) 1.1 46.9 5.9 40.9
Total 109.0 6.1 (8.6) 1.3 107.8 48.8 59.0
2013 Movements
Opening
balance
1/1/2013
Provision UtilisationsOther
movements
Closing
balance
30/6/2013
Current
portion
Non-
current
portion
Provision for warranties 44.3 3.6 (5.8) (1.1) 41.1 27.1 14.0
Provision for agents’ termination indemnity 1.4 0.0 (0.2) - 1.3 - 1.3
Provision for restructuring 28.2 (0.7) (6.8) (0.1) 20.7 17.7 3.0
Provision for WEEE 14.7 - (0.9) - 13.8 1.4 12.4
Provision for onerous contracts 1.3 0.1 (0.4) (0.1) 0.9 0.3 0.6
Provision for disputes and other risks 24.5 7.5 (1.6) (0.7) 29.7 6.2 23.4
Total 114.5 10.6 (15.6) (1.9) 107.5 52.7 54.8
8.18. Other non-current liabilities
Other non-current liabilities principally relate to deferred grants from the State and other bodies. These grants are analyzed by country below:
(million Euro ) June 30th, 2014 Dec. 31st, 2013 June 30th, 2013
Deferred grants for Special Economic Zone in Poland 10.2 11.6 12.3
Italy deferred grants 1.7 2.0 2.2
Turkey deferred grants 0.1 0.1 0.1
Non–current liabilities for employee benefits 4.8 6.1 7.6
Non–current liabilities for other social security institutions 0.9 2.7 2.7
Total 17.8 22.6 24.9
Deferred Italian government grants totaling 0.3 million euro (0.3 million euro) were credited to the income statement for the period, together with deferred Polish government grants amounting to 1.4 million euro (2.1 million euro).
8.19. Other payables Other payables are analyzed as follows:
(million euro ) June 30th, 2014 Dec. 31st, 2013 June 30th, 2013
Due to social security and pension institutions 16.3 19.8 21.3
Due to employees 47.4 40.9 49.7
VAT payable 35.7 29.1 25.4
Other payables 4.6 6.9 16.1
Total 104.1 96.8 112.6 8.20. Net results, Income tax, Depreciation, Payment of income tax
Net results, income taxes and depreciation, all non-monetary items, are reported in note 8.5 to which reference is made. The provision for income taxes recorded in the first half of 2014 totalled 4.5 million euro, while payments of 12.1 million euro have been made to settle the

2014 Half Year Financial Report – Explanatory notes
51
residual amount due for the prior year and make tax advances. The amounts due are determined with reference to tax regulations in the various countries in which the Group operates.
8.21. Other non-monetary income and expenses, net, interest paid and collected
The other non-monetary income and expenses, net, comprise all non-monetary items recorded in the income statement, except for income taxes, depreciation and the provisions deducted directly from asset accounts (allowance for doubtful accounts and provisions for obsolescence). Accordingly, they include the increases/decreases in the cash flow reserve, provisions for warranties, provisions for risks and charges, disposal gains and losses, unrealized exchange fluctuations, and accrued interest income and expense. Interest collected is reported separately from interest paid.
8.22. Change in trade receivables, inventories, trade payables
This caption reports the cash absorbed or generated by the changes in net working capital, which comprises trade receivables, inventories and trade payables. The changes in trade payables relate solely to the supply of raw materials, goods and services, and exclude the changes in amounts due to suppliers of fixed assets, which are reported in the section of the cash flow statement that shows the cash flows generated (absorbed) by investing activities.
8.23. Change in other assets and liabilities
This caption reports the change in all other current and non-current assets and liabilities, net of the effect on them of provisions for non-monetary costs and income. This represents the changes in the related balances with a direct effect on the absorption or generation of cash.
8.24. Payments for additions to property, plant and equipment and proceeds from their disposal
The cash flows arising from additions to property, plant and equipment reflect the investment in new products at various plants throughout the Group, as well as investment in Italy as part of the industrial plan to reorganize production. This caption also includes changes in payables, receivables and advances to suppliers of property, plant and equipment. The cash flows arising from the disposal of property, plant and equipment relate to the sale of plant no longer in use.
8.25. Acquisition of intangible assets
The cash flows arising from investment in intangible assets relate to the purchase of licenses and software, and the capitalization of development costs, as explained in more detail in note 8.10. The cash flows generated (absorbed) by investing activities include the

2014 Half Year Financial Report – Explanatory notes
52
amounts capitalized since these involve payments for the related internal costs incurred (mainly payroll). These payments essentially reflect the costs capitalized during the year.
8.26. Dividends paid
No dividends were paid to holders of ordinary shares 8.27. Repayments of medium/long-term financial payables and bonds
The repayments of other medium/long-term financial payables relate to loans from banks and other providers of finance. The repayment of 6.4 million euro refers to the current portion of the principal on above loans.
8.28. Change in current financial payables
The change in current financial payables includes the change in short-term bank loans since this represents a technical form of short-term borrowing. No new loans were arranged during the period ended 30 June 2014.

2014 Half Year Financial Report – Explanatory notes
53
9. Financial instruments 9.1 Management of financial risks
The Group is exposed to the following principal financial risks deriving from operations:
liquidity risk (availability and access to financial resources);
market risk (exchange rates, interest rates, commodity prices);
credit risk (with commercial and financial counterparts).
Liquidity, market and financial counterpart credit risks are managed by the Central Treasury Department in accordance with the Group Treasury Policy approved by the Board of Directors. Group strategy is to minimize the exposure to risk and, accordingly, it is forbidden to take positions that might generate risks that are not strictly correlated with normal business activities (e.g. transactions in currencies other than the functional currencies). In this context and in order to appropriately segregate duties, the Group has allocated skills and responsibilities between the Treasury Front Office and the Treasury Back Office, which is functionally and hierarchically separated from the Front Office. The Front Office is mainly responsible for managing liquidity, identifying
Credit risk
Commercial counterpart
Commercial counterpart
Market risk
Exchange-rate risk
risk Interest rate
Commodity price risk
Competitive
Translation
Economic
Liquidity risk
Market risk
Funding risk

2014 Half Year Financial Report – Explanatory notes
54
exposures to risk and negotiating hedges with financial counterparts. The Back Office checks compliance with Treasury Policy and is responsible for the accounting measurement and recognition of hedging instruments. Credit risk related to commercial counterparts is managed by a Group credit policy which defines:
the principles underlying credit assessment and the procedures for establishing specific credit limits in each geographical area or country in which the Group works, and the credit control methodology applied;
the levels of authority for granting credit, based on the progressive involvement of market, commercial area and corporate managers (up to CFO and CEO), in proportion to the increasing amount of credit granted and risk incurred.
As required by IFRS 7, the following qualitative and quantitative information is provided about the impact of these risks on the Group. With regard to the various market risks, the quantitative data from the sensitivity analyses has no value for forecasting purposes and cannot reflect the complexity of the market reactions correlated with each change in the assumptions made.
9.2 Transactions outstanding at period end
The transactions outstanding at 30 June 2014 and their fair values are reported in the following table, which also indicates the change in the value of the underlyings (where applicable). This is followed by detailed information on the individual transactions.
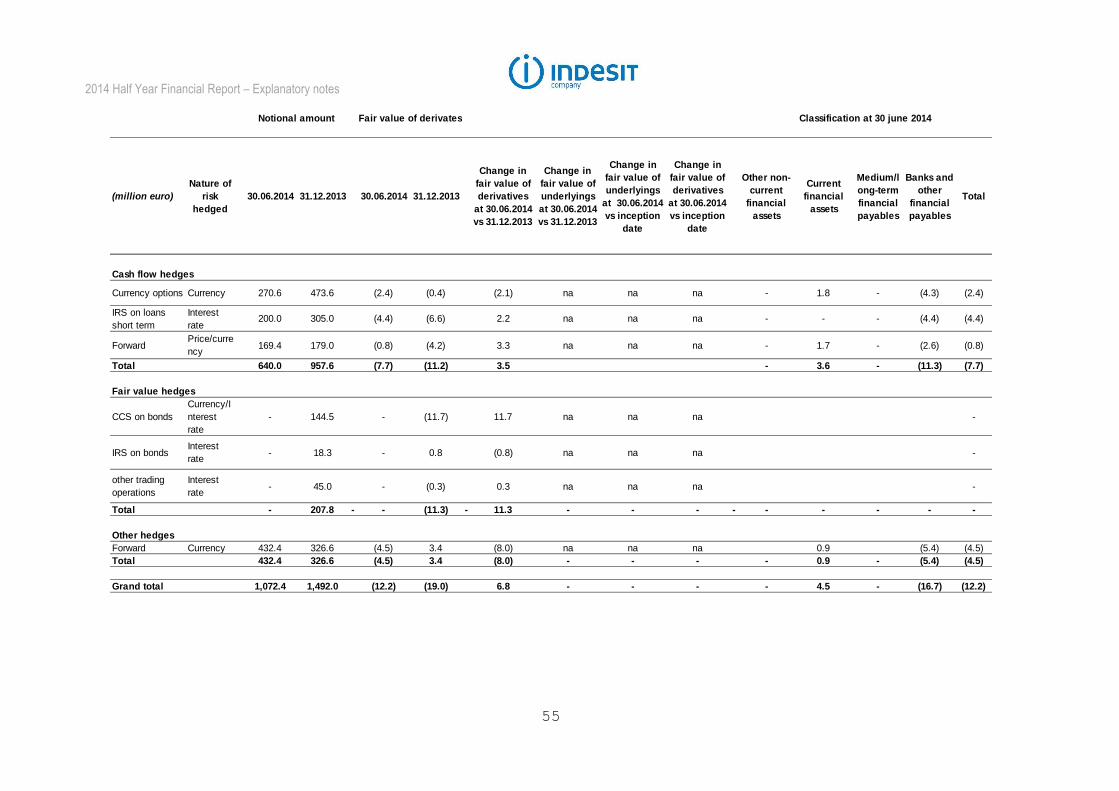
2014 Half Year Financial Report – Explanatory notes
55
(million euro)
Nature of
risk
hedged
30.06.2014 31.12.2013 30.06.2014 31.12.2013
Change in
fair value of
derivatives
at 30.06.2014
vs 31.12.2013
Change in
fair value of
underlyings
at 30.06.2014
vs 31.12.2013
Change in
fair value of
underlyings
at 30.06.2014
vs inception
date
Change in
fair value of
derivatives
at 30.06.2014
vs inception
date
Other non-
current
financial
assets
Current
financial
assets
Medium/l
ong-term
financial
payables
Banks and
other
financial
payables
Total
Cash flow hedges
Currency options Currency 270.6 473.6 (2.4) (0.4) (2.1) na na na - 1.8 - (4.3) (2.4)
IRS on loans
short term
Interest
rate200.0 305.0 (4.4) (6.6) 2.2 na na na - - - (4.4) (4.4)
ForwardPrice/curre
ncy169.4 179.0 (0.8) (4.2) 3.3 na na na - 1.7 - (2.6) (0.8)
Total 640.0 957.6 (7.7) (11.2) 3.5 - 3.6 - (11.3) (7.7)
Fair value hedges
CCS on bonds
Currency/I
nterest
rate
- 144.5 - (11.7) 11.7 na na na -
IRS on bondsInterest
rate- 18.3 - 0.8 (0.8) na na na -
other trading
operations
Interest
rate- 45.0 - (0.3) 0.3 na na na -
Total - 207.8 - - (11.3) - 11.3 - - - - - - - - -
Other hedges
Forward Currency 432.4 326.6 (4.5) 3.4 (8.0) na na na 0.9 (5.4) (4.5)
Total 432.4 326.6 (4.5) 3.4 (8.0) - - - - 0.9 - (5.4) (4.5)
Grand total 1,072.4 1,492.0 (12.2) (19.0) 6.8 - - - - 4.5 - (16.7) (12.2)
Classification at 30 june 2014Notional amount Fair value of derivates
2014 Half Year Financial Report – Explanatory notes
56
The currency options recognised as cash flow hedges were purchased principally to hedge the risk of an appreciation of the Euro against the UK pound and of the Polish Zloty against the Euro. The hedged exchange risks mainly relate to highly likely future transactions expected to take place within one year, with the consequent release of the cash flow reserve to the income statement. The float-to-fix Interest Rate Swaps have been designated as cash flow hedges of the interest-rate risk on part of the short-term loans, the use of which is expected to be equivalent to such Interest Rate Swaps in terms of their nominal value and maturities. The interest-rate hedges outstanding at 30 June 2014 comprise IRS with a total notional of 200.0 million euro. These hedge the interest-rate risk on an average of about 200.0 million euro of underlying payables (short term) with the following maturities:
150.0 million euro from 17 March 2014 to 17 March 2015;
50.0 million euro from 17 March 2012 to 17 March 2015. The forwards, designated as cash flow hedges, were arranged to hedge the exchange-rate risk on highly likely future transactions, and the price risk on highly likely future purchases of commodities and semi-finished products. The cross currency swap arranged to hedge the interest-rate and exchange-rate risks deriving from commitments in relation to the US private placement of bonds was concluded simultaneously with the reimbursement of the underlying hedge. The interest-rate swap relates to the euro tranche of the US private placement, and was arranged to hedge the interest-rate risk that was concluded simultaneously with the closure of the underlying hedge. The forwards not recognized as cash flow hedges were arranged to hedge exchange-rate risk. With regard to the derivative instruments outstanding at 30 June 2014:
all the financial instruments measured at fair value are represented by Level 2 derivatives (same as in 2013);
there were no transfers from Level 1 to Level 2, or vice versa, during 2014;
there were no transfers from Level 3 to other Levels, or vice versa, during 2014.
The fair value of each instrument is calculated as follows:
the fair value of currency forwards is calculated considering the exchange rate and the interest rates in the two currencies at the reporting date;
the fair value of currency options is calculated using the Black-Scholes model and market parameters at the reporting date (exchange rates, interest rates and volatilities of the currencies);

2014 Half Year Financial Report - Explanatory notes
57
the fair value of interest-rate swaps and forward-rate agreements is calculated considering the interest rates at the reporting date and using DCF techniques;
the fair value of cross currency swaps is calculated considering the exchange rate and the interest rates at the reporting date and using DCF techniques;
the fair value of commodity forwards is determined considering the forward price for the commodity and the interest rates at the reporting date (and the exchange rate at the reporting date, if the hedge includes the exchange rate).
Determination of the fair value of derivatives takes account of the credit risk relating to individual banking counterparts and the risk of non-performance by the Indesit Group (own credit risk), as required by IFRS 13. A credit risk adjustment is applied to the market values determined using the valuation techniques described. This considers the probability of default extrapolated from the market CDS spreads for banking counterparts and the credit spreads implied by the yields on a basket of corporate bonds with the same rating as that of the Group, estimated using internal valuation models. With reference to the valuations carried out at 30 June 2014, the size of this adjustment with respect to risk-free market values is limited due to the short residual duration of the derivative positions outstanding at year end. Based on the current wording of IAS 39, the application of a credit risk adjustment when calculating the fair value of derivatives represents a source of ineffectiveness (although not significant for the Group) in the hedging relationships recognized for hedge accounting purposes. This is because the adjustment is only calculated with reference to the derivative instruments concerned and is not reflected in the valuation of the related underlyings.

2014 Half Year Financial Report - Explanatory notes
58
10. Information required by IAS 24 on the remuneration of management and on related parties
Remuneration of management The managers with strategic responsibility for operations, planning and control are 4 and are currently identified in the figures of Chief Operating Officers, Sales & Marketing (to share expertise), of Chief Operating Officer, Product & Technology, of Chief Financial Officer and of Chief HR Officer (to share expertise). The table below lists the expected annual cost of the above persons for 2014, along with annual costs related to executive and non-executive directors and auditors. The included components of compensation are wages and salaries, annual bonuses, long-term awards of shares allocated during the year, social security contributions and fringe benefits.
(million euro )
Short-term
benefits
Long-term
benefits
Directors 3.2 1.3
Statutory Auditors 0.2 -
Executives with strategic responsabilities 1.6 0.8
Total 5.0 2.2
(million euro )
Short-term
benefits
Long-term
benefits
Directors 3.1 0.7
Statutory Auditors 0.2 -
Executives with strategic responsabilities 2.5 0.9
Total 5.8 1.6
Salaries and annual fees for the year 2014 due to directors, statutory auditors and
executives with strategic responsabilities
Salaries and annual fees for the year 2013 due to directors, statutory auditors and
executives with strategic responsabilities
List of the principal related parties with which transactions were carried out during the year. The principal related parties (other than subsidiaries), as defined in IAS 24, with which commercial and financial transactions have been carried out, are listed below. All commercial and financial transactions with these entities were arranged on arms'-length terms and in the interests of the Group.

2014 Half Year Financial Report - Explanatory notes
59
List of related parties Type of relationship
Fineldo Spa Group Parent belonging to Vittorio Merloni
Immobiliare Fineldo Srl Other related — Controlled by Fineldo S.p.A., Group parent of Indesit Company
Progetti International Spa Other related — Controlled by Fineldo S.p.A., Group parent of Indesit Company
Solar COOL Srl Other related — Controlled by Fineldo S.p.A., Group parent of Indesit Company
Solar STOCK Srl Other related — Controlled by Fineldo S.p.A., Group parent of Indesit Company
Solar WASH Srl Other related — Controlled by Fineldo S.p.A., Group parent of Indesit Company
Tecnosolare Carinaro Srl Other related — Controlled by Fineldo S.p.A., Group parent of Indesit Company
Tradeplace BV Associate
Indesit Company UK Ltd Group Personal Pension Plan Pension fund
Merloni Ireland Pension Plan Pension fund
Indesit Company UK Ltd and the employees concerned contribute to the Indesit Company UK Ltd Group Personal Pension Plan and the Merloni Ireland Pension Plan under the pension rules applicable in the UK. In addition to the above companies, the following natural persons are also deemed to be related parties: members of the Board of Directors and the Board of Statutory Auditors, managers with strategic responsibility for management, planning and control activities, and the close family members of these parties, as defined in IAS 24. Schedules summarizing transactions with related parties The table on the next page summarizes balances and transactions with the related parties identified above, distinguishing between transactions with the parent company, associates and other related parties. In accordance with Consob Resolution no. 15519 dated 27 July 2006 and Consob Communication DEM/6064293 dated 28 July 2006, Attachments 3 and 4 present the consolidated income statement and statement of financial position showing transactions with related parties separately and indicating their percentage incidence with respect to each account caption. There have not been any significant, atypical and/or unusual transactions with related parties (except those with regard to the pension funds described above).
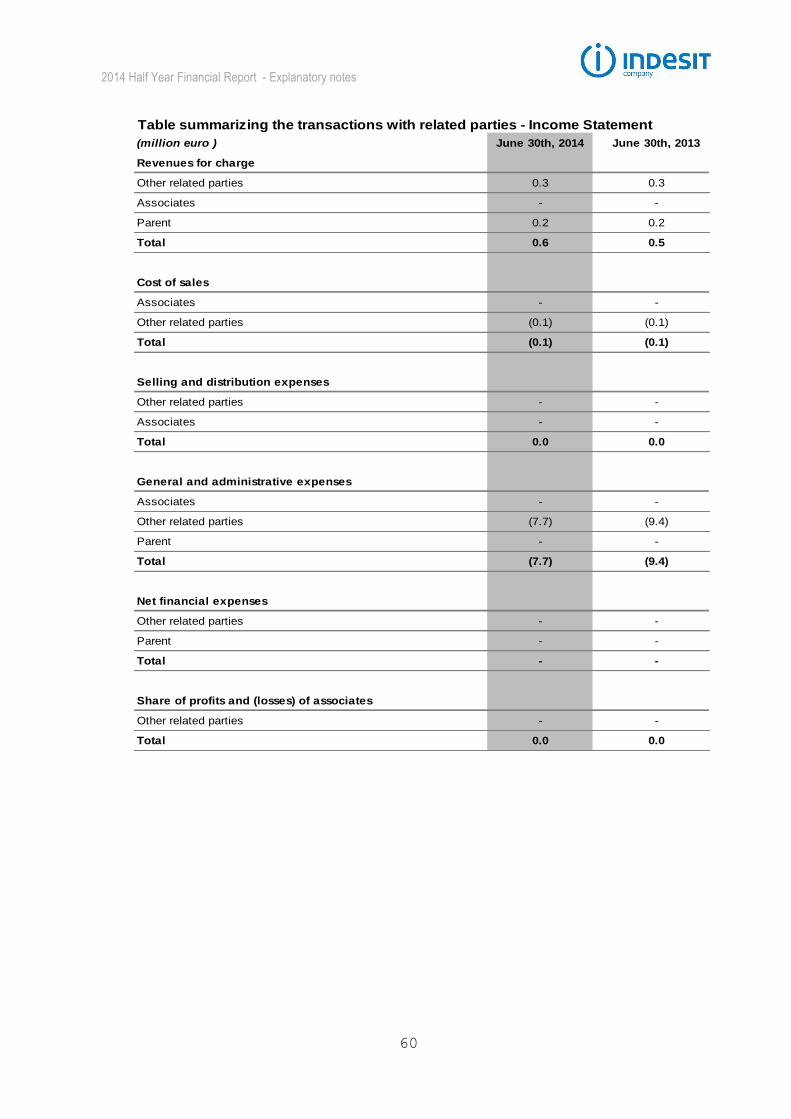
2014 Half Year Financial Report - Explanatory notes
60
(million euro ) June 30th, 2014 June 30th, 2013
Revenues for charge
Other related parties 0.3 0.3
Associates - -
Parent 0.2 0.2
Total 0.6 0.5
Cost of sales
Associates - -
Other related parties (0.1) (0.1)
Total (0.1) (0.1)
Selling and distribution expenses
Other related parties - -
Associates - -
Total 0.0 0.0
General and administrative expenses
Associates - -
Other related parties (7.7) (9.4)
Parent - -
Total (7.7) (9.4)
Net financial expenses
Other related parties - -
Parent - -
Total - -
Share of profits and (losses) of associates
Other related parties - -
Total 0.0 0.0
Table summarizing the transactions with related parties - Income Statement
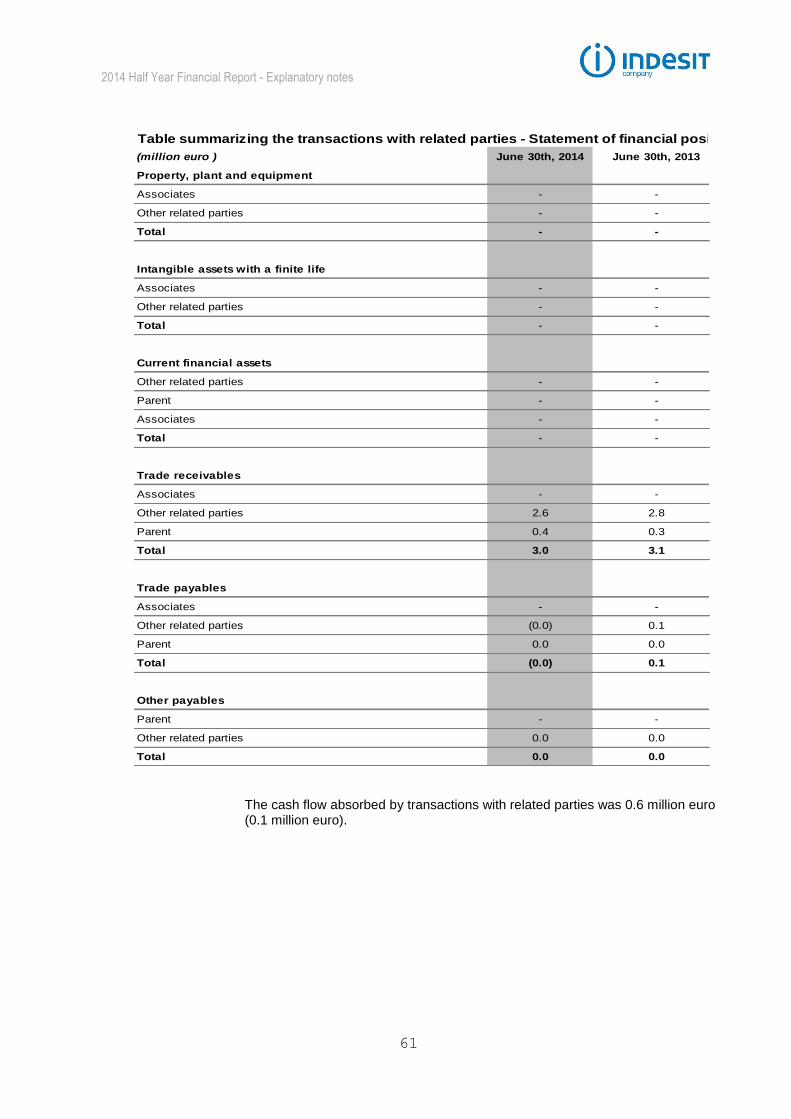
2014 Half Year Financial Report - Explanatory notes
61
(million euro ) June 30th, 2014 June 30th, 2013
Property, plant and equipment
Associates - -
Other related parties - -
Total - -
Intangible assets with a finite life
Associates - -
Other related parties - -
Total - -
Current financial assets
Other related parties - -
Parent - -
Associates - -
Total - -
Trade receivables
Associates - -
Other related parties 2.6 2.8
Parent 0.4 0.3
Total 3.0 3.1
Trade payables
Associates - -
Other related parties (0.0) 0.1
Parent 0.0 0.0
Total (0.0) 0.1
Other payables
Parent - -
Other related parties 0.0 0.0
Total 0.0 0.0
Table summarizing the transactions with related parties - Statement of financial position
The cash flow absorbed by transactions with related parties was 0.6 million euro (0.1 million euro).

2014 Half Year Financial Report - Attachments
62
Attachment 1 List of companies consolidated on a line-by-line basis
Name Registered office Share capital
direct indirect
Aeradriatica SpA Italy EUR 23.068.545 100.00 -
Airdum Ltd UK GBP 15.000 - 100.00
Cannon Industries Ltd UK GBP 1,5 - 100.00
Closed Joint Stock Company Indesit International ZAO Russia RUB 1.664.165.000 100.00 -
Fabrica Portugal Sa Portugal EUR 11.250.000 - 96.40
FCT Cirano France - - -
General Domestic Appliances Holdings Ltd UK GBP 26.000.000 - 100.00
General Domestic Appliances International Ltd UK GBP 100.000 - 100.00
Indesit Argentina SA Argentina ARS 24.070.220 3.00 97.00
Indesit Company Belgium SA Belgium EUR 150.000 - 100.00
Indesit Company Beyaz Esya Pazarlama A.S. Turkey TRY 5.167.994 100.00 -
Indesit Company Beyaz Esya Sanayi ve Ticaret A.S. Turkey TRY 134.038.073 36.16 63.84
Indesit Company Ceská s.r.o Chech Republic CZK 1.000.000 100.00 -
Indesit Company Deutschland GmbH Germany EUR 550.000 - 100.00
Indesit Company France Sas France EUR 17.000.000 - 100.00
Indesit Company International Business Sa Switzerland SFR 250.000 - 100.00
Indesit Company International Bv The Netherlands EUR 272.270 - 100.00
Indesit Company Luxembourg Sa Luxembourg EUR 117.977.729 100.00 -
Indesit Company Magyarország Kft Hungary HUF 25.000.000 - 100.00
Indesit Company Nordics AB Sweden SEK 50.000 100.00
Indesit Company Österreich Ges. m.b.h. Austria EUR 18.168,21 - 100.00
Indesit Company Polska Sp.z o.o. Poland PLN 540.876.500 100.00 -
Indesit Company Portugal Electrodomésticos Sa Portugal EUR 1.144.100 0.56 99.44
Indesit Company Uk Holdings Ltd UK EUR 163.000.000 38.65 61.35
Indesit Company UK Ltd UK GBP 76.195.645 - 100.00
Indesit Electrodomesticos Sa Spain EUR 1.000.000 78.95 21.05
Indesit IP Srl Italy EUR 10.000 100.00
Indesit Ireland Ltd Ireland EUR 100.000 - 100.00
Indesit Middle East FZE UAE AED 1.000.000 - 100.00
Indesit Rus Llc Russia RUB 4.340.000 100.00 -
Indesit Ukraine LLC Ukraine UAH 11.234.634 100.00 -
Jackson Appliances Ltd UK GBP 7,5 - 100.00
Merloni Domestic Appliances Ltd UK GBP 90.175.500 19.60 80.40
Olympia Finance srl - Società Unipersonale Italy EUR 12.000 - -
Wuxi Indesit Domestic Appliance Technology Co. Ltd China EUR 900.000 - 100.00
Xpelair Ltd UK GBP 8,25 - 100.00
Group interest
Attachment 2 List of other investments in subsidiaries and associates
Name Registered office Share capital
direct indirect
Indesit Company Bulgaria Srlu Bulgaria BGL 7.805.000 100.00 -
Indesit Company Domestic Appliances Hellas Mepe Greece EUR 18.000 - 100.00
Tradeplace B.V. The Netherlands EUR 30.000 20.00 -
Indesit Company Singapore Pte. Ltd. Singapore SGD 100.000 - 100.00
Group interest

2014 Half Year Financial Report - Attachments
63
Attachment 3 Consolidated income statement for the period ended 30 June 2014, prepared in accordance with Consob Resolution no. 15519 dated 27 July 2006 and Consob Communication no. DEM/6064293 dated 28 July 2006
(million euro) Balances
of which
non
recurring
of which
with
related
parties
Balances
of which
non
recurring
of which
with
related
parties
Revenue 1,184.2 0.6 1,248.1 0.0
Cost of sales (893.2) (0.3) (0.1) (954.0) (1.3) (0.0)
Selling and distribution expenses (209.3) (0.4) 0.0 (218.4) (1.7) -
General and administrative expenses (48.3) (0.5) (7.7) (60.9) (7.6) (9.4)
Operating profit 33.5 14.7
Interest expenses (12.8) - - (12.7) - -
Interest income (14.9) - - (8.2) - -
Exchange rate differences and other net financial expenses (2.2) - - (2.3) - -
Share of profit (losses) of associates 0.0 - - 0.0 - -
Profit before tax 3.6 (8.4)
Income tax (4.5) - (8.8) - -
Profit for the year (0.9) (17.2)
Percentage weight over consolidated income statements
itemsBalances
of which
non
recurring
of which
with
related
parties
Balances
of which
non
recurring
of which
with
related
parties
Revenue 100% 0.0% 0.0% 100% 0.0% 0.0%
Cost of sales 100% 0.0% 0.0% 100% 0.1% 0.0%
Selling and distribution expenses 100% 0.2% 0.0% 100% 0.8% 0.0%
General and administrative expenses 100% 1.1% 16.0% 100% 12.4% 15.4%
Operating profit 100% 100%
Interest expenses 100% 0.0% 0.0% 100% 0.0% 0.0%
Interest income 100% 0.0% 0.0% 100% 0.0% 0.0%
Exchange rate differences and other net financial expenses 100% 0.0% 0.0% 100% 0.0% 0.0%
Share of profit (losses) of associates 100% 0.0% 0.0% 100% 0.0% 0.0%
Profit before tax 100% 100%
Income tax 100% 0% na 100% 0.0% na
Profit for the year 100% 100%
June 30th, 2014 June 30th, 2013
June 30th, 2014 June 30th, 2013

2014 Half Year Financial Report - Attachments
64
Attachment 4 Consolidated statement of financial position at 30 June 2014, prepared in accordance with Consob Resolution no. 15519 dated 27 July 2006 and Consob Communication no. DEM/6064293 dated 28 July 2006 At 30 June 2014 and 30 June 2013 there were no non-recurring items.
Million euro and percentage weight over
Consolidated Balance Sheet itemsBalances
of which with
related parties
Weight
%Balances
of which with
related partiesWeight %
Assets
Property, plant and equipment 594.6 - - 624.4 - -
Goodwill and other intangible assets with an indefinite useful life 249.6 - - 233.6 - -
Other intangible assets with a finite life 96.0 - - 98.3 - -
Investments in associates 0.5 - - 0.5 - -
Other non-current assets 2.2 - - 1.5 - -
Deferred tax assets 133.0 - - 116.8 - -
Other non-current financial assets 2.0 - - 1.9 - -
Total non-current assets 1,077.9 - 1,077.0 -
Inventories 378.4 - - 403.0 - -
Trade receivables 490.2 0.0 0.0% 529.2 0.0 0.0%
Current financial assets 11.0 - - 31.2 - -
Tax receivables 17.5 - - 14.8 - -
Other receivables and current assets 87.2 - - 75.1 - -
Cash and cash equivalents 125.0 - 197.9 - -
Assets held for sale - - - 2.9 - -
Total current assets 1,109.2 1,254.1
Total assets 2,187.1 2,331.2
Equity
Share capital 92.9 - - 92.8 - -
Reserves (173.8) - - (162.6) - -
Retained earnings 563.4 - - 558.9 - -
Profit attributable to owners of the Parent (0.9) - - (17.2) - -
Equity attributable to owners of the Parent 481.5 - 471.9 -
Non-controlling interests 0.0 - - 0.0 - -
Total equity 481.5 - 471.9 -
Liabilities
Non-current loans and borrowings 340.8 - - 518.4 - -
Employee benefits 79.5 - - 72.3 - -
Provisions for risks and charges 59.0 - - 54.8 - -
Deferred tax liabilities 41.1 - - 32.3 - -
Other non-current liabilities 17.8 - - 24.9 - -
Total non-current liabilities 538.3 - 702.7 -
Banks and other loans and borrowings 294.8 - - 232.5 - -
Provisions for risks and charges 48.8 - - 52.7 - -
Trade payables 709.2 (0.0) (0.0%) 735.1 0.0 0.0%
Tax payables 10.5 - - 23.7 - -
Other payables 104.1 - - 112.6 - -
Total current liabilities 1,167.4 1,156.6
Total liabilities 1,705.7 1,859.2
Total equity and liabilities 2,187.1 2,331.2
June 30th, 2014 June 30th, 2013
Milan, 30 July 2014 for the Board of Directors The Chairman Marco Milani
Attestation in respect of the Company’s abbreviated half-yearly consolidated financial statements in accordance with art. 81-ter of Consob Regulation 11971 of 14 May 1999 and subsequent amendments and additions
The Chief Executive Officer Marco Milani and the Manager charged with preparing the company’s financial reports Stefano Cavacini of Indesit Company S.p.A, pursuant to the provisions of Article 154-bis, clauses 3 and 4, of Legislative Decree no. 58 of 1998, hereby attest to:
the adequacy with respect to the Company structure, and
the effective application, of the administrative and accounting procedures applied in the preparation of the Company’s abbreviated half-yearly consolidated financial statements as at 30 June 2014.
The undersigned moreover attest that the abbreviated half-yearly consolidated financial statements: a) have been prepared in accordance with International Financial Reporting
Standards, as endorsed by the European Union through Regulation (EC) 1606/2002 of the European Parliament and Counsel, dated 19 July 2002;
b) correspond to the results documented in the books, accounting and other records;
c) provide a fair and correct representation of the financial conditions, results of operations and cash flows of the Company and its consolidated subsidiaries as at 30 June 2014.
The interim management Report contains a reliable analysis of the reference to the important events affecting the Company during the first six month of the current fiscal year, including the impact of such events on the Company’s abbreviated half-yearly consolidated financial statements and a description of the principal risks and uncertainties for the remaining six months of the year along with a description of material related party transactions. 30 July 2014
The Chief Executive Officer The manager charged with preparing Marco Milani the company’s financial reports Stefano Cavacini

Indesit Company S.p.A.Interim condensed consolidated financial statements as of June 30, 2014
Auditors’ review reporton the interim condensed consolidated financialstatements

Reconta Ernst & Young S.p.A.Sede Legale: 00198 Roma - Via Po, 32Capitale Sociale € 1.402.500,00 i.v.Iscritta alla S.O. del Registro delle Imprese presso la C.C.I.A.A. di RomaCodice fiscale e numero di iscrizione 00434000584P.IVA 00891231003Iscritta all’Albo Revisori Contabili al n. 70945 Pubblicato sulla G.U. Suppl. 13 - IV Serie Speciale del 17/2/1998Iscritta all’Albo Speciale delle società di revisioneConsob al progressivo n. 2 delibera n.10831 del 16/7/1997
A member firm of Ernst & Young Global Limited
Reconta Ernst & Young S.p.A.Via Thomas Edison, 4/660027 Osimo (AN)
Tel: +39 071 7108676Fax: +39 071 7108471ey.com
Auditors’ review report on the interim condensed consolidated financial statements(Translation from the original Italian text)
To the Shareholders ofIndesit Company S.p.A.
1. We have reviewed the interim condensed consolidated financial statements, comprisingthe balance sheet, the income statement, the statement of comprehensive income, thestatement of changes in equity, the cash flow statement and the related explanatorynotes, of Indesit Company S.p.A. and its subsidiaries (the “Indesit Company Group”) asof June 30, 2014. Management of Indesit Company S.p.A. is responsible for thepreparation of the interim condensed consolidated financial statements in conformitywith the International Financial Reporting Standards applicable to interim financialreporting (IAS 34) as adopted by the European Union. Our responsibility is to issue thisreview report based on our review.
2. We conducted our review in accordance with review standards recommended byConsob (the Italian Stock Exchange Regulatory Agency) in its Resolution no. 10867 ofJuly 31, 1997. Our review consisted mainly of obtaining information on the accountsincluded in the interim condensed consolidated financial statements and theconsistency of the accounting principles applied, through discussions withmanagement, and of applying analytical procedures to the financial data presented inthese consolidated financial statements. Our review did not include the application ofaudit procedures such as tests of compliance and substantive procedures on assets andliabilities and was substantially less in scope than an audit conducted in accordance withgenerally accepted auditing standards. Accordingly, we do not express an audit opinionon the interim condensed consolidated financial statements as we expressed on theannual consolidated financial statements.
With respect to the consolidated financial statements of the prior year and the interimcondensed consolidated financial statements of the corresponding period of the prioryear, presented for comparative purposes reference should be made to our reportsissued on April 1, 2014 and on July 31, 2013, respectively.
3. Based on our review, nothing has come to our attention that causes us to believe thatthe interim condensed consolidated financial statements of Indesit Company Group asof June 30, 2014 are not prepared, in all material respects, in conformity with theInternational Financial Reporting Standards applicable to interim financial reporting(IAS 34) as adopted by the European Union.
Ancona, July 31, 2014
Reconta Ernst & Young S.p.A.Signed by: Gianluca Focaccia, Partner
This report has been translated into the English language solely for the convenience of internationalreaders

Relaz
ione
fina
nziar
ia se
mes
trale
al 30
giu
gno
2014
www.indesitcompany.com