hse report 2012 - novartis.com | hse report 2012 basis of achievement continuing management...
TRANSCRIPT

HSE Report 2012
2 | HSE Report 2012
Content
How we report 3
Reporting entity and scope 4
Health and safety performance 5Lost Time Injury and Illness Rate 5
Total Recordable Case Rate 7
Occupational injury and illness 8
Occupational injury to third party personnel 11
Occupational injury to contractors 12
Resources and environment performance 13Production 13
Energy use 15
Water use 18
Greenhouse gas emissions 23
Ozone depleting substances 29
Volatile organic compounds emissions 31
Inorganic air pollutants 34
Emissions into water 37
Total operational waste 42
Sustainable packaging initiative 43
Non-hazardous waste 44
Hazardous waste 46
HSE targets 2008 – 2015 48

3 | HSE Report 2012
How we reportThe HSE data management system, data collection process and transparent reporting are important
elements of corporate responsibility at Novartis.
Novartis reports its HSE performance following Global Reporting Initiative (GRI) guidelines for sus-
tainability reporting. We publish a stand-alone GRI report each year. The Novartis GRI report uses
the GRI G3 sustainability reporting guidelines at an application level of A+, checked and confirmed
by the GRI.
Download the 2011 Novartis GRI report >
Novartis sets HSE targets covering at least three years to allow better analysis, planning and
implementation. Divisions are involved in target-setting, based on recommendations by functional
experts. Progress is reviewed annually with each division.
Learn more about HSE targets >
Performance of operating units is monitored on a monthly basis. HSE performance data is collected,
validated and consolidated with the Novartis HSE data management system. This system
provides all management levels throughout the Group with necessary information to take early
action if deviations from targets occur. Systems and processes are reviewed by third parties – in
addition to corporate and divisional HSE audits – to ensure compliance with legal and Novartis
HSE standards.
The 2012 environmental and resource data published in the Novartis Annual Report are actual
data for the period from January through September and best estimates for the period from
October through December; 2012 data on employees and health/safety are actual from January
through December. This section will be updated with finalized data for 2012 in the first quarter
of 2013 and significant deviations from the Annual Report will be explained.
The 2012 HSE figures are summarized in the table below and are published in the 2012
Annual Report.
Access the summarized 2012 HSE performance data >

4 | HSE Report 2012
Reporting entity and scope
HSE performance data for 2012 was collected from 283 reporting units owned and managed by
Novartis Group companies and includes 28 Alcon reporting units. This covers all sites with
relevant HSE impacts – including all production, formulation and research and development
sites, as well as major headquarters offices. Our HSE data reporting covers nearly all Novartis
employees, third party personnel and contractors, i.e., staff who regularly work on a Novartis site,
such as cleaning, catering, security, engineering and maintenance personnel, and a minimum of
one month per year for Novartis. Cumulative HSE data for Novartis includes Alcon from 2011
onwards. Novartis believes the performance data presented in its Annual Report and on its web-
site represents a fair and balanced picture of the company’s HSE performance. Performance
indicators follow GRI requirements for core environmental and social indicators and for selected
additional indicators that we deem relevant.
Reported data describe our major material flows within company boundaries and environ mental
impacts originating from our own operations (Scope 1), as well as greenhouse gas emissions
from the generation of purchased energy (Scope 2). With the exception of specific products (where
life-cycle analyses have been carried out) and of dedicated parameters, we do not monitor environ-
mental impacts linked to the manufacturing and delivery of purchased goods and services, or the
use of resources and other related emissions for activities outside company boundaries (Scope 3).

5 | HSE Report 2012
Health and safety performance
Lost Time Injury and Illness Rate
Novartis reports work-related injuries or illnesses among its Group company associates that have
occurred during the year. The Novartis Lost Time Injury and Illness Rate (LTIR) is a key performance
indicator, enabling direct comparison between the performance of our units and on a country-by-
country basis.
In 2012, the LTIR for continuing operations at Novartis (including Alcon) was further reduced to
0.14 per 200,000 hours, from 0.19 the previous year; this represents a 25% reduction.
*2011 LTIR excluded Alcon
Target 2011 Achievement 2011 Target 2012 Achievement
2012
Novartis Group ≤ 0.18* 0.15* ≤ 0.19 0.14
Pharmaceuticals ≤ 0.18 0.13 ≤ 0.15 0.12
Vaccines & Diagnostics ≤ 0.18 0.17 ≤ 0.15 0.09
Sandoz ≤ 0.18 0.18 ≤ 0.15 0.15
Alcon - 0.33 ≤ 0.30 0.17
Novartis Research ≤ 0.18 0.09 ≤ 0.15 0.01
Animal Health ≤ 0.18 0.18 ≤ 0.15 0.30
OTC ≤ 0.18 0.22 ≤ 0.15 0.26
(1)
0.34 0.22 0.18 0.19 0.14 Novartis Group
HSE data reflects continuing operations, including Alcon from 2011
0.34
0.22
0.18 0.19
0.14
0.00
0.20
0.40
0.60
2008 2009 2010 2011 2012
LTIR LTIR
0.34 0.22 0.18 0.19 0.14 Novartis Group
HSE data reflects continuing operations, including Alcon from 2011
LTIR
Target 2011 Achievement 2011 Target 2012 Achievement
2012
Novartis Group ≤ 0.18* 0.15* ≤ 0.19 0.14
Pharmaceuticals ≤ 0.18 0.13 ≤ 0.15 0.12
Vaccines & Diagnostics ≤ 0.18 0.17 ≤ 0.15 0.09
Sandoz ≤ 0.18 0.18 ≤ 0.15 0.15
Alcon - 0.33 ≤ 0.30 0.17
Novartis Research ≤ 0.18 0.09 ≤ 0.15 0.01
Animal Health ≤ 0.18 0.18 ≤ 0.15 0.30
OTC ≤ 0.18 0.22 ≤ 0.15 0.26
6 | HSE Report 2012
Basis of achievementContinuing management commitment and rigorous application of safety systems and procedures,
combined with ongoing training for Group company associates, have driven progress in injury and
illness re duction. Several activities to promote safety awareness, including four key measures, are
used by local management and reviewed by divisional HSE teams:
– Walk-through inspections with senior managers on site
– HSE training targeted at 0.1 – 0.5% of total hours worked yearly, depending on the work area
– Percentage of completed items on incident investigation related to total number of
recommendations
– Near misses reported at least 5 – 10 to 1 versus actual incidents
A significant number of units have introduced safety culture initiatives (behavior-based safety
programs) to complement existing measures that provide the backbone for ongoing safety
management at sites.
Tailored safety initiatives have been introduced where relevant, e.g., driver safety for fleet or sales
organizations and laboratory safety for research and development.
All significant incidents without lost time, accidents with lost time and relevant near misses are
investigated. The level and extent of the investigation reflect the seriousness or potential impact of
the event. Suitable processes and criteria (e.g., risk/potential consequences, learning potential)
are put in place to ensure that investigations are carried out adequately. A systematic method (e.g.,
TapRoot®) is applied to guarantee a thorough investigation. In 2012, more than 80 Group company
associates from sites across the world were trained in the TapRoot® methodology.
In-depth risk analysis – in accordance with the Zurich Hazard Analysis (ZHA) methodology – is
fundamental to Novartis operations and contributes substantially to process safety, including the
prevention of fires, explosions, releases and spills.
We provide regular training courses globally in hazard analysis, process safety management
and systematic incident investigations. In 2012, 60 associates from sites across the world were
trained. Tailor-made Laboratory Process Safety Training courses were delivered for more than 250
laboratory associates. In addition, extensive on-the-job HSE training is carried out at all sites.
FatalitiesSince 2005 there have been a total of 10 fatalities of Novartis Group company associates, of
which 9 have are related to traffic incidents while traveling on public roads for business. In 2005,
two road fatalities occurred in Indonesia and the Czech Republic; in 2006, two fatalities occurred
in Indonesia; in 2008 one fatality occurred in Pakistan; in 2010, two fatalities occurred in Ger-
many and China; and in 2011 two fatalities occurred in Ukraine and in the U.S. In 2007, 2009,
and 2012 there were no work-related road fatalities of Novartis associates. However, in 2012,
we recorded one road fatality for a third party sales representative in Finland. Also in 2012 we
recorded the first fatal industrial accident at Novartis, in India.

7 | HSE Report 2012
We recognize the importance of safety at work and when an associate is on the road for Novartis. A
comprehensive driver safety campaign with guidance on how to reduce the number of traffic-related
accidents, as well as increased level of driver safety training is being rolled out worldwide.
Total Recordable Case RateMany injury and illness cases without lost time have the potential to lead to lost time. Identifying
and managing the circumstances in which these incidents occur ultimately reduces the overall risk
of having a serious accident, lost time injuries and illnesses, or even fatalities.
A recordable case includes the following:
– Work-related injury with or without lost time
– Work-related illness with or without lost time
– Work-related loss of consciousness
– Work-related fatality
The Total Recordable Case Rate (TRCR) equals the division of all recordable cases by the hours
worked, multiplied by 200,000 for standardization. In 2012, the Novartis Group TRCR (including
Alcon) was 0.45; down from 0.61 in 2011.
Achievement 2011
Achievement 2012
Novartis Group 0.54 0.45
Pharmaceuticals 0.53 0.43
Vaccines & Diagnostics 0.48 0.34
Sandoz 0.52 0.36
Alcon 0.88 0.57
Novartis Research 0.57 0.45
Animal Health 0.71 0.67
OTC 0.57 0.40
Achievement 2011
Achievement 2012
Novartis Group 0.54 0.45
Pharmaceuticals 0.53 0.43
Vaccines & Diagnostics 0.48 0.34
Sandoz 0.52 0.36
Alcon 0.88 0.57
Novartis Research 0.57 0.45
Animal Health 0.71 0.67
OTC 0.57 0.40
Achievement 2011
Achievement 2012
Novartis Group 0.54 0.45
Pharmaceuticals 0.53 0.43
Vaccines & Diagnostics 0.48 0.34
Sandoz 0.52 0.36
Alcon 0.88 0.57
Novartis Research 0.57 0.45
Animal Health 0.71 0.67
OTC 0.57 0.40

8 | HSE Report 2012
Occupational injury and illness
Injury with Lost Time Total: 167 associates
During 2012, a total of 534 Group company associates suffered work-related injuries. Of these,
167 (2011: 211) led to days off work (integrated into the LTIR).
The distribution of injuries by immediate cause indicates that the most prominent safety issues
are related to non-operational activities, such as slips, trips and falls at offices and sites, and trans-
port accidents within the sales force, which together account for 56% of occupational injuries with
lost time.
Injury with Lost Time Total: 167 associates
42
7
57
11
3
37
2 8
Cuts / Lacerations / Bites
Strains / Sprains
Acute Chemical / Biological Exposure
Transportation
Contact with Object / Equipment
Other
Slips / Trips / Falls
(1) Injury with Lost Time 2012 (Jan – Dec 2012)
Data Output: 11.01.2013
Process Related Injury

9 | HSE Report 2012
Illness Total: 33 associates
Novartis sites reported a total of 33 occupational illnesses in 2012 (2011: 61). Of these, 9 (2011:
13) led to days off work (integrated into the LTIR; representing 5% of the total lost time cases).
There were no recorded chronic poisonings, as a result of the existing preventative health protection
strategy of Novartis with regards to handling of potentially hazardous substances.
The most prominent work-related health issue remains musculoskeletal disease, accounting for
73% of the cases in 2012 (2011: 91%). Six cases led to time off. We also had five accounts of occu-
pational skin disease with one person having to have time off due to an allergic reaction (2011: 3
cases, 1 with lost time). There were also three cases of occupational mental ill health, two of which
resulted in lost time (2011: 2 cases, 1 with lost time).
Illness Total: 33 associates
1
5
22
2
3
Limb Illness
Back Illness
(1) Illness With & Without Lost Time 2012 (Jan – Dec 2012)
Data Output: 11.01.2013
Respiratory Illness
Skin Illness
Other Illness

10 | HSE Report 2012
Be Healthy workplace health and well-being promotion Launched in 2011, Be Healthy is the first Novartis company-wide health and well-being initiative
for the benefit of Novartis Group associates. This initiative builds upon a tradition of providing
health and well-being programs for Group company associates at Novartis. The health and
well-being of associates is a top priority for the Novartis Group and a natural extension of the
company purpose to “care and cure.”
At Novartis a particular focus is placed on prevention because statistics from the World Economic
Forum (WEF) show that workplace health and well-being programs addressing lifestyle changes
can help prevent up to 40% of non-communicable diseases (NCDs) such as cardiovascular dis-
ease, cancer and lung disorders.
Be Healthy aims to help Group company associates around the world embrace healthy lifestyles
by providing opportunities for them to take control of their personal health and help prevent
future health issues in each of four main pillars:
– Move – Exercise
– Choose – Healthy eating
– Know – Importance of knowing your basic health numbers
– Manage – Support to help associates manage their health at work
Novartis Group Company associates also participate in Be Healthy Celebration Week in September
of each year. This is a week-long celebration of health and well-being that includes key aspects of
Be Healthy such as free exercise classes and health screenings. In 2012, Celebration Week was
September 10–14.
Be Healthy has a broad reach within Novartis. In 2011, 76 of the largest Novartis sites across 32
countries were involved which means that the initiative reached 80% of affiliates’ associates. In
2012, the initiative was expanded to 100 additional sites and reached 95% of associates across
more than 50 countries.
Learn more about Be Healthy >

11 | HSE Report 2012
Occupational injury to third party personnel Beyond its Group company associates, Novartis recognizes its responsibility to promote the health
and safety of third party personnel.
Third party personnel are those individuals employed by a third party that invoices Novartis for
hours completed. They work regularly on Novartis premises and receive day-to-day work assignments
from Novartis Group company associates. Some companies refer to these individuals, including
sub-contracted workers, as contractors.
Novartis employed nearly 12,500 people as third party personnel during 2012. There were 145
occupational injuries among this group. Of these, 46 resulted in lost time. There was one fatality
among third party personnel in 2012 caused by a traffic accident.
Since 2011, Novartis also records the hours worked for third party personnel in order to calculate
an LTIR and a TRCR for this population. This allows comparisons with Novartis associates. As for
our own Group company associates, any accident is rigorously investigated in order to reduce the
total number of work-related accidents. Please refer to the table below to see third party personnel
health and safety performance in previous years.
Year Number of TPP Number of Injury Cases w/wo Lost time
2006 7,500 124
2007 7,700 111
2008 7,400 103
2009 7,000 117
2010 8,000 123
2011 11,400 90
2012 12,500 145

12 | HSE Report 2012
Occupational injury to contractors Beyond its Group company associates and third party personnel, Novartis recognizes its responsi-
bility to promote the health and safety of contractors.
Contractors are those individuals employed by companies undertaking work for Novartis within
the terms of a contract or service agreement. As opposed to third party personnel, contractors
receive day-to-day work assignments from their companies’ management and are hired to com-
plete a job on their own. Novartis only reports health and safety data from contractors who
regularly work at a Novartis site, such as cleaning, catering, security, engineering and maintenance
personnel. These contractors, known as “fixed” or “nested” contractors, work a minimum of
1 month per year for Novartis.
As of 2011, Novartis reports the Lost Time Incident Rate for contractors, but not the Total
Recordable Case Rate for this group. Because we cannot precisely determine the number of
cases without lost time for this group on a global level, the rate would be inaccurate and
unreliable.
Novartis employed approximately 21,500 contractors during 2012. There were 98 occupational
injuries with lost time and no fatalities among this group in 2012.

13 | HSE Report 2012
Resources and environment performance
Production
Novartis monitors and reports total production as the total weight of all products delivered from
all Novartis Group companies manufacturing facilities. Total production covers all types of products,
including chemical and fermentation products, active pharmaceutical ingredients (APIs) and
finished dosage forms, as well as eye care products.
Total production for 2012 (including Alcon) was 213kt (2011: 221kt). The biggest contributors
to total weight of products are: Sandoz 85kt, Alcon 78kt, Pharmaceuticals 33kt and Consumer
Health 17kt.
0
50
100
150
200
250
2008 2009 2010 2011 2012*
Alcon
Pharmaceuticals
Sandoz
Animal Health
Ciba Vision
OTC
V&D
kt
- - - 69.38 77.60
27.72 26.97 29.35 29.35 33.34 Pharmaceuticals
84.52 87.69 86.97 85.17 84.95 Sandoz
2.84 2.94 4.04 4.44 4.43 Animal Health
21.90 22.02 24.69 - - Ciba Vision
21.34 24.09 26.87 32.28 12.92 OTC
0.22 0.36 0.26 0.25 0.23 V&D
158.54 164.07 172.18 220.88 213.48 Production total [kt]
HSE data reflects continuing operations, including Alcon from 2011
Ciba Vision included under Alcon from 2011
* Forecast data for 2012
Alcon
kt

14 | HSE Report 2012
Certified management systemsA total of 46 Novartis Group company facilities have ISO 14001 or EMAS certification for their
environmental management systems: Sandoz 16, Alcon 12, Pharmaceuticals 12, Vaccines and
Diagnostics 4, NIBR 1, and Consumer Health 1.
In addition, 29 sites have OHSAS 18001 certification: Sandoz 12, Pharmaceuticals 10, Alcon 3,
Vaccines and Diagnostics 3, and Consumer Health 1.
ISO/EMAS certifications cover 90% of the Vaccines and Diagnostics, 83% of the Pharmaceuticals,
82% of Sandoz and 70% of the Alcon production. OHSAS certifications cover 87% of the
VAccines and Diagnostics, 61% of Pharmaceuticals and 59% of Sandoz production (in terms of
production amounts from certified sites).
FinesNovartis Group companies around the world paid a total of USD 20,363 in fines for minor
HSE violations in 2012.

15 | HSE Report 2012
Energy use
Energy use (in million GJ)
In 2012, total energy use increased by 0.2% from 19.27 million GJ in 2011 to 19.31 million GJ.
Total on-site energy (fuels) increased marginally from 7.97 million GJ to 7.99 million GJ
(up 0.2%). Total purchased energy also increased slightly from 11.30 million GJ in 2011 to
11.32 million GJ (up 0.2%).
Novartis has maintained a high level of less carbon-intensive and renewable energy resources;
91% of on-site energy came from the combustion of natural gas and 2.3% from renewable
sources (decreased compared to 2.5% in 2011). Renewable sources account for approximately
40% of purchased energy, including conventional hydroelectric power. Excluding hydroelectric
power, the renewable energy portion amounts to 4.3% (same as in 2011).
0
2
4
6
8
10
12
2008 2009 2010 2011 2012*
energy, purchased
energy, generated on site
million GJ
9.88 10.03 10.28 11.30 11.32 Energy, purchased7.00 6.95 7.26 7.97 7.99 Energy, generated on site16.88 16.98 17.54 19.27 19.31 Total Energy Consumption [mio GJ]
HSE data reflects continuing operations, including Alcon from 2011* Forecast data for 2012
0
2
4
6
8
10
12
2008 2009 2010 2011 2012*
energy, purchased
energy, generated on site

16 | HSE Report 2012
Energy use by division (in million GJ)
Sandoz (7.54 million GJ) was the largest energy user in the Novartis Group in 2012, followed
by Pharmaceuticals (5.37 million GJ) and Alcon (2.97 million GJ).
Total energy costs for the Novartis Group were USD 420 million for 2012 (USD 422 million in
2011), of which USD 269 million were spent on electricity.
0
5
10
15
20
25
2008 2009 2010 2011 2012*
Alcon
Pharmaceuticals
NIBR
Sandoz
Consumer Health V&D
million GJ
0
5
10
15
20
2008 2009 2010 2011 2012*
Alcon
Pharmaceuticals
NIBR
Sandoz
Consumer Health
V&D
- - - 2.88 2.975.71 5.51 5.60 5.37 5.37 Pharmaceuticals1.16 1.35 1.33 1.27 1.27 NIBR7.36 7.38 7.64 7.66 7.54 Sandoz2.00 1.52 1.52 0.61 0.59 Consumer Health0.65 1.22 1.44 1.48 1.57 Vaccines & Diagnostics16.88 16.98 17.54 19.27 19.31 Total Energy Consumption [mio GJ]
HSE data reflects continuing operations, including Alcon from 2011Consumer Health data includes Animal Health, Ciba Vision & OTC until 2011 CV included under Alcon from 2011* Forecast data for 2012
Alcon

17 | HSE Report 2012
Energy efficiency target achievement and outlookSince 2003, the Novartis Group has successfully introduced energy efficiency targets in all its
divisions. In 2006, a 10% improvement target was set for the period 2007 – 2010 (based on 2006
performance). With a performance improvement of 26% in energy efficiency per sales between
2006 – 2010, this target was overachieved. A new target of 15% improvement of energy efficiency
was set for 2011 – 2015, based on 2010 levels. In 2012, energy efficiency per constant currency
sales improved by 11% compared to 2010, which is 5% above the improvement target for the
two years.
In 2008, Novartis started to report energy savings achieved with energy projects and use this cri-
terion to set energy performance targets for divisions. Each division is expected to implement
energy projects for 10% of its 2008 energy consumption by 2015. As of 2012, total energy savings
achieved with energy projects amount to USD 56 million in terms of energy costs and 2.15 million
GJ in terms of energy. This accounts for 11.8% of the 2008 energy consumption. In view of the
good progress made, Novartis has strengthened the target to implement energy saving projects for
14% of the 2008 energy consumption by 2015, i.e. 2% per year.
We believe these significant achievements result from our ongoing comprehensive energy man-
agement programs. We continue our efforts to further improve our energy performance and
therewith support the related greenhouse gas emission reduction targets. We expect the trend
in improved energy efficiency to continue in future years as a result of our energy efficiency
programs spreading throughout the organization.
Learn more about our GHG emission reduction target >

18 | HSE Report 2012
Water use
Water use (in million m3)
In 2012, total water use decreased from 97.3 in 2011 to 94.7 million cubic meters. A total of
30.5 million cubic meters (32%) of the total quantity of water (contact and non-contact cool-
ing water) that Novartis uses is purchased from water suppliers, and 64.4 million cubic meters
(68%) is abstracted from groundwater wells or surface water bodies (directly from the environ-
ment), mainly for cooling purposes.
0
20
40
60
80
2008 2009 2010 2011 2012*
Cooling water
Contact water 0
20
40
60
80
2008 2009 2010 2011 2012*
Cooling water
Contact water
0
20
40
60
80
2008 2009 2010 2011 2012*
Cooling water
Contact water
million m3
64.03 68.15 75.84 80.23 77.50 Cooling water15.1 15.0 15.1 17.1 17.2 Contact water79.15 83.19 90.92 97.35 94.71 Total Water Use [mio m3]
HSE data reflects continuing operations, including Alcon from 2011* Forecast data for 2012
3

19 | HSE Report 2012
Contact water use by division (in million m3)
The use of contact water slightly increased in 2012 to 17.2 million cubic meters (up from 17.1
million cubic meters in 2011). Major users of contact water were Sandoz (48%), Pharmaceuticals
(23%) and Alcon (16%). During 2012, Sandoz decreased contact water use by approximately
0.7 million cubic meters or by 0.9%.
0
5
10
15
20
2008 2009 2010 2011 2012*
Alcon
Pharmaceuticals
NIBR
Sandoz
Consumer Health
V&D
million m3
- - 2.74 2.794.19 4.09 4.05 4.07 3.95 Pharmaceuticals0.52 0.60 0.55 0.55 0.56 NIBR7.98 7.84 7.82 8.32 8.25 Sandoz1.56 1.58 1.63 0.42 0.54 Consumer Health0.87 0.93 1.02 1.01 1.12 Vaccines & Diagnostics15.11 15.04 15.08 17.12 17.21 Total contact water use [mio m3]
HSE data reflects continuing operations, including Alcon from 2011Consumer Health data includes Animal Health, Ciba Vision & OTC until 2011 CV included under Alcon from 2011* Forecast data for 2012
Alcon - - 2.74 2.794.19 4.09 4.05 4.07 3.95 Pharmaceuticals0.52 0.60 0.55 0.55 0.56 NIBR7.98 7.84 7.82 8.32 8.25 Sandoz1.56 1.58 1.63 0.42 0.54 Consumer Health0.87 0.93 1.02 1.01 1.12 Vaccines & Diagnostics15.11 15.04 15.08 17.12 17.21 Total contact water use [mio m3]
HSE data reflects continuing operations, including Alcon from 2011Consumer Health data includes Animal Health, Ciba Vision & OTC until 2011 CV included under Alcon from 2011* Forecast data for 2012
Alcon
3
20 | HSE Report 2012
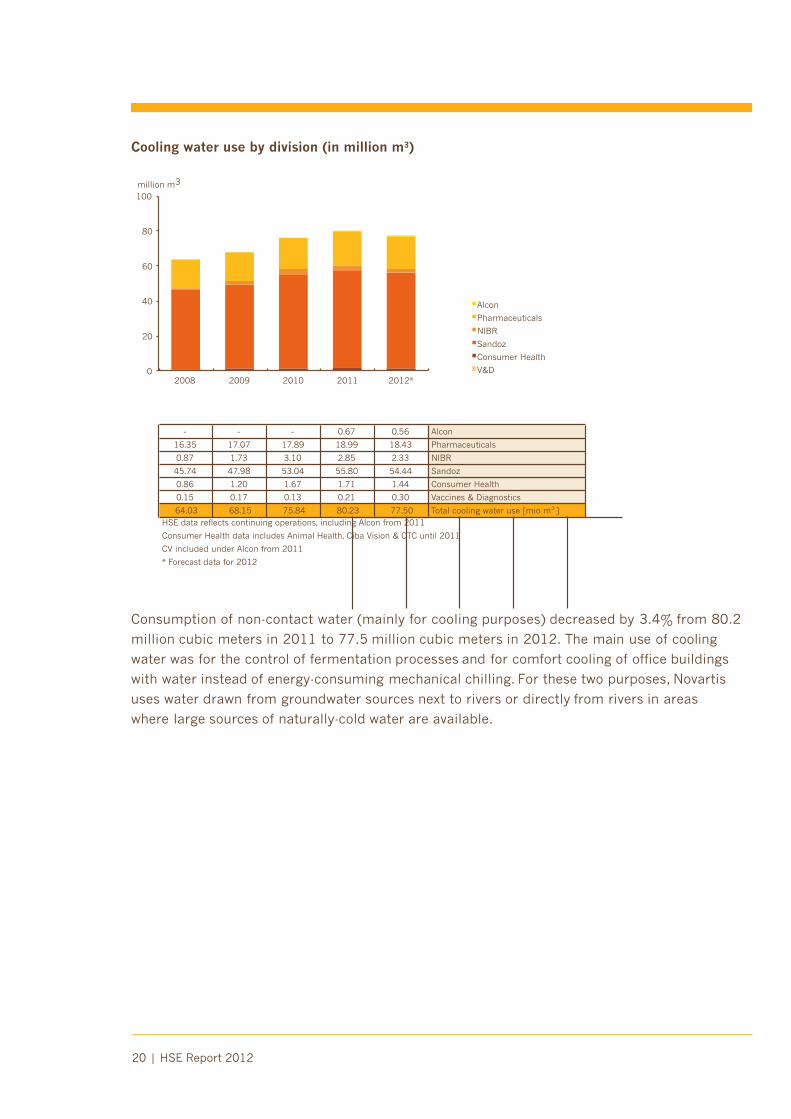
Cooling water use by division (in million m3)
Consumption of non-contact water (mainly for cooling purposes) decreased by 3.4% from 80.2
million cubic meters in 2011 to 77.5 million cubic meters in 2012. The main use of cooling
water was for the control of fermentation processes and for comfort cooling of office buildings
with water instead of energy-consuming mechanical chilling. For these two purposes, Novartis
uses water drawn from groundwater sources next to rivers or directly from rivers in areas
where large sources of naturally-cold water are available.
0
20
40
60
80
100
2008 2009 2010 2011 2012*
Alcon
Pharmaceuticals
NIBR
Sandoz
Consumer Health
V&D
million m3
- - - 0.67 0.5616.35 17.07 17.89 18.99 18.43 Pharmaceuticals0.87 1.73 3.10 2.85 2.33 NIBR45.74 47.98 53.04 55.80 54.44 Sandoz0.86 1.20 1.67 1.71 1.44 Consumer Health0.15 0.17 0.13 0.21 0.30 Vaccines & Diagnostics64.03 68.15 75.84 80.23 77.50 Total cooling water use [mio m3]
HSE data reflects continuing operations, including Alcon from 2011Consumer Health data includes Animal Health, Ciba Vision & OTC until 2011 CV included under Alcon from 2011* Forecast data for 2012
Alcon
3

21 | HSE Report 2012
Water input by source (in million m3)
0
20
40
60
80
100
2008 2009 2010 2011 2012*
Utility
Aquatic Environ.
As Raw Material
Other
million m3
20.97 22.23 25.68 30.29 30.48 Utility
57.33 61.02 65.29 67.29 64.39 Aquatic Environ.
0.00 0.00 0.00 0.00 0.00 As Raw Material
0.09 0.19 0.15 0.16 0.02 Other
78.39 83.44 91.12 97.74 94.90 Water input by source [mio m3]
HSE data reflects continuing operations, including Alcon from 2011
* Forecast data for 2012
3

22 | HSE Report 2012
Water efficiency target achievement and outlookWhile strategies on water abstraction and the use of cooling water vary from site to site, we have
made concerted efforts to further reduce the use of contact water that requires treatment, both in
order to reduce pollutant loads, and because this is a growing environmental and cost factor.
Novartis set an efficiency improvement target on contact water of 10% for the period 2006 to
2010 (based on 2005 performance), translating to an average 2% annual improvement. Novartis
defines contact water efficiency as contact water use per sales in constant currencies. This target
was extended until 2012 with an additional 4% contact water efficiency improvement for the two
additional years (2011 and 2012). Contact water efficiency increased by 6.4% between 2010
and 2012.
As an example, at its production facility on the island of Batam in Indonesia, where fresh water is a
scarce resource, the Alcon Division’s contact lens facility achieved considerable water savings dur-
ing 2011 and 2012. The use of city water for sanitary purposes has been reduced and the reject
water from reverse osmosis is now being recycled for use in flushing systems. The condensate
recovered from the product sterilization process is being reused as preheated supply water for the
steam boiler, saving both water and energy. Over the past two years, this program has enabled the
site to reduce its annual purchase of water and other water related costs by USD 37,000 or almost
20% of total water cost. Total water consumption was reduced by 23,000 m3 (17%). The invest-
ment needed for the program were around USD 32,000, which was paid back within less than a
year.
At the Sandoz site in Kalwe near Mumbai, India 25% of the total water used or about 30,000 m3
is needed in the cooling tower as make-up water. All incoming water must be firstly treated at the
site to match potable water quality. The procedure has now been changed to use recycled waste
water for the cooling tower. The waste water is processed by reverse osmosis in the site-owned
wastewater treatment plant to meet local government norms for drainage. This water is ideally
suited to be recycled in the cooling tower. The site’s need for water intake was reduced by 21%,
accounting for a water cost saving of USD 13,000 per year. Capital investment for the changes
was only USD 2 000, which was paid back within two months. In the Mumbai metropolitan area,
clean fresh water is scarce and expensive. So although this is a small project in terms of dollars, it
has a very big impact on water savings at the site.
Water scarcityNovartis determines the level of water scarcity at all its industrial locations globally based on the
World Business Council for Sustainable Development (WBCSD) Global Water Tool, and the
availability of water based on estimates by the World Resources Institute (WRI). Sites located in
areas where water is highly scarce or scarce are identified, and their specific risks considered
in a risk portfolio. Sites with high level of water scarcity and high water usage are included in a
corporate water saving program.

23 | HSE Report 2012
Greenhouse gas emissions
GHG emissions (in kt)
For the fourth consecutive year, the Novartis Group achieved a reduction in total greenhouse gas
(GHG) emissions in 2012 from 1,703kt in 2011 to 1,651kt (down 3.0%).
180.0 174.4 166.1 191.7 174.2 Scope 1 GHG Vehicles [kt]
405.5 399.8 416.3 462.0 457.5 Scope 1 GHG on site [kt]
937.6 934.4 921.7 1'048.9 1'018.9 Scope 2 GHG total [kt]
1'523.2 1'508.6 1'504.0 1'702.5 1'650.7 Total GHG total [kt]
HSE data reflects continuing operations, including Alcon from 2011
* Forecast data for 2012
0
200
400
600
800
1000
2008 2009 2010 2011 2012*
Scope 1 GHG vehicles
Scope 1 GHG on-site
Scope 2 GHG
kt kt
0
200
400
600
800
1000
2008 2009 2010 2011 2012*
Scope 1 GHG vehicles
Scope 1 GHG on-site
Scope 2 GHG
kt
0
200
400
600
800
1000
2008 2009 2010 2011 2012*
Scope 1 GHG vehicles
Scope 1 GHG on-site
Scope 2 GHG
kt

24 | HSE Report 2012
GHG emissions, Scope 1, combustion and process by division (in kt)
The total amount of Scope 1 GHGs, mainly carbon dioxide (CO2) emitted from on-site combustion
of fossil fuels in 2012 was 458kt, a 1.0% decrease compared to 2011 (462kt). Emission of other
GHGs (hydrofluorocarbons from refrigeration systems), included in the above amount, totaled 6kt.
GHG emissions from production processes, also included in the Scope 1 GHG total, amounted
to approximately 3kt. GHG emissions of non-Kyoto gases, such as hydrochlorofluorocarbons
(HCFCs) totaled approximately 30kt, primarily HCFC124 which is used as a purging gas at an
Alcon facility in the US.
- - - 63.16 66.43
157.52 145.32 142.90 135.93 129.73 Pharmaceuticals
14.69 19.56 18.47 16.56 18.89 NIBR
179.43 177.26 188.29 189.40 182.74 Sandoz
28.04 28.83 28.25 18.33 16.93 Consumer Health
25.81 28.87 38.38 38.57 42.83 Vaccines & Diagnostics
405.49 399.84 416.30 461.96 457.55 On Site Scope 1 GHG [kt]
HSE data reflects continuing operations, including Alcon from 2011
Consumer Health data includes Animal Health, Ciba Vision & OTC until 2011
CV included under Alcon from 2011
* Forecast data for 2012
Alcon
0
100
200
300
400
500
2008 2009 2010 2011 2012*
Alcon
Pharmaceuticals
NIBR
Sandoz
Consumer Health
V&D
kt kt

25 | HSE Report 2012
GHG emissions, Scope 1 from vehicles (in kt)
Scope 1 GHG emissions from the use of company-owned or leased vehicles are reported separately.
In 2012, this totaled 174kt, compared to 192kt in 2011 (a 9.1% decrease). When including Alcon data
in the 2010 baseline for the current target, Scope 1 GHG emissions from vehicles have decreased by
19.4%. This decrease is due to the use of more efficient fleet vehicles. Scope 2 GHG emissions (mainly
from electricity generation) in 2012 totaled 1,019kt, which represents a reduction of about 2.9% from
1,049kt in 2011.
0
50
100
150
200
2008 2009 2010 2011 2012*
Alcon
Pharmaceuticals
NIBR
Sandoz
Consumer Health
Vaccines & Diagnostics
kt
- - - 46.72 40.08
132.13 126.78 118.26 100.58 88.50 Pharmaceuticals
0.12 0.16 0.15 0.14 0.14 NIBR
26.01 25.29 24.78 26.79 27.27 Sandoz
20.10 19.08 18.25 13.27 13.99 Consumer Health
1.68 3.06 4.64 4.21 4.25 Vaccines & Diagnostics
180.04 174.36 166.08 191.72 174.22 Vehicle Scope 1 GHG [kt]
HSE data reflects continuing operations, including Alcon from 2011
Consumer Health data includes Animal Health, Ciba Vision & OTC until 2011
CV included under Alcon from 2011
* Forecast data for 2012
Alcon
0
100
200
300
400
500
2008 2009 2010 2011 2012*
Alcon
Pharmaceuticals
NIBR
Sandoz
Consumer Health
V&D
kt kt
26 | HSE Report 2012
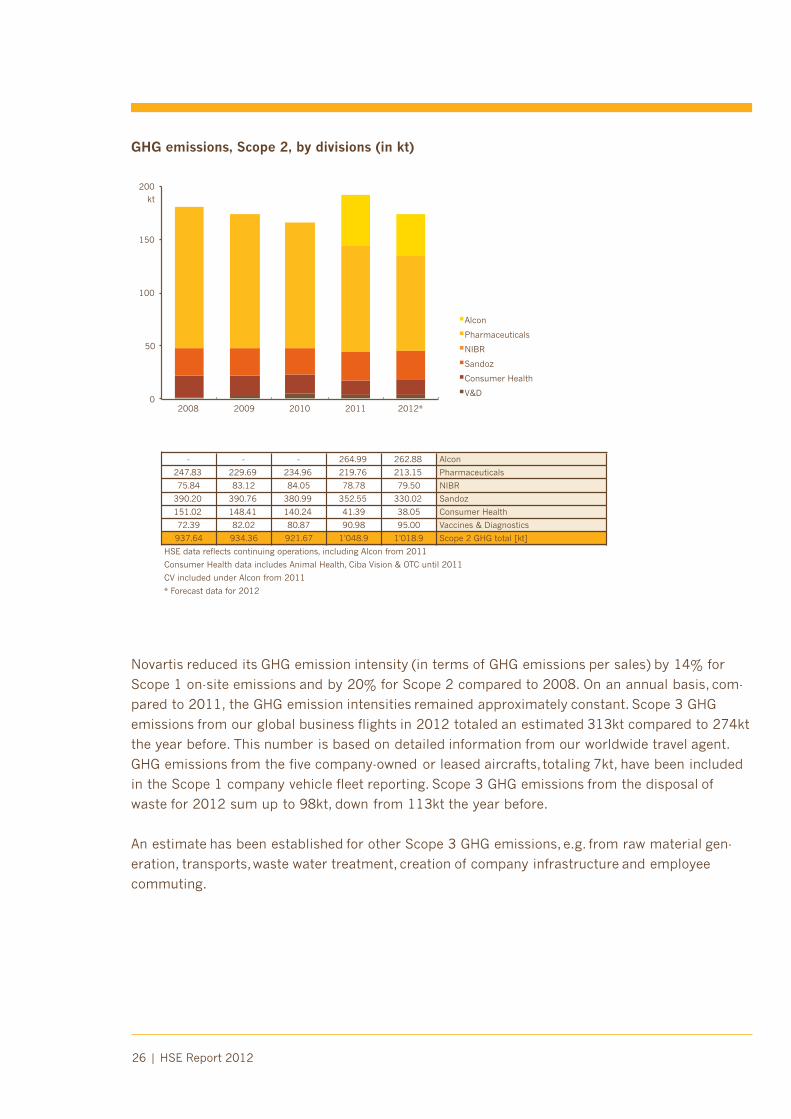
GHG emissions, Scope 2, by divisions (in kt)
Novartis reduced its GHG emission intensity (in terms of GHG emissions per sales) by 14% for
Scope 1 on-site emissions and by 20% for Scope 2 compared to 2008. On an annual basis, com-
pared to 2011, the GHG emission intensities remained approximately constant. Scope 3 GHG
emissions from our global business flights in 2012 totaled an estimated 313kt compared to 274kt
the year before. This number is based on detailed information from our worldwide travel agent.
GHG emissions from the five company-owned or leased aircrafts, totaling 7kt, have been included
in the Scope 1 company vehicle fleet reporting. Scope 3 GHG emissions from the disposal of
waste for 2012 sum up to 98kt, down from 113kt the year before.
An estimate has been established for other Scope 3 GHG emissions, e.g. from raw material gen-
eration, transports, waste water treatment, creation of company infrastructure and employee
commuting.
0
50
100
150
200
2008 2009 2010 2011 2012*
Alcon
Pharmaceuticals
NIBR
Sandoz
Consumer Health
Vaccines & Diagnostics
kt
- - - 264.99 262.88
247.83 229.69 234.96 219.76 213.15 Pharmaceuticals
75.84 83.12 84.05 78.78 79.50 NIBR
390.20 390.76 380.99 352.55 330.02 Sandoz
151.02 148.41 140.24 41.39 38.05 Consumer Health
72.39 82.02 80.87 90.98 95.00 Vaccines & Diagnostics
937.64 934.36 921.67 1'048.9 1'018.9 Scope 2 GHG total [kt]
HSE data reflects continuing operations, including Alcon from 2011
Consumer Health data includes Animal Health, Ciba Vision & OTC until 2011
CV included under Alcon from 2011
* Forecast data for 2012
Alcon
0
100
200
300
400
500
2008 2009 2010 2011 2012*
Alcon
Pharmaceuticals
NIBR
Sandoz
Consumer Health
V&D
kt kt

27 | HSE Report 2012
GHG emission target achievement and outlookIn 2005, Novartis made a voluntary commitment to reduce Scope 1 on-site GHG emissions to
the global average level prescribed in the Kyoto Protocol, i.e. 5% below the 1990 level by 2012.
This commitment forms a major part of the Novartis Group environmental targets and programs
enacted in 2005. It strongly correlates with the targets that were already in place on energy effi-
ciency improvement and on energy projects.
In relation to the above GHG target, emissions (excluding Alcon acquired in 2010) have been
assessed for the 1990 reference year, based on the level of Novartis business activities in 1990.
Global direct on-site GHG emissions in 1990 have been calculated at 308kt. Taking the con-
tinued growth of business as well as energy efficiency and emission reduction initiatives into
account, emissions were expected to rise on average by some 2% per year. While this was the
case between 1990 and 2005, Scope 1 GHG emissions remained more or less constant since
2005 despite the growth of the business.
With 404kt Scope 1 on-site GHG emissions for 2012, Novartis on-site emissions are about 30%
above the Kyoto target of 5% below the 1990 levels, i.e. 293kt. In 2012 Novartis closed this gap
with carbon offsets of 114kt from its own afforestation projects in Argentina and with 2kt with the
Jatropha agro-forestry project in Mali.
Between 2006 and 2010, Novartis has reduced Scope 1 GHG emissions from its owned or leased
vehicle fleet by 17%, well above the 10% reduction target set for this period. In 2010, a new 10%
reduction target on fleet GHG emissions was set for 2015. Reductions were achieved thanks to
more fuel-efficient vehicles through the introduction of hybrid gasoline-electric cars, increased use
of diesel engines fitted with particulate filters, and other emission-reduction options such as liquid
natural gas or bio-fuels. The 2015 target has been adjusted to 20% reduction compared to 2010
emissions.
In 2010, Novartis set new targets on total GHG emissions for 2015 and 2020, respectively a 15%
and 20% reduction compared to 2008. These are in line with targets set by leading countries. We
intend to compensate part of our total GHG emissions with carbon offsets in order to achieve
our 2015 and 2020 targets.
When including Alcon data for 2008, total GHG emissions for Novartis have decreased by 6.8%
between 2008 and 2012. This good performance results from increased energy efficiency and
use of renewable energy, as well as other GHG emission reduction measures. We continue to
strengthen our efforts and investments in more energy-efficient technology and the use of renew-
able sources in order to further reduce total GHG emissions in the coming years.

28 | HSE Report 2012
While our main focus is to lower GHG emissions through internal improvement programs, the
Novartis Group is also taking advantage of carbon-offset options included in the Kyoto Protocol, such
as the United Nations Clean Development Mechanism (CDM) and voluntary offset schemes. These
schemes are designed to offset the amount of carbon released into the atmosphere by removing
GHGs elsewhere through the use of renewable energy, energy conservation or carbon sequestra-
tion into biomass.
We believe carefully selected carbon-offset projects can help to foster long-term economic
growth for local populations in developing economies, while also supporting Novartis in meeting
its Group GHG reduction target. Novartis has established its own carbon-offset projects in
Latin America, Africa and China.
Learn more about our carbon-offset projects >

29 | HSE Report 2012
Ozone depleting substances
Priority gas inventories (in t)
In accordance with the guidelines for sustainability reporting of the Global Reporting Initiative
(GRI), Novartis reports on the inventory and emission of ozone depleting substances (ODS).
Ozone depleting substances inventory and emissionsFor 2012, Novartis sites globally reported a total inventory of 119.8t of ozone depleting sub-
stances (ODS), compared to 125.5t in 2011. The 2012 figure includes 0.08t of chlorofluorocar-
bon (CFC), 113.4t of hydrochlorofluorocarbon (HCFC) refrigerants, and 6.4t of halons. Addition-
ally, HCFC inventories are continually replaced with chlorine-free hydrofluorocarbons (HFCs)
or with natural refrigerants. In 2012, HFCs – which have an ODS factor of zero – amounted to
130.3t for Novartis.
Emissions caused by ODS losses in 2012, reported in tons of R11-equivalents, were calculated for
the Group at 942kg (1,075kg in 2011). The largest ODS emissions by Novartis Division were: 769kg
R11e from Alcon, 102kg Pharmaceuticals and 46kg Sandoz. Ozone depleting substances are not
included in any Novartis product.
0
50
100
150
200
250
300
2008 2009 2010 2011 2012*
CFC Inventories [t]
HCFC Inventories [t]
Halons Inventories [t]
HFC Inventories [t]
t
2.37 1.91 1.92 1.76 0.08 CFC Inventories [t]
83.81 89.55 92.23 116.62 113.37 HCFC Inventories [t]
7.16 7.31 6.19 7.08 6.37 Halons Inventories [t]
53.71 70.10 124.84 128.58 130.31 HFC Inventories [t]
HSE data reflects continuing operations, including Alcon from 2011
* Forecast data for 2012
t

30 | HSE Report 2012
Novartis intends to minimize the use of synthetic refrigerant materials. Natural refrigerant
materials are the preferred alternative in new equipment. Novartis had set the target to elimi-
nate CFCs from its global operations by the end of 2012. The target was not fully achieved, with
only 95.5% of the inventory being eliminated. The remaining 79.6kg will be eliminated during
2013. Remaining Halons will also be eliminated in 2013. HCFCs in existing equipment are being
replaced when refilling becomes necessary.

31 | HSE Report 2012
Volatile organic compounds emissions
VOC emissions (in t)
0
500
1000
1500
2000
2008 2009 2010 2011 2012*
Halogenated VOCs
Non-Halogenated VOCs
t t
231.23 215.01 244.14 146.97 109.73 Halogenated VOCs [t]1'655.17 1'507.22 1'276.87 1'070.76 933.71 Non-Halogenated VOCs [t]1'886.40 1'722.23 1'521.00 1'217.73 1'043.45 VOCs total [t]
HSE data reflects continuing operations, including Alcon from 2011* Forecast data for 2012
0
500
1000
1500
2000
2008 2009 2010 2011 2012*
Halogenated VOCs
Non-Halogenated VOCs
t

32 | HSE Report 2012
Non-halogenated VOC emissions by division (in t)
- - - 65.40 51.19312.56 230.05 246.75 232.58 226.71 Pharmaceuticals31.60 33.88 25.58 24.98 26.72 NIBR
1'234.62 1'170.26 924.70 717.73 617.04 Sandoz74.27 70.97 77.98 28.97 10.93 Consumer Health2.13 2.07 1.86 1.09 1.13 Vaccines & Diagnostics
1'655.17 1'507.22 1'276.87 1'070.76 933.71 Non-Halogenated VOCs [t]HSE data reflects continuing operations, including Alcon from 2011Consumer Health data includes Animal Health, Ciba Vision & OTC until 2011 CV included under Alcon from 2011* Forecast data for 2012
Alcon
0
500
1000
1500
2000
2008 2009 2010 2011 2012*
Alcon
Pharmaceuticals
NIBR
Sandoz
Consumer Health
V&D
t t
33 | HSE Report 2012
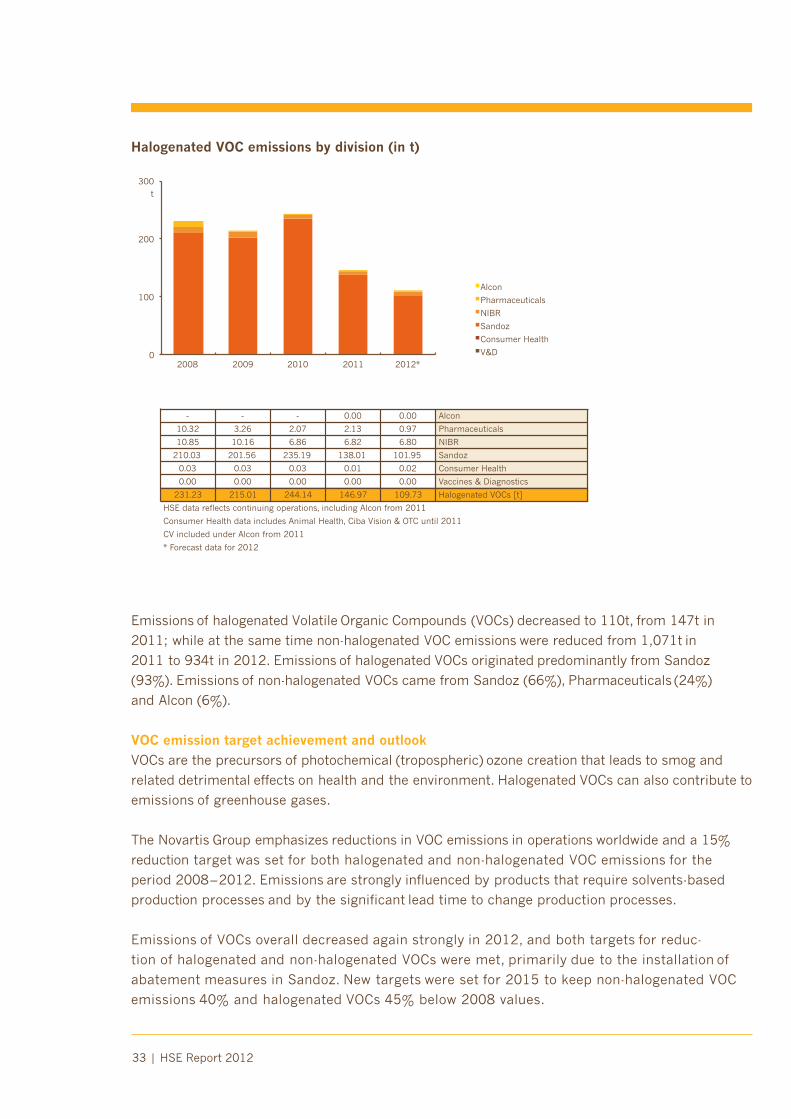
Halogenated VOC emissions by division (in t)
Emissions of halogenated Volatile Organic Compounds (VOCs) decreased to 110t, from 147t in
2011; while at the same time non-halogenated VOC emissions were reduced from 1,071t in
2011 to 934t in 2012. Emissions of halogenated VOCs originated predominantly from Sandoz
(93%). Emissions of non-halogenated VOCs came from Sandoz (66%), Pharmaceuticals (24%)
and Alcon (6%).
VOC emission target achievement and outlookVOCs are the precursors of photochemical (tropospheric) ozone creation that leads to smog and
related detrimental effects on health and the environment. Halogenated VOCs can also contribute to
emissions of greenhouse gases.
The Novartis Group emphasizes reductions in VOC emissions in operations worldwide and a 15%
reduction target was set for both halogenated and non-halogenated VOC emissions for the
period 2008 – 2012. Emissions are strongly influenced by products that require solvents-based
production processes and by the significant lead time to change production processes.
Emissions of VOCs overall decreased again strongly in 2012, and both targets for reduc-
tion of halogenated and non-halogenated VOCs were met, primarily due to the installation of
abatement measures in Sandoz. New targets were set for 2015 to keep non-halogenated VOC
emissions 40% and halogenated VOCs 45% below 2008 values.
- - - 0.00 0.00
10.32 3.26 2.07 2.13 0.97 Pharmaceuticals
10.85 10.16 6.86 6.82 6.80 NIBR
210.03 201.56 235.19 138.01 101.95 Sandoz
0.03 0.03 0.03 0.01 0.02 Consumer Health
0.00 0.00 0.00 0.00 0.00 Vaccines & Diagnostics
231.23 215.01 244.14 146.97 109.73 Halogenated VOCs [t]
HSE data reflects continuing operations, including Alcon from 2011
Consumer Health data includes Animal Health, Ciba Vision & OTC until 2011
CV included under Alcon from 2011
* Forecast data for 2012
Alcon
0
100
200
300
2008 2009 2010 2011 2012*
Alcon
Pharmaceuticals
NIBR
Sandoz
Consumer Health
V&D
t t

34 | HSE Report 2012
Inorganic air pollutants
SO2 and NOx emissions (in t)
0
100
200
300
400
2008 2009 2010 2011 2012*
NOx SO2
t
0
100
200
300
400
2008 2009 2010 2011 2012*
NOx SO2
t
64.42 72.48 81.86 70.86 46.60 SO2 total [t]
302.13 294.56 311.57 317.44 294.49 NOx total [t]
HSE data reflects continuing operations, including Alcon from 2011
* Forecast data for 2012
t
35 | HSE Report 2012
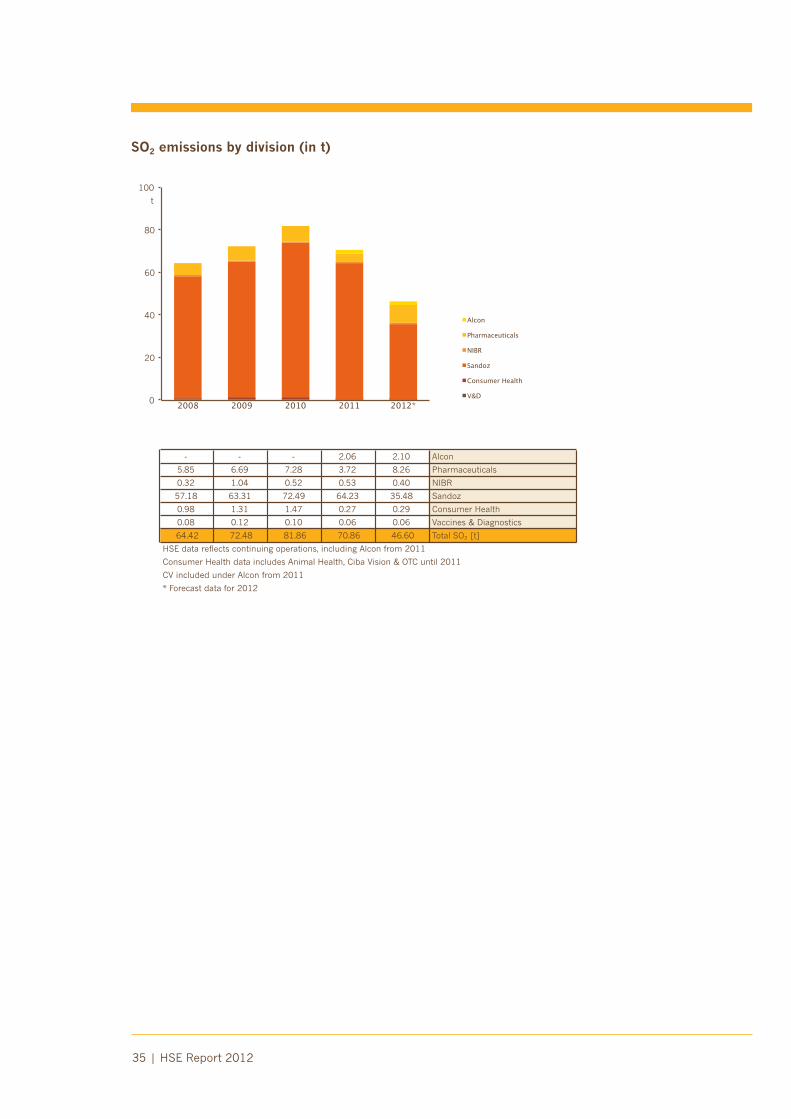
SO2 emissions by division (in t)
- - - 2.06 2.10
5.85 6.69 7.28 3.72 8.26 Pharmaceuticals
0.32 1.04 0.52 0.53 0.40 NIBR
57.18 63.31 72.49 64.23 35.48 Sandoz
0.98 1.31 1.47 0.27 0.29 Consumer Health
0.08 0.12 0.10 0.06 0.06 Vaccines & Diagnostics
64.42 72.48 81.86 70.86 46.60 Total SO2 [t]
HSE data reflects continuing operations, including Alcon from 2011
Consumer Health data includes Animal Health, Ciba Vision & OTC until 2011
CV included under Alcon from 2011
* Forecast data for 2012
Alcon
0
20
40
60
80
100
2008 2009 2010 2011 2012*
Alcon
Pharmaceuticals
NIBR
Sandoz
Consumer Health
V&D
t t

36 | HSE Report 2012
NOx emissions by division (in t)
In 2012, inorganic air pollutant emissions for the Novartis Group totaled 47t (71t in 2011)
for sulfur dioxide (SO2) and 294t (317t in 2011) for nitrogen oxide (NOx). NOx emission levels
from company-owned or leased vehicles are not included in these figures. Major contributors
to Group SO2 emissions were Sandoz (35t) and Pharmaceuticals (8t). The distribution of NOx
emissions is similar to the figure for the consumption of on-site generated energy. The main
contributors in 2012 are Sandoz (40%), Pharmaceuticals (32%) and Alcon (17%).
Inorganic pollutants targets and outlookInorganic air pollutants have long been a focus of environmental improvement at Novartis. Given
the measures we have implemented to increase energy efficiency and fuel switches, we do not
anticipate inorganic air pollutants, including SO2, to increase in the coming years.
- - - 51.14 50.33
118.62 102.59 113.43 101.59 92.80 Pharmaceuticals
8.18 12.68 12.16 11.12 9.84 NIBR
133.89 130.58 139.50 128.91 118.80 Sandoz
22.37 22.86 22.01 11.33 9.99 Consumer Health
19.06 25.86 24.46 13.35 12.72 Vaccines & Diagnostics
302.13 294.56 311.57 317.44 294.49 Total NOx [t]
HSE data reflects continuing operations, including Alcon from 2011
Consumer Health data includes Animal Health, Ciba Vision & OTC until 2011
CV included under Alcon from 2011
* Forecast data for 2012
Alcon
0
100
200
300
400
500
2008 2009 2010 2011 2012*
Alcon
Pharmaceuticals
NIBR
Sandoz
Consumer Health
V&D
kt t

37 | HSE Report 2012
Emissions into water
Chemical oxygen demand (COD) load by division
- - - 44.36 45.05633.47 479.73 817.77 742.90 765.90 Pharmaceuticals
1.40 0.61 0.25 0.28 0.26 NIBR2'711.96 2'904.24 2'766.14 3'045.91 3'078.20 Sandoz165.38 83.56 65.22 32.44 27.58 Consumer Health
0.00 0.00 0.00 31.30 39.63 Vaccines & Diagnostics3'512.21 3'468.14 3'649.38 3'897.18 3'956.63 Total COD Load [t]
HSE data reflects continuing operations, including Alcon from 2011Consumer Health data includes Animal Health, Ciba Vision & OTC until 2011 CV included under Alcon from 2011* Forecast data for 2012
Alcon
0
1000
2000
3000
4000
5000
2008 2009 2010 2011 2012*
Alcon
Pharmaceuticals
NIBR
Sandoz
Consumer Health
V&D
t t

38 | HSE Report 2012
Total suspended solids (TSS) emissions into water by division (in t)
- - - 5.63 5.78
262.41 206.62 218.54 195.82 200.34 Pharmaceuticals
7.10 3.67 0.04 0.06 0.05 NIBR
265.44 297.73 263.28 215.75 244.74 Sandoz
48.25 25.61 20.85 7.88 8.52 Consumer Health
0.00 0.00 0.00 21.60 21.04 Vaccines & Diagnostics
583.20 533.63 502.71 446.74 480.48 Total TSS Load [t]
HSE data reflects continuing operations, including Alcon from 2011
Consumer Health data includes Animal Health, Ciba Vision & OTC until 2011
CV included under Alcon from 2011
* Forecast data for 2012
Alcon
0
100
200
300
400
500
600
700
2008 2009 2010 2011 2012*
Alcon
Pharmaceuticals
NIBR
Sandoz
Consumer Health
V&D
t t

39 | HSE Report 2012
Nitrogen load by division (in t)
0
200
400
600
2008 2009 2010 2011 2012*
Alcon
Pharmaceuticals
NIBR
Sandoz
Consumer Health
V&D
t
- - - 0.48 0.73
49.25 47.18 77.86 69.62 52.82 Pharmaceuticals
0.00 0.01 0.01 0.01 0.01 NIBR
444.56 394.45 495.95 502.25 527.75 Sandoz
4.98 0.30 0.31 0.13 0.14 Consumer Health
0.00 0.00 0.00 1.10 3.81 Vaccines & Diagnostics
498.79 441.93 574.13 573.60 585.25 Total Nitrogen Load [t]
HSE data reflects continuing operations, including Alcon from 2011
Consumer Health data includes Animal Health, Ciba Vision & OTC until 2011
CV included under Alcon from 2011
* Forecast data for 2012
Alcon
t

40 | HSE Report 2012
Phosphate load by division (in t)
The chemical oxygen demand (COD) load on the aquatic environment from Novartis Group company
operations slightly increased in 2012, from 3.90kt in 2011 to 3.96kt. COD loads for 2012 were
attributable to: Sandoz 78%, Pharmaceuticals 19% and other divisions 3%.
Total suspended solids (TSS) increased from 0.45kt in 2011 to 0.48kt in 2012. Total nitrogen load
increased from 0.57kt in 2011 to 0.59kt in 2012 and phosphate load decreased from 0.057kt in
2011 to 0.042kt in 2012.
Novartis did not set a Group target on emissions into water. Effluent water is always treated in
state-of-the-art facilities and therefore remaining effluent loads on the above-mentioned parameters
from Novartis Group company operations have little relevance for the environmental quality
of water bodies near our sites. However, we closely monitor specific parameters, such as the
release of drug substances into water, and take the appropriate mitigation and risk minimization
measures when necessary.
0
20
40
60
2008 2009 2010 2011 2012*
Alcon
Pharmaceuticals
NIBR
Sandoz
Consumer Health
V&D
t t
0.00 - - 0.85 0.947.96 6.90 10.33 10.13 5.43 Pharmaceuticals0.00 0.19 0.14 0.14 0.13 NIBR25.78 31.63 41.66 45.18 34.47 Sandoz4.02 2.41 2.25 0.29 0.20 Consumer Health0.00 0.00 0.00 0.50 0.62 Vaccines & Diagnostics37.75 41.12 54.38 57.09 41.80 Total Phosphate Load [t]
HSE data reflects continuing operations, including Alcon from 2011Consumer Health data includes Animal Health, Ciba Vision & OTC until 2011 CV included under Alcon from 2011* Forecast data for 2012
Alcon0.00 - - 0.85 0.947.96 6.90 10.33 10.13 5.43 Pharmaceuticals0.00 0.19 0.14 0.14 0.13 NIBR25.78 31.63 41.66 45.18 34.47 Sandoz4.02 2.41 2.25 0.29 0.20 Consumer Health0.00 0.00 0.00 0.50 0.62 Vaccines & Diagnostics37.75 41.12 54.38 57.09 41.80 Total Phosphate Load [t]
HSE data reflects continuing operations, including Alcon from 2011Consumer Health data includes Animal Health, Ciba Vision & OTC until 2011 CV included under Alcon from 2011* Forecast data for 2012
Alcon
41 | HSE Report 2012
Release of drug substances into waterSince 2001, the Novartis Pharmaceuticals Division has conducted a program to reduce the release
of active drug substances from production processes into water.
In the past several years, the total amount released to the aquatic environment has been less than
0.05% of the total amount of active pharmaceuticals processed for the Pharmaceuticals Division
globally.
Having reached such low release levels overall, efforts are now focused on the potential envi-
ronmental risks linked to such releases. To this end, the Novartis Divisions apply programs to
prevent remaining environmental risks associated with individual active drug substances and
with the specific situation at each manufacturing location. The programs, covering all manufac-
turing sites, combine a science-based, substance-specific risk assessment methodology with an
evaluation of process-efficiency improvements and the most stringent international regulatory
requirements. Specific targets have been set for sites to achieve further reductions on individ-
ual drug substances, if the specific risk assessment indicates a concern, if the release is above
1%, or if effluents from the sites could lead to concentrations in the aquatic environment big-
ger than 1% of the respective risk limit for the particular substance. At several pharmaceutical
production sites, we use advanced wastewater treatment technology to specifically eliminate
drug substances from effluents, such as membrane bioreactors, ultra-filtration and activated
charcoal filtration.
In 2012, we conducted a Group-wide effort to monitor and reduce effluent loads of diclofenac,
the API for the anti-inflammatory drug Voltaren from all our operations worldwide that process
diclofenac. The release to waste water was below 0.3%.

42 | HSE Report 2012
Total operational waste
Total operational waste (in kt)
For Novartis, operational waste – both hazardous and non-hazardous – is an important area of
environmental management for Group company manufacturing facilities, as well as for research
and administrative sites.
Group objectives include the proper management of hazardous waste and risks related to disposal,
in particular disposal into landfills.
In 2012, the total amount of hazardous waste for the Novartis Group slightly increased to 185kt
(from 181kt in 2011); non-hazardous waste totaled 94kt in 2012, which represents an 2.4%
decrease compared to 2011 (97kt). This decrease is primarily due to smaller volumes of waste
from vaccine production at Vaccines and Diagnostics sites. Hazardous waste was generated primar-
ily by Sandoz (49%) and Pharmaceuticals (45%). Non-hazardous waste was generated by: Sandoz
32%, Pharmaceuticals 21%, Vaccines and Diagnostics 19%, Alcon 19%, Consumer Health 6%, and
NIBR 3%.
For reporting purposes, waste is classified by type and according to the disposal routes, recycling,
treatment, incineration with and without energy recovery, and landfill.
0
50
100
150
200
2008 2009 2010 2011 2012*
Hazardous Waste
Non-Hazardous Waste
kt
0
50
100
150
200
2008 2009 2010 2011 2012*
Hazardous Waste
Non-Hazardous Waste
kt
153.73 155.58 184.54 180.63 184.77 Hazardous Waste
75.45 89.31 94.42 96.57 94.23 Non-Hazardous Waste
229.17 244.89 278.96 277.20 279.01 Waste total [kt]
Data excludes construction debris
HSE data reflects continuing operations, including Alcon from 2011
* Forecast data for 2012
kt

43 | HSE Report 2012
Sustainable packaging initiative
Novartis has launched a group-wide initiative on sustainable packaging, and seeks to design pack-
aging that both minimizes environmental impact and meets all regulatory, quality, functional and
design requirements.
A guide was developed and issued for packaging design teams to make product packaging more
sustainable. Novartis engages with clients and packaging material suppliers to determine needs and
identify more sustainable packaging solutions. Best practice packaging case examples are collected
and shared among packaging designers across the company. Improvements are quantified based
on a set of packaging indicators. Projects include:
– The Sandoz facility in Cambé, Brazil reduced packaging material and related costs between 5
and 10% by optimizing blister layout for a variety of their products. Total quantities saved with
27 individual projects sum up to 3.3 tons of aluminum and over 20 tons of plastic blister foil.
– The Alcon Vision Care site in Singapore introduced a returnable PP transfer packaging for the
polypropylene (PP) blister package of its daily contact lenses. These transfer packages replace 32
tons of cardboard packaging, which was wasted before, going forth and back between Alcon and
the supplier now for more than four years.

44 | HSE Report 2012
Non-hazardous waste
Non-hazardous waste by disposal route (in kt)
Non-hazardous waste reported includes mixed or household waste, packaging waste, compostable
waste and inert waste.
Total amounts of non-hazardous waste not recycled for the Novartis Group in 2012 were 41.2kt
(down from 48.5kt in 2011); an additional 53.0kt included materials collected for recycling. Of the
non-hazardous waste not being recycled, disposal routes were:
Treatment 39%
Incineration 34%
Landfill 27%
Non-hazardous waste target achievement and outlookKeeping non-hazardous waste to a minimum and recycling it to a maximum is a constant chal-
lenge. Novartis makes ongoing efforts in all areas to minimize non-hazardous waste that cannot be
recycled at its operations globally. We are installing waste-segregation programs at many sites that
allow better use of recycling routes for materials such as paper, cardboard, glass and plastics – for
example from packaging, offices and production processes. Recycling rate of total non-hazardous
waste is up from 49.8% to 56.2%.
0
20
40
60
80
100
2008 2009 2010 2011 2012*
Recycling
Treatment
Incineration
Landfill
kt kt
30.92 34.13 36.35 48.11 52.98 Recycling19.62 25.84 32.06 23.04 16.22 Treatment13.27 18.91 15.33 12.54 14.05 Incineration11.64 10.43 10.68 12.86 10.98 Landfill75.45 89.31 94.42 96.57 94.23 Non-Haz. Waste total [kt]
Data excludes construction debrisHSE data reflects continuing operations, including Alcon from 2011* Forecast data for 2012

45 | HSE Report 2012
Non-hazardous waste by division (in kt)
0
20
40
60
2008 2009 2010 2011 2012*
Alcon
Pharmaceuticals
NIBR
Sandoz
Consumer Health
V&D
kt
- - - 6.06 5.27
7.86 6.72 7.11 7.29 6.66 Pharmaceuticals
1.69 1.82 1.79 1.60 1.55 NIBR
8.81 8.90 7.92 8.83 8.43 Sandoz
6.48 5.82 5.83 3.57 3.06 Consumer Health
19.67 31.92 35.43 21.09 16.27 Vaccines & Diagnostics
44.53 55.18 58.07 48.45 41.25 Non-Haz Waste not Recycled [kt]
Data excludes recycled waste and construction debris
HSE data reflects continuing operations, including Alcon from 2011
Consumer Health data includes Animal Health, Ciba Vision & OTC until 2011
CV included under Alcon from 2011
* Forecast data for 2012
Alcon
kt
.

46 | HSE Report 2012
A target was set for the Novartis Group, excluding Alcon and Vaccines and Diagnostics Divisions, to
reduce the per employee efficiency of non-hazardous waste not being recycled by 20% by 2012,
based on 2008 values. In 2012, this intensity indicator was reduced by 23% compared to 2008,
achieving the target. The Vaccines and Diagnostics Division reduced its non-hazardous waste not
recycled from 21.1kt in 2011 to 16.3kt in 2012, which represents a 49% improvement of intensity
by production. Alcon will be included in new waste targets as of 2013.
For 2015 Novartis set a new target to reduce the intensity of non-hazardous waste not recycled
per employee by 10% compared to 2010.
Hazardous waste
Hazardous waste by disposal route (in kt)
59.91 69.45 88.40 87.13 93.58 Recycling
7.20 3.29 2.12 2.88 1.75 Treatment
86.61 82.83 94.03 90.62 89.44 Incineration
0.00 0.00 0.00 0.00 0.00 Landfill
153.73 155.58 184.54 180.63 184.77 Haz. Waste total [kt]
Data excludes construction debris
HSE data reflects continuing operations, including Alcon from 2011
* Forecast data for 2012
0
50
100
150
200
2008 2009 2010 2011 2012*
Recycling
Treatment
Incineration
Landfill
kt kt

47 | HSE Report 2012
Hazardous waste not recycled by division (in kt)
Hazardous waste originates primarily from chemical and pharmaceutical production processes.
Total amounts of hazardous waste not recycled in 2012 for the Novartis Group were 91.2 (down
from 93.5kt in 2011); an additional 93.6kt was subject to recycling.
Of the hazardous waste not being recycled in 2012, disposal routes were incineration (98%) and
treatment (2%). The recycling rate for hazardous waste was up from 48.2% in 2011 to 50.2% in
2012.
Novartis has completely eliminated disposal of hazardous waste with organic content to landfills.
No such waste has been disposed in landfill sites since 2010. Small amounts of some inorganic
residues for which no other disposal route exists, such as incinerator ash, continue to be disposed
in accredited landfills.
- - - 0.91 0.85
58.33 55.82 64.95 64.57 63.08 Pharmaceuticals
0.76 1.37 1.36 1.15 1.20 NIBR
31.36 26.03 26.02 23.40 22.94 Sandoz
2.56 2.11 2.66 2.22 1.95 Consumer Health
0.80 0.79 1.16 1.25 1.17 Vaccines & Diagnostics
93.81 86.13 96.15 93.50 91.19 Haz Waste not Recycled [kt]
Data excludes recycled waste and construction debris
HSE data reflects continuing operations, including Alcon from 2011
Consumer Health data includes Animal Health, Ciba Vision & OTC until 2011
CV included under Alcon from 2011
* Forecast data for 2012
Alcon
0
20
40
60
80
100
120
2008 2009 2010 2011 2012*
Alcon
Pharmaceuticals
NIBR
Sandoz
Consumer Health
V&D
kt kt
.

48 | HSE Report 2012
Hazardous waste target achievement and outlookNovartis puts a high priority on avoiding hazardous waste. In 2008 a target was set to reduce the
per production efficiency of hazardous waste not being recycled for the Novartis Group (exclud-
ing Alcon) by 10% by 2012 based on 2008 values. In 2012, the hazardous waste intensity was
reduced by 3.8% compared to 2008, not achieving the target set for the period.
For 2015 Novartis set a new target to reduce the intensity of hazardous waste not recycled per
production by 10% compared to 2010.
HSE targets 2008 – 2015Novartis sets Health, Safety and Environment (HSE) targets covering periods of at least three years
to allow better analysis, planning and implementation. For 2008 – 2015, the following targets have
been defined on Group level:
– Halogenated volatile organic compounds (VOCs): decrease to 130 tons in 2015
(-45% compared to 2008)
– Non-halogenated volatile organic compounds (VOCs): decrease to 1,000 tons by 2015
(-40% compared to 2008)
– Initiate water saving programs at the 10 sites with highest water footprint and water scarcity
– Intensity of hazardous waste not recycled: reduce by 10% by 2015, compared to 2010
– Intensity of non-hazardous waste not recycled: reduce by 10% by 2015, compared to 2010
– Organic hazardous waste to landfill: zero
– Carbon dioxide (CO2) from vehicles: decrease by 20% by 2015, based on 2010 level
– Total GHG emissions: reduce by 15% by 2015 and 20% by 2020, including carbon offsets
– Lost Time Injury and Illness Rate (LTIR): reduce to less than or equal to 0.14 in 2013
– Total Recordable Case Rate (TRCR): improve by 5% compared to Group performance
in 2012
Furthermore, the Group is pursuing the following goals:
– Behavior-based safety programs initiated at all major Novartis sites
– Waste minimization and water efficiency programs active in all divisions
– Business continuity management program fully implemented worldwide
– Risk reduction measures started and business continuity plans established for all remaining
risks (according to risk portfolios)
– Novartis emergency management programs implemented at divisional level as well as in all
smaller units
– Novartis emergency management programs implemented at divisional level as well as in all
smaller units
– Implementation of Be Healthy, the Novartis health and well-being initiative, at all sites with more
than 100 associates