hsbc holdings plc · capital and risk management pillar 3 disclosures at 31 december 2015...
TRANSCRIPT

HSBC Holdings plc Capital and Risk Management Pillar 3 Disclosures at 31 December 2015

Capital and Risk Management Pillar 3 Disclosures at 31 December 2015
HSBC HOLDINGS PLC
1
Certain defined terms Unless the context requires otherwise, ‘HSBC Holdings’ means HSBC Holdings plc and ‘HSBC’, the ‘Group’, ‘we’, ‘us’ and ‘our’ refer to HSBC Holdings together with its subsidiaries. Within this document the Hong Kong Special Administrative Region of the People’s Republic of China is referred to as ‘Hong Kong’. When used in the terms ‘shareholders’ equity’ and ‘total shareholders’ equity’, ‘shareholders’ means holders of HSBC Holdings ordinary shares and those preference shares and capital securities issued by HSBC Holdings classified as equity. The abbreviations ‘$m’ and ‘$bn’ represent millions and billions (thousands of millions) of US dollars, respectively.
Contents Introduction Purpose 2Abbreviations 3Key metrics 4Regulatory framework for disclosures 6Pillar 3 Disclosures 2015 7Linkage to the Annual Report and Accounts 2015 7
Capital and risk Capital management 16Overview of regulatory capital framework 16Composition of regulatory capital 19Pillar 1 requirements and RWA flow 21Pillar 2 and ICAAP 25Leverage ratio 27Regulatory developments 28Risk management 31
Credit riskOverview and responsibilities 34Credit risk management 34Credit risk models governance 35Application of the IRB approach 46Model performance 66Risk mitigation 74Application of the standardised approach 76Counterparty credit risk 78Securitisation 85
Market risk Overview and objectives 90Market risk governance 90Market risk measures 92Market risk capital models 93Trading portfolios 95Non-trading portfolios 96Prudent valuation adjustment 96Structural foreign exchange exposures 96Non-trading interest rate risk 97
Operational riskOverview and objectives 99Organisation and responsibilities 99Measurement and monitoring 100
Other risksPension risk 101Non-trading book exposures in equities 101Risk management of insurance operations 101Liquidity and funding risk 102Reputational risk 103Sustainability risk 103Business risk 103Dilution risk 103
Remuneration 103
Appendices I Simplified organisation chart for regulatory purposes 104
II Asset encumbrance 105III Transitional own funds disclosure 106IV PD, LGD, RWA and exposure by country 109V Summary of disclosures withheld due to their
immateriality, confidentiality or proprietary nature 116VI Glossary 117
VII Cautionary statement regarding forward-looking statements 125
VIII Contacts 126
Capital and Risk Management Pillar 3 Disclosures at 31 December 2015 (continued)
HSBC HOLDINGS PLC
2
Tables
1 Pillar 1 overview 52 RWAs – by global business and region 53 RWAs – by risk type and region 64 Reconciliation of balance sheets – financial accounting to
regulatory scope of consolidation 85 Principal entities with a different regulatory and accounting
scope of consolidation 126 a) Mapping of financial statement categories with regulatory
risk categories 146 b) Main sources of differences between regulatory exposure
values and carrying values in financial statements 157 Composition of regulatory capital 208 Reconciliation of regulatory capital from transitional basis to
an estimated CRD IV end point basis 219 Total RWAs by risk type 21
10 Credit risk – RWAs by region and approach 2211 Credit risk – RWAs by global business and approach 2212 RWA movement by region by key driver – credit risk IRB only 2313 RWA movement by global business by key driver – credit risk
– IRB only 2314 Counterparty credit risk RWAs 2415 RWA movement by key driver – CCR – advanced approach 2416 Market risk RWAs 2517 RWA movement by key driver – market risk – model based 2518 Summary reconciliation of accounting assets and leverage
ratio exposures 2719 Leverage ratio common disclosure 2720 Leverage ratio – split of on-balance sheet exposures 2821 Credit risk – summary 3622 Credit risk exposure – by region 3723 Credit risk – RWAs by region 3824 Credit risk – RWA density by region 4025 Credit risk exposure – by industry sector 4226 Credit risk exposure – by residual maturity 4427 Wholesale IRB credit risk models 4828 Wholesale IRB portfolio analysis 4929 Wholesale IRB exposures under the slotting approach 4930 Wholesale IRB exposure – by obligor grade 5031 Material retail IRB risk rating systems 57
32 Retail IRB portfolio analysis 5933 Retail IRB exposures secured by mortgages on immovable
property (non-SME) 6034 Retail IRB exposure – by internal PD band 6135 Retail IRB exposure – by region 6436 IRB models – estimated and actual values (wholesale) 6737 IRB models – corporate PD models – performance by CRR 6738 IRB models – estimated and actual values (retail) 7039 Past due but not impaired exposures, impaired exposures
and impairment allowances and other credit risk provisions by counterparty and region 71
40 Movement in specific CRAs by counterparty and region 7141 IRB EL and CRAs – by exposure class 7342 IRB EL and CRAs – by region 7343 IRB exposure – credit risk mitigation 7644 Standardised exposure – credit risk mitigation 7745 Standardised exposure – by credit quality step 7746 CCR exposure – credit derivative transactions 7947 CCR – net derivative credit exposure 7948 Comparison of derivative accounting balances and CCR
exposure 8049 CCR exposure – by exposure class, product and method 8150 CCR exposure – by exposure class, product and region 8251 CCR – RWAs by exposure class, product and region 8352 CCR – RWA density by exposure class, product and region 8453 Securitisation – by approach 8754 Securitisation – movement in the year 8755 Securitisation – by trading and non-trading book 8856 Securitisation – asset values and impairments 8857 Securitisation – by risk weighting 8958 Market risk RWAs and capital required 9159 Market risk models 9460 VaR used for regulatory purposes (one-day equivalent) 9461 Stressed VaR (one-day equivalent) 9462 Incremental risk charge 9563 Operational risk RWAs 9964 Non-trading book equity investments 10165 Asset encumbrance 10566 Transitional own funds disclosure 10667 PD, LGD, RWA and exposure by country 109
Introduction Purpose
This document comprises HSBC’s Pillar 3 disclosures on capital and risk management at 31 December 2015. It has two principal purposes:
• to provide useful information on the capital and risk profile of the HSBC Group, and
• to meet the regulatory disclosure requirements under the Capital Requirements Regulation (EU) No 575/2013, Part 8 – Disclosure by institutions and the rules of the PRA set out in the Public Disclosure section of the PRA Rulebook and as the PRA has otherwise directed.
Additional relevant information may be found in the HSBC Holdings plc Annual Report and Accounts 2015.

Capital and Risk Management Pillar 3 Disclosures at 31 December 2015 (continued)
HSBC HOLDINGS PLC
3
Abbreviations
The following abbreviated terms are used throughout this document. Abbreviation Brief description
A ABCP Asset-backed commercial paper ABS1 Asset-backed Security AFS1 Available-for-saleALCM Asset, Liability and Capital ManagementALCO Asset and Liability Management CommitteeAT1 capital Additional Tier 1 capital
B Basel Committee Basel Committee on Banking SupervisionBoCom Bank of Communications Co., LimitedBSM Balance Sheet Management
C CCB1 Capital conservation buffer CCF1 Credit conversion factor CCP Central counterparty CCR1 Counterparty credit risk CCyB1 Countercyclical capital buffer CDS1 Credit default swap CET11 Common equity tier 1 CIU Collective investment undertakings CML1 Consumer and Mortgage Lending (US)CRA1 Credit risk adjustment CRD1 Capital Requirements Directive CRE1 Commercial real estate CRR1 Customer risk rating CSA1 Credit Support Annex CVA Credit valuation adjustment
E EAD1 Exposure at default EBA European Banking Authority ECAI1 External Credit Assessment InstitutionsEEA European Economic Area EL1 Expected loss EU European UnionEVE1 Economic value of equity
F Fitch Fitch Group FPC1 Financial Policy Committee (UK) FSB Financial Stability Board
G GAC Group Audit Committee GB&M Global Banking and Markets, a global businessGMB Group Management Board GPB Global Private Banking, a global businessGRC Group Risk Committee Group HSBC Holdings together with its subsidiary
undertakings G-SIB1 Global systemically important bank G-SII Global systemically important institution
H HKMA Hong Kong Monetary Authority Hong Kong The Hong Kong Special Administrative Region
of the People’s Republic of China HSBC HSBC Holdings together with its subsidiary
undertakings
I IAA1 Internal Assessment Approach
Abbreviation Brief description
ICAAP1 Internal Capital Adequacy Assessment ProcessICG Individual capital guidance IFRSs International Financial Reporting StandardsIMM1 Internal Model Method IRB1 Internal ratings-based approach IRC1 Incremental risk charge ITS Implementing Technical Standards
L LGD1 Loss given default Libor London Interbank Offered Rate
M
MDB1 Multilateral Development Bank MENA Middle East and North Africa MOC Model Oversight Committee Moody’s Moody’s Investor Service MREL Minimum requirements for own funds and
eligible liabilities
N
NCOA Non-credit obligation asset
O
ORMF Operational risk management frameworkOTC1 Over-the-counter
P
PD1 Probability of default PFE1 Potential future exposure PIT1 Point-in-timePRA1 Prudential Regulation Authority (UK) PVA1 Prudent valuation adjustment
R
RBM1 Ratings Based Method Retail IRB1 Retail Internal Ratings Based approachRMM Risk Management Meeting of the GMBRNIV Risks not in VaR RTS Regulatory Technical Standards RWA1 Risk-weighted asset
S
S&P Standard and Poor’s rating agency SFM1 Supervisory Formula Method SFT1 Securities Financing Transactions SIC Securities Investment Conduit SME Small and medium-sized enterprise SPE1 Special Purpose Entity SRB1 Systemic Risk Buffer STD1 Standardised approach
T
TLAC1 Total Loss Absorbing Capacity TTC1 Through-the-cycle T2 capital Tier 2 capital
U
UK United Kingdom $ United States dollar US United States of America
V
VaR1 Value at risk
1 Full definition included in Glossary in Appendix VI.

Capital and Risk Management Pillar 3 Disclosures at 31 December 2015 (continued)
HSBC HOLDINGS PLC
4
We are more than 250,000 employees working around the world to provide over 47 million customers with a broad range of banking products and services to meet their financial needs.
Our values
Our values define who we are as an organisation and make us distinctive.
Open
We are open to different ideas and cultures, and value diverse perspectives.
Connected
We are connected to our customers, communities, regulators and each other, caring about individuals and their progress.
Dependable
We are dependable, standing firm for what is right and delivering on commitments.
150-year heritage
These values reflect the best aspects of our 150-year heritage. They are critical to fulfilling our purpose to help businesses to thrive, economies to prosper and people to realise their ambitions.
Our role in society
How we do business is as important as what we do.
We seek to build trusting and lasting relationships with our many stakeholders to generatevalue in society and deliver long-term shareholder returns.
Further details on how we do business can be found on page 34 of the Annual Report and Accounts 2015
Key metrics
CRD IV
Common equity tier 1 ratio1 (end point)
11.9% 2014: 11.1%
Tier 1 ratio (transitional)
13.9% 2014: 12.5%
Total capital ratio (transitional)
17.2% 2014: 15.6%
Common equity tier 1 capital1 (end point)
$130.9bn – down 4%
2014: $136.0bn
Tier 1 capital (transitional)
$153.3bn – unchanged 2014: $152.7bn
Total regulatory capital (transitional)
$189.8bn – unchanged
2014: $190.7bn
Total RWAs
$1,103bn – down 10%
2014: $1,220bn
Credit risk2 EAD
$2,147bn – down 3%
2014: $2,210bn
Credit risk2 RWA density
41%
2014: 43%
Leverage ratio
5.0% 2014: 4.8%
1 From 1 January 2015 the CRD IV transitional CET1 and end point CET1 capital ratios became aligned for HSBC Holdings plc due to the recognition of unrealised gains on investment property and AFS securities.
2 ‘Credit risk’, here and in all tables and metrics where the term is used, excludes counterparty credit risk.

Capital and Risk Management Pillar 3 Disclosures at 31 December 2015 (continued)
HSBC HOLDINGS PLC
5
Table 1: Pillar 1 overview RWAs Capital required1
2015 2014 2015 2014 $bn $bn $bn $bnCredit risk 875.9 955.3 70.1 76.4
– standardised approach 332.7 356.9 26.6 28.6– IRB foundation approach 27.4 16.8 2.2 1.3– IRB advanced approach 515.8 581.6 41.3 46.5
Counterparty credit risk 69.2 90.7 5.5 7.3– standardised approach 19.1 25.2 1.5 2.0– advanced approach 50.1 65.5 4.0 5.3
Market risk 42.5 56.0 3.4 4.5Operational risk 115.4 117.8 9.2 9.4
At 31 December 1,103.0 1,219.8 88.2 97.6
Of which: Run-off portfolios 69.3 99.2 5.6 7.9
– legacy credit in GB&M 29.8 44.1 2.4 3.5– US CML and Other2 39.5 55.1 3.2 4.4
1 ‘Capital required’, here and in all tables where the term is used, represents the Pillar I capital charge at 8% of RWAs. 2 ‘Other’ includes treasury services related to the US CML business and operations in run-off.
Tables 2 and 3 following summarise RWAs by global business and risk type across our five geographical regions.
Table 2: Risk-weighted assets – by global business and region
Europe Asia MENANorth
AmericaLatin
America Total
RWAs Capital
required $bn $bn $bn $bn $bn $bn $bnRetail Banking and Wealth Management1 38.9 63.7 7.7 57.3 21.9 189.5 15.2Commercial Banking1 114.3 201.1 26.1 55.3 24.2 421.0 33.7Global Banking and Markets2 170.4 167.3 24.7 70.6 27.1 440.6 35.2Global Private Banking 10.7 3.9 0.3 4.2 0.2 19.3 1.5Other3 3.1 23.7 1.6 4.2 – 32.6 2.6At 31 December 2015 337.4 459.7 60.4 191.6 73.4 1,103.0 88.2
Retail Banking and Wealth Management1 42.4 59.1 7.7 73.5 24.5 207.2 16.6Commercial Banking1 106.3 208.6 26.0 58.2 31.2 430.3 34.4Global Banking and Markets2 209.8 193.0 27.8 81.2 32.9 516.1 41.3Global Private Banking 11.9 3.5 0.3 4.9 0.2 20.8 1.7Other3 5.0 35.6 1.2 3.6 – 45.4 3.6At 31 December 2014 375.4 499.8 63.0 221.4 88.8 1,219.8 97.6 1 In the first half of 2015, a portfolio of customers was transferred from CMB to RBWM in Latin America in order to better align the combined banking
needs of the customers with our established global businesses. Comparative data have been re-presented accordingly. 2 RWAs are non-additive across regions due to market risk diversification effects within the Group. 3 Includes HSBC’s holding company and financing operations, unallocated investment activities, centrally held investment companies and certain
property transactions.

Capital and Risk Management Pillar 3 Disclosures at 31 December 2015 (continued)
HSBC HOLDINGS PLC
6
Table 3: Risk-weighted assets – by risk type and region
Europe Asia MENANorth
AmericaLatin
America Total
RWAs Capital
required $bn $bn $bn $bn $bn $bn $bnCredit risk 239.4 373.6 51.4 156.4 55.1 875.9 70.1Counterparty credit risk 32.1 17.1 1.8 14.6 3.6 69.2 5.5Market risk1 31.0 21.9 1.0 6.5 1.6 42.5 3.4Operational risk 34.9 47.1 6.2 14.1 13.1 115.4 9.2At 31 December 2015 337.4 459.7 60.4 191.6 73.4 1,103.0 88.2
Credit risk 263.2 399.1 54.6 171.6 66.8 955.3 76.4Counterparty credit risk 40.6 21.9 1.2 23.0 4.0 90.7 7.3Market risk1 36.1 33.0 1.0 11.6 2.9 56.0 4.5Operational risk 35.5 45.8 6.2 15.2 15.1 117.8 9.4At 31 December 2014 375.4 499.8 63.0 221.4 88.8 1,219.8 97.6
1 RWAs are non-additive across geographical regions due to market risk diversification effects within the Group.
All RWAs by risk type Credit risk RWAs by Basel approach
RWAs by region RWAs by global business
Regulatory framework for disclosures
HSBC is supervised on a consolidated basis in the UK by the PRA, which receives information on the capital adequacy of, and sets capital requirements for, the Group as a whole. Individual banking subsidiaries are directly regulated by their local banking supervisors, who set and monitor their local capital adequacy requirements. In most jurisdictions, non-banking financial subsidiaries are also subject to the supervision and capital requirements of local regulatory authorities.
At a consolidated group level, we calculated capital for prudential regulatory reporting purposes throughout 2015 using the Basel III framework of the Basel Committee as implemented by the EU in the amended Capital Requirements Directive, known as CRD IV, and in the PRA’s Rulebook for the UK banking industry. The regulators of Group banking entities outside the EU are at varying stages of implementation of the Basel Committee’s framework, so local regulation in 2015 may have been on the basis of Basel I, II or III.
The Basel Committee’s framework is structured around three ‘pillars’: the Pillar 1 minimum capital requirements and Pillar 2 supervisory review process are complemented by Pillar 3 market discipline. The aim of Pillar 3 is to produce disclosures which allow market participants to assess the scope of application by banks of the Basel Committee’s framework and the rules in their jurisdiction, their capital condition, risk exposures and risk management processes, and hence their capital adequacy. Pillar 3 requires all material risks to be disclosed, enabling a comprehensive view of a bank’s risk profile.
The PRA’s final rules adopted national discretions in order to accelerate significantly the transition timetable to full ‘end point’ CRD IV compliance. Notwithstanding this, and other major developments in regulation during 2015, important elements of the capital adequacy framework have yet to be clarified. In particular, in December 2015, the FPC published its view of the capital framework as applicable to UK banks, which set out expectations in relation to Tier 1 capital across the industry. However, requirements applicable to individual banks are subject to
Operational risk 10%(2014: 10%)
Market risk 4% (2014: 5%)
Counterparty credit risk 6% (2014: 7%)
Credit risk 80% (2014: 78%)
IRB advancedapproach 59% (2014: 61%)
IRB foundation approach 3% (2014: 2%)
Standardisedapproach 38%
(2014: 37%)
Europe 30% (2014: 30%)
Latin America 7% (2014: 7%)
Asia 41% (2014: 40%)North America 17%
(2014: 18%)
Middle East and North Africa 5%(2014: 5%)
Commercial Banking 38%(2014: 35%)
Global Bankingand Markets 40% (2014: 42%)
Global Private Banking 2% (2014: 2%)
Other 3%(2014: 4%)
Retail Banking and Wealth Management 17%
(2014: 17%)

Capital and Risk Management Pillar 3 Disclosures at 31 December 2015 (continued)
HSBC HOLDINGS PLC
7
PRA determination. While there is emerging clarity around the interaction of capital buffers and the PRA’s Pillar 2 framework, uncertainty remains around the broader capital framework, including Basel Committee’s revisions to the RWA framework and capital floors. Furthermore, there remains a number of draft and unpublished EBA RTSs due in 2016. Details of the major continuing regulatory reforms are set out under ‘Regulatory developments’ on page 28.
Pillar 3 Disclosures 2015
The Pillar 3 Disclosures 2015 comprise all information required under Pillar 3, both quantitative and qualitative. They are made in accordance with Part 8 of the Capital Requirements Regulation within CRD IV, supplemented by any specific additional requirements of the PRA and discretionary disclosures on our part.
In our disclosures, to give insight into movements during the year, we provide comparative figures for the previous year, analytical review of variances and ‘flow’ tables for capital requirements. However, where disclosures have been enhanced or are new we do not generally re-state or provide prior year comparatives. The capital resources tables track the position from a CRD IV transitional to an end point basis. Specific changes to our Pillar 3 disclosures are set out below.
The principal changes in our Pillar 3 Disclosures 2015, compared with 2014, are: • enhanced capital and leverage disclosures:
− additional disclosure on the impact of the CCyB − disclosures on the leverage ratio now follow the EBA
disclosure templates • more granular risk disclosures:
− the tables on wholesale IRB exposure by obligor grade and retail IRB exposure by PD band have been expanded to show average exposure value and undrawn commitments by grade/band
− new section and tables on past due but not impaired, impaired exposures and CRA
− new tables showing PD, LGD, RWA and exposure by country • other items:
− new appendix summarising disclosures withheld due to their immateriality, confidentiality or proprietary nature
In 2015, the PRA adopted EBA Guidelines on frequency, materiality and the confidential or proprietary nature of Pillar 3 disclosures. HSBC implemented these guidelines by integrating them into Group policy and process for the governance of disclosures after approval by the GAC, which exercises oversight of controls over disclosures.
Information relating to the rationale for withholding certain disclosures is provided in Appendix V.
We publish comprehensive Pillar 3 disclosures annually on the HSBC internet site www.hsbc.com, simultaneously with the release of our Annual Report and Accounts 2015. Our G-SIB Indicator disclosure is also published in the same location. Our Interim Reports and Earnings Releases include regulatory information complementing the financial and risk information presented there and in line with the new requirements on the frequency of regulatory disclosures.
Pillar 3 requirements may be met by inclusion in other disclosure media. Where we adopt this approach, references are provided to the relevant pages of the Annual Report and Accounts 2015 or other location.
We continue to engage constructively in the work of the UK authorities and industry associations to improve the transparency and comparability of UK banks’ Pillar 3 disclosures.
Linkage to the Annual Report and Accounts 2015
Basis of consolidation
The basis of consolidation for the purpose of financial accounting under IFRSs, described in Note 1 of the Annual Report and Accounts 2015, differs from that used for regulatory purposes as described in ‘Structure of the regulatory group’ on page 12. Table 4 provides a reconciliation of the balance sheet from the financial accounting basis to the regulatory scope of consolidation.
The regulatory balance sheet forms the basis for the calculation of regulatory capital requirements.
The alphabetic references in this table link to the corresponding references in table 7: ‘Composition of Regulatory Capital’, identifying those balances which form part of that calculation.

Capital and Risk Management Pillar 3 Disclosures at 31 December 2015 (continued)
HSBC HOLDINGS PLC
8
Table 4: Reconciliation of balance sheets – financial accounting to regulatory scope of consolidation
Accounting balance sheet
Deconsolidation of insurance/ other entities
Consolidation of banking associates
Regulatory balance sheet
Ref $m $m $m $mAssets Cash and balances at central banks 98,934 (2) 28,784 127,716Items in the course of collection from other banks 5,768 – 22 5,790Hong Kong Government certificates of indebtedness 28,410 – – 28,410Trading assets 224,837 340 4,390 229,567Financial assets designated at fair value 23,852 (23,521) 2,034 2,365Derivatives 288,476 (146) 495 288,825Loans and advances to banks 90,401 (3,008) 16,413 103,806Loans and advances to customers 924,454 (7,427) 120,016 1,037,043
of which: – impairment allowances on IRB portfolios i (6,291) – – (6,291)– impairment allowances on standardised portfolios (3,263) – (2,780) (6,043)
Reverse repurchase agreements – non-trading 146,255 711 5,935 152,901Financial investments 428,955 (51,684) 42,732 420,003Assets held for sale 43,900 (4,107) – 39,793
of which: – goodwill and intangible assets h 1,680 (219) – 1,461– impairment allowances (1,454) – – (1,454)
of which: – IRB portfolios i (7) – – (7)– standardised portfolios (1,447) – – (1,447)
Capital invested in insurance and other entities – 2,371 – 2,371Current tax assets 1,221 (15) – 1,206Prepayments, accrued income and other assets 54,398 (2,539) 9,692 61,551
of which: – retirement benefit assets g 5,272 – – 5,272
Interests in associates and joint ventures 19,139 – (18,571) 568of which: – positive goodwill on acquisition h 593 – (579) 14
Goodwill and intangible assets h 24,605 (6,068) 623 19,160Deferred tax assets n 6,051 195 518 6,764
Total assets at 31 December 2015 2,409,656 (94,900) 213,083 2,527,839

Capital and Risk Management Pillar 3 Disclosures at 31 December 2015 (continued)
HSBC HOLDINGS PLC
9
Accounting balance sheet
Deconsolidation of insurance/ other entities
Consolidation of banking associates
Regulatory balance sheet
Ref $m $m $m $mLiabilities and equity Hong Kong currency notes in circulation 28,410 – – 28,410Deposits by banks 54,371 (97) 50,005 104,279Customer accounts 1,289,586 (119) 147,522 1,436,989Repurchase agreements – non-trading 80,400 – – 80,400Items in course of transmission to other banks 5,638 – – 5,638Trading liabilities 141,614 (66) 59 141,607Financial liabilities designated at fair value 66,408 (6,046) – 60,362
of which: – term subordinated debt included in tier 2 capital m 21,168 – – 21,168– hybrid capital securities included in tier 1 capital j 1,342 – – 1,342
Derivatives 281,071 87 508 281,666Debt securities in issue 88,949 (7,885) 5,065 86,129Liabilities of disposal groups held for sale 36,840 (3,690) – 33,150Current tax liabilities 783 (84) 409 1,108Liabilities under insurance contracts 69,938 (69,938) – –Accruals, deferred income and other liabilities 38,116 2,326 6,669 47,111
of which: – retirement benefit liabilities 2,809 (2) 61 2,868
Provisions 5,552 (25) – 5,527of which: – contingent liabilities and contractual commitments 240 – – 240
of which: – credit-related provisions on IRB portfolios i 201 – – 201– credit-related provisions on standardised portfolios 39 – – 39
Deferred tax liabilities 1,760 (868) 5 897Subordinated liabilities 22,702 – 2,841 25,543
of which: – hybrid capital securities included in tier 1 capital j 1,929 – – 1,929– perpetual subordinated debt included in tier 2 capital l 2,368 – – 2,368– term subordinated debt included in tier 2 capital m 18,405 – – 18,405
Total shareholders’ equity a 188,460 (7,562) – 180,898of which: – other equity instruments included in tier 1 capital c, j 15,112 – – 15,112– preference share premium included in tier 1 capital b 1,405 – – 1,405
Non-controlling interests d 9,058 (933) – 8,125of which: – non-cumulative preference shares issued by subsidiaries
included in tier 1 capital e 2,077 – – 2,077 – non-controlling interests included in tier 2 capital, cumulative
preferred stock f – – – – – non-controlling interests attributable to holders of
ordinary shares in subsidiaries included in tier 2 capital f, m – – – –
Total liabilities and equity at 31 December 2015 2,409,656 (94,900) 213,083 2,527,839

Capital and Risk Management Pillar 3 Disclosures at 31 December 2015 (continued)
HSBC HOLDINGS PLC
10
Table 4: Reconciliation of balance sheets – financial accounting to regulatory scope of consolidation (continued)
Accounting balance sheet
Deconsolidation of insurance/ other entities
Consolidation of banking associates
Regulatory balance sheet
Ref $m $m $m $mAssets Cash and balances at central banks 129,957 – 30,731 160,688Items in the course of collection from other banks 4,927 – 80 5,007Hong Kong Government certificates of indebtedness 27,674 – – 27,674Trading assets 304,193 (720) 2,357 305,830Financial assets designated at fair value 29,037 (28,791) 3,312 3,558Derivatives 345,008 (94) 353 345,267Loans and advances to banks 112,149 (2,727) 7,992 117,414Loans and advances to customers 974,660 (10,809) 116,484 1,080,335
of which: – impairment allowances on IRB portfolios i (6,942) – – (6,942)– impairment allowances on standardised portfolios (5,395) – (2,744) (8,139)
Reverse repurchase agreements – non-trading 161,713 (30) 7,510 169,193Financial investments 415,467 (50,420) 33,123 398,170Capital invested in insurance and other entities – 2,542 – 2,542Current tax assets 1,309 (16) – 1,293Prepayments, accrued income and other assets 75,176 (5,295) 8,501 78,382
of which: – goodwill and intangible assets of disposal groups held for sale h 8 – – 8– retirement benefit assets g 5,028 – – 5,028– impairment allowances on assets held for sale (16) – – (16)
of which: – IRB portfolios i (16) – – (16)– standardised portfolios – – – –
Interests in associates and joint ventures 18,181 – (17,479) 702of which: – positive goodwill on acquisition h 621 – (606) 15
Goodwill and intangible assets h 27,577 (5,593) 571 22,555Deferred tax assets n 7,111 163 474 7,748
Total assets at 31 December 2014 2,634,139 (101,790) 194,009 2,726,358

Capital and Risk Management Pillar 3 Disclosures at 31 December 2015 (continued)
HSBC HOLDINGS PLC
11
Accounting balance sheet
Deconsolidation of insurance/ other entities
Consolidation of banking associates
Regulatory balance sheet
Ref $m $m $m $mLiabilities and equity Hong Kong currency notes in circulation 27,674 – – 27,674Deposits by banks 77,426 (21) 40,530 117,935Customer accounts 1,350,642 (535) 141,858 1,491,965Repurchase agreements – non-trading 107,432 – – 107,432Items in course of transmission to other banks 5,990 (3) – 5,987Trading liabilities 190,572 (42) 50 190,580Financial liabilities designated at fair value 76,153 (6,317) – 69,836
of which: – term subordinated debt included in tier 2 capital m 21,822 – – 21,822– hybrid capital securities included in tier 1 capital j 1,495 – – 1,495
Derivatives 340,669 37 331 341,037Debt securities in issue 95,947 (7,797) 3,720 91,870Current tax liabilities 1,213 (138) 317 1,392Liabilities under insurance contracts 73,861 (73,861) – –Accruals, deferred income and other liabilities 53,396 (3,659) 5,145 54,882
of which: – retirement benefit liabilities 3,208 (2) 56 3,262
Provisions 4,998 (63) – 4,935of which: – contingent liabilities and contractual commitments 234 – – 234
of which: – credit-related provisions on IRB portfolios i 132 – – 132– credit-related provisions on standardised portfolios 102 – – 102
Deferred tax liabilities 1,524 (1,009) 2 517Subordinated liabilities 26,664 – 2,056 28,720
of which: – hybrid capital securities included in tier 1 capital j 2,761 – – 2,761– perpetual subordinated debt included in tier 2 capital l 2,773 – – 2,773– term subordinated debt included in tier 2 capital m 21,130 – – 21,130
Total shareholders’ equity a 190,447 (7,531) – 182,916of which: – other equity instruments included in tier 1 capital c, j 11,532 – – 11,532– preference share premium included in tier 1 capital b 1,405 – – 1,405
Non-controlling interests d 9,531 (851) – 8,680of which: – non-cumulative preference shares issued by subsidiaries
included in tier 1 capital e 2,127 – – 2,127 – non-controlling interests included in tier 2 capital, cumulative
preferred stock f 300 – – 300 – non-controlling interests attributable to holders of
ordinary shares in subsidiaries included in tier 2 capital f, m 173 – – 173
Total liabilities and equity at 31 December 2014 2,634,139 (101,790) 194,009 2,726,358
The references (a) – (n) identify balance sheet components which are used in the calculation of regulatory capital on page 20.

Capital and Risk Management Pillar 3 Disclosures at 31 December 2015 (continued)
HSBC HOLDINGS PLC
12
Structure of the regulatory group
HSBC’s organisation is that of a financial holding company whose major subsidiaries are almost entirely wholly-owned banking entities. A simplified organisation chart showing the difference between the accounting and regulatory consolidation groups is included in Appendix I.
Interests in banking associates are equity accounted in the financial accounting consolidation, whereas their exposures are proportionally consolidated for regulatory purposes by including our share of assets, liabilities, profit and loss and RWAs in accordance with the PRA’s application of EU legislation. The principal associates subject to proportional regulatory consolidation at 31 December 2015 are shown in table 5, representing 99% of our associates’ total assets as shown in table 4.
Subsidiaries engaged in insurance activities are excluded from the regulatory consolidation by excluding assets, liabilities and post-acquisition reserves, leaving the investment of these insurance subsidiaries to be recorded
at cost and deducted from CET1 (subject to thresholds). In the column ‘Deconsolidation of insurance/other entities’ in the table above the amount of $2.4bn (2014: $2.5bn) shown as ‘Capital invested in insurance and other entities’ represents the cost of investment in our insurance business. The principal insurance entities are listed in table 5.
The regulatory consolidation also excludes SPEs where significant risk has been transferred to third parties. Exposures to these SPEs are risk-weighted as securitisation positions for regulatory purposes. The deconsolidation of SPEs connected to securitisation activity and other entities mainly impacts the adjustments to ‘Loans and advances to customers’, ‘Financial investments’ and ‘Debt securities in issue’. Table 5 lists the principal SPEs excluded from the regulatory consolidation with their total assets and total equity. Further details of the use of SPEs in the Group’s securitisation activities are shown in Note 39 of the Annual Report and Accounts 2015 and on page 85.
Table 5: Principal entities with a different regulatory and accounting scope of consolidation At 31 December 2015 At 31 December 2014
Principal activities Total
assets Total
equity Total
assets Total
equity $m $m $m $mPrincipal associates
Bank of Communications Co., Limited1 Banking services 1,110,088 80,657 1,001,995 74,094The Saudi British Bank Banking services 50,189 7,356 50,161 6,807
Principal insurance entities excluded from the regulatory consolidation
HSBC Life (UK) Ltd Life insurance manufacturing 1,941 390 9,113 520HSBC Assurances Vie (France) Life insurance manufacturing 23,713 663 26,260 714HSBC Life (International) Ltd Life insurance manufacturing 34,808 2,805 32,578 2,778Hang Seng Insurance Company Ltd Life insurance manufacturing 14,455 1,154 13,353 1,323HSBC Insurance (Singapore) Pte Ltd Life insurance manufacturing 3,102 315 2,843 379HSBC Life Insurance Company Ltd Life insurance manufacturing 764 109 560 87HSBC Amanah Takaful (Malaysia) SB Life insurance manufacturing 302 27 349 31HSBC Seguros (Brasil) S.A. Life insurance manufacturing 484 283 619 357HSBC Vida e Previdência (Brasil) S.A. Life insurance manufacturing 3,418 155 5,044 119HSBC Seguros de Vida (Argentina) S.A. Life insurance manufacturing 203 42 225 55HSBC Seguros de Retiro (Argentina) S.A. Life insurance manufacturing 563 102 633 74HSBC Seguros S.A. (Mexico) Life insurance manufacturing 870 182 1,013 199
Principal SPEs excluded from the regulatory consolidation2 Regency Assets Ltd Securitisation 15,183 – 10,984 –Mazarin Funding Ltd Securitisation 1,879 (9) 3,913 (26)Barion Funding Ltd Securitisation 1,132 68 1,970 90Malachite Funding Ltd Securitisation 442 26 1,403 63
1 Total assets and total equity at 30 September 2015. 2 These SPEs hold no or de minimis share capital. The negative equity represents net unrealised losses on unimpaired assets on their balance sheets and
negative retained earnings.
Table 5 also presents as closely as possible the total assets and total equity, on a standalone IFRSs basis, of the entities which are included in the Group consolidation on different bases for accounting and regulatory purposes. The figures shown therefore include intra-Group balances.
For insurance entities, the present value of in-force long-term insurance business asset of $5.7bn and the related deferred tax liability are recognised at the financial reporting consolidated level only, and are therefore not included in the asset or equity positions for the stand-alone entities presented in table 5. In addition, these figures
exclude any deferred acquisition cost assets that may be recognised in the entities’ stand-alone financial reporting.
For associates, table 5 shows the total assets and total equity of the entity as a whole rather than HSBC’s share in the entities’ balance sheets.
Measurement of regulatory exposures
This section sets out the main reasons why the measurement of regulatory exposures is not directly comparable with the financial information presented in the Annual Report and Accounts 2015.

Capital and Risk Management Pillar 3 Disclosures at 31 December 2015 (continued)
HSBC HOLDINGS PLC
13
The Pillar 3 Disclosures 2015 are prepared in accordance with regulatory capital adequacy concepts and rules, while the Annual Report and Accounts 2015 are prepared in accordance with IFRSs. The purpose of the regulatory balance sheet is to provide a point in time value of all on-balance sheet assets. The regulatory exposure value includes an estimation of risk, and is expressed as the amount expected to be outstanding if and when the counterparty defaults. The difference between total assets on the regulatory balance sheet as shown in table 6a, and the credit risk and CCR exposure values shown in table 6b below, is principally attributable to the following factors:
Credit risk and CCR exposures Various assets on the regulatory balance sheet, such as intangible goodwill and assets, are excluded from the calculation of the credit risk exposure value as they are deducted from capital. The regulatory balances are adjusted for the effect of the differences in the basis for regulatory and accounting netting, and in the treatment of financial collateral.
Credit risk exposures only When assessing credit risk exposures within the regulatory balance sheet, the Basel Committee’s approach used to report the asset in question determines the calculation method for EAD. Using the STD approach, the regulatory exposure value is based on the regulatory balance sheet amount, applying a number of further regulatory adjustments. Using IRB approaches, the regulatory EAD is either determined using supervisory (foundation) or internally modelled (advanced) methods. EAD takes account of off-balance sheet items, such as the undrawn portion of committed facilities, various trade finance commitments and guarantees, by applying CCFs to these items. Assets on the regulatory balance sheet, as shown in table 4, are net of impairments. EAD, however, is only reduced for impairments under the standardised approach. Impairments under the IRB approach are not used to reduce the EAD amount.
CCR exposures only For regulatory purposes, trading book items, derivatives and securities financing items in the banking book are treated under the rules for CCR. CCR exposures express the risk that the counterparty to a transaction may default before completing the satisfactory settlement of the transaction. See table 48 for a comparison of derivative accounting balances and CCR exposure for derivatives. HSBC uses the mark-to-market method and the IMM approach to calculate CCR EAD. Under the mark-to-market method EAD is based on the balance sheet fair value of the instrument plus an add-on for PFE. Under the IMM approach, modelled exposure value replaces the fair value on the balance sheet.
Moreover, regulatory exposure classes are based on different criteria from accounting asset types and are therefore not comparable on a line by line basis.
The following tables show in two steps how the accounting values in the regulatory balance sheet link to regulatory EAD.
In a first step, table 6a below shows a breakdown of the accounting balances into the risk types that form the basis for regulatory capital requirements. Table 6b then shows the main differences between the accounting balances and regulatory exposures by regulatory risk type.

Capital and Risk Management Pillar 3 Disclosures at 31 December 2015 (continued)
HSBC HOLDINGS PLC
14
Table 6a: Mapping of financial statement categories with regulatory risk categories Carrying value of items:
Regulatory
balance Subject to credit risk
Subject to CCR
Subject to securitisation
Subject to the
market risk
Subject to deduction
from capital or not subject to regulatory
capital sheet1 framework framework2 framework3 framework requirements $bn $bn $bn $bn $bn $bnAssets Cash and balances at central banks 127.7 127.7 – – – –Items in the course of collection from other banks 5.8 5.8 – – – –Hong Kong Government certificates of indebtedness 28.4 28.4 – – – –Trading assets 229.5 4.4 17.4 – 225.1 –Financial assets designated at fair value 2.4 2.4 – – – –Derivatives 288.8 0.3 287.5 0.9 288.5 –Loans and advances to banks 103.8 103.8 – – – –Loans and advances to customers 1,037.0 1,027.5 – 9.5 – –Reverse repurchase agreements – non-trading 152.9 5.9 147.0 – –Financial investments 420.0 408.7 – 11.3 – –Assets held for sale 39.8 32.8 5.3 – – 1.7Capital invested in insurance and other entities 2.4 2.4 – – – –Current tax assets 1.2 1.2 – – – –Prepayments, accrued income and other assets 61.5 44.9 – – 11.5 5.1Interests in associates and joint ventures 0.6 – – – – 0.6Goodwill and intangible assets 19.2 – – – – 19.2Deferred tax assets 6.8 7.8 – – – (1.0)
Total assets at 31 December 2015 2,527.8 1,804.0 457.2 21.7 525.1 25.6 Cash and balances at central banks 160.7 160.7 – – – –Items in the course of collection from other banks 5.0 5.0 – – – –Hong Kong Government certificates of indebtedness 27.7 27.7 – – – –Trading assets 305.8 – 23.1 – 305.8 1.1Financial assets designated at fair value 3.6 3.6 – – – –Derivatives 345.3 – 344.6 0.7 345.3 –Loans and advances to banks 117.4 115.3 – 2.1 – –Loans and advances to customers 1,080.3 1,078.1 – 2.2 – –Reverse repurchase agreements – non-trading 169.2 7.5 161.7 – – –Financial investments 398.2 385.8 – 12.4 – –Capital invested in insurance and other entities 2.5 2.5 – – – –Current tax assets 1.3 1.3 – – – –Prepayments, accrued income and other assets 78.4 57.6 – – 15.7 5.0Interests in associates and joint ventures 0.7 0.7 – – – –Goodwill and intangible assets 22.6 – – – – 22.6Deferred tax assets 7.7 6.7 – – – 1.0
Total assets at 31 December 2014 2,726.4 1,852.5 529.4 17.4 666.8 29.7
1 The amounts shown in the column ‘Regulatory balance sheet’ do not equal the sum of the amounts shown in the remaining columns of this table for line items ‘Derivatives’ and ‘Trading assets’, as some of the assets included in these items are subject to regulatory capital charges for both CCR and market risk.
2 The amounts shown in the column ‘Subject to CCR framework’ include both banking book and trading book. 3 The amounts shown in the column ‘Subject to securitisation framework’ only include banking book. Trading book securitisation positions are included
in the market risk column.
Capital and Risk Management Pillar 3 Disclosures at 31 December 2015 (continued)
HSBC HOLDINGS PLC
15
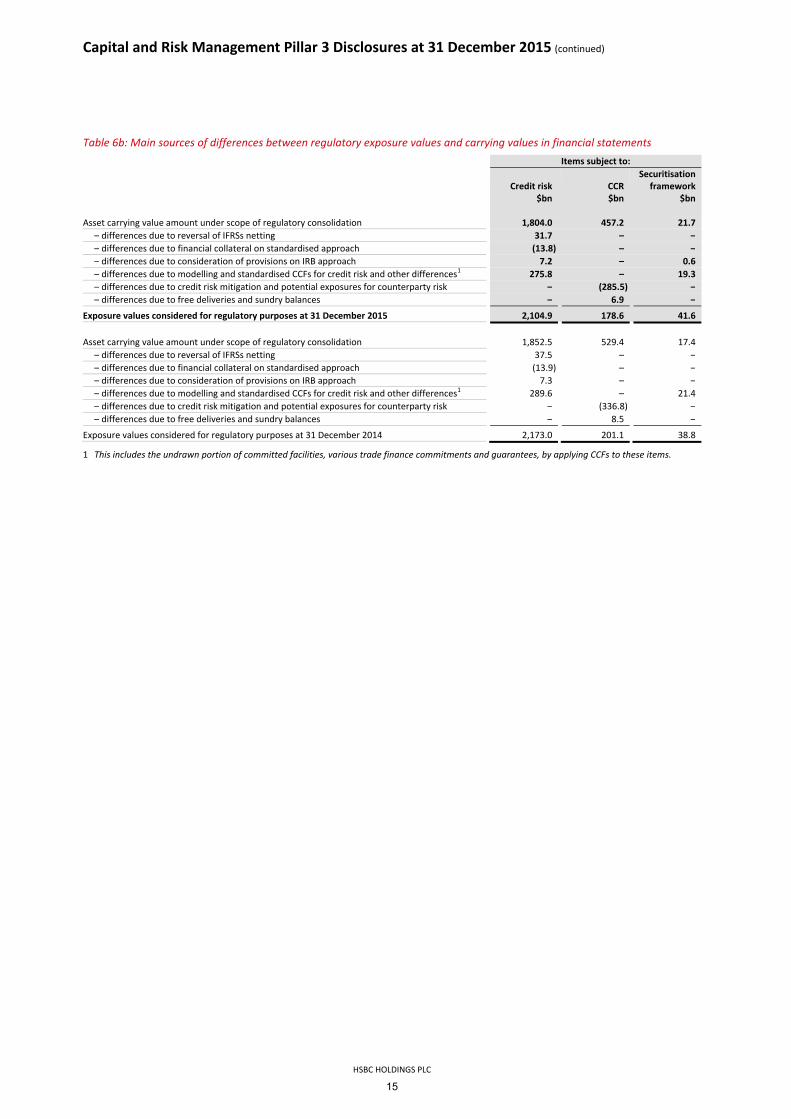
Table 6b: Main sources of differences between regulatory exposure values and carrying values in financial statements Items subject to:
Credit risk CCR Securitisation
framework $bn $bn $bn Asset carrying value amount under scope of regulatory consolidation 1,804.0 457.2 21.7
– differences due to reversal of IFRSs netting 31.7 – –– differences due to financial collateral on standardised approach (13.8) – –– differences due to consideration of provisions on IRB approach 7.2 – 0.6– differences due to modelling and standardised CCFs for credit risk and other differences1 275.8 – 19.3– differences due to credit risk mitigation and potential exposures for counterparty risk – (285.5) –– differences due to free deliveries and sundry balances – 6.9 –
Exposure values considered for regulatory purposes at 31 December 2015 2,104.9 178.6 41.6 Asset carrying value amount under scope of regulatory consolidation 1,852.5 529.4 17.4
– differences due to reversal of IFRSs netting 37.5 – –– differences due to financial collateral on standardised approach (13.9) – –– differences due to consideration of provisions on IRB approach 7.3 – –– differences due to modelling and standardised CCFs for credit risk and other differences1 289.6 – 21.4– differences due to credit risk mitigation and potential exposures for counterparty risk – (336.8) –– differences due to free deliveries and sundry balances – 8.5 –
Exposure values considered for regulatory purposes at 31 December 2014 2,173.0 201.1 38.8
1 This includes the undrawn portion of committed facilities, various trade finance commitments and guarantees, by applying CCFs to these items.

Capital and Risk Management Pillar 3 Disclosures at 31 December 2015 (continued)
HSBC HOLDINGS PLC
16
Capital and risk Capital management
Approach and policy
Our approach to capital management is designed to ensure that we exceed current regulatory requirements and that we respect the payment priority of our capital providers. We aim to maintain a strong capital base, to support the risks inherent in our business and to invest in accordance with our six filters framework, exceeding both consolidated and local regulatory capital requirements at all times.
Our capital management process culminates in the annual Group capital plan, which is approved by the Board. HSBC Holdings is the primary provider of equity capital to its subsidiaries and also provides them with non-equity capital where necessary. These investments are substantially funded by HSBC Holdings’ issuance of equity and non-equity capital and by profit retention. As part of its capital management process, HSBC Holdings seeks to maintain a balance between the composition of its capital and its investment in subsidiaries. Subject to the above, there is no current or foreseen impediment to HSBC Holdings’ ability to provide such investments.
Each subsidiary manages its own capital to support its planned business growth and meet its local regulatory requirements within the context of the Group capital plan. Capital generated by subsidiaries in excess of planned requirements is returned to HSBC Holdings, normally by way of dividends, in accordance with the Group’s capital plan.
The ability of subsidiaries to pay dividends or advance monies to HSBC Holdings depends on, among other things, their respective local regulatory capital and banking requirements, exchange controls, statutory reserves, and financial and operating performance. During 2015, none of the Group’s subsidiaries experienced significant restrictions on paying dividends or repaying loans and advances. Also, there are no foreseen restrictions envisaged by our subsidiaries, with the exception of HSBC North America Holdings Inc., on paying dividends or repaying loans and advances. None of our subsidiaries which are excluded from the regulatory consolidation have capital resources below their minimum regulatory requirement. For further details of our approach to capital management, please see page 243 of the Annual Report and Accounts 2015.
Risks to capital
Our top and emerging risks are regularly evaluated to assess the impact on our businesses and core capital position. This evaluation extends to a number of risks not technically within the scope of our top and emerging risks, but which are identified as presenting risks to capital due to their potential to impact the Group’s RWAs and/or capital supply position. The downside or upside scenarios are assessed against the Group’s capital management objectives and mitigating actions are assigned to senior management as necessary.
Stress testing
Our stress testing and scenario analysis programme enables us to understand the sensitivities of the core assumptions in our capital plans and assessment of our internal and regulatory capital requirements to the adverse effect of extreme, but plausible events. Stress testing allows us to formulate our response and mitigate risk in advance of actual conditions exhibiting the stresses identified in the scenarios and is closely aligned to our monitoring of top and emerging risks.
The governance and management of enterprise-wide stress testing is overseen by the Stress Testing Management Board, chaired by the Group Finance Director, to ensure appropriate senior management oversight and governance of the stress test programmes. Models used within stress testing are approved through functional MOCs, with expert stress testing support during development. Updates are provided regularly to meetings of the RMM. The GRC is informed and consulted on the Group’s stress testing activities, as appropriate, and approves the key elements of the Bank of England concurrent stress test, including final results.
We are subject to regulatory stress testing in many jurisdictions. These exercises are designed to assess the resilience of banks to adverse economic or political developments and ensure that they have robust, forward-looking capital planning processes that account for their unique risks. They include the programmes of the Bank of England, the Federal Reserve Board, the Office of the Comptroller of the Currency, the EBA, HKMA and other regulators. Assessment by regulators is on both a quantitative and qualitative basis, the latter focusing on our portfolio quality, data provision, stress testing capability and internal management processes.
In addition, we have conducted an internal stress test, which incorporated the latest portfolio developments and business plan. For this exercise, management considered that the Bank of England 2015 scenario reflected key risks which merited examination at that time. The results of this exercise are used for internal risk and capital management processes, including the ICAAP. Further details of the Group’s regulatory stress tests are given on page 116 of the Annual Report and Accounts 2015.
Overview of regulatory capital framework
Introduction
Capital and RWAs are calculated and presented on the Group’s interpretation of CRD IV legislation and the PRA’s rules as set out in the PRA Rulebook.
The section below sets out details of the capital that is eligible for regulatory purposes, and the composition of the Group’s regulatory capital. It describes our Pillar 1 capital requirements as well as the Pillar 2 and capital buffers framework. Finally, it discusses the leverage ratio, which has assumed increasing importance for the FPC and the PRA as a non-risk-based measure supplementing the Basel Committee’s risk-based methodology.

Capital and Risk Management Pillar 3 Disclosures at 31 December 2015 (continued)
HSBC HOLDINGS PLC
17
Eligible regulatory capital
The capital position presented on a CRD IV transitional basis follows the Group’s interpretation of CRD IV legislation and the PRA’s rules as set out in the PRA Rulebook.
The effects of draft EBA technical standards are not generally captured in our numbers.
While CRD IV allows for the majority of regulatory adjustments and deductions from CET1 to be implemented on a gradual basis from 1 January 2014 to 1 January 2018, the PRA has largely decided not to make use of these transitional provisions. From 1 January 2015, unrealised gains on investment property and AFS securities were recognised in CET1 capital. As a result, our end point and transitional CET1 capital and ratios are now aligned.
For additional tier 1 and tier 2 capital, the PRA has followed the transitional provisions timing as set out in CRD IV to apply the necessary regulatory adjustments and deductions. The effect of these adjustments is being phased in at 20% per annum from 1 January 2014 to 1 January 2018.
Non-CRD IV compliant additional tier 1 and tier 2 instruments also benefit from a grandfathering period. This progressively reduces the eligible amount by 10% annually, following an initial reduction of 20% on 1 January 2014, until they are fully phased out by 1 January 2022.
Under CRD IV, as implemented in the UK, banks are required to meet a minimum CET1 ratio of 4.5% of RWAs, a minimum tier 1 ratio of 6% of RWAs, and a total capital ratio of 8% of RWAs. In addition to the Pillar 1 minimum ratios, the PRA sets Pillar 2A capital requirements, which together are considered the minimum level of regulatory
capital to be maintained at all times. Pillar 2A is to be met with at least 56% CET1 capital and the remaining with non-common equity capital.
In addition to minimum requirements, CRD IV establishes a number of capital buffers to be met with CET1 capital, which largely phase-in from 1 January 2016. To the extent our CET1 capital is not enough to meet these buffer requirements, the Group would suffer automatic restrictions on capital distributions.
Going forward, as the grandfathering provisions fall away, we intend to meet our overall regulatory minima in an economically efficient manner by issuing non-common equity capital as necessary. At 31 December 2015, the Group had $25.1bn of CRD IV compliant non-common equity capital instruments, of which $3.2bn of tier 2 and $3.6bn of additional tier 1 were issued during the year (for details on the additional tier 1 instruments issued during the year see Note 35 of the Annual Report and Accounts 2015). At 31 December 2015, the Group also had $32.8bn of non-common equity capital instruments qualifying as eligible capital under CRD IV by virtue of the application of the grandfathering provisions, after applying a 30% reduction as outlined above. For a full disclosure of the CET1, tier 1 and total capital position on a ‘transitional basis’ at 31 December 2015, see Appendix III of this report.
Pillar 1
Pillar 1 covers the capital resources requirements for credit risk, market risk and operational risk. Credit risk includes CCR and securitisation requirements. These requirements are expressed in terms of RWAs.

Capital and Risk Management Pillar 3 Disclosures at 31 December 2015 (continued)
HSBC HOLDINGS PLC
18
Risk category Scope of permissible approaches Approach adopted by HSBC
Credit risk The Basel Committee framework applies three approaches of increasing sophistication to the calculation of Pillar 1 credit risk capital requirements. The most basic level, the standardised approach, requires banks to use external credit ratings to determine the risk weightings applied to rated counterparties. Other counterparties are grouped into broad categories and standardised risk weightings are applied to these categories. The next level, the IRB foundation approach, allows banks to calculate their credit risk capital requirements on the basis of their internal assessment of a counterparty’s PD, but subjects their quantified estimates of EAD and LGD to standard supervisory parameters. Finally, the IRB advanced approach allows banks to use their own internal assessment in both determining PD and quantifying EAD and LGD.
For consolidated Group reporting, we have adopted the advanced IRB approach for the majority of our business. Some portfolios remain on the standardised or foundation IRB approaches: • pending the issuance of local regulations or model
approval; • following supervisory prescription of a non-
advanced approach; or • under exemptions from IRB treatment. Further information on our IRB roll-out plan may be found on page 46.
Counterparty credit risk Three approaches to calculating CCR and determining exposure values are defined by the Basel Committee: mark-to-market, standardised and IMM. These exposure values are used to determine capital requirements under one of the credit risk approaches; standardised, IRB foundation and IRB advanced.
We use the mark-to-market and IMM approaches for CCR. Details of the IMM permission we have received from the PRA can be found in the Financial Services Register on the PRA website. Our aim is to increase the proportion of positions on IMM over time.
Equity
For banking book, equity exposures can be assessed under standardised or IRB approaches.
For Group reporting purposes all equity exposures are treated under the standardised approach.
Securitisation
Basel specifies two methods for calculating credit risk requirements for securitisation positions in the banking book: the standardised approach and the IRB approach, which incorporates the RBM, the IAA and the SFM.
For the majority of the securitisation non-trading book positions we use the IRB approach, and within this principally the RBM, with lesser amounts on the IAA and the SFM. We also use the standardised approach for an immaterial amount of non-trading book positions. Securitisation positions in the trading book are treated within market risk, using the PRA’s standard rules.
Market risk
Market risk capital requirements can be determined under either the standard rules or the IMA. The latter involves the use of internal VaR models to measure market risks and determine the appropriate capital requirement. The IRC also applies.
The market risk capital requirement is measured using internal market risk models, where approved by the PRA, or under the standard rules. Our internal market risk models comprise VaR, stressed VaR and IRC. Non-proprietary details of the scope of our IMA permission are available in the Financial Services Register on the PRA website. We are in compliance with the requirements set out in Articles 104 and 105 of the Capital Requirements Regulation.
Operational risk
The Basel Committee allows for firms to calculate their operational risk capital requirement under the basic indicator approach, the standardised approach or the advanced measurement approach.
We have historically adopted and currently use the standardised approach in determining our operational risk capital requirement. We are in the process of implementing an operational risk model which we will use for economic capital calculation purposes.

Capital and Risk Management Pillar 3 Disclosures at 31 December 2015 (continued)
HSBC HOLDINGS PLC
19
Capital buffers
CRD IV establishes a number of capital buffers, to be met by CET1 capital, broadly aligned with the Basel III framework. In the UK, with the exception of the CCyB which applied with immediate effect, the remaining CRD IV capital buffers are phased in from 1 January 2016. For more details on capital buffers, see page 28.
Pillar 2
We conduct an annual ICAAP to determine a forward-looking assessment of our capital requirements given our business strategy, risk profile, risk appetite and capital plan. This process incorporates the Group’s risk management processes and governance framework. A range of stress tests are applied to our base capital plan. These, coupled with our economic capital framework and other risk management practices, are used to assess our internal capital adequacy requirements and inform our view of our internal capital planning buffer. The ICAAP is formally approved by the Board, which has the ultimate responsibility for the effective management of risk and approval of HSBC’s risk appetite.
The ICAAP is examined by the PRA as part of its supervisory review and evaluation process, which occurs periodically to enable the regulator to define the ICG or minimum capital requirements for HSBC and our PRA buffer where required. Under the revised Pillar 2 PRA regime, which came into effect from 1 January 2016, the capital planning buffer was replaced with a PRA buffer. This is not intended to duplicate the CRD IV buffers, and where necessary will be set according to vulnerability in a stress scenario, as assessed through the annual PRA stress testing exercise. For more details on Pillar 2, see pages 25 and 29.
Leverage ratio
The leverage ratio was introduced into the Basel III framework as a non-risk-based limit, to supplement risk-based capital requirements. It aims to constrain the build-up of excess leverage in the banking sector, introducing additional safeguards against model risk and measurement errors. The Basel III leverage ratio is a volume-based measure calculated as tier 1 capital divided by total on- and off-
balance sheet exposures. This ratio has been implemented in the EU for reporting and disclosure purposes but, at this stage, has not been set as a binding requirement.
The PRA has implemented a UK framework for the leverage ratio with effect from 1 January 2016, setting minimum requirements. For more details on the leverage ratio, see pages 27 and 30.
Composition of regulatory capital
Capital and RWAs are calculated and presented on the Group’s interpretation of final CRD IV legislation and the PRA’s final rules as set out in the PRA Rulebook. For a table of the movement in total regulatory capital during the year to 31 December 2015, see page 233 of the Annual Report and Accounts 2015.
All capital securities included in the capital base of HSBC have been either issued as fully compliant CRD IV securities (on an end point basis) or in accordance with the rules and guidance in the PRA’s previous General Prudential Sourcebook which are included in the capital base by virtue of application of the CRD IV grandfathering provisions. The main features of capital securities issued by the Group, categorised as tier 1 and tier 2 capital, are set out on the HSBC internet site www.hsbc.com.
The values disclosed are the IFRSs balance sheet carrying amounts, not the amounts that these securities contribute to regulatory capital. For example, the IFRSs accounting and the regulatory treatments differ in their approaches to issuance costs, regulatory amortisation and regulatory eligibility limits prescribed in the grand-fathering provisions under CRD IV. The composition of capital under the current regulatory requirements is provided in the table below. The alphabetic references link back to table 4: ‘Reconciliation of balance sheets – financial accounting to regulatory scope of consolidation’, which shows where these items are presented in the respective balance sheets. Not all items are reconcilable, due to regulatory adjustments that are applied, for example to non-common equity capital securities before they can be included in the Group’s regulatory capital base.

Capital and Risk Management Pillar 3 Disclosures at 31 December 2015 (continued)
HSBC HOLDINGS PLC
20
Table 7: Composition of regulatory capital At 31 December
Ref1 2015
$m 2014
$m Common equity tier 1 capital Shareholders’ equity 160,664 166,617
– shareholders’ equity per balance sheet2 a 188,460 190,447– foreseeable interim dividend3 (3,717) (3,362)– preference share premium b (1,405) (1,405)– other equity instruments c (15,112) (11,532)– deconsolidation of special purpose entities4 a (91) (323)– deconsolidation of insurance entities a, h (7,471) (7,208)
Non-controlling interests 3,519 4,640– non-controlling interests per balance sheet d 9,058 9,531– preference share non-controlling interests e (2,077) (2,127)– non-controlling interests transferred to tier 2 capital f – (473)– non-controlling interests in deconsolidated subsidiaries d (933) (851)– surplus non-controlling interests disallowed in CET1 (2,529) (1,440)
Regulatory adjustments to the accounting basis (4,556) (3,556)– own credit spread5 (159) 767– debit valuation adjustment (336) (197)– defined benefit pension fund adjustment g (4,009) (4,069)– cash flow hedging reserve (52) (57)
Deductions (28,764) (31,748)– goodwill and intangible assets h (20,650) (22,475)– deferred tax assets that rely on future profitability (excludes those arising from temporary
differences) n
(1,204) (1,036)– additional valuation adjustment (referred to as PVA) (1,151) (1,341)– investments in own shares through the holding of composite products of which HSBC is a component
(exchange traded funds, derivatives and index stock) (839) (1,083)– negative amounts resulting from the calculation of expected loss amounts i (4,920) (5,813)
Common equity tier 1 capital on an end point basis 130,863 135,953 Tier 1 and tier 2 capital on a transitional basis
Common equity tier 1 capital on an end point basis 130,863 135,953Transitional adjustments (2,753)
– unrealised gains arising from revaluation of property (1,375)– unrealised gains in available-for-sale debt and equities (1,378)
Common equity tier 1 capital on a transitional basis 130,863 133,200 Additional tier 1 capital on a transitional basis Other tier 1 capital before deductions 22,621 19,687
– preference share premium b 1,015 1,160– preference share non-controlling interests e 1,711 1,955– allowable non-controlling interest in AT1 d 1,546 884– hybrid capital securities j 18,349 15,688
Deductions (181) (148)– unconsolidated investments6 (121) (148)– holding of own additional tier 1 instruments (60) –
Tier 1 capital on a transitional basis 153,303 152,739 Tier 2 capital on a transitional basis Total qualifying tier 2 capital before deductions 36,852 38,213
– allowable non-controlling interest in tier 2 d 14 99– perpetual subordinated debt l 1,941 2,218– term subordinated debt m 34,897 35,656– non-controlling interests in tier 2 capital f – 240
Total deductions other than from tier 1 capital (322) (222)– unconsolidated investments6 (282) (222)– holding of own tier 2 instruments (40) –
Total regulatory capital on a transitional basis 189,833 190,730
1 The references (a) – (n) identify balance sheet components on page 8 which are used in the calculation of regulatory capital. 2 Includes externally verified profits for the year ended 31 December 2015. 3 This includes dividends on ordinary shares, quarterly dividends on preference shares and coupons on capital securities, classified as equity. 4 Mainly comprise unrealised gains/losses in AFS debt securities related to SPEs. 5 Includes own credit spread on trading liabilities. 6 Mainly comprise investments in insurance entities.

Capital and Risk Management Pillar 3 Disclosures at 31 December 2015 (continued)
HSBC HOLDINGS PLC
21
Table 8: Reconciliation of regulatory capital from transitional basis to an estimated CRD IV end point basis At 31 December
2015
$m 2014
$mCommon equity tier 1 capital on a transitional basis 130,863 133,200
Unrealised gains arising from revaluation of property 1,375Unrealised gains in available-for-sale debt and equities 1,378
Common equity tier 1 capital on an end point basis 130,863 135,953Additional tier 1 capital on a transitional basis 22,440 19,539Grandfathered instruments:
Preference share premium (1,015) (1,160)Preference share non-controlling interests (1,711) (1,955)Hybrid capital securities (9,088) (10,007)
Transitional provisions: Allowable non-controlling interest in AT1 (1,377) (487)Unconsolidated investments1 121 148
Additional tier 1 capital end point basis 9,370 6,078Tier 1 capital on an end point basis 140,233 142,031 Tier 2 capital on a transitional basis 36,530 37,991Grandfathered instruments:
Perpetual subordinated debt (1,941) (2,218)Term subordinated debt (19,034) (21,513)
Transitional provisions: Non-controlling interest in tier 2 capital – (240)Allowable non-controlling interest in tier 2 21 396Unconsolidated investments1 (121) (148)
Tier 2 capital on an end point basis 15,455 14,268Total regulatory capital on an end point basis 155,688 156,299
1 Mainly comprise investments in insurance entities. Pillar 1 requirements and RWA flow
This section describes our Pillar 1 capital requirements, with a high-level view of the related RWAs.
Table 9 shows total RWAs by risk type. Tables 10 to 17 with accompanying narratives set out, for credit, counterparty
credit and market risks, first RWAs by Basel approach and then the movements during the year in IRB/model-based RWAs.
Table 9: Total RWAs by risk type
At 31 December2015 2014$bn $bn
Credit risk 875.9 955.3Counterparty credit risk 69.2 90.7Market risk 42.5 56.0Operational risk 115.4 117.8
1,103.0 1,219.8 The following comments describe the key RWA movements excluding foreign currency translation differences.
RWA initiatives
The main drivers were:
• $38bn as a result of reduced exposures, the partial disposal of our investment in Industrial Bank, a decrease in trading positions subject to the Incremental Risk Charge, client facility reductions and trade compressions;
• $30bn from refining our calculations, including the further application of the SME supporting factor, a more refined application of CCF, increased usage of ‘IRB’ models and the move of certain exposures from residual to cash flow weighted maturity;
• $25bn from process improvements such as better linking of collateral and guarantees to facilities, enhanced risk parameters and the use of more granular data resulting in lower CCFs for off-balance sheet items; and
• $30bn through the continued reduction in the GB&M legacy credit and US run-off portfolios.
Business growth
Business growth increased RWAs by $49bn, principally in:
• CMB, from higher term lending to corporate customers, principally in Europe, North America and Asia, $23bn;
• our associates, Bank of Communications and Saudi British Bank, $14bn; and
• GB&M, from higher general lending to corporates which increased RWAs by $10bn, mainly in Europe.

Capital and Risk Management Pillar 3 Disclosures at 31 December 2015 (continued)
HSBC HOLDINGS PLC
22
Credit Risk RWAs
Table 10: Credit risk – RWAs by region and approach
Europe Asia MENA North
America Latin
America Total $bn $bn $bn $bn $bn $bn
IRB approach 192.6 195.9 19.4 122.5 12.8 543.2– IRB advanced approach 175.1 195.9 9.5 122.5 12.8 515.8– IRB foundation approach 17.5 – 9.9 – – 27.4
Standardised approach 46.8 177.7 32.0 33.9 42.3 332.7
At 31 December 2015 239.4 373.6 51.4 156.4 55.1 875.9 IRB approach 216.1 213.1 15.6 142.0 11.6 598.4
– IRB advanced approach 203.3 213.1 11.6 142.0 11.6 581.6– IRB foundation approach 12.8 – 4.0 – – 16.8
Standardised approach 47.1 186.0 39.0 29.6 55.2 356.9
At 31 December 2014 263.2 399.1 54.6 171.6 66.8 955.3
Table 11: Credit risk – RWAs by global business and approach
Principal RBWM1
RBWM (US run-off)
Total RBWM CMB1 GB&M GPB Other Total
$bn $bn $bn $bn $bn $bn $bn $bn
IRB approach 59.0 33.2 92.2 218.0 214.8 8.5 9.7 543.2– IRB advanced approach 59.0 33.2 92.2 199.0 207.5 8.4 8.7 515.8– IRB foundation approach – – – 19.0 7.3 0.1 1.0 27.4
Standardised approach 57.6 3.8 61.4 172.0 69.7 7.2 22.4 332.7
At 31 December 2015 116.6 37.0 153.6 390.0 284.5 15.7 32.1 875.9 IRB approach 56.1 47.3 103.4 217.2 255.6 10.2 12.0 598.4
– IRB advanced approach 56.1 47.3 103.4 209.2 248.1 10.0 10.9 581.6– IRB foundation approach – – – 8.0 7.5 0.2 1.1 16.8
Standardised approach 61.2 4.8 66.0 181.0 70.1 6.6 33.2 356.9
At 31 December 2014 117.3 52.1 169.4 398.2 325.7 16.8 45.2 955.3
1 In the first half of 2015, a portfolio of customers was transferred from CMB to RBWM in Latin America in order to better align the combined banking needs of the customers with our established global businesses. Comparative data have been re-presented accordingly.
Credit risk RWAs are calculated using three approaches, as permitted by the PRA. For consolidated Group reporting, we have adopted the advanced IRB approach for the majority of our business, with a small proportion being on the foundation IRB approach and the remaining portfolios on the standardised approach.
Standardised approach
For portfolios treated under the standardised approach, credit risk RWAs decreased by $24bn, which included a reduction of $27bn due to foreign exchange movements.
• RWAs increased by $23bn across all regions as a result of higher lending. Growth in our associate, BoCom, accounted for $15bn.
• This was offset by RWA initiatives reducing RWAs by $29bn, mainly comprising portfolios moving to an IRB approach (reducing the standardised approach by $10.2bn and increasing the IRB approach by $7.2bn) and partial disposal of our investment in Industrial Bank reducing RWAs by $12.4bn.

Capital and Risk Management Pillar 3 Disclosures at 31 December 2015 (continued)
HSBC HOLDINGS PLC
23
Table 12: RWA movement by region by key driver – credit risk – IRB only
Europe Asia MENANorth
AmericaLatin
America Total $bn $bn $bn $bn $bn $bnRWAs at 1 January 2015 216.1 213.1 15.6 142.0 11.6 598.4Foreign exchange movement (10.4) (7.2) (0.6) (4.7) (3.4) (26.3)Acquisitions and disposals (14.1) – (0.1) (4.9) – (19.1)Book size 11.4 2.9 (0.5) (2.8) 0.4 11.4Book quality (8.0) (6.9) (1.4) 0.7 3.9 (11.7)Model updates 1.2 (2.6) 4.7 0.2 0.1 3.6
– portfolios moving onto IRB approach (0.1) – 4.7 0.2 0.1 4.9– new/updated models 1.3 (2.6) – – – (1.3)
Methodology and policy (3.6) (3.4) 1.7 (8.0) 0.2 (13.1)– internal updates (6.2) (5.4) 1.6 (8.0) 0.2 (17.8)– external updates – regulatory 2.6 2.0 0.1 – – 4.7
Total RWA movement (23.5) (17.2) 3.8 (19.5) 1.2 (55.2)RWAs at 31 December 2015 192.6 195.9 19.4 122.5 12.8 543.2 RWAs at 1 January 2014 on Basel 2.5 basis 166.9 182.9 15.0 161.5 8.5 534.8Foreign exchange movement (11.6) (4.0) (0.2) (2.4) (1.9) (20.1)Acquisitions and disposals (3.5) – (0.7) (4.2) (0.1) (8.5)Book size 11.4 19.5 1.8 2.9 2.0 37.6Book quality (1.5) – (0.8) (10.3) 1.4 (11.2)Model updates 19.4 0.3 – (6.1) – 13.6Methodology and policy 35.0 14.4 0.5 0.6 1.7 52.2
– internal updates (11.7) (5.2) (0.2) (6.4) (0.1) (23.6)– external updates – regulatory 2.2 8.5 (0.2) 0.7 0.1 11.3– CRD IV impact 37.0 5.7 0.4 4.9 0.2 48.2– NCOA moving from STD to IRB 7.5 5.4 0.5 1.4 1.5 16.3
Total RWA movement 49.2 30.2 0.6 (19.5) 3.1 63.6RWAs at 31 December 2014 on CRD IV basis 216.1 213.1 15.6 142.0 11.6 598.4 Table 13: RWA movement by global business by key driver – credit risk – IRB only
Principal RBWM1
RBWM(US run-
off)Total
RBWM CMB1 GB&M GPB Other Total $bn $bn $bn $bn $bn $bn $bn $bn
RWAs at 1 January 2015 56.1 47.3 103.4 217.2 255.6 10.2 12.0 598.4
Foreign exchange movement (2.9) – (2.9) (11.7) (11.0) (0.3) (0.4) (26.3)Acquisitions and disposals – (4.9) (4.9) – (14.2) – – (19.1)Book size 3.7 (5.6) (1.9) 15.8 (0.8) (0.5) (1.2) 11.4Book quality (2.8) (3.7) (6.5) 6.0 (10.5) (0.1) (0.6) (11.7)Model updates 0.4 – 0.4 5.6 (2.3) (0.1) – 3.6
– portfolios moving onto IRB approach – – – 4.1 0.9 (0.1) – 4.9– new/updated models 0.4 – 0.4 1.5 (3.2) – – (1.3)
Methodology and policy 4.5 0.1 4.6 (14.9) (2.0) (0.7) (0.1) (13.1)– internal updates 2.5 0.1 2.6 (14.9) (4.7) (0.7) (0.1) (17.8)– external updates – regulatory 2.0 – 2.0 – 2.7 – – 4.7
Total RWA movement 2.9 (14.1) (11.2) 0.8 (40.8) 1.7 (2.3) (55.2)RWAs at 31 December 2015 59.0 33.2 92.2 218.0 214.8 8.5 9.7 543.2 RWAs at 1 January 2014 on Basel 2.5 basis 58.5 72.6 131.1 189.4 198.5 10.6 5.2 534.8
Foreign exchange movement (2.6) – (2.6) (8.7) (8.1) (0.2) (0.5) (20.1)Acquisitions and disposals – – – – (8.2) – (0.3) (8.5)Book size 1.9 (6.9) (5.0) 23.1 21.1 (0.5) (1.1) 37.6Book quality (5.7) (8.6) (14.3) 2.8 (0.2) (0.3) 0.8 (11.2)Model updates 0.6 (6.2) (5.6) 12.2 7.0 – – 13.6Methodology and policy 3.4 (3.6) (0.2) (1.6) 45.5 0.6 7.9 52.2
– internal updates (3.0) (3.9) (6.9) (5.0) (11.2) (0.5) – (23.6)– external updates – regulatory 1.8 – 1.8 2.5 6.3 0.5 0.2 11.3– CRD IV impact – – – (0.7) 48.6 0.2 0.1 48.2– NCOA moving from STD to IRB 4.6 0.3 4.9 1.6 1.8 0.4 7.6 16.3
Total RWA movement (2.4) (25.3) (27.7) 27.8 57.1 (0.4) 6.8 63.6RWAs at 31 December 2014 on CRD IV basis 56.1 47.3 103.4 217.2 255.6 10.2 12.0 598.4
1 In the first half of 2015, a portfolio of customers was transferred from CMB to RBWM in Latin America in order to better align the combined banking needs of the customers with our established global businesses. Comparative data have been re-presented accordingly.

Capital and Risk Management Pillar 3 Disclosures at 31 December 2015 (continued)
HSBC HOLDINGS PLC
24
Internal ratings-based approach
For portfolios treated under the IRB approach, credit risk RWAs decreased by $55bn, which included a reduction of $26bn due to foreign exchange movements.
Acquisitions and disposals
• The disposal of US mortgage portfolios reduced RWAs by $4.9bn.
• The sale of securitisation positions in the GB&M legacy credit portfolio resulted in a RWA decrease of $14bn.
Book size
• The book size grew from higher corporate lending, including term and trade-related lending which increased RWAs by $16bn, mainly in Europe and Asia for CMB.
• In North America, in RBWM, continued run-off of the US CML retail mortgage portfolios resulted in an RWA reduction of $5.6bn.
Book quality
• RWAs reduced by $3.7bn in the US run-off portfolio, primarily due to continued run-off which led to an improvement in the book quality of the residual portfolio;
• book quality improvements in the Principal RBWM business of $2.8bn mainly related to credit quality improvements in Europe;
• in CMB, RWAs increased by $6.0bn, primarily as a result of corporate downgrades in Europe;
• in GB&M, a decrease in RWAs of $10bn was mainly due to the implementation of netting agreements to new corporate counterparties in Europe, the securitisation of corporate loans and rating upgrades of institutions in Asia; and
• the downgrade of Brazil’s rating increased RWAs by $3.7bn across businesses.
Methodology and policy changes
• RWA initiatives were the main driver for the reduction of RWAs driven by changes in ‘internal updates’. Further details are provided on page 21.
• They were offset by the change in RWA calculation on defaulted exposures in RBWM increasing RWAs by $2.0bn, the implementation of a risk-weight floor on mortgages in Hong Kong with an RWA impact of $2.0bn, and the implementation of a 1.06 scaling factor on securitisation positions risk-weighted at 1,250% which increased RWAs by $2.1bn.
Counterparty credit risk RWAs Table 14: Counterparty credit risk RWAs
2015
$bn 2014
$bn
Advanced approach 50.1 65.5 – CCR IRB approach 46.8 62.0– Credit valuation adjustment 3.3 3.5
Standardised approach 19.1 25.2– CCR standardised approach 4.7 4.4– Credit valuation adjustment 12.2 18.0 – Central counterparty 2.2 2.8
At 31 December 69.2 90.7
Table 15: RWA movement by key driver – counterparty credit risk – advanced approach
2015
$bn 2014
$bn
RWAs at 1 January 65.5 42.2 Book size (10.2) 1.6 Book quality (0.8) (0.6)Model updates – 0.1 Methodology and policy (4.4) 22.2
– internal updates (4.4) (3.8)– external updates – regulatory – 9.0 – CRD IV impact – 17.0
Total RWA movement (15.4) 23.3
RWAs at 31 December 50.1 65.5
Counterparty credit risk RWAs reduced by $21bn during 2015.
Standardised approach
A reduction of $6.1bn in RWAs in the standardised portfolio was mostly due to the impact of market movements and position reductions for derivatives held with counterparties eligible for the standardised CVA charge.
Advanced approach
The book size reduced by $10bn, mainly driven by market movements, particularly in foreign exchange derivatives, trade compression and portfolio management activities.
Further reductions in ‘Methodology and policy’ were mainly driven by savings from RWA initiatives.

Capital and Risk Management Pillar 3 Disclosures at 31 December 2015 (continued)
HSBC HOLDINGS PLC
25
Market risk RWAs
Table 16: Market risk RWAs 2015 2014 $bn $bn
Internal model based 34.9 44.6 – VaR 7.7 7.3 – stressed VaR 9.8 10.4 – incremental risk charge 11.4 20.1 – other VaR and stressed VaR 6.0 6.8
Standardised approach 7.6 11.4
Year to 31 December 42.5 56.0
Table 17: RWA movement by key driver – market risk – internal model based 2015 2014 $bn $bn
RWAs at 1 January 44.6 52.2
Acquisitions and disposals – (2.2)Movement in risk levels (5.5) (4.2)Methodology and policy (4.2) (1.2)
– internal updates (4.2) (3.8)– external updates – regulatory – 2.6
Total RWA movement (9.7) (7.6)
RWAs at 31 December 34.9 44.6
Total market risk RWAs decreased by $13bn in 2015.
Standardised approach
The market risk RWAs in the standardised portfolio fell by $3.8bn, mainly driven by the reduction in the legacy credit portfolio.
Internal model based
The reduction in RWAs due to movements in risk levels of $5.5bn was driven by a combination of active management of the book and market movements, in particular within the incremental risk charge. In addition to these movements, there were savings of $4.2bn in ‘Methodology and policy’ due to the refinement of models used for the calculation of the incremental risk charge and risks not in VaR.
Operational risk RWAs
The reduction in operational risk RWAs of $2.4bn was mainly the result of currency exchange differences and decline of income in Latin America.
Pillar 2 and ICAAP
Pillar 2
The processes of internal capital adequacy assessment and supervisory review, lead to a final determination by the PRA of ICG and any PRA buffer that may be required.
Within Pillar 2, Pillar 2A considers, in addition to the minimum capital requirements for Pillar 1 risks described above, any supplementary requirements for those risks and any requirements for risk categories not captured by Pillar 1. The risk categories to be covered under Pillar 2A depend on the specific circumstances of a firm and the nature and scale of its business.
Pillar 2B consists of guidance from the PRA on a capital buffer a firm would require in order to remain above its ICG in adverse circumstances that may be largely outside the firm’s normal and direct control, for example during a period of severe but plausible downturn stress, when asset values and the firm’s capital surplus may become strained. This is quantified via any PRA buffer requirement the PRA may consider necessary. The assessment of this is informed by stress tests and a rounded judgement of a firm’s business model, also taking into account the PRA’s view of a firm’s options and capacity to protect its capital position under stress, for instance through capital generation. Where the PRA assesses a firm’s risk management and governance to be significantly weak, it may also set the PRA buffer to cover the risks posed by those weaknesses until they are addressed. The PRA buffer is intended to be drawn upon in times of stress and its use is not of itself a breach of capital requirements that would trigger automatic restrictions on distributions. In specific circumstances, the PRA should agree a plan with a firm for its restoration over an agreed timescale.
Internal capital adequacy assessment
The Board manages the Group ICAAP and together with RMM, it examines the Group’s risk profile from both regulatory and economic capital viewpoints, aiming to ensure that capital resources: • remain sufficient to support our risk profile
and outstanding commitments; • exceed current regulatory requirements, and that HSBC
is well placed to meet those expected in the future; • allow the bank to remain adequately capitalised in the
event of a severe economic downturn stress scenario; and
• remain consistent with our strategic and operational goals and our shareholder and investor expectations.

Capital and Risk Management Pillar 3 Disclosures at 31 December 2015 (continued)
HSBC HOLDINGS PLC
26
The minimum regulatory capital that we are required to hold is determined by the rules and guidance established by the PRA for the consolidated Group and by local regulators for individual Group companies. These capital requirements are a primary influence shaping the business planning process, in which RWA targets are established for our global businesses in accordance with the Group’s strategic direction and risk appetite.
Economic capital is the internally calculated capital requirement which we deem necessary to support the risks to which we are exposed. The economic capital assessment is a more risk-sensitive measure than the regulatory minimum, as it covers a wider range of risks and takes account of the substantial diversification of risk accruing from our operations. Both the regulatory and the economic capital assessments rely upon the use of models that are integrated into our management of risk. Our economic capital models are calibrated to quantify the level of capital
that is sufficient to absorb potential losses over a one-year time horizon to a 99.95% level of confidence for our banking and trading activities, and to a 99.5% level of confidence for our insurance activities and pension risks.
The ICAAP and its constituent economic capital calculations are examined by the PRA as part of its supervisory review and evaluation process. This examination informs the regulator’s view of our Pillar 2 capital requirements.
Preserving our strong capital position remains a priority, and the level of integration of our risk and capital management helps to optimise our response to business demand for regulatory and economic capital. Risks that are explicitly assessed through economic capital are credit risk including CCR, market and operational risk, non-trading book interest rate risk, insurance risk, pension risk, residual risk and structural foreign exchange risk.

Capital and Risk Management Pillar 3 Disclosures at 31 December 2015 (continued)
HSBC HOLDINGS PLC
27
Leverage ratio
Table 18: Summary reconciliation of accounting assets and leverage ratio exposures
Ref1
At 31 December 2015
$bn
1 Total assets as per published financial statements 2,4102 Adjustment for entities which are consolidated for accounting purposes but are outside the scope of regulatory
consolidation
112 3 Adjustment for fiduciary assets recognised on the balance sheet pursuant to the applicable accounting framework but
excluded from the leverage ratio exposure measure
– 4 Adjustments for derivative financial instruments (141)5 Adjustments for securities financing transactions 136 Adjustment for off-balance sheet items (i.e. conversion to credit equivalent amounts of off-balance sheet exposures) 401 (Adjustment for intragroup exposures excluded from the leverage ratio exposure measure) – (Adjustment for exposures excluded from the leverage ratio exposure measure) –
7 Other adjustments (1)
8 Total leverage ratio exposure 2,794
Table 19: Leverage ratio common disclosure
Ref1
At 31 December 2015
$bn On-balance sheet exposures (excluding derivatives and SFTs)
1 On-balance sheet items (excluding derivatives, SFTs and fiduciary assets, but including collateral) 2,1042 (Asset amounts deducted in determining Tier 1 capital) (33)
3 Total on-balance sheet exposures (excluding derivatives, SFTs and fiduciary assets) 2,071
Derivative exposures 4 Replacement cost associated with all derivatives transactions (i.e. net of eligible cash variation margin) 315 Add-on amounts for PFE associated with all derivatives transactions (mark-to-market method) 125
EU-5a Exposure determined under Original Exposure Method –6 Gross-up for derivatives collateral provided where deducted from the balance sheet assets pursuant to the applicable
accounting framework
4 7 (Deductions of receivables assets for cash variation margin provided in derivatives transactions) (31)8 (Exempted CCP leg of client-cleared trade exposures) –9 Adjusted effective notional amount of written credit derivatives 20
10 (Adjusted effective notional offsets and add-on deductions for written credit derivatives) –
11 Total derivative exposures 149 Securities financing transaction exposures
12 Gross SFT assets (with no recognition of netting), after adjusting for sales accounting transactions 24313 (Netted amounts of cash payables and cash receivables of gross SFT assets) (78)14 Counterparty credit risk exposure for SFT assets 8
EU-14a Derogation for SFTs: Counterparty credit risk exposure –15 Agent transaction exposures –
EU-15a (Exempted CCP leg of client-cleared SFT exposure) –
16 Total securities financing transaction exposures 173 Other off-balance sheet exposures
17 Off-balance sheet exposures at gross notional amount 90618 (Adjustments for conversion to credit equivalent amounts) (505)
19 Total off-balance sheet exposures 401 Exempted exposures
EU-19a (Exemption of intragroup exposures (solo basis)) –EU-19b (Exposures exempted) –
Capital and total exposures 20 Tier 1 capital 140
21 Total leverage ratio exposures 2,794
Leverage ratios 22 Leverage ratio 5.0%
Choice on transitional arrangements and amount of derecognised fiduciary items EU-23 Choice on transitional arrangements for the definition of the capital measure Fully phased inEU-24 Amount of derecognised fiduciary items –

Capital and Risk Management Pillar 3 Disclosures at 31 December 2015 (continued)
HSBC HOLDINGS PLC
28
Table 20: Leverage ratio – Split of on-balance sheet exposures (excluding derivatives, SFTs and exempted exposures)
Ref1
At 31 December 2015
$bnEU-1 Total on-balance sheet exposures (excluding derivatives, SFTs, and exempted exposures)
of which:
2,104 EU-2 Trading book exposures 225EU-3 Banking book exposures
of which:
1,879 EU-4 – covered bonds 1EU-5 – exposures treated as sovereigns 521EU-6 – exposures to regional governments, MDB, international organisations and PSE NOT treated as sovereigns 1EU-7 – institutions 129EU-8 – secured by mortgages of immovable properties 292EU-9 – retail exposures 113
EU-10 – corporate 677EU-11 – exposures in default 15EU-12 – other exposures (e.g. equity, securitisations, and other non-credit obligation assets) 130
1 The references identify the lines prescribed in the EBA template. Lines represented in this table are those lines which are applicable and where there is a value.
Leverage ratio: disclosure on qualitative items: • The leverage exposure measure is calculated on a regional
and global business basis each month and presented to Group ALCO, which monitors the risk of excessive leverage.
• The increase in the leverage ratio to 5.0% (2014: 4.8%) was mainly as a result of the reduction in the size of the balance sheet.
Further details can be found on page 30.
Regulatory developments
The regulatory capital requirements comprise a Pillar 1 minimum, the ICG set by the PRA in the form of Pillar 2A, a number of capital buffers established by CRD IV and any PRA buffer that the PRA may set in addition to ICG.
The Pillar 1 minimum ratio and the CCB rates are certain. The macro-prudential tools, Pillar 2A, the PRA buffer and the systemic buffers are time-varying elements. This uncertainty is reflected in the regulatory and management buffer we have included in the 12% to 13% CET1 range that is used to model our medium-term target for return on equity of more than 10% by 2017. This buffer is currently in the range of 1% to 2%.
In December 2015, the FPC published its end point view of the calibration of the capital framework as applicable to UK banks. This set out the FPC’s final expectations in relation to the levels of capital across the industry, while specific requirements for individual banks will vary at the PRA’s determination. These expectations do not include time-varying additional requirements such as the CCyB and are based on the assumption that existing deficiencies in the definition and measurement of RWAs under Pillar 1 requirements will be addressed over time. These deficiencies in Pillar 1 are currently compensated through additional Pillar 2 requirements. The FPC stated its expectation that by 2019, once such deficiencies were corrected, Pillar 2A requirements would reduce.
In addition to the above, consideration of the finalised FSB proposals in relation to TLAC requirements, and the UK implementation of the EU minimum requirement for own funds and eligible liabilities will also be required.
Based on the known and quantifiable requirements to date, including the announced CCyB rates and current ICG, the overall capital requirements applicable to the Group on an end-point basis (at 1 January 2019) are presented in the table below.
Capital requirements framework (end point)
CRD IV capital buffers
CRD IV established a number of capital buffers, to be met with CET1 capital, broadly aligned with the Basel III framework. In the UK, with the exception of the CCyB which applied with immediate effect, CRD IV capital buffers are being phased in from 1 January 2016.
Automatic restrictions on capital distributions apply if a bank’s CET1 capital falls below the level of its CRD IV combined buffer. The CRD IV combined buffer is defined as the total of the CCB, the CCyB, the G-SII’s buffer and the SRB, as these become applicable.
PRA buffer (illustrative)
Capital conservation buffer
Systemicbuffers(SRB/G-SII)
Macro-prudential tools(CCyB / sectoral capital requirements)
Pillar 2A/ICG
Pillar 1
(CET1)(CET1)
(CET1)(CET1)
(CET1, AT1and T2)
(CET1, AT1and T2 )
2.5%
2.5%
2.3%(of which 1.3% CET1)
8%(of which 4.5% CET1)
0.2%

Capital and Risk Management Pillar 3 Disclosures at 31 December 2015 (continued)
HSBC HOLDINGS PLC
29
At 31 December 2015, the applicable CCyB rates in force were 1% set by Norway and Sweden. Relevant credit exposures located in Norway and Sweden were $2.4bn and $1.5bn, respectively. At 31 December 2015, this resulted in an immaterial Group institution-specific CCyB requirement.
The HKMA CCyB rate of 0.625% was implemented on 27 January 2016 in respect of Hong Kong exposures, following communication from the FPC. The impact of the HKMA CCyB rate on our Group institution-specific CCyB rate is expected to be 7bps (based on RWAs at 31 December 2015).
The CCyB rates introduced by Norway and Sweden will increase to 1.5% from June 2016. In January 2016, the HKMA also announced that the CCyB rate applied to exposures in Hong Kong will be increased to 1.25% from 1 January 2017.
In December 2015, the FPC maintained a 0% CCyB rate for UK exposures. At the same time, the FPC published the final calibration of the capital framework for UK banks. Within this, the FPC indicated that going forward it would apply a more active use of the CCyB and stated that it intends to publish a revised policy statement on the use of the CCyB in March 2016. The FPC also noted that it expects to set a countercyclical buffer rate for UK exposures in the region of 1%, when risks are judged to be neither subdued nor elevated. The CCyB rate will be informed by the annual UK concurrent stress test of major UK banks. If a rate change is introduced it is expected to come into effect 12 months later.
In December 2015, the PRA confirmed our applicable G-SII buffer as 2.5%. The G-SII buffer together with the CCB of 2.5%, came into effect on 1 January 2016. These are being phased in until 2019 in increments of 25% of the end point buffer requirement. Therefore, as of 1 January 2016, the requirement for each buffer is 0.625% of RWAs.
Alongside CRD IV requirements, since 2014, the PRA has expected major UK banks and building societies to meet a 7% CET1 ratio using the CRD IV end point definition. At 1 January 2016, with the introduction of the G-SII buffer and the CCB, our minimum CET1 capital requirements and combined buffer requirement taken together amount to 7.1% (based on RWAs at 31 December 2015), effectively superseding the previous PRA guidance on the CET1 ratio.
In January 2016, the FPC published a consultation on its proposed framework for the SRB. It is proposed that it will apply to ring-fenced banks and large building societies and will be implemented from 1 January 2019. The buffer to be applied to HSBC’s ring-fenced bank has yet to be determined.
Pillar 2 and the ‘PRA buffer’
The Pillar 2 framework requires banks to hold capital in respect of risks not captured in the Pillar 1 framework and to assess risks which banks may become exposed to over a forward-looking planning horizon. The PRA’s assessment results in the determination of ICG/Pillar 2A and Pillar 2B, respectively.
Pillar 2A was previously required to be met by total capital but, since 1 January 2015, must be met with at least 56%
CET1. Furthermore, the PRA expects firms not to meet the CRD IV buffers with any CET1 required to meet its ICG.
The Pillar 2A requirement is a point in time assessment of the amount of capital the PRA considers that a bank should hold to meet the overall financial adequacy rule. It is therefore subject to change as part of the PRA’s supervisory review process. In November 2015, our Pillar 2A requirement was set at 2.3% of RWAs, of which 1.3% of RWAs is met by CET1.
In July 2015, the PRA published a final policy statement PS17/15, setting out amendments to the PRA Rulebook and Supervisory Statements in relation to the Pillar 2 framework. The revised framework became effective on 1 January 2016. The PRA’s Statement of Policy sets out the methodologies that it will use to inform its setting of firms’ Pillar 2 capital requirements, including new approaches for determining Pillar 2 requirements for credit risk, operational risk, credit concentration risk and pension obligation risk.
In parallel, in July 2015, the PRA also issued its supervisory statement SS31/15 in which it introduced a PRA buffer to replace the capital planning buffer determined under Pillar 2B from 1 January 2016. This is to be met in the form of CET1 capital.
The statement sets out that the PRA buffer is intended to avoid duplication with CRD IV buffers and will be set for a particular firm depending on its vulnerability in a stress scenario. In order to address significant weaknesses in risk management and governance, a scalar may be applied to firms’ CET1 Pillar 1 and Pillar 2A capital requirements. This will also form part of the PRA Buffer.
Where the PRA considers there is overlap between the CRD IV buffers and the PRA buffer assessment, the PRA buffer will be set as the excess capital required over and above the CRD IV combined buffer. From 1 January 2016, the CCB and the systemic buffers are permitted to offset against the PRA buffer with the exception of any risk management and governance scalar where applicable. The use of the PRA buffer will not result in automatic restrictions to distributions.
Regulatory stress testing
The Group is subject to supervisory stress testing in many jurisdictions. These requirements are increasing in frequency and granularity. As such, stress testing represents a key focus for the Group.
The Bank of England published the results of the 2015 UK stress test in December 2015 confirming that these tests did not reveal any capital inadequacies for HSBC. At the European level, the EBA did not undertake a stress testing exercise in 2015 but instead carried out a transparency exercise, the results of which were published in November 2015.
In July 2015, the EBA also disclosed a timeline for the 2016 EU wide stress test exercise. The EBA expects to publish the 2016 stress test scenario and methodology in the first quarter of 2016, with results published in the third quarter of 2016.

Capital and Risk Management Pillar 3 Disclosures at 31 December 2015 (continued)
HSBC HOLDINGS PLC
30
In October 2015, the Bank of England published its approach to stress testing in the UK. This set out that the outcome of the UK stress testing exercise will be considered by the FPC when determining the UK CCyB rate, and will also inform the PRA buffer. Furthermore, from 2016, the applicable hurdle rate, which is the amount of capital that banks are expected to maintain under a stress, is to include Pillar 1, Pillar 2A and G-SII buffer requirements.
RWA developments
Throughout 2015, UK, EU and international regulators issued a series of consultations designed to revise the various components of the RWA regime and increase related reporting and disclosures. In particular, the Basel Committee published proposals relating to certain Pillar 1 risk types to update standardised, non-modelled approaches for calculating capital requirements. Details of the most significant consultations are set out below.
In December 2015, the Basel Committee published its second consultation paper on a revised standardised approach for credit risk. This included proposals to reintroduce external credit ratings, moderated by internal due diligence, as the basis for calculating risk weights for banks and corporates. The risk weights for other assets are to be determined by a variety of treatments tailored for each exposure class, which are designed to increase risk sensitivity and comparability.
In January 2016, the Basel Committee published the final rules arising from the Fundamental Review of the Trading Book, with implementation planned for 2019. The new regime includes amendments to the trading book boundary and new market risk capital calculations for both the modelled and standardised approaches. The Basel Committee acknowledges that there is considerable ongoing work which could require further revisions to the framework.
The final changes to the CVA capital charge are expected to be published in 2016. Following the finalisation of the CVA capital regime, the EU is expected to review the exemptions to the CVA charge currently applied to corporates, sovereigns and intragroup exposures. In the interim, the EU has consulted upon a methodology for calculating a Pillar 2 charge for excessive CVA risk resulting from exempted transactions.
The revised consultations for standardised operational risk and the design and calibration of a capital floor based on the standardised approaches, are expected by the end of 2016.
All of the Basel Committee’s consultations will need to be transposed into EU law before coming into effect. This includes the finalised changes that relate to the counterparty risk and securitisation regimes.
UK leverage ratio framework
Following consultations in 2014, secondary legislation came into force in April 2015 to provide the FPC with direction powers in relation to the UK leverage ratio framework. In July 2015, the FPC published its final policy statement setting out its intention to use its new powers of direction. As a result the PRA issued a consultation paper
to introduce requirements for the UK leverage ratio framework. This established a minimum tier 1 leverage ratio of 3%, an additional leverage ratio buffer for G-SIIs and a countercyclical leverage ratio buffer, and was implemented on 1 January 2016. The additional leverage ratio buffer and countercyclical leverage ratio buffer are to be met entirely with CET1 capital and will be set at 35% of the relevant buffers in the risk-weighted capital framework. At 1 January 2016, our minimum leverage ratio requirement of 3% was supplemented with an additional leverage ratio buffer of 0.2% and a countercyclical leverage ratio buffer which rounds to 0%. We comfortably exceed these leverage requirements.
It is anticipated that a minimum leverage ratio requirement, including potential buffers for G-SIBs, will be consulted upon by the Basel Committee in 2016 and a formal Pillar 1 measure finalised by 1 January 2018.
Total loss absorbing capacity proposals
As part of Recovery and Resolution frameworks both in the EU and internationally, there have been various developments in relation to TLAC. In the EU, the Bank Recovery and Resolution Directive introduces an MREL.
In July 2015, the EBA published a final draft RTS for MREL which seeks to provide additional clarity on the criteria that resolution authorities should take into account when setting a firm specific MREL requirement. The EBA notes that it aims to implement the MREL in a way which is consistent with the finalised international standard on TLAC.
In November 2015, the FSB published finalised proposals on TLAC for G-SIBs to be applied in accordance with individual bank resolution strategies. This set out a requirement of 16% of RWAs and a TLAC leverage ratio of 6% to be met from 1 January 2019, increasing to 18% and a 6.75% respectively, from 1 January 2022. Existing regulatory capital buffers will need to be met in addition to the minimum TLAC requirement. A breach of TLAC will be treated as severely as a breach of minimum capital requirements.
In November 2015, the Basel Committee also published a consultation on the treatment of banks’ holdings of TLAC instruments issued by a G-SIB, which proposed new deductions from regulatory capital. Once finalised, any additional requirements in relation to TLAC are expected to be reflected in MREL and to be implemented in the UK.
In December 2015, the Bank of England published a consultation paper on the UK’s implementation of MREL. The Bank of England stated that it intends to set MREL consistent with both TLAC and the final EBA RTS expected to be published later this year. The MREL is expected to comprise a loss absorption amount which reflects existing regulatory capital requirements and a recapitalisation amount which reflects the capital that a firm is likely to need post resolution. The latter can be met with both regulatory capital and eligible liabilities.
While MREL is to be set on an individual basis, the Bank of England generally expects MREL for banks whose appropriate resolution strategy is bail-in, to be equivalent to twice the current minimum capital requirements. A

Capital and Risk Management Pillar 3 Disclosures at 31 December 2015 (continued)
HSBC HOLDINGS PLC
31
finalised Statement of Policy is expected by mid-2016. The Bank of England is also expected to provide firms with an indication of their prospective 2020 MREL during 2016, and will set MREL on a transitional basis until then. For G-SIBs, MREL is proposed to apply from 2019, consistent with FSB timelines.
In parallel to the above, the PRA separately published a consultation paper on the interaction between MREL and capital buffers and how it would treat a breach of MREL requirements. This proposed that banks should not be able to meet MREL requirements with CET1 used to meet existing capital and leverage ratio buffers.
Structural reform and recovery and resolution planning
Globally there have been a number of developments relating to banking structural reform and the introduction of recovery and resolution regimes. As part of recovery and resolution planning, some regulators and national authorities have also required changes to the corporate structures of banks. These include requiring the local incorporation of banks or ring-fencing of certain businesses.
In 2013 and 2014, UK legislation was enacted requiring large banking groups to ring-fence UK retail and SME banking activity in a separately incorporated banking subsidiary (a ‘ring-fenced bank’) that is prohibited from engaging in significant trading activity. Ring-fencing is to be completed by 1 January 2019. The legislation also detailed the applicable individual customers to be transferred to the ring-fenced bank. In addition, the legislation places restrictions on the activities and geographical scope of ring-fenced banks. Throughout 2015, the PRA published a number of consultations on the implementation of ring-fencing requirements and the finalisation of rules is expected to continue in 2016.
The key proposals included near final rules published in May 2015 on legal structure, corporate governance, and continuity of services and facilities. Additionally, in October 2015 the PRA issued a consultation on the application of capital and liquidity rules for ring-fenced banks, management of intra-group exposures, and use of financial market infrastructures.
The PRA intends to undertake a further consultation in 2016 in respect of reporting and disclosure, and publish finalised rules and supervisory statements thereafter, with implementation by 1 January 2019.
We are working with our primary regulators to develop and agree a resolution strategy for HSBC. It is our view that a strategy by which the Group breaks up at a subsidiary bank level at the point of resolution (referred to as a Multiple Point of Entry) is the optimal approach, as it is aligned to our existing legal and business structure. Similarly to all G-SIBs, we are working with our regulators to mitigate or remove critical inter-dependencies between our subsidiaries to further facilitate the resolution of the
Group. In particular, in order to remove operational dependencies (where one subsidiary bank provides critical services to another), we are in the process of transferring critical services from our subsidiary banks to a separate internal group of service companies.
During 2015, more than 18,000 employees performing shared services in the UK were transferred to the service companies. Further transfers of employees, critical shared services and assets in the UK, Hong Kong and other jurisdictions will occur in due course.
Risk management
Overview
All our activities involve, to varying degrees, the measurement, evaluation, acceptance and management of risk or a combination of risks, which we assess on a Group-wide basis. Our risk management framework, employed at all levels of the organisation, ensures that our risk profile remains conservative and aligned to our risk appetite and strategy by fostering continuous monitoring of the risk environment and an integrated evaluation of risks and their interactions. It also ensures that we have a robust and consistent approach to risk management at all levels of the organisation and across all risk types.
Risk management is embedded through: • a strong risk culture, with personal accountability for decisions; • a formal risk governance framework, with clear and
well understood risk ownership, standards and policies; • the alignment of risk and business objectives, with integration
of risk appetite into business planning and capital management;
• the alignment of remuneration with our risk framework and risk outcomes; and
• an independent, expert global risk function (‘Global Risk’).
Our approach to risk management, including risk appetite, is set out on page 42 of the Annual Report and Accounts 2015.
Risk culture
HSBC has long recognised the importance of a strong risk culture, the fostering of which is a key responsibility of senior executives. It is reinforced by HSBC Values and our Global Standards. Our risk management framework is underpinned by our risk culture which is instrumental in aligning the behaviours of individuals with the Group’s risk profile and our attitude to assuming and managing risk.
The risk culture is reinforced by our approach to remuneration. Individual awards, including those for executives, are based on compliance with HSBC Values and the achievement of financial and non-financial objectives which are aligned to our risk appetite and strategy. For further information on risk and remuneration, see page 285 of the Annual Report and Accounts 2015.

Capital and Risk Management Pillar 3 Disclosures at 31 December 2015 (continued)
HSBC HOLDINGS PLC
32
Risk governance and risk appetite
Our strong risk governance reflects the importance placed by the Board and the GRC on shaping the Group’s risk strategy and managing risks effectively. The activities of the GRC are discussed further on page 266 of the Annual Report and Accounts 2015.
Strong risk governance is supported by: • a clear policy framework of risk ownership; • a globally consistent risk appetite framework through which
the types and quantum of risk that we are prepared to accept in executing our strategy are articulated and monitored;
• performance scorecards cascaded from the GMB that align business and risk objectives; and
• the accountability of all staff for identifying, assessing and managing risks in accordance with the three lines of defence model.
This personal accountability, reinforced by the governance structure, documented standards, policy and procedures, and experience and mandatory learning, helps to foster a disciplined and constructive culture of risk management and control throughout HSBC.
Our risk management framework is described on page 101 of the Annual Report and Accounts 2015. The executive and non-executive risk governance structures for the management of risk are set out on page 193 of the Annual Report and Accounts 2015.
Information on directorships held by Board members, their skills and experience is set out in their biographies from page 249 of the Annual Report and Accounts 2015. Information on board recruitment and diversity policies is set out from page 256 of the Annual Report and Accounts 2015.
Risk appetite is a key component in our management of risk. It describes the types and quantum of risks that we are willing to accept in achieving our medium to long-term strategic objectives. Within HSBC, risk appetite is managed through the Global Risk Appetite Framework and articulated in a risk appetite statement, which is annually approved by the Board on the advice of the GRC.
The risk appetite statement guides the annual planning process by defining the desired forward looking risk profile of the Group in achieving our strategic objectives and plays an important role in our six filters process. Our risk appetite may be revised in response to our assessment of the top and emerging risks we have identified and the stressed view of our business plan.
Diversification is an important aspect of our management of risk. The diversification of our lending portfolio across global businesses and regions, together with our broad range of products, ensures that we are not overly dependent on a limited number of countries or markets to generate income and growth.
Global Risk
Global Risk, headed by the GRCO, is responsible for enterprise-wide risk oversight including the establishment of global policy, the monitoring of risk profiles, and forward looking risk identification and management. Global Risk
also has functional responsibility for risk management in support of HSBC’s global businesses and regions through an integrated network of Risk sub-functions which are independent from the sales and trading functions of our businesses. This independence ensures the necessary balance in risk/return decisions.
Global Risk:• forms part of the second line of defence, with responsibility
for setting policy and for providing oversight and challenge of the activities conducted by the first line;
• supports our global businesses, regions, countries and global functions in the development and achievement of strategic objectives;
• fosters development of a conservative but constructive Group risk culture;
• works with global businesses, regions and global functions in the setting and monitoring of risk appetite;
• carries out central approvals, controls, risk systems design and the analysis and reporting of management information;
• addresses risk issues in dealings with external stakeholders including regulators and analysts;
• is jointly responsible with Global Finance for the delivery of enterprise-wide stress testing; and
• in addition to ‘business as usual’ operations, engages with business development activities such as new product approval and post-implementation review, and acquisition due diligence.
Risk management and internal control systems
The Directors are responsible for maintaining and reviewing the effectiveness of risk management and internal control systems and for determining the nature and extent of the significant risks they are willing to take in achieving the Group’s strategic objectives. On behalf of the Board, the GAC has responsibility for oversight of risk management and internal controls over financial reporting, and the GRC has responsibility for oversight of risk management and internal controls other than over financial reporting, including enterprise-wide stress testing.
HSBC’s key risk management and internal control procedures are described on page 275 of the Annual Report and Accounts 2015, where the Directors’ Report on the effectiveness of internal controls can also be found.
Annually, the Directors, through the GRC and the GAC, conduct a review of the effectiveness of our system of risk management and internal control covering all material controls, including financial, operational and compliance controls, risk management systems, the adequacy of resources, qualifications and experience of staff of the accounting and financial reporting function and the risk function, and their training programmes and budget. The review does not extend to joint ventures or associates.
The GRC and the GAC received confirmation that executive management has taken or is taking the necessary actions to remedy any failings or weaknesses identified through the operation of our framework of controls.

Capital and Risk Management Pillar 3 Disclosures at 31 December 2015 (continued)
HSBC HOLDINGS PLC
33
Risk measurement and reporting systems
The purpose of our risk measurement and reporting systems is to ensure that, as far as possible, risks are comprehensively captured with all the attributes necessary to support well-founded decisions, that those attributes are accurately assessed and that information is delivered in a timely way for those risks to be successfully managed and mitigated.
Risk measurement and reporting systems are also subject to a governance framework designed to ensure that their build and implementation are fit for purpose and that they are functioning properly. Risk information technology systems development is a key responsibility of the Global Risk function, while the development and operation of risk rating and management systems and processes are ultimately subject to the oversight of the Board.
We continue to invest significant resources in IT systems and processes in order to maintain and improve our risk management capabilities. A number of key initiatives and projects to enable consistent data aggregation, reporting and management, and work towards meeting our Basel Committee data obligations are in progress. Group policy promotes the deployment of preferred technology where practicable. Group standards govern the procurement and operation of systems used in our subsidiaries to process risk information within business lines and risk functions.
Risk measurement, monitoring and reporting structures deployed at Group level are applied throughout global businesses and major operating subsidiaries through a common operating model for integrated risk management and control. This model sets out the respective responsibilities of Group, global business, region and country level risk functions in respect of such matters as risk governance and oversight, compliance risks, approval authorities and lending guidelines, global and local scorecards, management information and reporting, and relations with third parties including regulators, rating agencies and auditors.
Risk analytics and model governance
Global Risk manages a number of analytics disciplines supporting rating and scoring models for different risk types and business segments, economic capital and stress testing. It formulates technical responses to industry developments and regulatory policy in the field of risk analytics, develops HSBC’s global risk models, and oversees local model development and use around the Group in progress toward our implementation targets for the IRB advanced approach.
Model governance is under the general oversight of Global MOC. Global MOC is supported by specific global functional MOCs for wholesale credit risk (‘Wholesale MOC’) and market risk (‘Markets MOC’) and RBWM, and has regional and entity-level counterparts with comparable terms of reference. The Global MOC meets bi-monthly and reports to RMM. It is chaired by the Risk function, and its membership is drawn from Risk, Finance and global businesses. Its primary responsibilities are to bring a strategic approach to model-related issues across the Group and to oversee the governance of our risk rating models, their consistency and approval, within the regulatory framework. Through its oversight of the functional wholesale, markets and RBWM MOCs, it identifies emerging risks for all aspects of the risk rating system, ensuring that model risk is managed within our risk appetite statement, and formally advises RMM on any material model-related issues.
The development and use of data and models to meet local requirements are the responsibility of regional and/or local entities under the governance of their own management, subject to overall Group policy and oversight.

Capital and Risk Management Pillar 3 Disclosures at 31 December 2015 (continued)
HSBC HOLDINGS PLC
34
Credit risk Overview and responsibilities
Credit risk represents our largest regulatory capital requirement.
The principal objectives of our credit risk management function are: • to maintain across HSBC a strong culture of responsible
lending and a robust credit risk policy and control framework;• to both partner and challenge our businesses in defining,
implementing and continually re-evaluating our credit risk appetite under actual and stress scenario conditions; and
• to ensure there is independent, expert scrutiny of credit risks, their costs and their mitigation.
The credit risk functions within Wholesale Credit and Market Risk and RBWM are the constituent parts of Global Risk that support the Group Chief Risk Officer in overseeing credit risks at the highest level. For this, their major duties comprise undertaking independent reviews of large and high-risk credit proposals, overseeing large exposure policy and reporting on our wholesale and retail credit risk management disciplines, owning our credit policy and credit systems programmes, overseeing portfolio management and reporting on risk matters to senior executive management and to regulators.
These credit risk functions work closely with other parts of Global Risk, for example with Security and Fraud Risk on the enhancement of protection against retail product fraud, with Operational Risk on the internal control framework and with Risk Strategy on the risk appetite process. In addition, they work jointly with Risk Strategy and Global Finance on stress testing. The credit responsibilities of Global Risk are described on page 195 of the Annual Report and Accounts 2015.
Group-wide, the credit risk functions comprise a network of credit risk management offices reporting within regional, integrated risk functions. They fulfil an essential role as independent risk control units distinct from business line management in providing objective scrutiny of risk rating assessments, credit proposals for approval and other risk matters.
Credit risk operates through a hierarchy of personal credit limit approval authorities, not committee structures. Operating company chief executives, acting under authorities delegated by their boards and Group standards, are accountable for credit risk and other risks in their business. In turn, chief executives delegate authority to operating company chief risk officers and management teams on an individual basis. Each operating company is responsible for the quality and performance of its credit portfolios, and for monitoring and controlling all credit risks in those portfolios in accordance with Group standards. Above these thresholds of delegated personal credit limited approval authorities, approval or concurrence must be sought from the regional and, as appropriate, global credit risk function before facilities are advised to the customer.
Moreover, risk proposals in certain portfolios – sovereign obligors, banks, some non-bank financial institutions and intra-Group exposures – are approved centrally in Global Risk to facilitate efficient control and the reporting of regulatory large and cross-border exposures.
Credit risk management
Our exposure to credit risk arises from a wide range of customer and product types, and the risk rating systems in place to measure and monitor these risks are correspondingly diverse. Each major subsidiary typically has some exposures across this range, and requirements may differ according to the jurisdictions in which it operates.
Credit risk exposures are generally measured and managed in portfolios of either customer types or product categories. Risk rating systems are designed to assess the default propensity of, and loss severity associated with, distinct customers who are typically managed as individual relationships or, in the case of retail business exposures, on a product portfolio basis.
Risk rating systems for retail exposures are generally quantitative in nature, applying techniques such as behavioural analysis across product portfolios comprising large numbers of homogeneous transactions. Rating systems for individually managed relationships typically use customer financial statements and market data analysis, but also qualitative elements and a final subjective overlay to better reflect any idiosyncratic elements of the customer’s risk profile. See ‘Application of the IRB Approach’ on page 46.
Whatever the nature of the exposure, a fundamental principle of our policy and approach is that analytical risk rating systems and scorecards are all valuable tools at the disposal of management, informing judgemental decisions for which individual approvers are ultimately accountable.
In the case of automated decision-making processes, as used in retail credit origination where risk decisions may be taken ‘at the point of sale’ with no management intervention, that accountability rests with those responsible for the parameters built into those processes/systems and the governance and controls surrounding their use.
The credit process provides for at least an annual review of facility limits granted. Review may be more frequent, as required by circumstances such as the emergence of adverse risk factors, and any consequent amendments to risk ratings must be promptly implemented.
We constantly seek to improve the quality of our risk management. For central management and reporting purposes, Group IT systems are deployed to process credit risk data. A central database is used which covers substantially all of our direct lending exposures and holds the output of risk rating systems Group-wide. This continues to be enhanced in order to deliver both comprehensive management information in support of business strategy and solutions to evolving regulatory reporting requirements. The latter continue to present major challenges in view of the number and scope of concurrent initiatives, requiring more frequent and faster provision of regulatory, risk and financial data at an increasingly granular level. Given the global nature of

Capital and Risk Management Pillar 3 Disclosures at 31 December 2015 (continued)
HSBC HOLDINGS PLC
35
our business we typically need to generate this granular information both at local and Group level, but often in materially different ways. The new stress testing and G-SIB reporting requirements are prime examples of significant data requirements and related processes that are in the process of being embedded into existing or enhanced systems architecture at various levels in the Group.
Group standards govern the process through which risk rating systems are initially developed, judged fit for purpose, approved and implemented. They also govern the conditions under which analytical risk model outcomes can be over-ridden by decision-takers and the process of model performance monitoring and reporting. The emphasis is on an effective dialogue between business line and risk management, suitable independence of decision-takers, and a good understanding and robust challenge on the part of senior management.
Like other facets of risk management, analytical risk rating systems are not static and are subject to review and modification in light of the changing environment, the greater availability and quality of data and any deficiencies identified through internal and external regulatory review. Structured processes and metrics are in place to capture relevant data and feed this into continuous model improvement. See also the comments on ‘Model performance’ on page 66.
Credit risk models governance
All new or materially changed IRB capital models require the PRA’s approval, as set out in more detail on page 46, and throughout HSBC such models fall directly under the remit of the global functional MOCs. Additionally, the global functional MOCs are responsible for the approval of stress testing models used for regulatory stress testing exercises such as those carried out by the EBA and the Bank of England.
The global functional MOCs are responsible for defining the thresholds above which models require their approval, supporting both internal governance and the PRA approval process, for example if they cover exposures generating credit risk capital requirements exceeding a prescribed threshold or are otherwise deemed material on grounds of risk, portfolio size, or business type.
Wholesale MOC requires all credit risk models for which it is responsible to be approved by delegated senior managers with notification to the committee which retains the responsibility for oversight. RBWM MOC applies different thresholds for approval at the committee depending on model type. For models falling below these thresholds final approval is delegated to regional committees or Regional Heads of RBWM Risk. Where approval has been delegated the RBWM MOC is kept notified of any material model decisions and issues.
The RBWM MOC model materiality thresholds are: • all new IRB models as part of the IRB roll-out from
standardised to advanced approach; • existing IRB models exceeding, or estimated to exceed, $2bn
in RWAs; • all significant changes to approved IRB models which will
require notification to the PRA prior to implementation; • stress testing models being used in portfolios with EAD
exceeding $20bn for secured lending and $5bn for unsecured lending;
• application models with annual proposed value of new business sourced through the model exceeding $2bn for secured lending and $0.5bn for unsecured lending;
• behavioural models that are used to inform globally material IRB or provisioning models; and
• provisioning models (IAS 39 and IFRS 9) used in portfolios with loan impairment charges exceeding $100m or EAD exceeding $20bn for secured lending and $5bn for unsecured lending.
Global Risk utilises HSBC standards for the development, validation, independent review, approval, implementation and performance monitoring of credit risk rating models, and oversight of respective local standards for local models. All models are reviewed as frequently as the need arises, but at least annually.
Compliance with Group standards is subject to examination both by Risk oversight and review from within the Risk function itself, and by Internal Audit. While the standards set out minimum general requirements, Global Risk has discretion to approve dispensations on an exceptional basis, and fosters best practice between offices.
The following tables set out credit risk exposure values, RWAs and regulatory capital requirements calculated at 8% of RWAs. Table 22 presents exposure values analysed across geographical regions and tables 23 and 24, respectively, RWAs and RWA density by geographical region. Exposure values are allocated to a region based on the country of incorporation of the HSBC subsidiary or associate where the exposure was originated. In table 25, allocation to industry sectors is based on the Standard Industrial Classification codes. Table 26 shows exposures by period outstanding from the reporting date to the maturity date. The full exposure value is allocated to a residual maturity band based on the contractual end date.
In these tables, and in others in the Credit Risk section of this document unless stated otherwise, the data is presented according to a ‘guarantor view’, i.e. assigning exposures to the exposure class of the protection provider where applicable. This is to align our disclosure with our supervisory reporting.

Capital and Risk Management Pillar 3 Disclosures at 31 December 2015 (continued)
HSBC HOLDINGS PLC
36
Table 21: Credit risk – summary
Exposure
valueAverage
exposure value4 RWAs Capital
required $bn $bn $bn $bnIRB advanced approach 1,510.8 1,564.0 515.8 41.3
Retail: – secured by mortgages on immovable property SME 2.9 3.0 0.6 –– secured by mortgages on immovable property non-SME 275.4 283.0 60.0 4.8– qualifying revolving retail 67.8 67.0 15.3 1.2– other SME 12.1 12.9 5.8 0.5– other non-SME 46.3 46.5 11.5 0.9
– total retail 404.5 412.4 93.2 7.4– central governments and central banks 327.4 331.8 49.4 4.0– institutions 90.5 114.3 18.4 1.5– corporates1 597.3 617.0 314.3 25.1– securitisation positions 40.9 36.6 28.4 2.3– non-credit obligation assets 50.2 51.9 12.1 1.0
IRB foundation approach 43.7 36.2 27.4 2.2– central governments and central banks 0.1 0.1 – –– institutions 0.3 0.2 0.2 –– corporates 43.3 35.9 27.2 2.2
Standardised approach 592.0 592.3 332.7 26.6– central governments and central banks 199.9 194.5 20.0 1.6– institutions 38.9 34.2 14.7 1.2– corporates 226.4 234.3 210.6 16.8– retail 44.2 45.7 32.5 2.6– secured by mortgages on immovable property 40.3 39.4 14.4 1.2– exposures in default 4.9 4.6 6.4 0.5– regional governments or local authorities 2.8 1.9 1.0 0.1– equity2 7.0 9.1 12.2 1.0– items associated with particularly high risk 4.4 4.4 6.6 0.5– securitisation positions 0.7 0.6 0.7 0.1– claims in the form of CIU 0.5 0.6 0.5 –– international organisations 2.6 2.9 – –– other items 19.4 20.1 13.1 1.0
At 31 December 2015 2,146.5 2,192.5 875.9 70.1 IRB advanced approach 1,593.8 1,679.5 581.6 46.5
Retail: – secured by mortgages on immovable property SME 3.1 2.6 0.6 –– secured by mortgages on immovable property non-SME 288.9 302.8 71.6 5.7– qualifying revolving retail 66.2 66.6 15.3 1.2– other SME 13.9 15.9 6.2 0.5– other non-SME 47.3 46.8 12.4 1.0
– total retail 419.4 434.7 106.1 8.4– central governments and central banks 327.4 332.1 54.1 4.3– institutions 130.4 139.0 38.7 3.1– corporates1 625.8 675.0 328.5 26.3– securitisation positions 38.3 42.4 40.7 3.3– non-credit obligation assets 52.5 56.3 13.5 1.1
IRB foundation approach 25.8 24.7 16.8 1.3– central governments and central banks 0.1 0.1 – –– institutions 0.1 – – –– corporates 25.6 24.6 16.8 1.3
Standardised approach 590.5 606.5 356.9 28.6– central governments and central banks 189.3 207.7 19.7 1.6– institutions 30.1 34.2 11.2 0.9– corporates 240.1 235.3 224.7 18.0– retail 47.9 46.6 35.2 2.8– secured by mortgages on immovable property 38.6 42.0 13.8 1.1– exposures in default 4.7 5.6 6.1 0.5– regional governments or local authorities 1.1 1.1 0.6 –– equity2 13.2 5.8 26.9 2.2– other3 25.5 28.2 18.7 1.5
At 31 December 2014 2,210.1 2,310.7 955.3 76.4
1 Corporates includes specialised lending exposures subject to supervisory slotting approach of $24.9bn (2014: $30.5bn) and RWAs of $18.2bn (2014: $23.0bn). 2 This includes investment in Insurance companies which are risk weighted at 250%. 3 In 2014, this included the exposure class ‘Other items’ with an exposure value of $17.0bn, average exposure value of $19.7bn and RWAs of $11.3bn as
well as other less material standardised exposure classes not individually shown above. In 2015, all exposure classes are disclosed separately. 4 Average exposures are calculated by aggregating exposure value of the last five quarters and dividing by five to get the average.

Capital and Risk Management Pillar 3 Disclosures at 31 December 2015 (continued)
HSBC HOLDINGS PLC
37
Table 22: Credit risk exposure – by region Exposure value
Europe Asia MENANorth
AmericaLatin
America Total RWAs $bn $bn $bn $bn $bn $bn $bnIRB advanced approach 543.7 659.5 23.7 261.4 22.5 1,510.8 515.8
Retail: – secured by mortgages on immovable property SME 2.0 0.6 – 0.3 – 2.9 0.6– secured by mortgages on immovable property non-SME 136.7 88.6 – 50.1 – 275.4 60.0– qualifying revolving retail 33.2 30.6 – 4.0 – 67.8 15.3– other SME 11.6 0.1 – 0.4 – 12.1 5.8– other non-SME 34.3 6.5 – 5.5 – 46.3 11.5
– total retail 217.8 126.4 – 60.3 – 404.5 93.2– central governments and central banks 38.7 189.3 15.9 66.1 17.4 327.4 49.4– institutions 26.2 52.4 0.9 9.0 2.0 90.5 18.4– corporates 1 215.4 254.4 6.1 120.8 0.6 597.3 314.3– securitisation positions 36.9 0.3 – 3.7 – 40.9 28.4– non-credit obligation assets 8.7 36.7 0.8 1.5 2.5 50.2 12.1
IRB foundation approach 27.7 – 16.0 – – 43.7 27.4– central governments and central banks – – 0.1 – – 0.1 –– institutions – – 0.3 – – 0.3 0.2– corporates 27.7 – 15.6 – – 43.3 27.2
Standardised approach 172.0 302.0 43.6 30.8 43.6 592.0 332.7– central governments and central banks 121.8 65.9 4.8 5.3 2.1 199.9 20.0– institutions 0.2 36.6 2.0 0.1 – 38.9 14.7– corporates 27.2 132.2 23.8 18.6 24.6 226.4 210.6– retail 4.9 21.6 6.1 1.7 9.9 44.2 32.5– secured by mortgages on immovable property 5.7 27.3 3.0 1.0 3.3 40.3 14.4– exposures in default 1.2 0.4 0.9 0.8 1.6 4.9 6.4– regional governments or local authorities – – 2.1 – 0.7 2.8 1.0– equity2 2.0 2.8 0.2 1.5 0.5 7.0 12.2– items associated with particularly high risk 2.7 – 0.1 1.0 0.6 4.4 6.6– securitisation positions – 0.7 – – – 0.7 0.7– claims in the form of CIU 0.3 – 0.2 – – 0.5 0.5– international organisations 2.6 – – – – 2.6 –– other items 3.4 14.5 0.4 0.8 0.3 19.4 13.1
At 31 December 2015 743.4 961.5 83.3 292.2 66.1 2,146.5 875.9 IRB advanced approach 592.6 649.7 29.3 292.5 29.7 1,593.8 581.6
Retail: – secured by mortgages on immovable property SME 2.4 0.7 – – – 3.1 0.6– secured by mortgages on immovable property non-SME 144.1 88.2 – 56.6 – 288.9 71.6– qualifying revolving retail 34.9 27.3 – 4.0 – 66.2 15.3– other SME 13.2 0.1 – 0.6 – 13.9 6.2– other non-SME 34.6 6.0 – 6.7 – 47.3 12.4
– total retail 229.2 122.3 – 67.9 – 419.4 106.1– central governments and central banks 37.4 166.0 19.3 81.4 23.3 327.4 54.1– institutions 32.8 74.0 8.8 11.7 3.1 130.4 38.7– corporates1 247.7 250.8 0.4 126.9 – 625.8 328.5– securitisation positions 34.9 0.4 – 3.0 – 38.3 40.7– non-credit obligation assets 10.6 36.2 0.8 1.6 3.3 52.5 13.5
IRB foundation approach 19.2 – 6.6 – – 25.8 16.8– central governments and central banks – – 0.1 – – 0.1 –– institutions 0.1 – – – – 0.1 –– corporates 19.1 – 6.5 – – 25.6 16.8
Standardised approach 177.6 279.0 49.1 27.5 57.3 590.5 356.9– central governments and central banks 127.0 50.3 4.9 5.2 1.9 189.3 19.7– institutions 0.2 28.6 1.3 – – 30.1 11.2– corporates 25.8 132.9 31.6 15.2 34.6 240.1 224.7– retail 5.8 22.2 5.7 1.9 12.3 47.9 35.2– secured by mortgages on immovable property 5.9 24.1 3.1 1.0 4.5 38.6 13.8– exposures in default 1.1 0.3 1.2 0.6 1.5 4.7 6.1– regional governments or local authorities – – 0.3 – 0.8 1.1 0.6– equity2 2.4 8.1 0.2 1.9 0.6 13.2 26.9– other3 9.4 12.5 0.8 1.7 1.1 25.5 18.7
At 31 December 2014 789.4 928.7 85.0 320.0 87.0 2,210.1 955.3
For footnotes, see page 36.

Capital and Risk Management Pillar 3 Disclosures at 31 December 2015 (continued)
HSBC HOLDINGS PLC
38
Key points • The total Credit risk exposure value has decreased by $63.6bn over the year. Overall foreign exchange movements have decreased
exposure value by $110.3bn across approaches. • Exposures in Retail secured by mortgages on immovable property non-SME have reduced under the IRB advanced approach.
The movement on a constant currency basis across approaches is insignificant, there are offsetting movements between Asia and North America. There is continued growth in mortgage lending within Asia, offset by a decrease in North America due to continued US run-offs and disposals in the US CML portfolio.
• In Asia, exposures to institutions decreased as a result of reduced balances with correspondent banks, money market term placements and debt securities.
• A change in EEA equivalence rules resulted in a reclassification of some exposures from institutions to corporates. • Corporate exposures have decreased under both the IRB advanced and standardised approaches due to foreign exchange movements.
This is offset by an increase largely from growth in term lending to corporate customers within Asia. • Standardised institution exposures increase is mainly driven by BoCom resulting from growth in treasury bills, other eligible bills and debt
securities. • Equity exposures under the standardised approach decreased in Asia as a result of the partial sale of our investment in Industrial Bank.
Table 23: Credit risk – RWAs by region RWAs
Europe Asia MENA North
America Latin
America Total $bn $bn $bn $bn $bn $bn IRB advanced approach 175.1 195.9 9.5 122.5 12.8 515.8
Retail: – secured by mortgages on immovable property SME 0.5 – – 0.1 – 0.6– secured by mortgages on immovable property non-SME 7.5 12.5 – 40.0 – 60.0– qualifying revolving retail 6.1 8.0 – 1.2 – 15.3– other SME 5.6 – – 0.2 – 5.8– other non-SME 5.5 1.3 – 4.7 – 11.5
– total retail 25.2 21.8 – 46.2 – 93.2– central governments and central banks 5.2 19.2 6.9 8.5 9.6 49.4– institutions 4.8 9.0 0.2 2.5 1.9 18.4– corporates1 107.7 140.4 2.1 63.8 0.3 314.3– securitisation positions 27.9 0.1 – 0.4 – 28.4– non-credit obligation assets 4.3 5.4 0.3 1.1 1.0 12.1
IRB foundation approach 17.5 – 9.9 – – 27.4– central governments and central banks – – – – – –– institutions – – 0.2 – – 0.2– corporates 17.5 – 9.7 – – 27.2
Standardised approach 46.8 177.7 32.0 33.9 42.3 332.7– central governments and central banks 2.6 3.0 0.6 9.3 4.5 20.0– institutions 0.1 13.7 0.8 0.1 – 14.7– corporates 27.0 117.9 22.4 18.3 25.0 210.6– retail 3.5 16.2 4.5 1.2 7.1 32.5– secured by mortgages on immovable property 2.2 9.5 1.1 0.4 1.2 14.4– exposures in default 1.5 0.5 1.2 1.2 2.0 6.4– regional governments or local authorities – – 0.5 – 0.5 1.0– equity2 4.2 5.5 0.2 1.5 0.8 12.2– items associated with particularly high risk 4.0 – 0.2 1.5 0.9 6.6– securitisation positions – 0.6 – – 0.1 0.7– claims in the form of CIU 0.3 – 0.2 – – 0.5– international organisations – – – – – –– other items 1.4 10.8 0.3 0.4 0.2 13.1
239 4 373 6 51 4 156 4 55 1 875 9At 31 December 2015 239.4 373.6 51.4 156.4 55.1 875.9

Capital and Risk Management Pillar 3 Disclosures at 31 December 2015 (continued)
HSBC HOLDINGS PLC
39
RWAs
Europe Asia MENA North
America Latin
America Total $bn $bn $bn $bn $bn $bn IRB advanced approach 203.3 213.1 11.6 142.0 11.6 581.6
Retail: – secured by mortgages on immovable property SME 0.6 – – – – 0.6– secured by mortgages on immovable property non-SME 8.0 9.3 – 54.3 – 71.6– qualifying revolving retail 6.9 7.1 – 1.3 – 15.3– other SME 5.9 – – 0.3 – 6.2– other non-SME 5.7 1.3 – 5.4 – 12.4
– total retail 27.1 17.7 – 61.3 – 106.1– central governments and central banks 5.8 23.4 8.9 7.9 8.1 54.1– institutions 12.4 18.8 2.4 3.0 2.1 38.7– corporates1 112.5 147.8 – 68.2 – 328.5– securitisation positions 40.1 0.2 – 0.4 – 40.7– non-credit obligation assets 5.4 5.2 0.3 1.2 1.4 13.5
IRB foundation approach 12.8 – 4.0 – – 16.8– central governments and central banks – – – – – –– institutions – – – – – –– corporates 12.8 – 4.0 – – 16.8
Standardised approach 47.1 186.0 39.0 29.6 55.2 356.9– central governments and central banks 3.3 2.7 0.5 8.9 4.3 19.7– institutions 0.2 10.4 0.6 – – 11.2– corporates 25.2 119.2 30.0 15.2 35.1 224.7– retail 4.2 16.7 4.3 1.3 8.7 35.2– secured by mortgages on immovable property 2.1 8.4 1.3 0.4 1.6 13.8– exposures in default 1.4 0.5 1.4 0.8 2.0 6.1– regional governments or local authorities – – – – 0.6 0.6– equity2 4.6 19.1 0.3 1.9 1.0 26.9– other3 6.1 9.0 0.6 1.1 1.9 18.7
At 31 December 2014 263.2 399.1 54.6 171.6 66.8 955.3
For footnotes, see page 36.
Key points • See commentary on RWA movement for IRB and Standardised on pages 24 and 22, respectively.
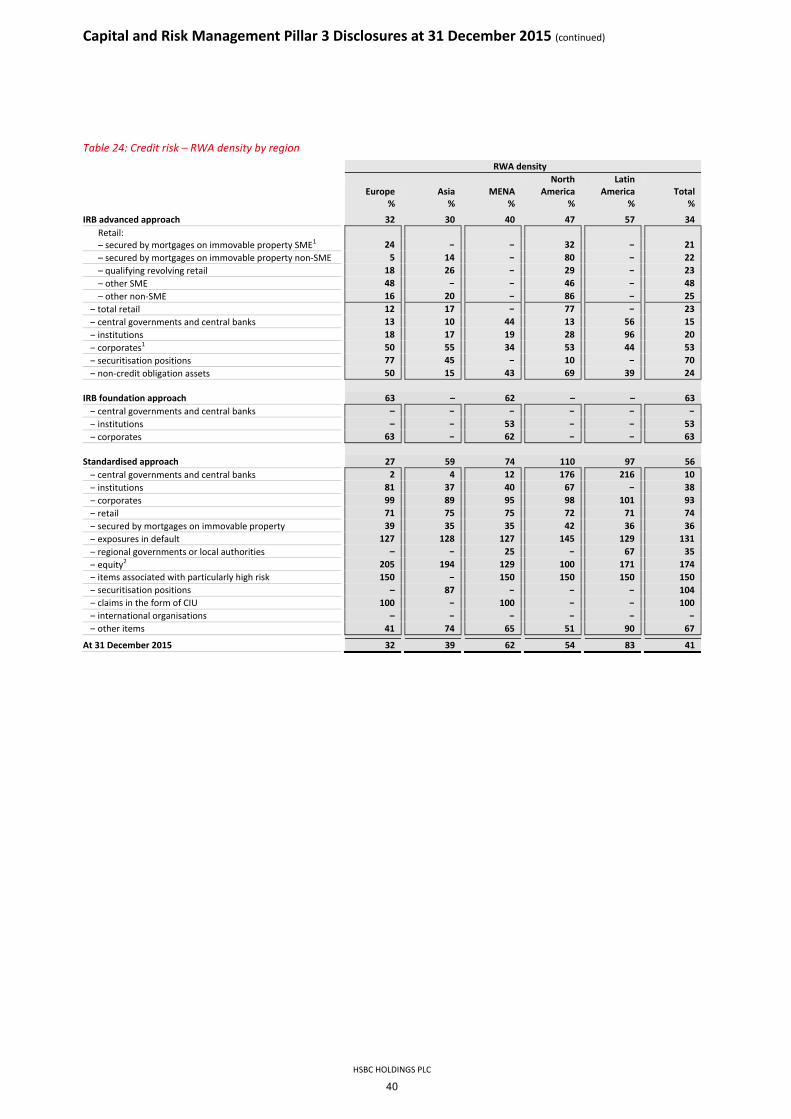
Capital and Risk Management Pillar 3 Disclosures at 31 December 2015 (continued)
HSBC HOLDINGS PLC
40
Table 24: Credit risk – RWA density by region RWA density
Europe Asia MENA North
America Latin
America Total % % % % % %
IRB advanced approach 32 30 40 47 57 34Retail: – secured by mortgages on immovable property SME1 24 – – 32 – 21– secured by mortgages on immovable property non-SME 5 14 – 80 – 22– qualifying revolving retail 18 26 – 29 – 23– other SME 48 – – 46 – 48– other non-SME 16 20 – 86 – 25
– total retail 12 17 – 77 – 23– central governments and central banks 13 10 44 13 56 15– institutions 18 17 19 28 96 20– corporates1 50 55 34 53 44 53– securitisation positions 77 45 – 10 – 70– non-credit obligation assets 50 15 43 69 39 24
IRB foundation approach 63 – 62 – – 63– central governments and central banks – – – – – –– institutions – – 53 – – 53– corporates 63 – 62 – – 63
Standardised approach 27 59 74 110 97 56
– central governments and central banks 2 4 12 176 216 10– institutions 81 37 40 67 – 38– corporates 99 89 95 98 101 93– retail 71 75 75 72 71 74– secured by mortgages on immovable property 39 35 35 42 36 36– exposures in default 127 128 127 145 129 131– regional governments or local authorities – – 25 – 67 35– equity2 205 194 129 100 171 174– items associated with particularly high risk 150 – 150 150 150 150– securitisation positions – 87 – – – 104– claims in the form of CIU 100 – 100 – – 100– international organisations – – – – – –– other items 41 74 65 51 90 67
At 31 December 2015 32 39 62 54 83 41
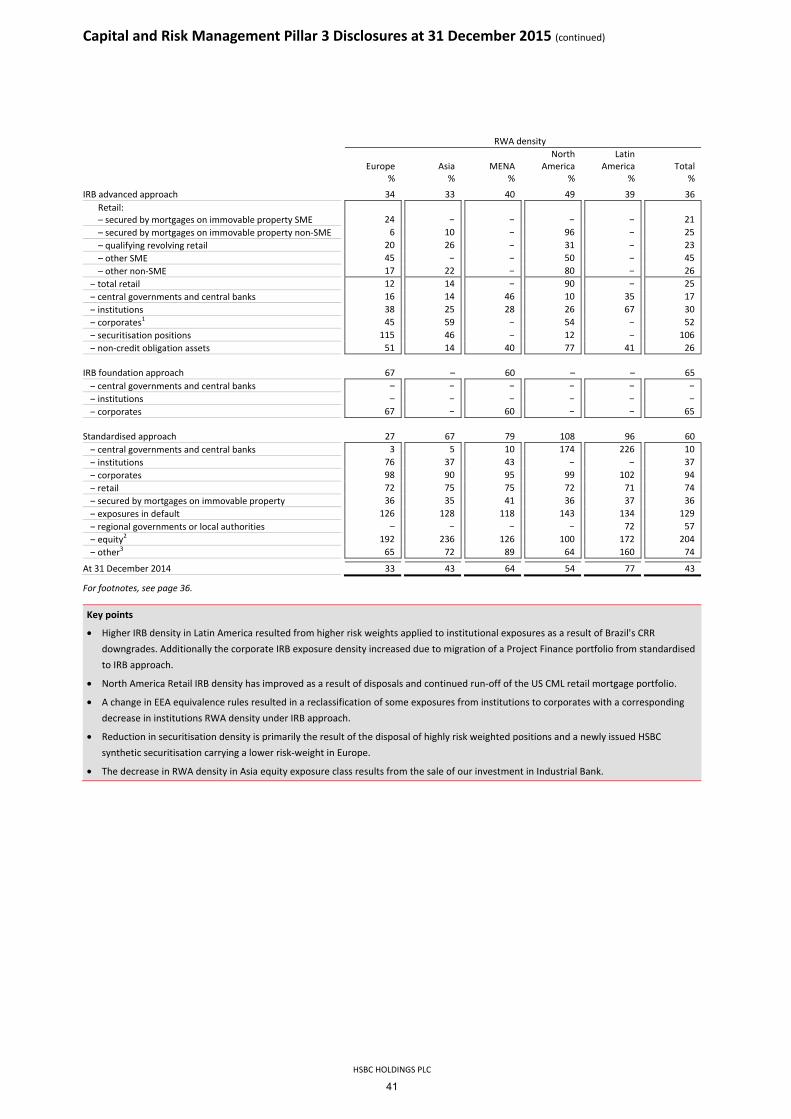
Capital and Risk Management Pillar 3 Disclosures at 31 December 2015 (continued)
HSBC HOLDINGS PLC
41
RWA density
Europe Asia MENA North
America Latin
America Total % % % % % %
IRB advanced approach 34 33 40 49 39 36Retail: – secured by mortgages on immovable property SME 24 – – – – 21– secured by mortgages on immovable property non-SME 6 10 – 96 – 25– qualifying revolving retail 20 26 – 31 – 23– other SME 45 – – 50 – 45– other non-SME 17 22 – 80 – 26
– total retail 12 14 – 90 – 25– central governments and central banks 16 14 46 10 35 17– institutions 38 25 28 26 67 30– corporates1 45 59 – 54 – 52– securitisation positions 115 46 – 12 – 106– non-credit obligation assets 51 14 40 77 41 26
IRB foundation approach 67 – 60 – – 65– central governments and central banks – – – – – –– institutions – – – – – –– corporates 67 – 60 – – 65
Standardised approach 27 67 79 108 96 60
– central governments and central banks 3 5 10 174 226 10– institutions 76 37 43 – – 37– corporates 98 90 95 99 102 94– retail 72 75 75 72 71 74– secured by mortgages on immovable property 36 35 41 36 37 36– exposures in default 126 128 118 143 134 129– regional governments or local authorities – – – – 72 57– equity2 192 236 126 100 172 204– other3 65 72 89 64 160 74
At 31 December 2014 33 43 64 54 77 43
For footnotes, see page 36.
Key points
• Higher IRB density in Latin America resulted from higher risk weights applied to institutional exposures as a result of Brazil's CRR downgrades. Additionally the corporate IRB exposure density increased due to migration of a Project Finance portfolio from standardised to IRB approach.
• North America Retail IRB density has improved as a result of disposals and continued run-off of the US CML retail mortgage portfolio.
• A change in EEA equivalence rules resulted in a reclassification of some exposures from institutions to corporates with a corresponding decrease in institutions RWA density under IRB approach.
• Reduction in securitisation density is primarily the result of the disposal of highly risk weighted positions and a newly issued HSBC synthetic securitisation carrying a lower risk-weight in Europe.
• The decrease in RWA density in Asia equity exposure class results from the sale of our investment in Industrial Bank.

Capital and Risk Managem
ent Pillar 3 Disclosuresat 31 December 2015
(continued)
HSBC HOLDIN
GS PLC
42
Table 25: Credit risk exposure – by industry sector Exposure value
Personal Manu-
facturing
Inter-national
trade and services
Property and other
business activities
Government
and public administration
Other commercial Financial
Non- customer
assets Total $bn $bn $bn $bn $bn $bn $bn $bn $bn
IRB advanced approach 390.2 125.3 136.6 158.7 137.3 87.3 425.2 50.2 1,510.8Retail: – secured by mortgages on immovable property SME 0.5 – 0.1 2.3 – – – – 2.9– secured by mortgages on immovable property
non-SME 275.4 – – – – – – – 275.4 – qualifying revolving retail 67.8 – – – – – – – 67.8– other SME – 0.4 1.0 10.0 0.1 0.5 0.1 – 12.1– other non-SME 46.1 – – – 0.2 – – – 46.3
– total retail 389.8 0.4 1.1 12.3 0.3 0.5 0.1 – 404.5– central governments and central banks – – 0.1 – 119.9 – 207.4 – 327.4– institutions – – – – 0.8 0.1 89.6 – 90.5– corporates1 0.4 124.9 135.4 146.4 16.3 86.7 87.2 – 597.3– securitisation positions – – – – – – 40.9 – 40.9– non-credit obligation assets – – – – – – – 50.2 50.2
IRB foundation approach – 11.9 10.6 8.3 0.7 7.9 4.3 – 43.7– central governments and central banks – – – – – – 0.1 – 0.1– institutions – – – – – – 0.3 – 0.3– corporates – 11.9 10.6 8.3 0.7 7.9 3.9 – 43.3
Standardised approach 83.5 57.9 45.4 49.8 97.2 41.8 201.9 14.5 592.0– central governments or central banks – 0.1 – – 70.2 – 121.9 7.7 199.9– institutions – – – – – – 38.9 – 38.9– corporates 1.5 56.2 43.5 46.1 21.9 40.2 17.0 – 226.4– retail 40.8 0.6 1.0 1.2 0.1 0.3 0.2 – 44.2– secured by mortgages on immovable property 39.7 0.1 – 0.4 – 0.1 – – 40.3– exposures in default 1.5 0.9 0.8 0.8 0.1 0.7 0.1 – 4.9– regional governments or local authorities – – – – 2.3 – 0.5 – 2.8– equity 2 – – – 0.1 – – 3.4 3.5 7.0– items associated with particularly high risk – – 0.1 1.1 – 0.5 2.7 – 4.4– securitisation positions – – – – – – 0.7 – 0.7– claims in the form of CIU – – – – – – 0.5 – 0.5– international organisations – – – – 2.6 – – – 2.6– other items – – – 0.1 – – 16.0 3.3 19.4
4 3 19 1 630 9 64 2 14 9At 31 December 2015 473.7 195.1 192.6 216.8 235.2 137.0 631.4 64.7 2,146.5
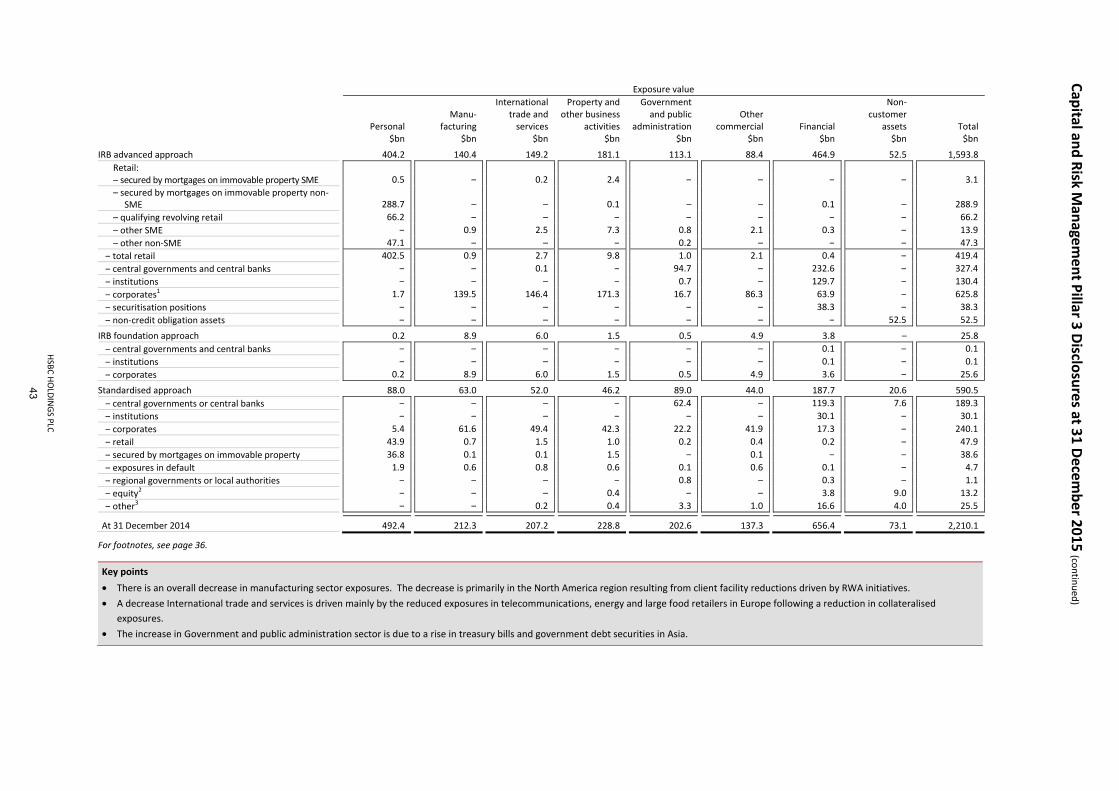
Capital and Risk Managem
ent Pillar 3 Disclosures at 31 December 2015 (continued)
HSBC HOLDIN
GS PLC
43
Exposure value
Personal Manu-
facturing
Internationaltrade and
services
Property and other business
activities
Government and public
administration Other
commercial Financial
Non-customer
assets Total $bn $bn $bn $bn $bn $bn $bn $bn $bn
IRB advanced approach 404.2 140.4 149.2 181.1 113.1 88.4 464.9 52.5 1,593.8Retail: – secured by mortgages on immovable property SME 0.5 – 0.2 2.4 – – – – 3.1– secured by mortgages on immovable property non-
SME 288.7 – – 0.1 – – 0.1 – 288.9 – qualifying revolving retail 66.2 – – – – – – – 66.2– other SME – 0.9 2.5 7.3 0.8 2.1 0.3 – 13.9– other non-SME 47.1 – – – 0.2 – – – 47.3
– total retail 402.5 0.9 2.7 9.8 1.0 2.1 0.4 – 419.4– central governments and central banks – – 0.1 – 94.7 – 232.6 – 327.4– institutions – – – – 0.7 – 129.7 – 130.4– corporates1 1.7 139.5 146.4 171.3 16.7 86.3 63.9 – 625.8– securitisation positions – – – – – – 38.3 – 38.3– non-credit obligation assets – – – – – – – 52.5 52.5
IRB foundation approach 0.2 8.9 6.0 1.5 0.5 4.9 3.8 – 25.8– central governments and central banks – – – – – – 0.1 – 0.1– institutions – – – – – – 0.1 – 0.1– corporates 0.2 8.9 6.0 1.5 0.5 4.9 3.6 – 25.6
Standardised approach 88.0 63.0 52.0 46.2 89.0 44.0 187.7 20.6 590.5– central governments or central banks – – – – 62.4 – 119.3 7.6 189.3– institutions – – – – – – 30.1 – 30.1– corporates 5.4 61.6 49.4 42.3 22.2 41.9 17.3 – 240.1– retail 43.9 0.7 1.5 1.0 0.2 0.4 0.2 – 47.9– secured by mortgages on immovable property 36.8 0.1 0.1 1.5 – 0.1 – – 38.6– exposures in default 1.9 0.6 0.8 0.6 0.1 0.6 0.1 – 4.7– regional governments or local authorities – – – – 0.8 – 0.3 – 1.1– equity2 – – – 0.4 – – 3.8 9.0 13.2– other3 – – 0.2 0.4 3.3 1.0 16.6 4.0 25.5
At 31 December 2014 492.4 212.3 207.2 228.8 202.6 137.3 656.4 73.1 2,210.1
For footnotes, see page 36.
Key points • There is an overall decrease in manufacturing sector exposures. The decrease is primarily in the North America region resulting from client facility reductions driven by RWA initiatives. • A decrease International trade and services is driven mainly by the reduced exposures in telecommunications, energy and large food retailers in Europe following a reduction in collateralised
exposures. • The increase in Government and public administration sector is due to a rise in treasury bills and government debt securities in Asia.

Capital and Risk Management Pillar 3 Disclosures at 31 December 2015 (continued)
HSBC HOLDINGS PLC
44
Table 26: Credit risk exposure – by residual maturity Exposure value
Less than
1 yearBetween
1 and 5 yearsMore than
5 years Undated
Total
RWAs $bn $bn $bn $bn $bn $bnIRB advanced approach 654.2 376.1 430.4 50.1 1,510.8 515.8
Retail: – secured by mortgages on immovable property
SME
0.2 0.4 2.3 – 2.9 0.6– secured by mortgages on immovable property
non-SME
2.4 4.2 268.8 – 275.4 60.0– qualifying revolving retail 67.8 – – – 67.8 15.3– other SME 2.4 6.4 3.3 – 12.1 5.8– other non-SME 13.9 12.8 19.6 – 46.3 11.5
– total retail 86.7 23.8 294.0 – 404.5 93.2– central governments and central banks 200.9 75.6 50.9 – 327.4 49.4– institutions 66.9 20.1 3.5 – 90.5 18.4– corporates1 289.8 246.0 61.5 – 597.3 314.3– securitisation positions 9.9 10.5 20.5 – 40.9 28.4– non-credit obligation assets – 0.1 – 50.1 50.2 12.1
IRB foundation approach 20.0 19.1 4.6 – 43.7 27.4– central governments and central banks – – 0.1 – 0.1 –– institutions 0.1 0.2 – – 0.3 0.2– corporates 19.9 18.9 4.5 – 43.3 27.2
Standardised approach 230.0 207.5 120.8 33.7 592.0 332.7
– central governments and central banks 126.2 48.0 18.0 7.7 199.9 20.0– institutions 22.4 0.5 16.0 – 38.9 14.7– corporates 60.1 136.7 29.6 – 226.4 210.6– retail 11.9 14.1 18.2 – 44.2 32.5– secured by mortgages on immovable property 2.3 2.6 35.4 – 40.3 14.4– exposures in default 2.6 1.2 1.1 – 4.9 6.4– regional governments or local authorities 1.2 1.2 0.4 – 2.8 1.0– equity2 – – – 7.0 7.0 12.2– items associated with particularly high risk 0.4 1.6 0.7 1.7 4.4 6.6– securitisation positions – – 0.7 – 0.7 0.7– claims in the form of CIU 0.4 – – 0.1 0.5 0.5– international organisations 0.4 1.6 0.6 – 2.6 –– other items 2.1 – 0.1 17.2 19.4 13.1
At 31 December 2015 904.2 602.7 555.8 83.8 2,146.5 875.9

Capital and Risk Management Pillar 3 Disclosures at 31 December 2015 (continued)
HSBC HOLDINGS PLC
45
Exposure value
Less than
1 yearBetween
1 and 5 yearsMore than
5 years Undated
Total
RWAs $bn $bn $bn $bn $bn $bnIRB advanced approach 729.1 382.5 429.8 52.4 1,593.8 581.6
Retail: – secured by mortgages on immovable property
SME
0.1 0.2 2.8 – 3.1 0.6– secured by mortgages on immovable property
non-SME
2.9 4.1 281.9 – 288.9 71.6– qualifying revolving retail 66.2 – – – 66.2 15.3– other SME 3.3 7.0 3.6 – 13.9 6.2– other non-SME 13.8 12.7 20.8 – 47.3 12.4
– total retail 86.3 24.0 309.1 – 419.4 106.1– central governments and central banks 212.7 80.2 34.5 – 327.4 54.1– institutions 100.9 25.4 4.1 – 130.4 38.7– corporates1 318.6 247.1 60.1 – 625.8 328.5– securitisation positions 10.6 5.7 22.0 – 38.3 40.7– non-credit obligation assets – 0.1 – 52.4 52.5 13.5
IRB foundation approach 10.5 12.9 2.4 – 25.8 16.8– central governments and central banks – 0.1 – – 0.1 –– institutions – 0.1 – – 0.1 –– corporates 10.5 12.7 2.4 – 25.6 16.8
Standardised approach 242.1 201.6 116.8 30.0 590.5 356.9
– central governments and central banks 123.5 37.7 20.5 7.6 189.3 19.7– institutions 16.2 0.9 13.0 – 30.1 11.2– corporates 70.2 142.6 27.2 0.1 240.1 224.7– retail 17.1 12.8 18.0 – 47.9 35.2– secured by mortgages on immovable property 1.9 3.0 33.7 – 38.6 13.8– exposures in default 2.2 1.3 1.2 – 4.7 6.1– regional governments or local authorities 0.4 0.3 0.4 – 1.1 0.6– equity2 – – – 13.2 13.2 26.9– other3 10.6 3.0 2.8 9.1 25.5 18.7
At 31 December 2014 981.7 597.0 549.0 82.4 2,210.1 955.3
For footnotes, see page 36.
Key points • The decrease in ‘Less than 1 year’ banding is driven by a reduction in corporate customers exposures in Europe which are fully cash
collateralised. This has no impact on RWAs. • The increase under IRB approach in ‘More than 5 years’ banding in central government or central bank exposures is largely driven by a
decline in deposits in central banks with shorter maturity as well as an increase in exposures with longer maturity.

Capital and Risk Management Pillar 3 Disclosures at 31 December 2015 (continued)
HSBC HOLDINGS PLC
46
Application of the IRB approach
The narrative explanations that follow relate to the IRB approaches: advanced and foundation IRB for distinct customers and advanced IRB for the portfolio-managed retail business. Details of our use of the standardised approach can be found on page 76.
Our Group IRB credit risk rating framework incorporates obligor propensity to default expressed in PD, and loss severity in the event of default expressed in EAD and LGD. These measures are used to calculate regulatory EL and capital requirements. They are also used with other inputs to inform rating assessments for the purpose of credit approval and many other management decisions.
Use of internal estimates PDs, LGDs, and EAD applied in the calculation of regulatory capital requirements are also extensively used for other purposes, for example: • credit approval and monitoring: IRB models are used in
the assessment of customer and portfolio risk in lending decisions;
• risk appetite: IRB measures are an important element in identifying risk exposure at customer, sector, and portfolio level;
• pricing: IRB parameters are used in pricing tools for new transactions and reviews; and
• economic capital and portfolio management: IRB parameters are used in the economic capital model that has been implemented across HSBC.
Roll-out of the IRB approach
With the PRA’s permission, we have adopted the advanced approach for the majority of our business. At the end of 2015, portfolios in much of Europe, Asia and North America were on advanced IRB approaches. Others remain on the standardised or foundation approaches pending the development of models for the PRA’s approval in line with our IRB roll-out plans, or under exemptions or exclusions from the IRB treatment. Additionally, in some instances, regulators have allowed us to transition from advanced to standardised approaches for a limited number of immaterial portfolios. Under the advanced IRB approach, banks are allowed to develop their own empirical models to quantify required capital for credit risk. All such models developed by us, and any material changes to those models, must be approved by the PRA, subject to de minimis exceptions. Material changes are those that individually have a high impact, or where a number of small changes in aggregate have a high impact. Quantitative and qualitative materiality thresholds for these model changes are determined by CRD IV, which also requires us to obtain the PRA’s approval before implementation where these thresholds are breached. The effectiveness of this process is monitored by the PRA through an annual review of IRB usage, focusing on the proportion of total credit risk assets for which IRB approaches are used. Banks have experienced difficulties in adopting advanced IRB in some cases, for example in portfolios which have very low
levels of default, such that the PD, LGD and EAD cannot be assessed to a sufficiently high degree of confidence due to a lack of default or loss data. Difficulties also arise in countries where the rules and requirements of the local regulator’s implementation of the Basel Committee’s requirements are different from those of the PRA, or where the regulators have introduced capital floors and overlays to mitigate perceived model deficiencies. Tables 27 and 31 detail several material regulatory thresholds and overlays. While recognising the complexity of adopting IRB in some situations, we remain committed to working constructively with our regulators to achieve acceptable roll-out plans.
The wholesale risk rating system
This section describes how we build and operate our credit risk analytical models and use IRB metrics in the wholesale customer business.
PDs for wholesale customer segments (that is central governments and central banks, financial institutions and corporate customers) and for certain individually assessed personal customers, are estimated using a CRR master scale of 23 grades. Of these, 21 are non-default grades representing varying degrees of strength of financial condition, and two are default grades.
The score generated by a credit risk rating model for the obligor is mapped to a corresponding PD and master-scale CRR. The CRR is then reviewed by a credit approver who, taking into account all relevant information, such as the most recent events and market data, where available, makes the final decision on the rating. The rating assigned therefore reflects the approver’s overall view of the obligor’s credit standing and propensity to default.
The finally assigned CRR determines the applicable master-scale PD range from which the reference PD, generally the arithmetical mid-point, is used in the regulatory capital calculation.
Reviewing the initial model score, relationship managers may propose a different CRR from that indicated, where they believe this is more appropriate. Such amendments may only be made through an override process and must be approved by the Credit function. Overrides for each model are recorded, and override levels are reviewed, as part of the model management process.
The CRR is assigned at an obligor level, which means that separate exposures to the same obligor are generally subject to a single, consistent rating. Unfunded credit risk mitigants such as guarantees, where they apply, may also influence the final assignment of a CRR to an obligor. The effect of unfunded risk mitigants is considered for IRB approaches in table 43 and for the standardised approach in table 44.
If an obligor is in default on any material credit obligation to the Group, all of the obligor’s facilities from the Group are considered to be in default.
Under the IRB approach, obligors are grouped into grades that have similar PD or anticipated default frequency. The anticipated default frequency may be estimated using all relevant information at the relevant date (PIT rating system), or be free of the effects of the credit cycle (TTC rating system).

Capital and Risk Management Pillar 3 Disclosures at 31 December 2015 (continued)
HSBC HOLDINGS PLC
47
We generally utilise a hybrid approach of PIT and TTC. That is, while models are calibrated to long-run default rates, obligor ratings are reviewed annually, or more frequently if necessary to reflect changes in their circumstances and/or their economic operating environment.
Thus, over the economic cycle, a cycle will also appear in CRR migration. The influence of longer-term economic cycle factors implied by the model’s calibration, combined with the effect of ongoing credit reviews, will result in long-term PDs generally above the actual default frequency during benign economic periods, but not changing so fast in a downturn. In practice, under a hybrid approach, ratings tend to be more volatile than would be the case in a pure TTC system, but less volatile than in a pure PIT one.
Moreover, our policy requires approvers to downgrade ratings on expectations but to upgrade them only on performance. Therefore, ratings will typically migrate during a downturn in response to higher perceived risks, but be upgraded more slowly in an upswing. This leads to expected defaults typically exceeding actual defaults, overall.
For EAD and LGD estimation, operating entities are permitted, subject to overview by Group Risk, to use their own modelling approaches for those parameters to suit conditions in their jurisdictions. Group Risk provides co-ordination, benchmarks, and the sharing and promotion of best practice on EAD and LGD estimation.
EAD is estimated to a 12-month forward time horizon and represents the current exposure plus an estimate for future increases in exposure, taking into account such factors as available but undrawn facilities, and the realisation of contingent exposures post-default.
LGD is based on the effects of facility and collateral structure on outcomes post-default. This includes such factors as the type of client, the facility seniority, the type and value of collateral, past recovery experience and priority under law. It is expressed as a percentage of EAD.
Wholesale models
To determine credit ratings for the different types of wholesale obligor, many different models and scorecards are used for PD, LGD, and EAD; there are over 100 wholesale IRB models in use or under development within HSBC. These models may be differentiated by region, customer segment and/or customer size. For example, PD models are differentiated for all of our key customer segments, including sovereigns, financial institutions and large, medium and small-sized corporates.
Global PD models have been developed for asset classes or clearly identifiable segments of asset classes where the customer relationship is managed globally, for example sovereigns, financial institutions and the largest corporate clients, typically those which operate internationally.
Local PD models, specific to a particular country, region, or sector, are developed for other obligors. This includes corporate clients when they show distinct characteristics in common in a particular geography. The most material local corporate PD models are the UK mid-market PD model, and the Hong Kong and Asia-Pacific mid-market models.
The two major drivers of model methodology are the nature of the portfolio and the availability of internal or external data on historical defaults and risk factors. For some historically low-default portfolios, e.g. sovereign and financial institutions, a model will rely more heavily on external data and/or the input of an expert panel. By contrast, where sufficient data is available, models are built on a statistical basis, although the input of expert judgement may still form an important part of the overall model development methodology.
Most LGD and EAD models are developed according to local circumstances, taking into account legal and procedural differences in the recovery and workout processes. However, our approach to EAD and LGD also encompasses global models for central governments and central banks, and for institutions, as exposures to these customer types are managed centrally by Global Risk. The PRA requires all firms to apply an LGD floor of 45% for senior unsecured exposure to sovereign entities. This floor was applied to reflect the relatively few loss observations across all firms in relation to these obligors. This floor is applied for the purposes of regulatory capital reporting.
In addition, the PRA has published guidance on the appropriateness of LGD models for low default portfolios generally. The PRA has determined that there should be at least 20 defaults per country per collateral type for LGD models to be approved. Where there are insufficient defaults, an LGD floor will be applied. As a result, in 2015, we continued to apply LGD floors for our banks portfolio and some Asian corporate portfolios where there were insufficient loss observations.
In the same guidance, the PRA also indicated that it considered income producing real estate to be an asset class that would be difficult to model. As a result, RWAs for our UK CRE portfolio are calculated using the supervisory slotting approach and our US income producing CRE portfolio is on the standardised approach.
Local models for the corporate exposure class are developed using various data inputs, including collateral information and geography (for LGD) and product type (for EAD). The most material corporate models are the UK and Asia models, all of which are developed using more than 10 years’ worth of data. The LGD models are calibrated to a period of credit stress or downturn in economic conditions. The global LGD models for sovereigns and for banks reflect the expected increase in observed losses during an economic downturn period.
None of the EAD models are calibrated for a downturn, as analysis shows that utilisation decreases during a downturn because credit stress is accompanied by more intensive limit monitoring and facility reduction.
Table 27 sets out the key characteristics of the significant wholesale credit risk models that drive the capital calculation split by regulatory wholesale asset class, with their associated RWAs, including the number of models for each component, the model method or approach and the number of years of loss data used.

Capital and Risk Management Pillar 3 Disclosures at 31 December 2015 (continued)
HSBC HOLDINGS PLC
48
Table 27: Wholesale IRB credit risk models
Regulatory asset classes measured
RWAs for associated asset class
$bn Com-
ponent
Number ofsignificant
models Model description and methodology
Numberof years
loss data Central governments
and central banks 49.4 PD 1 A shadow rating approach constrained with expert judgement
which includes macroeconomic and political factors. 8
LGD 1 An unsecured model built on assessment of structural factors that influence the country’s long-term economic performance. As required by the PRA, the model is floored at 45%.
8
EAD 1 A cross-classification model which uses both internal data and expert judgement as well as information on similar exposure types from other asset classes.
8
Institutions 18.6 PD 1 A statistical model which combines quantitative analysis on financial information with expert inputs and macroeconomic factors.
10
LGD 1 A quantitative model which produces both downturn and expected LGD. Several securities types are included in the model to recognise collateral in the LGD calculation. As required by the PRA, a floor of 45% is applied.
10
EAD 1 A quantitative model which predicts credit conversion factors taking into account current utilisation, available headroom, product types, and committed/uncommitted indicator.
10
Corporates1 323.3 Global large corporates PD 1 A statistical model built on 15 years of data. The model uses
financial information, macroeconomic information and market-driven data and is complemented by a qualitative assessment.
>10
Other corporates PD 5 Corporates that fall below the global large corporate threshold are rated through local PD models, which reflect regional circumstances. These models use balance sheet data, behavioural data and qualitative information to derive a statistically built PD.
>10
All corporates LGD 3 Local statistical models covering all corporates including global large corporates developed using various data inputs, including collateral information, recoveries and geography.
>7
EAD 3 Local statistical models developed using various data inputs,
including product type and geography. >7
1 Excludes specialised lending exposures subject to supervisory slotting approach (see table 29).
Table 28 sets out risk metrics broken down by region. Table 30 shows the same metrics broken down by CRR band. Table 29 sets out an analysis of those exposures to which a
supervisory slotting approach is applied. An analysis of PD, LGD, RWAs and exposure by country is provided in Appendix IV.

Capital and Risk Management Pillar 3 Disclosures at 31 December 2015 (continued)
HSBC HOLDINGS PLC
49
Table 28: Wholesale IRB portfolio analysis
Europe Asia MENA North
America Latin
America
Total % % % % % %At 31 December 2015 Exposure weighted average PD IRB advanced approach
Central governments and central banks 0.08 0.06 0.88 0.01 0.90 0.14Institutions 0.34 0.08 0.11 0.16 0.86 0.18Corporates1 2.92 1.52 0.79 1.65 17.83 2.04
IRB foundation approach
Central governments and central banks – – 0.04 – – 0.04Institutions – – 0.29 – – 0.29Corporates 1.45 – 2.10 – – 1.68
Exposure weighted average LGD IRB advanced approach
Central governments and central banks 45.0 45.0 45.0 45.1 45.0 45.0Institutions 24.5 43.3 45.4 38.4 45.3 37.4Corporates1 30.2 43.0 34.4 36.0 40.3 37.0
At 31 December 2014 Exposure weighted average PD IRB advanced approach
Central governments and central banks 0.09 0.09 1.23 0.01 0.57 0.17Institutions 0.66 0.22 0.55 0.13 0.76 0.36Corporates1 2.62 1.44 0.09 1.26 – 1.85
IRB foundation approach Central governments and central banks – – 0.04 – – 0.04Institutions 0.13 – 0.03 – – 0.10Corporates1 1.36 – 2.86 – – 1.74
Exposure weighted average LGD IRB advanced approach
Central governments and central banks 45.0 45.0 45.0 45.4 45.0 45.1Institutions 35.3 45.3 39.8 40.6 45.4 42.0Corporates1 25.8 44.3 13.7 36.6 – 35.6
1 Excludes specialised lending exposures subject to supervisory slotting approach (see table 29).
Table 29: Wholesale IRB exposures under the slotting approach Remaining maturity
less than 2.5 years Remaining maturity
greater than 2.5 years
Total Exposure
value RWAs Exposure
value RWAs Exposure
value
RWAs $bn $bn $bn $bn $bn $bnSupervisory Category
Category 1 – Strong 6.4 3.1 8.3 5.8 14.7 8.9Category 2 – Good 2.8 2.0 3.2 2.9 6.0 4.9Category 3 – Satisfactory 0.9 1.0 1.2 1.3 2.1 2.3Category 4 – Weak 0.7 1.6 0.2 0.5 0.9 2.1Category 5 – Default 1.0 – 0.2 – 1.2 –
At 31 December 2015 11.8 7.7 13.1 10.5 24.9 18.2 Supervisory Category
Category 1 – Strong 7.0 3.4 9.7 6.7 16.7 10.1Category 2 – Good 4.4 3.1 3.7 3.2 8.1 6.3Category 3 – Satisfactory 1.4 1.7 1.5 1.7 2.9 3.4Category 4 – Weak 0.9 2.4 0.3 0.8 1.2 3.2Category 5 – Default 1.4 – 0.2 – 1.6 –
At 31 December 2014 15.1 10.6 15.4 12.4 30.5 23.0

Capital and Risk Management Pillar 3 Disclosures at 31 December 2015 (continued)
HSBC HOLDINGS PLC
50
Table 30 and the graphs below set out IRB exposures by obligor grade for central governments and central banks, institutions and corporates, all of which are assessed using our 23-grade CRR master scale. We benchmark the master scale against the ratings of external rating agencies. Each CRR band is associated with an external rating grade by reference to long-run default rates for that grade, represented by the average of issuer-weighted historical default rates.
The correspondence between the agency long-run default rates and the PD ranges of our master scale is obtained by
matching a smoothed curve based on those default rates with our master scale reference PDs. This association between internal and external ratings is indicative and may vary over time. In these tables, the ratings of S&P are cited for illustration purposes, though we also benchmark against other agencies’ ratings in an equivalent manner.
For further details of the Group’s approach to credit quality classification, see the definition of ‘obligor grade’ in the glossary and page 196 of the Annual Report and Accounts 2015.
Table 30a: Wholesale IRB exposure – by obligor grade1 – Central governments and central banks
CRR PD range
Exposure
value
Averageexposure
value5
Undrawn commit-
ments Average
PD2Average
LGD2RWA
density2
RWAs
Mappedexternal
rating % $bn $bn $bn % % % $bn Default risk
Minimal 0.1 0.000 to 0.010 139.8 131.3 0.6 0.01 45.0 8 11.3 AAA 1.1 0.011 to 0.028 101.9 86.6 1.0 0.02 45.0 7 6.7 AA+ to AA
1.2 0.029 to 0.053 38.8 54.0 0.4 0.04 45.0 15 5.7 AA– to A+ Low 2.1 0.054 to 0.095 10.5 25.9 – 0.07 45.0 28 2.9 A 2.2 0.096 to 0.169 11.6 6.7 – 0.13 45.0 30 3.5 A– Satisfactory 3.1 0.170 to 0.285 3.6 10.6 – 0.22 45.0 36 1.3 BBB+ 3.2 0.286 to 0.483 9.2 4.6 – 0.37 45.0 54 5.0 BBB 3.3 0.484 to 0.740 2.2 2.0 – 0.63 45.0 64 1.4 BBB– Fair 4.1 0.741 to 1.022 0.1 1.0 – 0.87 45.1 100 0.1 BB+ 4.2 1.023 to 1.407 1.1 0.5 – 1.20 45.0 91 1.0 BB 4.3 1.408 to 1.927 1.1 0.5 – 1.65 45.0 100 1.1 BB– Moderate 5.1 1.928 to 2.620 4.7 2.9 0.3 2.25 45.0 106 5.0 BB– 5.2 2.621 to 3.579 0.7 0.5 0.2 3.05 45.2 129 0.9 B+ 5.3 3.580 to 4.914 1.0 3.5 0.1 4.20 45.0 130 1.3 B Significant 6.1 4.915 to 6.718 0.1 0.4 – 5.75 45.0 100 0.1 B 6.2 6.719 to 8.860 0.3 0.3 – 7.85 45.0 200 0.6 B– High 7.1 8.861 to 11.402 0.8 0.6 – 10.00 45.0 188 1.5 CCC+ 7.2 11.403 to 15.000 – – – – – – – CCC+ Special management 8.1 15.001 to 22.000 – – – – – – – CCC+ 8.2 22.001 to 50.000 – – – – – – CCC+ 8.3 50.001 to 99.999 – – – – – – – CCC to C Default3 9/10 100.000 – – – – – – – Default
At 31 December 2015 327.5 331.9 2.6 0.14 45.0 15 49.4

Capital and Risk Management Pillar 3 Disclosures at 31 December 2015 (continued)
HSBC HOLDINGS PLC
51
CRR PD range
Exposure
value Average
PD2Average
LGD2RWA
density2
RWAs
Mappedexternal
rating % $bn % % % $bn Default risk
Minimal 0.1 0.000 to 0.010 122.8 0.01 45.2 7 8.7 AAA 1.1 0.011 to 0.028 60.3 0.02 45.0 7 4.4 AA+ to AA 1.2 0.029 to 0.053 59.2 0.04 45.4 13 7.4 AA– to A+ Low 2.1 0.054 to 0.095 51.6 0.07 45.0 20 10.4 A 2.2 0.096 to 0.169 6.0 0.13 45.2 25 1.5 A– Satisfactory 3.1 0.170 to 0.285 11.3 0.22 45.0 43 4.9 BBB+ 3.2 0.286 to 0.483 3.6 0.37 45.0 53 1.9 BBB 3.3 0.484 to 0.740 1.6 0.63 45.0 63 1.0 BBB– Fair 4.1 0.741 to 1.022 1.7 0.87 45.0 81 1.4 BB+ 4.2 1.023 to 1.407 0.4 1.16 45.0 125 0.5 BB 4.3 1.408 to 1.927 0.2 1.65 43.3 100 0.2 BB– Moderate 5.1 1.928 to 2.620 0.9 2.25 45.0 111 1.0 BB– 5.2 2.621 to 3.579 0.7 3.05 45.0 129 0.9 B+ 5.3 3.580 to 4.914 5.6 4.20 45.0 130 7.3 B Significant 6.1 4.915 to 6.718 0.7 5.75 45.2 157 1.1 B 6.2 6.719 to 8.860 0.1 7.85 45.0 200 0.2 B– High 7.1 8.861 to 11.402 0.7 10.00 45.0 186 1.3 CCC+ 7.2 11.403 to 15.000 – – – – – CCC+ Special management 8.1 15.001 to 22.000 – – – – – CCC+ 8.2 22.001 to 50.000 – – – – – CCC+ 8.3 50.001 to 99.999 – – – – – CCC to C Default3 9/10 100.000 – – – – – Default
At 31 December 2014 327.4 0.17 45.1 17 54.1
For footnotes, see page 53.

Capital and Risk Management Pillar 3 Disclosures at 31 December 2015 (continued)
HSBC HOLDINGS PLC
52
Table 30b: Wholesale IRB exposure – by obligor grade1 – Institutions (continued)
CRR PD range
Exposure
value
Averageexposure
value5
Undrawn commit-
ments Average
PD2Average
LGD2RWA
density2
RWAs
Mappedexternal
rating % $bn $bn $bn % % % $bn Default risk
Minimal 0.1 0.000 to 0.010 2.0 2.2 0.1 0.03 45.4 20 0.4 AAA 1.1 0.011 to 0.028 12.5 15.0 1.3 0.03 35.1 10 1.2 AA+ to AA 1.2 0.029 to 0.053 35.5 28.8 3.8 0.04 42.6 13 4.5 AA–
Low 2.1 0.054 to 0.095 20.0 36.4 5.0 0.07 22.3 12 2.3 A+ to A 2.2 0.096 to 0.169 9.5 11.9 3.5 0.13 45.4 33 3.1 A–
Satisfactory 3.1 0.170 to 0.285 3.9 7.8 1.4 0.22 42.2 44 1.7 BBB+ 3.2 0.286 to 0.483 4.6 4.9 0.4 0.37 41.8 67 3.1 BBB 3.3 0.484 to 0.740 1.1 3.3 0.5 0.63 44.5 73 0.8 BBB–
Fair 4.1 0.741 to 1.022 0.5 0.9 0.2 0.87 44.5 67 0.4 BB+ 4.2 1.023 to 1.407 0.6 1.7 0.2 1.20 43.1 83 0.5 BB 4.3 1.408 to 1.927 0.1 0.4 – 1.65 44.7 100 0.1 BB–
Moderate 5.1 1.928 to 2.620 0.1 0.3 0.1 2.25 50.0 100 0.1 BB– 5.2 2.621 to 3.579 0.1 0.1 – 3.05 45.1 100 0.1 B+ 5.3 3.580 to 4.914 0.1 0.3 – 4.20 33.5 100 0.1 B
Significant 6.1 4.915 to 6.718 0.1 0.3 – 5.75 45.1 100 0.1 B– 6.2 6.719 to 8.860 – – – – – – – B–
CCCHigh 7.1 8.861 to 11.402 0.1 0.2 – 10.00 45.1 100 0.1 CCC+ 7.2 11.403 to 15.000 – – – – – – – CCC+
Special management 8.1 15.001 to 22.000 – – – – – – – CCC 8.2 22.001 to 50.000 – – – – – – – CCC– to CC 8.3 50.001 to 99.999 – – – – – – – C
Default3 9/10 100.000 – – – – – – – Default
At 31 December 2015 90.8 114.5 16.5 0.18 37.4 20 18.6
CRR PD range
Exposure
value Average
PD2Average
LGD2RWA
density2
RWAs
Mappedexternal
rating % $bn % % % $bn Default risk
Minimal 0.1 0.000 to 0.010 1.8 0.02 50.2 22 0.4 AAA 1.1 0.011 to 0.028 15.3 0.03 41.0 12 1.8 AA+ to AA 1.2 0.029 to 0.053 27.4 0.04 31.7 11 3.0 AA–
Low 2.1 0.054 to 0.095 44.0 0.07 45.2 20 8.5 A+ to A 2.2 0.096 to 0.169 14.3 0.13 45.4 34 4.8 A–
Satisfactory 3.1 0.170 to 0.285 9.3 0.22 44.7 42 3.9 BBB+ 3.2 0.286 to 0.483 6.1 0.37 45.1 56 3.4 BBB 3.3 0.484 to 0.740 4.2 0.63 46.7 74 3.1 BBB–
Fair 4.1 0.741 to 1.022 1.9 0.87 48.3 100 1.8 BB+ 4.2 1.023 to 1.407 2.3 1.20 31.3 65 1.5 BB 4.3 1.408 to 1.927 0.9 1.65 45.8 133 1.2 BB–
Moderate 5.1 1.928 to 2.620 0.3 2.25 54.3 167 0.5 BB– 5.2 2.621 to 3.579 0.3 3.05 47.6 167 0.5 B+ 5.3 3.580 to 4.914 0.6 4.20 55.7 180 0.9 B
Significant 6.1 4.915 to 6.718 0.3 5.75 76.0 267 0.8 B– 6.2 6.719 to 8.860 0.4 7.85 28.8 100 0.4 B–
CCCHigh 7.1 8.861 to 11.402 0.6 10.00 57.4 250 1.5 CCC+ 7.2 11.403 to 15.000 0.3 13.00 51.2 233 0.7 CCC+
Special management 8.1 15.001 to 22.000 – – – – – CCC 8.2 22.001 to 50.000 – – – – – CCC– to CC 8.3 50.001 to 99.999 – – – – – C
Default3 9/10 100.000 0.1 100.00 64.7 – – Default
At 31 December 2014 130.4 0.36 42.0 30 38.7
For footnotes, see page 53.

Capital and Risk Management Pillar 3 Disclosures at 31 December 2015 (continued)
HSBC HOLDINGS PLC
53
Table 30c: Wholesale IRB exposure – by obligor grade1 – Corporates4 (continued)
CRR PD range
Exposure
value
Average exposure
value5
Undrawn commit-
ments Average
PD2Average
LGD2RWA
density2
RWAs
Mappedexternal
rating % $bn $bn $bn % % % $bn Default risk
Minimal 0.1 0.000 to 0.010 – – – – – – – 1.1 0.011 to 0.028 11.5 11.8 15.9 0.03 39.4 11 1.3 AAA to AA 1.2 0.029 to 0.053 51.7 48.1 37.9 0.04 34.6 14 7.4 AA–Low 2.1 0.054 to 0.095 66.1 69.5 57.8 0.07 38.4 22 14.7 A+ to A 2.2 0.096 to 0.169 84.3 89.4 68.3 0.13 36.3 28 23.7 A–Satisfactory 3.1 0.170 to 0.285 75.5 79.7 59.5 0.22 39.3 40 30.3 BBB+ 3.2 0.286 to 0.483 74.8 73.1 54.4 0.37 39.0 51 38.4 BBB 3.3 0.484 to 0.740 70.0 70.5 44.8 0.63 36.3 61 42.4 BBB–Fair 4.1 0.741 to 1.022 43.3 45.9 26.2 0.87 38.3 73 31.6 BB+ 4.2 1.023 to 1.407 39.9 37.4 23.7 1.20 34.8 75 30.1 BB 4.3 1.408 to 1.927 28.4 31.6 18.7 1.65 39.6 96 27.3 BB–Moderate 5.1 1.928 to 2.620 26.2 24.0 17.3 2.24 37.5 98 25.7 BB– 5.2 2.621 to 3.579 12.1 12.5 8.6 3.07 39.5 112 13.6 B+ 5.3 3.580 to 4.914 11.9 11.9 8.0 4.15 35.1 108 12.9 BSignificant 6.1 4.915 to 6.718 5.9 5.3 4.4 5.73 38.4 134 7.9 B– 6.2 6.719 to 8.860 2.4 3.0 1.4 7.85 42.2 167 4.0 B–High 7.1 8.861 to 11.402 2.1 2.1 1.2 10.02 33.1 138 2.9 CCC+ 7.2 11.403 to 15.000 1.0 0.9 0.5 13.00 32.3 160 1.6 CCC+Special management 8.1 15.001 to 22.000 0.7 0.8 0.5 19.00 36.1 200 1.4 CCC 8.2 22.001 to 50.000 0.5 0.4 0.2 35.85 33.0 180 0.9 CCC– to CC 8.3 50.001 to 99.999 0.2 0.3 0.1 75.00 35.5 100 0.2 CDefault3 9/10 100.000 7.2 6.8 1.0 100.00 42.8 70 5.0 Default
At 31 December 2015 615.7 625.0 450.4 2.01 37.5 53 323.3
CRR PD range
Exposure
value Average
PD2Average
LGD2RWA
density2
RWAs
Mappedexternal
rating % $bn % % % $bn Default risk
Minimal 0.1 0.000 to 0.010 – – – – – 1.1 0.011 to 0.028 11.5 0.03 43.6 16 1.8 AAA to AA 1.2 0.029 to 0.053 43.0 0.04 30.4 13 5.6 AA–Low 2.1 0.054 to 0.095 70.7 0.07 32.8 18 12.5 A+ to A 2.2 0.096 to 0.169 91.3 0.13 32.8 25 22.9 A–Satisfactory 3.1 0.170 to 0.285 82.9 0.22 37.0 38 31.5 BBB+ 3.2 0.286 to 0.483 71.9 0.37 39.7 53 38.2 BBB 3.3 0.484 to 0.740 71.1 0.63 35.0 60 42.7 BBB–Fair 4.1 0.741 to 1.022 47.4 0.87 36.1 70 33.1 BB+ 4.2 1.023 to 1.407 33.0 1.20 37.9 81 26.7 BB 4.3 1.408 to 1.927 32.6 1.65 40.3 101 32.8 BB–Moderate 5.1 1.928 to 2.620 22.6 2.24 38.0 100 22.6 BB– 5.2 2.621 to 3.579 12.8 3.07 40.8 116 14.9 B+ 5.3 3.580 to 4.914 11.6 4.16 38.7 121 14.0 BSignificant 6.1 4.915 to 6.718 4.7 5.74 36.9 123 5.8 B– 6.2 6.719 to 8.860 3.6 7.85 39.7 158 5.7 B–High 7.1 8.861 to 11.402 1.7 10.03 32.9 139 2.5 CCC+ 7.2 11.403 to 15.000 0.9 13.00 38.0 178 1.6 CCC+Special management 8.1 15.001 to 22.000 0.7 19.01 34.5 175 1.4 CCC 8.2 22.001 to 50.000 0.3 36.00 31.2 167 0.5 CCC– to CC 8.3 50.001 to 99.999 0.3 75.00 45.1 133 0.4 CDefault3 9/10 100.000 6.3 100.00 40.8 81 5.1 Default
At 31 December 2014 620.9 1.85 36.0 52 322.3
1 See glossary for definition of obligor grade. 2 Average PD, average LGD and RWA density percentages represent an exposure weighted average. 3 There is a requirement to hold additional capital for unexpected losses on defaulted exposures where LGD exceeds our best estimate of EL. As a result,
in some cases, RWAs arise for exposures in default. 4 Excludes specialised lending exposures subject to the supervisory slotting approach (EAD: $24.9bn; RWA: $18.2bn). 5 Average exposures are calculated by aggregating exposure value of the last five quarters and dividing by five to get the average.

Capital and Risk Management Pillar 3 Disclosures at 31 December 2015 (continued)
HSBC HOLDINGS PLC
54
Key points • The increases in central governments and central banks in CRR0.1 and CRR1.1 are primarily driven by rise in central bank balances, debt
securities and treasury bills in Asia and North America, along with the purchase of government guaranteed mortgage backed securities as part of interest rate risk management.
• The decrease in central governments and central banks exposure class in CRR2.1 is primarily driven a model update changing China rating to CRR1.2 and local currency downgrade of Brazil to CRR3.2.
• The decrease in institution exposure class in CRR2.1 has been primarily driven by upgrades in Asia to CRR1.2.
Wholesale exposures by CRR Band
Wholesale 2015
Wholesale 2014
Central governments and central banks
0
20
40
60
80
100
120
140
160
0.1 1.1 1.2 2.1 2.2 3.1 3.2 3.3 4.1 4.2 4.3 5.1 5.2 5.3 >6.0
CRR Band
$bn
Central governments and central banksInstitutionsCorporates
Minimal Low Satisfactory Fair Moderate ≥ Significant
0
20
40
60
80
100
120
140
0.1 1.1 1.2 2.1 2.2 3.1 3.2 3.3 4.1 4.2 4.3 5.1 5.2 5.3 >6.0
CRR Band
$bn
Central governments and central banksInstitutionsCorporates
Minimal Low Satisfactory Fair Moderate ≥ Significant
0
20
40
60
80
100
120
140
160
0.1 1.1 1.2 2.1 2.2 3.1 3.2 3.3 4.1 4.2 4.3 5.1 5.2 5.3 >6.0
CRR Band
$bn
2015
2014
Minimal Low Satisfactory Fair Moderate ≥ Significant

Capital and Risk Management Pillar 3 Disclosures at 31 December 2015 (continued)
HSBC HOLDINGS PLC
55
Institutions
Corporates
05
101520253035404550
0.1 1.1 1.2 2.1 2.2 3.1 3.2 3.3 4.1 4.2 4.3 5.1 5.2 5.3 >6.0
CRR Band
$bn
2015
2014
Minimal Low Satisfactory Fair Moderate ≥ Significant
0102030405060708090
100
0.1 1.1 1.2 2.1 2.2 3.1 3.2 3.3 4.1 4.2 4.3 5.1 5.2 5.3 >6.0
CRR Band
$bn2015
2014
Minimal Low Satisfactory Fair Moderate ≥ Significant

Capital and Risk Management Pillar 3 Disclosures at 31 December 2015 (continued)
HSBC HOLDINGS PLC
56
Retail risk rating systems
Owing to the different country-level portfolio performance characteristics and loss history, there are no global models for our retail portfolios. Our retail models are developed at a local level, based on portfolio behaviour and observed defaults. Across the Group, we maintain over 1,000 retail risk predictive scorecards and models. Of these, over 170 are used with the PRA’s approval under our IRB permission, the remainder being application scorecards, behavioural scorecards, or forecasting models.
We classify approximately 70% of the total number of retail IRB models as constituting globally or regionally material risk rating systems, taking account of their strategic importance to the Group. These material risk rating systems represented approximately 87% of our total retail IRB RWAs of $93bn at 31 December 2015.
The ten most material risk rating systems based on the above criteria, for which we disclose details of modelling methodology in table 31 and performance data in table 38, represented RWAs of approximately $62bn or 67% of the total retail IRB RWAs, the majority being attributable to the five risk rating systems for residential mortgages, our most material retail exposure class.
All newly adopted IRB models for retail portfolios, irrespective of size, require the PRA’s approval. For changes to existing IRB models, a PRA approval process applies to all but a list of de minimis exemptions representing an immaterial percentage of total Group credit risk RWAs. This approval process sets various quantitative and qualitative thresholds to ensure that all significant model changes go forward for approval.
When developing retail models, segmentation based on risk characteristics is often adopted to enhance the models’ discrimination and accuracy. The majority of our retail models are designed for a particular product or group of products in a specific country. We have developed and issued global internal model governance, development, validation and monitoring standards to ensure that locally developed models adhere, as far as possible, to consistent global standards. These permit specific variances in model approach, depending on local
regulatory, legal or data requirements, which are used to determine and predict the risks in these portfolios.
Our models incorporate conservatism where required under regulatory rules. Additional levels of conservatism, varying from region to region, may arise from a methodological choice of ours or from a specific regulatory intervention, depending on the local assessment of the risk factors by us and the regulatory authorities. Regulators may additionally impose ‘floor’ values for various metrics where data is scarce.
Our PD models are developed using statistical estimation based on a minimum of five years of historical data. The modelling approach is typically inherently TTC or, where models are developed based on a PIT approach, as in the UK, the model outputs become effectively TTC through the application of buffer or model adjustments as agreed with the PRA.
Our retail EAD models are also developed using at least five years of historical observations and typically adopt one of two approaches:
• for closed-end products without the facility for additional drawdowns, EAD is estimated as the outstanding balance of accounts at the time of observation; or
• EAD for products with the facility for additional drawdowns is estimated as the outstanding balance of accounts at the time of observation plus a CCF applied to the undrawn portion of the facility.
Our approach to LGD estimates has more variation, particularly in respect of the downturn period calculation that they generally include. For instance, UK mortgage models use a regulatory-defined downturn based on a minimum 40% decline in house prices from peak to trough.
In Hong Kong, the downturn LGD for the mortgage model is defined to be the period when historical default rates and property price declines were at their most severe. This was observed in 2003 to 2004, when Hong Kong experienced the Severe Acute Respiratory Syndrome.
In the US, the downturn period is established by identifying the period where default rates were at their most severe and selecting the surrounding 12 months. This was observed between 2008 and 2010.

HSBC HOLDINGS PLC
57
Capital and Risk Managem
ent Pillar 3 Disclosures at 31 December 2015 (continued)
HSBC HOLDIN
GS PLC
57
Table 31: Material retail IRB risk rating systems
Portfolio CRD IV asset class
RWA $bn
Component model
Number of material component models Model description and methodology
Number of years loss data1
Applicable Pillar 1 regulatory thresholds and overlays
UK HSBC residential mortgages
Retail – secured by
mortgages on immovable property non-SME
4.97
PD 1 Statistical model built on internal behavioural data and bureau information, and calibrated to a long-run default rate.
7–10 PD floor of 0.03%
LGD 1 Statistical estimates of loss and probability of possession in combination with the workout process and using the 1990’s recession in benchmarking the downturn LGD.
> 10 LGD floor of 10% at portfolio level
EAD 1 Statistical model based on historical data and uses balance at observation and expected number of months to default.
7–10 EAD must at least be equal to current balance
UK HSBC credit cards
Retail – qualifying
revolving 1.85
PD 1 Statistical model built on internal behavioural data and bureau information, and calibrated to a long-run default rate.
7–10 PD floor of 0.03%
LGD 1 Statistical model based on forecasting the amount of expected future recoveries.
7–10
EAD 1 Statistical model which derives a credit conversion factor to determine the proportion of undrawn limit to be added to the balance at observation.
7–10 EAD must at least be equal to current balance
UK HSBC personal loans
Retail – other non-SME 2.44
PD 1 Statistical model built on internal behavioural data and bureau information, and calibrated to a long-run default rate.
7–10 PD floor of 0.03%
LGD 1 Statistical model based on forecasting the amount of expected future recoveries.
7–10
EAD 1 Rule-based calculation based on current balance which continues to be a conservative estimate for EAD.
7–10 EAD must at least be equal to current balance
UK business banking
Retail – other SME 4.63
PD 1 Statistical model built on internal behavioural data and bureau information, and calibrated to a long-run default rate.
7–10 PD floor of 0.03%
LGD 2 Two sets of models – one for secured and another for unsecured exposures. The secured model uses the value to loan as a key component for estimation while the unsecured model estimates the amount of future recoveries and undrawn portion.
7–10
EAD 1 Statistical model using segmentation according to limit and utilisation and estimation of the undrawn exposure.
7–10 EAD must at least be equal to current balance
Hong Kong HSBC personal residential mortgages2
Retail – secured by
mortgages on immovable property non-SME
5.60
PD 1 Statistical model built on internal behavioural data and bureau information, and calibrated to a long-run default rate.
> 10 PD floor of 0.03%
LGD 1 Statistical model based on estimate of loss incurred over a recovery period derived from historical data with downturn LGD based on the worst observed default rate.
> 10 LGD floor of 10% at portfolio level
EAD 1 Rule-based calculation based on current balance which continues to be a conservative estimate for EAD.
> 10 EAD must at least be equal to current balance
Hong Kong HSBC credit cards
Retail – qualifying
revolving 3.27
PD 1 Statistical model built on internal behavioural data and bureau information, and calibrated to a long-run default rate.
> 10 PD floor of 0.03%
LGD 1 Statistical model based on forecasting the amount of expected future recoveries.
> 10
EAD 1 Statistical model which derives a credit conversion factor to determine the proportion of undrawn limit to be added to the balance at observation.
> 10 EAD must at least be equal to current balance

HSBC HOLDINGS PLC
58
HSBC HOLDIN
GS PLC
58
Capital and Risk Managem
ent Pillar 3 Disclosuresat 31 December 2015
(continued)
Portfolio CRD IV asset class
RWA $bn
Component model
Number of material component models Model description and methodology
Number of years loss data1
Applicable Pillar 1 regulatory thresholds and overlays
Hong Kong HSBC personal instalment loans
Retail – other non-SME
1.34
PD 1 Statistical model built on internal behavioural data and bureau information, and calibrated to a long-run default rate.
> 10 PD floor of 0.03%
LGD 1 Statistical model based on forecasting the amount of expected future recoveries.
> 10
EAD 1 Rule-based calculation based on current balance which continues to be a conservative estimate for EAD.
> 10 EAD must at least be equal to current balance
US Consumer Lending first lien3
Retail – secured by mortgages on immovable property non-SME
21.24
PD 1 Statistical model built on internal behavioural data and bureau information, and calibrated to a long-run default rate.
> 10 PD floor of 0.03%
LGD 1 Statistical model based on identifying the main risk drivers of loss and recovery and grouping them into homogeneous pools. Downturn LGD is derived based on the peak default rate observed while additional assumptions and estimations are done on incomplete workouts.
> 10 LGD floor of 10% at portfolio level10% uplift on the total LGD for first lien portfolio LGD floor at the segment level based on the value notified to the PRA and ranges from circa 60% to circa 98%
EAD 1 Rule-based calculation based on current balance which continues to be a conservative estimate for EAD.
> 10 EAD must at least be equal to current balance
US Mortgage Services first lien3
Retail – secured by mortgages on immovable property non-SME
8.34
PD 1 Statistical model built on internal behavioural data and bureau information, and calibrated to a long-run default rate.
> 10 PD floor of 0.03%
LGD 1 Statistical model based on identifying the main risk drivers of loss and recovery and grouping them into homogeneous pools. Downturn LGD is derived based on the peak default rate observed while additional assumptions and estimations are done on incomplete workouts.
> 10 LGD floor of 10% at portfolio level10% uplift on the total LGD for first lien portfolio LGD floor at the segment level based on the value notified to the PRA and ranges from circa 60% to circa 98%
EAD 1 Rule-based calculation based on current balance which continues to be a conservative estimate for EAD.
> 10 EAD must at least be equal to current balance
US HSBC Mortgage Corporation first lien3
Retail – secured by mortgages on immovable property non-SME
8.61
PD 1 Statistical model built on internal behavioural data and bureau information, and calibrated to a long-run default rate.
> 10 PD floor of 0.03%Uplift in RWA and EL based on comparison of outputs between existing and new models
LGD 1 Statistical model based on identifying the main risk drivers of loss and recovery and grouping them into homogeneous pools. Downturn LGD is derived based on the peak default rate observed while additional assumptions and estimations are done on incomplete workouts.
> 10 LGD floor of 10% at portfolio levelUplift in RWA and EL based on comparison of outputs between existing and new models
EAD 1 Rule-based calculation based on current balance which continues to be a conservative estimate for EAD.
> 10 EAD must at least be equal to current balance Uplift in RWA and EL based on comparison of outputs between existing and new models
1 Defined as the number of years from the data period used for model development up to the present. 2 The Hong Kong Monetary Authority introduced a 15% risk weight floor for all residential mortgages granted after 22 February 2013 in Hong Kong. In 2015, it extended the floor to residential mortgages granted on or before
22 February 2013 with a phased implementation (10% by June 2015 increasing to 15% by June 2016). This risk weight floor is also reflected in Group reported numbers. 3 In US mortgage business, first lien is a primary claim on a property which takes precedence over all subsequent claims and will be paid first from the proceeds in case of the property’s foreclosure sale.

Capital and Risk Management Pillar 3 Disclosures at 31 December 2015 (continued)
HSBC HOLDINGS PLC
59
The approval of the models that are currently used for the CML portfolios was subject to certain conditions with regard to LGD floors and regular assessment of the capital difference in applying the US instead of the PRA rules, mainly on the definition of default used for modelling.
For the HSBC Mortgage Corporation first lien portfolio, we continue to include agreed adjustments to the current model outputs based on a new set of models which are yet to be approved by the PRA.
Table 32 sets out the exposure-weighted average PDs and LGDs by retail exposure class. An analysis by country is provided in Appendix IV. Table 33 provides the exposure value, exposure-weighted average PDs and LGDs, RWA density and RWAs for our most material residential mortgages risk rating systems.
In table 33, the regulatory LGD and PD floors of 10% and 0.03%, respectively, are included. In this table, the UK HSBC residential mortgages include the HSBC branded portfolios of HSBC Bank plc but not those of First Direct. Hong Kong residential mortgages consist of HSBC and Hang Seng portfolios, and the US residential mortgages cover the CML and the US HSBC Mortgage Corporation portfolios. The PD and LGD values in the US residential mortgages are stated
before the quantitative adjustment due to the existing deficiencies of the current US HSBC Mortgage Corporation models. This quantitative adjustment is applied at the total portfolio RWA and EL levels.
Within table 33, the RWAs and other metrics have decreased in 2015 due to the increasing house prices in most regions of the UK and the continued sale of assets and improving house prices in the US. The extension of the risk-weight floor to all residential mortgages in June 2015, not just those granted after 22 February 2013, increased the RWAs and RWA density in Hong Kong. A floor of 10% was implemented in June 2015 for those granted on or before 22 February 2013. This will increase to 15% in June 2016.
Tables 34 and 35 show IRB exposures by exposure sub-class and portfolio quality bands: at Group level by internal PD band and by geographical region using a composite EL measure, respectively.
In table 34, band seven has lower RWAs because, as assets approach and go into default, our capital requirements are increasingly reflected in an EL deduction from capital, rather than a direct RWA impact.
Table 32: Retail IRB portfolio analysis1 North Europe Asia America Total % % % %At 31 December 2015 Exposure-weighted average PD
Retail – secured by mortgages on immovable property non-SME 1.43 0.99 9.66 2.78Retail – secured by mortgages on immovable property SME 8.06 0.99 2.21 5.91Retail – qualifying revolving 1.17 1.11 1.62 1.17Retail – other SME 9.90 0.13 3.40 9.62Retail – other non-SME 1.93 1.85 6.39 2.44
Exposure-weighted average LGD Retail – secured by mortgages on immovable property non-SME 12.5 11.4 45.3 18.1Retail – secured by mortgages on immovable property SME 19.0 11.1 30.7 18.6Retail – qualifying revolving 85.2 100.1 90.8 92.2Retail – other SME 54.1 10.8 65.1 54.1Retail – other non-SME 23.8 21.1 71.8 29.1
At 31 December 2014 Exposure-weighted average PD
Retail – secured by mortgages on immovable property non-SME 0.98 1.00 11.54 3.06Retail – secured by mortgages on immovable property SME 8.81 0.76 – 7.06Retail – qualifying revolving 1.41 1.09 1.74 1.30Retail – other SME 10.09 0.12 3.75 9.73Retail – other non-SME 1.90 1.76 7.54 2.68
Exposure-weighted average LGD Retail – secured by mortgages on immovable property non-SME 13.5 12.1 51.5 20.5Retail – secured by mortgages on immovable property SME 19.0 11.1 – 17.5Retail – qualifying revolving 84.5 100.2 90.1 91.3Retail – other SME 48.7 9.1 61.0 49.0Retail – other non-SME 22.0 22.8 77.7 30.0
1 The MENA and Latin America regions are not included in this table as retail exposures in these regions are calculated under the standardised approach.

Capital and Risk Management Pillar 3 Disclosures at 31 December 2015 (continued)
HSBC HOLDINGS PLC
60
Table 33: Retail IRB exposures secured by mortgages on immovable property (non-SME) Exposure Average Average RWA value PD LGD density RWAs $bn % % % $bnAt 31 December 2015 Total Retail IRB exposures secured by mortgages on immovable
property (non-SME) 275.4 2.78 18.1 22 60.0 Of which: – US first lien residential mortgages 34.2 12.66 52.0 112 38.2– UK HSBC residential mortgages 94.0 1.49 11.1 5 5.0– Hong Kong residential mortgages 60.4 0.76 10.0 15 9.0
At 31 December 2014 Total Retail IRB exposures secured by mortgages on immovable
property (non-SME) 288.9 3.06 20.5 25 71.6 Of which: – US first lien residential mortgages 37.3 14.83 56.4 136 50.9– UK HSBC residential mortgages 98.3 0.93 15.5 6 5.9– Hong Kong residential mortgages 56.3 0.78 10.1 10 5.8
At 31 December 2013 Total Retail IRB exposures secured on real estate property 310.7 4.02 20.1 34 105.4
Of which: – US first lien residential mortgages 42.8 18.13 59.6 176 75.3– UK HSBC residential mortgages 104.4 1.11 16.4 7 7.3– Hong Kong residential mortgages 52.1 0.74 10.1 7 3.8

Capital and Risk Management Pillar 3 Disclosures at 31 December 2015 (continued)
HSBC HOLDINGS PLC
61
Table 34: Retail IRB exposure – by internal PD band
PD range Exposure
value
Average exposure
value2
Undrawn commit-
ments Average
PD1Average
LGD1
RWA
density1
RWAs % $bn $bn $bn % % % $bnAt 31 December 2015 Secured by mortgages on immovable
property
SME Band 1 0.000 to 0.483 0.6 0.6 – 0.15 12.6 – –Band 2 0.484 to 1.022 0.4 0.5 – 0.76 19.6 25 0.1 Band 3 1.023 to 4.914 1.4 1.4 – 2.36 19.8 29 0.4Band 4 4.915 to 8.860 0.2 0.2 – 6.56 21.9 50 0.1 Band 5 8.861 to 15.000 0.1 0.1 – 11.27 27.2 – –Band 6 15.001 to 50.000 0.1 0.1 – 24.94 20.9 – –Band 7 50.001 to 100.000 0.1 0.1 – 100.00 18.4 – –
2.9 3.0 – 5.91 18.6 21 0.6
Secured by mortgages on immovable property
Non-SME Band 1 0.000 to 0.483 215.5 218.9 16.2 0.11 14.5 7 15.0 Band 2 0.484 to 1.022 22.4 24.1 0.8 0.67 23.1 28 6.3 Band 3 1.023 to 4.914 22.4 23.1 0.3 1.95 32.5 76 17.1Band 4 4.915 to 8.860 5.8 6.1 – 5.77 36.6 153 8.9 Band 5 8.861 to 15.000 1.1 1.5 0.1 11.94 29.4 200 2.2 Band 6 15.001 to 50.000 2.3 2.9 – 24.40 49.0 330 7.6 Band 7 50.001 to 100.000 5.9 6.4 – 97.97 43.1 49 2.9
275.4 283.0 17.4 2.78 18.1 22 60.0
Qualifying revolving retail exposures Band 1 0.000 to 0.483 49.1 48.7 85.2 0.12 92.9 7 3.2 Band 2 0.484 to 1.022 7.1 6.8 6.7 0.71 92.3 28 2.0 Band 3 1.023 to 4.914 9.1 9.0 5.7 2.23 90.0 64 5.8Band 4 4.915 to 8.860 1.3 1.3 0.5 6.62 89.2 131 1.7Band 5 8.861 to 15.000 0.5 0.4 0.1 11.09 91.1 180 0.9 Band 6 15.001 to 50.000 0.5 0.5 0.1 23.56 91.1 280 1.4Band 7 50.001 to 100.000 0.2 0.3 0.1 89.41 67.6 150 0.3
67.8 67.0 98.4 1.17 92.2 23 15.3
Other SME Band 1 0.000 to 0.483 1.6 1.7 1.1 0.29 64.7 31 0.5Band 2 0.484 to 1.022 2.1 2.2 1.0 0.74 52.6 33 0.7 Band 3 1.023 to 4.914 5.6 6.0 1.5 2.58 53.6 55 3.1 Band 4 4.915 to 8.860 1.2 1.4 0.2 6.65 50.0 67 0.8 Band 5 8.861 to 15.000 0.5 0.5 0.2 10.89 59.2 80 0.4 Band 6 15.001 to 50.000 0.3 0.3 0.1 25.79 60.6 100 0.3 Band 7 50.001 to 100.000 0.8 0.8 0.1 99.47 39.8 – –
12.1 12.9 4.2 9.62 54.1 48 5.8
Other non-SME Band 1 0.000 to 0.483 26.5 26.4 11.5 0.18 26.7 12 3.2 Band 2 0.484 to 1.022 6.7 6.7 1.3 0.66 30.5 27 1.8 Band 3 1.023 to 4.914 10.7 10.7 1.4 1.91 27.4 40 4.3Band 4 4.915 to 8.860 0.9 0.9 – 7.05 53.3 89 0.8 Band 5 8.861 to 15.000 0.5 0.6 – 11.88 64.8 120 0.6 Band 6 15.001 to 50.000 0.3 0.5 – 27.58 67.8 200 0.6 Band 7 50.001 to 100.000 0.7 0.7 – 96.40 57.7 29 0.2
46.3 46.5 14.2 2.44 29.1 25 11.5
Total retail Band 1 0.000 to 0.483 293.3 296.3 114.0 0.12 29.0 7 21.9 Band 2 0.484 to 1.022 38.7 40.3 9.8 0.68 38.5 28 10.9 Band 3 1.023 to 4.914 49.2 50.2 8.9 2.07 44.1 62 30.7 Band 4 4.915 to 8.860 9.4 9.9 0.7 6.14 46.8 131 12.3 Band 5 8.861 to 15.000 2.7 3.1 0.4 11.58 51.2 152 4.1 Band 6 15.001 to 50.000 3.5 4.3 0.2 24.72 57.2 283 9.9 Band 7 50.001 to 100.000 7.7 8.3 0.2 97.74 44.5 44 3.4
404.5 412.4 134.2 2.70 32.9 23 93.2

Capital and Risk Management Pillar 3 Disclosures at 31 December 2015 (continued)
HSBC HOLDINGS PLC
62
PD range
Exposurevalue
Average PD1
Average LGD1
RWA density1
RWAs
% $bn % % % $bnAt 31 December 2014 Secured by mortgages on immovable property SME Band 1 0.000 to 0.483 0.5 0.10 11.9 0 0.0 Band 2 0.484 to 1.022 0.6 0.80 16.8 17 0.1 Band 3 1.023 to 4.914 1.5 2.45 18.3 20 0.3 Band 4 4.915 to 8.860 0.2 6.94 23.0 50 0.1 Band 5 8.861 to 15.000 0.1 11.25 26.4 0 0.0 Band 6 15.001 to 50.000 0.1 25.01 18.8 100 0.1 Band 7 50.001 to 100.000 0.1 100.00 16.8 0 0.0
3.1 7.06 17.5 21 0.6
Secured by mortgages on immovable property Non-SME Band 1 0.000 to 0.483 219.7 0.12 15.2 6 12.1 Band 2 0.484 to 1.022 27.2 0.69 27.5 31 8.5 Band 3 1.023 to 4.914 24.1 2.01 36.2 82 19.8 Band 4 4.915 to 8.860 5.8 5.89 52.0 221 12.8 Band 5 8.861 to 15.000 2.2 12.31 36.7 200 4.4 Band 6 15.001 to 50.000 3.2 23.72 57.7 378 12.1 Band 7 50.001 to 100.000 6.7 97.17 59.4 28 1.9
288.9 3.06 20.5 25 71.6
Qualifying revolving retail exposures Band 1 0.000 to 0.483 47.8 0.12 91.9 6 3.1 Band 2 0.484 to 1.022 6.6 0.71 91.3 29 1.9 Band 3 1.023 to 4.914 9.1 2.26 89.8 65 5.9 Band 4 4.915 to 8.860 1.4 6.64 87.8 136 1.9 Band 5 8.861 to 15.000 0.5 11.06 89.1 200 1.0 Band 6 15.001 to 50.000 0.5 24.44 90.3 260 1.3 Band 7 50.001 to 100.000 0.3 89.52 64.5 67 0.2
66.2 1.30 91.3 23 15.3
Other SME Band 1 0.000 to 0.483 1.8 0.29 57.1 17 0.3 Band 2 0.484 to 1.022 2.3 0.74 46.0 30 0.7 Band 3 1.023 to 4.914 6.3 2.56 49.4 52 3.3 Band 4 4.915 to 8.860 1.5 6.68 45.7 60 0.9 Band 5 8.861 to 15.000 0.6 11.00 52.7 67 0.4 Band 6 15.001 to 50.000 0.5 24.99 54.1 100 0.5 Band 7 50.001 to 100.000 0.9 99.27 37.9 11 0.1
13.9 9.73 49.0 45 6.2
Other non-SME Band 1 0.000 to 0.483 27.0 0.19 25.7 11 3.0 Band 2 0.484 to 1.022 6.3 0.71 33.3 30 1.9 Band 3 1.023 to 4.914 11.3 1.98 30.1 42 4.7 Band 4 4.915 to 8.860 0.9 7.24 60.6 100 0.9 Band 5 8.861 to 15.000 0.5 12.25 71.2 160 0.8 Band 6 15.001 to 50.000 0.6 28.20 63.4 150 0.9 Band 7 50.001 to 100.000 0.7 95.81 66.5 29 0.2
47.3 2.68 30.0 26 12.4
Total retail Band 1 0.000 to 0.483 296.8 0.13 28.8 6 18.5 Band 2 0.484 to 1.022 43.0 0.70 39.0 30 13.1 Band 3 1.023 to 4.914 52.3 2.13 45.2 65 34.0 Band 4 4.915 to 8.860 9.8 6.27 56.2 169 16.6 Band 5 8.861 to 15.000 3.9 11.91 51.0 169 6.6 Band 6 15.001 to 50.000 4.9 24.47 60.7 304 14.9 Band 7 50.001 to 100.000 8.7 97.05 57.3 28 2.4
419.4 2.99 33.7 25 106.1 1 Average PD, average LGD and RWA density percentages represent exposure-weighted averages. 2 Average exposures are calculated by aggregating exposure value of the last five quarters and dividing by five to get the average.

Capital and Risk Management Pillar 3 Disclosures at 31 December 2015 (continued)
HSBC HOLDINGS PLC
63
Retail exposures by internal PD band
2015
2014
Key points • The general decrease in Retail bands is mainly driven by foreign exchange effects. • Continued non-core portfolio run-off and disposals in the US CML portfolio improved the quality of the residual portfolio.
The possibility of variations between jurisdictions’ definitions underlying retail PD and LGD diminishes the usefulness of these measures as comparators for the purposes of global retail portfolio management. To address this shortcoming, we maintain an EL scale for retail business, combining
obligor and facility/product risk factors in a composite measure of PD and LGD. This scale, summarised in table 35, enables the diverse risk profiles of retail portfolios across the Group to be assessed using a common denominator instead of their disparate PD and LGD measures.
0
25
50
75
CRR Band 1 CRR Band 2 CRR Band 3 CRR Band 4 CRR Band 5 CRR Band 6 CRR Band 7
$bn
Secured by mortgages on immovable property SME
Secured by mortgages on immovable property non-SME
Qualifying revolving retail exposures
Other SME
Other non-SME
215.5
0
25
50
75
CRR Band 1 CRR Band 2 CRR Band 3 CRR Band 4 CRR Band 5 CRR Band 6 CRR Band 7
$bn
Secured by mortgages on immovable property SME
Secured by mortgages on immovable property non-SME
Qualifying revolving retail exposures
Other SME
Other non-SME
219.7

Capital and Risk Management Pillar 3 Disclosures at 31 December 2015 (continued)
HSBC HOLDINGS PLC
64
Table 35: Retail IRB exposure – by region1 Exposure value
Europe Asia North
America Total
exposure $bn $bn $bn $bnSecured by mortgages on immovable property SME Expected loss band
– less than 1% 1.5 0.6 0.2 2.3– greater than or equal to 1% and less than 5% 0.4 – 0.1 0.5– greater than or equal to 5% and less than 10% – – – –– greater than or equal to 10% and less than 20% – – – –– greater than or equal to 20% and less than 40% – – – –– greater than or equal to 40% or exposures in default 0.1 – – 0.1
2.0 0.6 0.3 2.9Secured by mortgages on immovable property non-SME Expected loss band
– less than 1% 134.3 88.1 34.7 257.1– greater than or equal to 1% and less than 5% 0.7 0.2 8.6 9.5– greater than or equal to 5% and less than 10% 0.1 – 1.2 1.3– greater than or equal to 10% and less than 20% 0.2 – 1.1 1.3– greater than or equal to 20% and less than 40% – – 0.5 0.5– greater than or equal to 40% or exposures in default 1.4 0.3 4.0 5.7
136.7 88.6 50.1 275.4Qualifying revolving retail exposures Expected loss band
– less than 1% 28.4 26.2 3.2 57.8– greater than or equal to 1% and less than 5% 3.9 3.5 0.7 8.1– greater than or equal to 5% and less than 10% 0.4 0.5 0.1 1.0– greater than or equal to 10% and less than 20% 0.2 0.3 – 0.5– greater than or equal to 20% and less than 40% 0.1 0.1 – 0.2– greater than or equal to 40% or exposures in default 0.2 – – 0.2
33.2 30.6 4.0 67.8Other SME Expected loss band
– less than 1% 5.3 0.1 0.3 5.7– greater than or equal to 1% and less than 5% 4.7 – 0.1 4.8– greater than or equal to 5% and less than 10% 0.5 – – 0.5– greater than or equal to 10% and less than 20% 0.2 – – 0.2– greater than or equal to 20% and less than 40% 0.1 – – 0.1– greater than or equal to 40% or exposures in default 0.8 – – 0.8
11.6 0.1 0.4 12.1Other non-SME Expected loss band
– less than 1% 32.6 5.8 3.2 41.6– greater than or equal to 1% and less than 5% 1.2 0.5 1.4 3.1– greater than or equal to 5% and less than 10% 0.1 0.1 0.3 0.5– greater than or equal to 10% and less than 20% – – 0.3 0.3– greater than or equal to 20% and less than 40% – – 0.1 0.1– greater than or equal to 40% or exposures in default 0.4 0.1 0.2 0.7
34.3 6.5 5.5 46.3Total retail Expected loss band
– less than 1% 202.1 120.8 41.6 364.5– greater than or equal to 1% and less than 5% 10.9 4.2 10.9 26.0– greater than or equal to 5% and less than 10% 1.1 0.6 1.6 3.3– greater than or equal to 10% and less than 20% 0.6 0.3 1.4 2.3– greater than or equal to 20% and less than 40% 0.2 0.1 0.6 0.9– greater than or equal to 40% or exposures in default 2.9 0.4 4.2 7.5
At 31 December 2015 217.8 126.4 60.3 404.5

Capital and Risk Management Pillar 3 Disclosures at 31 December 2015 (continued)
HSBC HOLDINGS PLC
65
Exposure value
Europe Asia North
America Total
exposure $bn $bn $bn $bnSecured by mortgages on immovable property SME Expected loss band
– less than 1% 1.8 0.7 – 2.5– greater than or equal to 1% and less than 5% 0.5 – – 0.5– greater than or equal to 5% and less than 10% – – – –– greater than or equal to 10% and less than 20% – – – –– greater than or equal to 20% and less than 40% – – – –– greater than or equal to 40% or exposures in default 0.1 – – 0.1
2.4 0.7 – 3.1Secured by mortgages on immovable property non-SME Expected loss band
– less than 1% 142.2 87.6 35.9 265.7– greater than or equal to 1% and less than 5% 0.7 0.2 10.7 11.6– greater than or equal to 5% and less than 10% 0.2 – 1.9 2.1– greater than or equal to 10% and less than 20% 0.1 – 2.0 2.1– greater than or equal to 20% and less than 40% – – 0.7 0.7– greater than or equal to 40% or exposures in default 0.9 0.4 5.4 6.7
144.1 88.2 56.6 288.9Qualifying revolving retail exposures Expected loss band
– less than 1% 29.4 23.4 3.2 56.0– greater than or equal to 1% and less than 5% 4.4 3.1 0.7 8.2– greater than or equal to 5% and less than 10% 0.6 0.4 0.1 1.1– greater than or equal to 10% and less than 20% 0.2 0.3 – 0.5– greater than or equal to 20% and less than 40% 0.1 0.1 – 0.2– greater than or equal to 40% or exposures in default 0.2 – – 0.2
34.9 27.3 4.0 66.2Other SME Expected loss band
– less than 1% 6.3 0.1 0.4 6.8– greater than or equal to 1% and less than 5% 5.1 – 0.2 5.3– greater than or equal to 5% and less than 10% 0.6 – – 0.6– greater than or equal to 10% and less than 20% 0.2 – – 0.2– greater than or equal to 20% and less than 40% 0.1 – – 0.1– greater than or equal to 40% or exposures in default 0.9 – – 0.9
13.2 0.1 0.6 13.9Other non-SME Expected loss band
– less than 1% 32.6 5.4 3.9 41.9– greater than or equal to 1% and less than 5% 1.5 0.5 1.6 3.6– greater than or equal to 5% and less than 10% 0.2 0.1 0.3 0.6– greater than or equal to 10% and less than 20% – – 0.4 0.4– greater than or equal to 20% and less than 40% – – 0.2 0.2– greater than or equal to 40% or exposures in default 0.3 – 0.3 0.6
34.6 6.0 6.7 47.3Total retail Expected loss band
– less than 1% 212.3 117.2 43.4 372.9– greater than or equal to 1% and less than 5% 12.2 3.8 13.2 29.2– greater than or equal to 5% and less than 10% 1.6 0.5 2.3 4.4– greater than or equal to 10% and less than 20% 0.5 0.3 2.4 3.2– greater than or equal to 20% and less than 40% 0.2 0.1 0.9 1.2– greater than or equal to 40% or exposures in default 2.4 0.4 5.7 8.5
At 31 December 2014 229.2 122.3 67.9 419.4
1 The MENA and Latin America regions are not included in this table as retail exposures in these regions are calculated under the standardised approach.

Capital and Risk Management Pillar 3 Disclosures at 31 December 2015 (continued)
HSBC HOLDINGS PLC
66
Model performance
Model validation within HSBC is subject to global internal standards. All material models whose outputs are used in calculations of IRB capital requirements fall under this governance framework. These arrangements are designed to support a comprehensive quantitative and qualitative process within a cycle of model monitoring and validation that includes:
• The investigation of model stability;
• model performance measured through testing the model’s outputs against actual outcomes; and
• model use within the business, e.g. user input data quality, override activity and the assessment of results from key controls around the usage of the rating system as a whole within the overall credit process.
The purpose of periodic monitoring and validation is therefore:
• to determine that the model continues to produce accurate outputs, suitable for the intended purposes;
• to confirm that the model remains conceptually sound, that the model design is still appropriate and the assumptions made at development remain valid;
• to ensure that the model is used for its intended purpose and for appropriate exposures only (use test); and
• to prompt corrective actions when the model outputs move away from the expected levels. These actions would include redevelopment of the model and, where appropriate, mitigating capital overlays until implementation of the revised model.
Models are validated against a series of metrics and triggers approved by the governance committee. The metrics and quantitative checks for periodic validation include a review of the data inputs and overall population stability, and an assessment of the model’s discriminatory power or rank order capability, its calibration accuracy and its performance against available benchmarks. The qualitative checks include and reconfirm all elements assessed at design phase, including the model’s conceptual soundness.
The results of periodic in-depth validation must be presented to a model governing committee at least annually. A subset of the key performance metrics is produced and reviewed as part of the ongoing monitoring process.
A large number of models are used within the Group, and data at individual model level is, in most cases, immaterial in the context of the overall Group. We therefore disclose data covering most wholesale models including corporate models on an aggregated basis, and on our individually most material retail models as set out in table 31. The tables below show estimated values at the beginning of the relevant observation periods and subsequent actual experienced values for key regulatory calculation metrics. Values for wholesale models are shown in tables 36 and 37 and for retail models in table 38. The basis of preparation of each table is set out below and in footnotes.
Wholesale credit models
For wholesale portfolios, we disclose the performance of models covering sovereign obligors, banks and corporates. As explained on page 47, we operate global models for the first two of these customer groups. In the case of corporates, we have aggregated data on models covering a customer population ranging from large multinational companies to medium-sized and smaller corporates. The PD analysis for this group includes mainly advanced IRB exposures but also a small element of foundation IRB.
In table 36, the data for sovereigns and banks are based on such a small number of defaults that the comparison of estimated with actual results, even where these are available, is not fully reflective of a model’s performance. To mitigate this characteristic of low-default portfolios, additional analysis is carried out on these models at annual validation. This analysis shows that they discriminate risk well and are appropriately calibrated. The latter reflects both a prudent modelling approach and the conservatism required by regulations. As noted in table 27, sovereign and institutions exposures are subject to an explicit LGD floor applied for the calculation of regulatory capital.
Within table 36, for back-testing purposes, a customer’s CRR/PD is observed at a point in time and then their default or non-default status in the following one-year period is recorded against that PD grade. The PD presentation in table 36 is expressed for all exposure classes on an obligor basis, as model performance is judged on this basis in validation. The LGD and EAD refer to observations for the defaulted population, being the appropriate focus of an assessment of these models’ performance.

Capital and Risk Management Pillar 3 Disclosures at 31 December 2015 (continued)
HSBC HOLDINGS PLC
67
Table 36: IRB models – estimated and actual values (wholesale)1
PD2 LGD3 EAD4 Estimated Actuals Estimated5 Actuals5 Estimated Actuals % % % % % %2015 Sovereigns model6 1.72 1.12 45.00 – 0.07 –Banks model 2.22 – – – – –Corporates models7 1.89 1.26 37.74 21.52 0.60 0.55 2014 Sovereigns model6 2.27 – – – – –Banks model 3.28 – – – – –Corporates models7 1.88 1.16 36.83 16.06 0.47 0.34 2013 Sovereigns model6 4.14 – – – – –Banks model 3.18 0.20 40.01 – 0.06 0.04Corporates models7 2.63 1.20 33.09 18.69 0.54 0.48
1 Data represents an annual view, analysed at 30 September. 2 Estimated PD for all models is average PD calculated on the number of obligors covered by the model(s). 3 Average LGD values are EAD-weighted. 4 Expressed as a percentage of total EAD which includes all defaulted and non-defaulted exposures for the relevant population. 5 For sovereigns and banks models, estimated and actual LGD represents the average LGD for customers that defaulted in the year. For corporates
models, they represent the average LGD for customers that have defaulted and which have been resolved in the period. 6 There was one sovereign default in 2015 (Greece) but no actual loss was incurred. In both 2015 and 2014, the estimated PD excludes inactive
sovereign obligors. 7 Covers the combined populations of the global large corporates model, all regional IRB models for large, medium and small corporates and non-bank
financial institutions. In 2015 and 2014, the estimated and observed PDs were calculated only for unique obligors.
Table 37 expands upon the estimated and actual corporate PD in table 36, as sufficient defaults in this population make analysis at this level meaningful. This analysis is conducted as part of regular validation to ensure that, throughout the entire population, there is a satisfactory degree of conservative performance at all grades. Table 37
is not comparable with table 30c, mainly because table 37 is a distribution of facility limits, rather than exposure value, and for a back-testing population that does not exactly match the exposure class population of tables 28 and 30.
Table 37: IRB models – corporate PD models – performance by CRR grade Corporates1
Facility2 Defaulted3 Estimated PD4 Actual PD5 Diff. in PD % % % % %2015 CRR 0.16 0.00 0.00 0.01 0.00 0.01CRR 1.1 5.72 0.00 0.02 0.00 0.02CRR 1.2 5.25 0.00 0.04 0.00 0.04CRR 2.1 16.48 0.00 0.07 0.00 0.07CRR 2.2 14.17 0.00 0.13 0.01 0.12CRR 3.1 11.92 0.17 0.22 0.15 0.07CRR 3.2 11.00 0.10 0.37 0.30 0.07CRR 3.3 9.35 0.14 0.63 0.47 0.16CRR 4.1 6.52 0.64 0.87 0.97 (0.10)CRR 4.2 5.07 0.45 1.20 1.06 0.14CRR 4.3 4.38 0.62 1.65 1.55 0.10CRR 5.1 3.52 0.99 2.25 1.24 1.01CRR 5.2 2.19 0.61 3.05 1.44 1.61CRR 5.3 2.24 1.74 4.20 1.89 2.31CRR 6.1 0.89 4.66 5.75 5.05 0.70CRR 6.2 0.66 3.58 7.85 6.46 1.39CRR 7.1 0.31 10.79 10.00 7.13 2.87CRR 7.2 0.09 7.27 13.00 9.48 3.52CRR 8.1 0.14 11.33 19.00 11.11 7.89CRR 8.2 0.07 16.97 36.00 23.61 12.39CRR 8.3 0.03 16.66 75.00 17.10 57.90
Total 100.00

Capital and Risk Management Pillar 3 Disclosures at 31 December 2015 (continued)
HSBC HOLDINGS PLC
68
Corporates1
Facility2 Defaulted3 Estimated PD4 Actual PD5 Diff. in PD % % % % %2014 CRR 0.16 0.01 0.00 0.01 0.00 0.01CRR 1.1 6.32 0.00 0.02 0.00 0.02CRR 1.2 6.68 0.00 0.04 0.00 0.04CRR 2.1 16.71 0.01 0.07 0.04 0.03CRR 2.2 13.07 0.00 0.13 0.00 0.13CRR 3.1 10.38 0.06 0.22 0.10 0.12CRR 3.2 12.50 0.11 0.37 0.23 0.14CRR 3.3 6.62 0.25 0.63 0.54 0.09CRR 4.1 10.41 0.28 0.87 0.54 0.33CRR 4.2 4.12 0.79 1.20 0.81 0.39CRR 4.3 3.49 0.83 1.65 0.91 0.74CRR 5.1 2.50 0.53 2.25 0.97 1.28CRR 5.2 2.09 0.54 3.05 1.24 1.81CRR 5.3 1.47 1.74 4.20 2.70 1.50CRR 6.1 0.59 3.02 5.75 4.11 1.64CRR 6.2 0.30 1.12 7.85 4.27 3.58CRR 7.1 0.29 14.59 10.00 11.35 (1.35)CRR 7.2 0.08 2.78 13.00 10.11 2.89CRR 8.1 2.31 1.17 19.00 13.77 5.23CRR 8.2 0.04 32.32 36.00 22.33 13.67CRR 8.3 0.02 4.85 75.00 14.89 60.11
Total 100.00 2013 CRR 0.16 0.00 0.00 0.01 0.00 0.01CRR 1.1 4.83 0.00 0.02 0.00 0.02CRR 1.2 7.47 0.00 0.04 0.00 0.04CRR 2.1 20.85 0.00 0.07 0.00 0.07CRR 2.2 10.38 0.01 0.13 0.03 0.10CRR 3.1 10.79 0.07 0.22 0.16 0.06CRR 3.2 9.49 0.13 0.37 0.22 0.15CRR 3.3 8.33 0.15 0.63 0.27 0.36CRR 4.1 6.40 0.35 0.87 0.48 0.39CRR 4.2 5.84 0.93 1.20 0.80 0.40CRR 4.3 4.22 0.47 1.65 0.67 0.98CRR 5.1 4.18 0.72 2.25 0.76 1.49CRR 5.2 3.07 0.97 3.05 1.03 2.02CRR 5.3 1.85 2.77 4.20 1.89 2.31CRR 6.1 0.98 4.37 5.75 3.28 2.47CRR 6.2 0.46 5.74 7.85 3.77 4.08CRR 7.1 0.44 12.69 10.00 7.95 2.05CRR 7.2 0.15 7.84 13.00 8.68 4.32CRR 8.1 0.15 9.48 19.00 11.44 7.56CRR 8.2 0.07 14.94 36.00 13.70 22.30CRR 8.3 0.05 13.12 75.00 13.64 61.36
Total 100.00
1 Covers the combined populations of the global large corporates model, all regional IRB models for large, medium and small corporates and non-bank financial institutions.
2 Total facility limits for each CRR grade, expressed as a percentage of total limits granted. 3 Defaulted facilities as a percentage of total facility limits at that grade. 4 The estimated PD is before application of the 0.03% regulatory floor. 5 Actual PD is based on the number of defaulted obligors covered by the model(s), without taking into account the size of the facility granted or the
exposures to the obligor. 6 The top band of the wholesale CRR master scale is not available to entities in the corporates exposure class, but restricted to the strongest central
governments, central banks and institutions.

Capital and Risk Management Pillar 3 Disclosures at 31 December 2015 (continued)
HSBC HOLDINGS PLC
69
Retail credit models
In the case of retail portfolios, we do not operate global models due to the different country-level portfolio performance characteristics and loss history. Given the large number of retail IRB models globally, we disclose information on our most material local models.
The actual and estimated values are derived from the model monitoring and calibration processes performed at a local level. Within the discipline of our global modelling policies, our analytics teams adopt back-testing criteria specific to local conditions in order to assess the accuracy of their models.
Table 38 contains the estimated and actual values from the back-testing of our material IRB models covering the HSBC brand portfolios in the UK, the HSBC portfolios under the Area Management Office in Hong Kong, and the residential mortgage portfolios in the US.
The PD, LGD and EAD estimated values here were calculated to compare with the reported actual values and have a different basis of preparation to the estimates reported in tables 32 and 33.
Within table 38, for back-testing purposes, a customer’s PD is observed at a point in time and their default or non-default status in the following one-year period is recorded against that PD grade. The PD presentation here is expressed on an obligor count basis consisting of non-defaulted obligors at the time of observation. The LGD and EAD refer to observations for the defaulted population, being the appropriate focus of an assessment of these models’ performance. The LGD values represent the amount of loss as a percentage of EAD and are calculated based on defaulted accounts that were fully resolved or have completed the modelled recovery outcome period at the reporting date. The EAD values of the defaulted exposures are presented as a percentage of the total EAD which includes all defaulted and non-defaulted exposures for the relevant population. The regulatory PD and LGD floors of 0.03% and 10%, respectively, are applied during final capital calculation and hence are not reflected in the estimates below.
The UK estimated values in table 38 are based on model outputs including required regulatory downturn adjustments.
In conducting the back-testing, our UK HSBC residential mortgage LGD model uses a recovery outcome period of 24 months starting at the date of default. The significant proportion of defaulted population, which has not reached a fully resolved outcome at the reporting date, contributed to the low actual LGD while the estimated LGD increased as a result of the required downturn adjustments. Overall, UK estimates in table 38 remain conservative and higher than calculated actual values.
The Hong Kong estimated PD and LGD values in table 38 include required stressed factors to reflect downturn conditions, especially in the case of the residential mortgage model. The LGD model for our Hong Kong HSBC residential mortgage portfolio uses a recovery outcome period of 24 months starting at the date of default. The estimates for our Hong Kong HSBC residential mortgage LGD remain higher than the calculated actual values but significantly below the 10% regulatory floor. The Hong Kong credit card EAD model currently underestimates exposure values at the point of default; however, this is mitigated by a temporary adjustment to RWAs. An updated model is expected to be implemented by the end of 2016.
The US estimates in table 38 include downturn adjustments and model overlays agreed with the PRA. The LGD models for our Consumer Lending and Mortgage Services portfolios use a recovery outcome period of 30 months, and for HSBC Mortgage Corporation portfolio 36 months, reflecting the longer recovery process due to foreclosure moratoria.
The LGD estimates for our Consumer Lending and Mortgage Services portfolios remained stable in 2015; however, actual LGD values are decreasing due to the continuing sale of assets and improving house prices in the US.
For the HSBC Mortgage Corporation portfolio, we report the estimates from the current models whilst we await approval from the PRA for the new models and continue to make the agreed quantitative adjustment to the amount of capital we hold against this portfolio to reflect the underperformance of the current models. The quantitative adjustment is performed at the portfolio RWA and EL levels and hence is not reflected in table 38.

Capital and Risk Management Pillar 3 Disclosures at 31 December 2015 (continued)
HSBC HOLDINGS PLC
70
Table 38: IRB models – estimated and actual values (retail) PD LGD EAD Estimated Actuals Estimated Actuals Estimated Actuals % % % % % %2015 UK
HSBC residential mortgage 0.45 0.22 16.43 3.54 0.17 0.17HSBC credit card 1.06 0.86 91.54 88.42 1.23 1.19HSBC personal loans 1.93 1.23 82.10 78.46 1.18 1.13Business Banking (Retail SME) 2.26 2.21 76.06 71.78 1.57 1.47
Hong Kong HSBC personal residential mortgage 0.79 0.03 1.90 0.03 0.04 0.03HSBC credit card 0.67 0.32 90.40 81.75 0.52 0.58HSBC personal instalment loans 2.40 2.02 89.43 69.59 1.69 1.51
US Consumer Lending real estate first lien 5.92 5.47 75.98 51.60 5.37 5.31Mortgage Services real estate first lien 6.96 5.96 69.59 54.09 7.97 7.88HSBC Mortgage Corporation first lien 4.66 2.08 29.63 37.19 0.70 0.69
2014 UK
HSBC residential mortgage 0.50 0.31 15.82 4.68 0.24 0.23HSBC credit card 1.37 1.07 91.11 86.30 1.83 1.78HSBC personal loans 2.28 1.57 81.56 80.45 1.52 1.46Business Banking (Retail SME) 2.83 2.57 73.04 68.17 2.00 1.88
Hong Kong HSBC personal residential mortgage 0.72 0.04 1.26 0.35 0.03 0.03HSBC credit card 0.62 0.32 92.91 88.13 0.55 0.59HSBC personal instalment loans 2.37 2.04 89.69 87.66 1.77 1.63
US Consumer Lending real estate first lien 7.31 7.72 77.16 60.29 7.83 7.72Mortgage Services real estate first lien 9.43 8.12 71.40 60.17 7.51 7.43HSBC Mortgage Corporation first lien 5.24 2.28 29.63 39.36 1.00 1.00
2013 UK
HSBC residential mortgage 0.55 0.38 17.30 6.40 0.32 0.31HSBC credit card 1.54 1.27 88.10 84.10 1.70 1.67HSBC personal loans 3.57 2.35 85.40 73.00 2.19 2.11Business Banking (Retail SME) 2.39 2.61 78.00 70.00 2.03 1.99
Hong Kong HSBC personal residential mortgage 0.71 0.03 1.84 0.43 0.03 0.03HSBC credit card 0.63 0.33 91.41 84.58 0.56 0.59HSBC personal instalment loans 2.20 1.99 90.07 96.16 1.69 1.55
US Consumer Lending real estate first lien 7.74 8.22 67.13 64.93 7.08 6.72Mortgage Services real estate first lien 10.15 9.68 60.04 62.92 6.12 5.88HSBC Mortgage Corporation first lien 4.64 4.43 49.85 37.17 2.40 2.40

Capital and Risk Management Pillar 3 Disclosures at 31 December 2015 (continued)
HSBC HOLDINGS PLC
71
Past due but not impaired exposures, impaired exposures and credit risk adjustments
Table 39 and 40 analyse past due but not impaired exposures, impaired exposures and impairment allowances and other credit risk provisions on a regulatory consolidation basis. These tables use accounting values. The proportional consolidation of associates is the main difference between the amounts presented here and those on a financial consolidation basis.
Our approach for determining impairment allowances is explained on page 354 of the Annual Report and Accounts 2015, and the Group’s definitions for accounting purposes of ‘past due’ and ‘impaired’ are set out on pages 127 and 128 respectively.
Under the accounting standards currently adopted by HSBC, impairment allowances, value adjustment and credit related provisions for off-balance sheet amounts are treated as specific CRAs.
Table 39: Past due but not impaired exposures, impaired exposures and impairment allowances and other credit risk provisions by counterparty and by geographical region
Europe Asia MENA North
America Latin America Total
$m $m $m $m $m $mPast due but not impaired exposures 1,928 4,925 1,159 5,466 1,252 14,730
– personal 1,152 2,935 329 3,332 790 8,538– corporate and commercial 762 1,948 732 1,868 460 5,770– financial 14 42 98 266 2 422
Impaired exposures 11,209 4,095 1,977 9,135 3,151 29,567– personal 2,533 817 230 8,130 857 12,567– corporate and commercial 6,873 3,267 1,629 1,003 2,285 15,057– financial 1,803 11 118 2 9 1,943
Impairment allowances and other credit risk provisions (3,895) (4,087) (1,643) (2,235) (2,168) (14,028)– personal (948) (735) (267) (1,232) (872) (4,054)– corporate and commercial (2,752) (3,339) (1,182) (971) (1,296) (9,540)– financial (195) (13) (194) (32) – (434)
Table 40: Movement in specific credit risk adjustments by counterparty and by geographical region
Europe Asia MENA North
America Latin America Total
$m $m $m $m $m $mSpecific credit risk adjustments at 1 January 2015 4,430 3,883 1,633 2,764 2,621 15,331Amounts written off (1,295) (595) (336) (662) (1,306) (4,194)
– personal (626) (416) (114) (554) (997) (2,707)– corporate and commercial (657) (179) (222) (106) (309) (1,473)– financial (12) – – (2) – (14)
Recoveries of amounts written off in previous years 388 165 33 76 146 808– personal 340 135 30 57 119 681– corporate and commercial 46 30 3 18 27 124– financial 2 – – 1 – 3
Charge to income statement 734 1,392 336 547 1,450 4,459– personal 263 334 127 157 983 1,864– corporate and commercial 457 1,058 199 397 467 2,578– financial 14 – 10 (7) – 17
Exchange and other movements (362) (758) (23) (490) (743) (2,376)Specific credit risk adjustments at 31 December 2015 3,895 4,087 1,643 2,235 2,168 14,028

Capital and Risk Management Pillar 3 Disclosures at 31 December 2015 (continued)
HSBC HOLDINGS PLC
72
EL and credit risk adjustments
We analyse credit loss experience in order to assess the performance of our risk measurement and control processes, and to inform our understanding of the implications for risk and capital management of dynamic changes occurring in the risk profile of our exposures.
This analysis includes comparison of the EL calculated in the use of IRB risk rating models, which drives part of the regulatory capital calculation, with other reported measures of credit loss within financial statements prepared under IFRSs. These measures include loan impairment allowances, value adjustments and credit related provisions for off-balance sheet amounts, collectively referred to as CRAs. The excess of EL over CRAs is treated as a capital deduction in the composition of regulatory capital.
The disclosures below set out:
• commentary on aspects of the relationship between regulatory EL and CRAs recognised in our financial statements; and
• tables of EL and CRA balances and charges during the period by exposure class (within retail IRB, also by sub-class) and by region.
When comparing EL with measures of credit losses under IFRSs, it is necessary to take into account differences in the definition and scope of each. Below are examples of matters that can give rise to material differences in the way economic, business and methodological drivers are reflected quantitatively in the accounting and regulatory measures of loss.
Tables 41 and 42 set out for IRB credit exposures the EL, CRA balances and actual loss experience reflected in the charges for CRAs.
CRA balances represent management’s best estimate of losses incurred in the loan portfolios at the balance sheet date. Charges for CRAs represent a movement in the CRA balance during the year, reflecting loss events which occurred during the financial year and changes in estimates of losses arising on events which occurred prior to the current year. EL represents the one-year regulatory expected loss accumulated in the book and is calculated at a point in time.
Examples of differences in definition and scope between EL and CRA balances • Under IAS 39 our estimates of loss in impairment allowances
are required to reflect the current circumstances and specific cash flow expectations of a customer. EL is based on modelled estimates and although the estimates may be individually assigned to specific exposures, the statistical nature of these models means that they are influenced by the behaviour of the overall portfolio;
• EL is based on exposure values that incorporate expected future drawings of committed credit lines, while CRAs are recognised in respect of financial assets recognised on the balance sheet and in respect of committed credit lines where a loss is probable;
• EL is generally based on TTC estimates of PD over a one-year future horizon, determined via statistical analysis of historical default experience. CRAs are recognised for losses that have been incurred at the balance sheet date;
• in the majority of cases, EL is based on economic downturn estimates of LGD, while CRAs are measured using estimated future cash flows at the balance sheet date;
• EL incorporates LGD, which may discount recoveries at a different rate from the effective interest rate employed in discounted cash flow analysis for CRAs;
• LGDs typically include all costs associated with recovery, whereas the accounting measurement considers only the costs of obtaining and selling collateral;
• the LGD and EAD used for the EL calculation in the foundation IRB approach is set by regulations and may differ significantly from the accounting assumptions about estimated cash flows used;
• for EL, certain exposures are subject to regulatory minimum thresholds for one or more parameters, whereas credit losses under IFRSs are determined using management’s judgement about estimated future cash flows; and
• in the case of EL, to meet regulatory prudential standards, HSBC’s model philosophy favours the incorporation of conservative estimation to accommodate uncertainty, for instance where modelling portfolios with limited data. Under IFRSs, uncertainty is considered when forming management’s estimates of future cash flows, using balanced and neutral judgement.

Capital and Risk Management Pillar 3 Disclosures at 31 December 2015 (continued)
HSBC HOLDINGS PLC
73
Table 41: IRB expected loss and CRAs – by exposure class1
CRA Charge for Expected loss Balances the year $bn $bn $bnIRB exposure classes Central governments and central banks 0.2 – –Institutions 0.1 – –Corporates 5.5 4.5 1.0Retail 5.5 2.1 0.4
– secured by mortgages on immovable property SME – – –– secured by mortgages on immovable property non-SME 3.5 1.2 –– qualifying revolving retail 0.7 0.2 0.2– other SME 0.7 0.3 –– other non-SME 0.6 0.4 0.2
At 31 December 2015 11.3 6.6 1.4 IRB exposure classes Central governments and central banks 0.3 – –Institutions 0.3 – –Corporates 5.2 4.2 1.1Retail 7.2 3.1 0.2
– secured by mortgages on immovable property SME – – –– secured by mortgages on immovable property non-SME 5.1 1.9 (0.1)– qualifying revolving retail 0.7 0.3 0.1– other SME 0.7 0.4 –– other non-SME 0.7 0.5 0.2
At 31 December 2014 13.0 7.3 1.3 IRB exposure classes Central governments and central banks 0.3 – –Institutions 0.3 0.1 –Corporates 5.8 4.4 1.5Retail 9.3 5.1 1.2
– secured on real estate property 7.2 3.6 0.8– qualifying revolving retail 0.7 0.4 0.3– SMEs 0.9 0.7 –– other retail 0.5 0.4 0.1
At 31 December 2013 15.7 9.6 2.7
1 Excludes securitisation exposures because EL is not calculated for this exposure class.
Table 42: IRB expected loss and CRAs – by region1
CRA Charge for Expected loss Balances the year $bn $bn $bn Europe 4.3 2.9 0.4Asia 2.3 1.3 0.5Middle East and North Africa 0.2 0.3 0.1North America 4.4 2.0 0.4Latin America 0.1 0.1 –
At 31 December 2015 11.3 6.6 1.4 Europe 4.8 3.5 0.7Asia 2.2 1.1 0.4Middle East and North Africa 0.2 0.1 –North America 5.7 2.6 0.2Latin America 0.1 – –
At 31 December 2014 13.0 7.3 1.3
1 Excludes securitisation exposures because EL is not calculated for this exposure class.
Key points • EL and impairments decreased in North America, primarily due to the continued run-off of the US CML retail mortgage portfolio and a lower level
of newly impaired loans as well as overall lower loan balances due to portfolio sales. This was partially offset by some new defaults.

Capital and Risk Management Pillar 3 Disclosures at 31 December 2015 (continued)
HSBC HOLDINGS PLC
74
Risk mitigation
Our approach when granting credit facilities is to do so on the basis of capacity to repay rather than placing primary reliance on credit risk mitigants. Depending on a customer’s standing and the type of product, facilities may be provided unsecured. Mitigation of credit risk is nevertheless a key aspect of effective risk management and, in a diversified financial services organisation such as HSBC, takes many forms.
Our general policy is to promote the use of credit risk mitigation, justified by commercial prudence and good practice as well as capital efficiency. Specifically, detailed policies cover the acceptability, structuring and terms of various types of business with regard to the availability of credit risk mitigation, for example in the form of collateral security. These policies, together with the setting of suitable valuation parameters, are subject to regular review to ensure that they are supported by empirical evidence and continue to fulfil their intended purpose.
Collateral
The most common method of mitigating credit risk is to take collateral. In our retail residential and CRE businesses, a mortgage over the property is usually taken to help secure claims. Physical collateral is also taken in various forms of specialised lending and leasing transactions where income from the physical assets that are financed is also the principal source of facility repayment. In the commercial and industrial sectors, charges are created over business assets such as premises, stock and debtors. Loans to private banking clients may be made against a pledge of eligible marketable securities, cash or real estate. Facilities to SMEs are commonly granted against guarantees given by their owners and/or directors. Guarantees from third parties can arise where the Group extends facilities without the benefit of any alternative form of security, e.g. where it issues a bid or performance bond in favour of a non-customer at the request of another bank.
For credit risk mitigants comprising immovable property the key determinant of concentration at Group level is geographic, which, in the majority of cases, is the same as the reported geographical location of the related exposures. Use of immovable property mitigants for risk management purposes is predominantly in Asia and Europe.
Further information regarding collateral held over CRE and residential property is provided on pages 139 and 147, respectively, of the Annual Report and Accounts 2015.
Financial collateral
In the institutional sector, trading facilities are supported by charges over financial instruments such as cash, debt securities and equities. Financial collateral in the form of marketable securities is used in much of the Group’s derivatives activities and in SFTs such as repos, reverse repos, securities lending and borrowing. Netting is used extensively and is a prominent feature of market standard documentation. Further information regarding collateral held for trading exposures is on page 78.
In the banking book, we provide customers with working capital management products. Some of these products have loans and advances to customers and customer accounts where we have rights of offset and comply with the regulatory requirements for on-balance sheet netting. Under on-balance netting the customer accounts are treated as cash collateral and the effects of this collateral are incorporated in our LGD estimates. For risk management purposes the net amounts of such exposures are subject to limits which are monitored and the relevant customer agreements are subject to review and update, as necessary, to ensure the legal right of offset remains appropriate. At 31 December 2015 in the region of $67bn of customer accounts were treated as cash collateral, mainly in the UK. Other forms of credit risk mitigation
Our GB&M business utilises credit risk mitigation to manage the credit risk of its portfolios, with the goal of reducing concentrations in individual names, sectors or portfolios. The techniques in use include CDS purchases, structured credit notes and securitisation structures. Buying credit protection creates credit exposure against the protection provider, which is monitored as part of the overall credit exposure to them. Where applicable the transaction is entered into directly with a central clearing house counterparty, otherwise our exposure to CDS protection providers is diversified among mainly banking counterparties with strong credit ratings. In our corporate lending we also take guarantees from corporates and Export Credit Agencies. Corporates would normally provide guarantees as part of a parent/subsidiary or common parent relationship and would span a number of credit grades. The Export Credit Agencies will normally be investment grade.
Policy and procedures
Policies and procedures govern the protection of our position from the outset of a customer relationship, for instance in requiring standard terms and conditions or specifically agreed documentation permitting the offset of credit balances against debt obligations, and through controls over the integrity, current valuation and, if necessary, realisation of collateral security.
Valuing collateral
Valuation strategies are established to monitor collateral mitigants to ensure that they will continue to provide the anticipated secure secondary repayment source. Where collateral is subject to high volatility, valuation is frequent; where stable, less so. For market trading activities such as collateralised OTC derivatives and SFTs, we typically carry out daily valuations in support of margining arrangements. In the residential mortgage business, Group policy prescribes re-valuation at intervals of up to three years, or more frequently as the need arises, for example where market conditions are subject to significant change. Residential property collateral values are determined through a combination of professional appraisals, house price indices or statistical analysis.
Local market conditions determine the frequency of valuation for CRE. Re-valuations are sought where, for

Capital and Risk Management Pillar 3 Disclosures at 31 December 2015 (continued)
HSBC HOLDINGS PLC
75
example, as part of the regular credit assessment of the obligor, material concerns arise in relation to the performance of the collateral. CRE re-valuation also occurs commonly in circumstances where an obligor’s credit quality has declined sufficiently to cause concern that the principal payment source may not fully meet the obligation. Where such concerns exist the re-valuation method selected will depend upon the loan to value relationship, the direction in which the local CRE market has moved since the last valuation and, most importantly, the specific characteristics of the underlying CRE which is of concern.
Recognition of risk mitigation under the IRB approach
Within an IRB approach, risk mitigants are considered in two broad categories: first, those which reduce the intrinsic PD of an obligor and therefore operate as determinants of PD; and second, those which affect the estimated recoverability of obligations and require adjustment of LGD or, in certain limited circumstances, EAD.
The first typically include full parental guarantees – where one obligor within a group of companies guarantees another. This is usually factored into the estimate of the latter’s PD, as it is assumed that the guarantor’s performance materially informs the PD of the guaranteed entity. PD estimates are also subject to supplementary methodologies in respect of a ‘sovereign ceiling’, constraining the risk ratings assigned to obligors in countries of higher risk, and where only partial parental support exists. In addition, in certain jurisdictions, certain types of third party guarantee are recognised by substituting the guarantor’s PD for the obligor’s PD.
In the second category, LGD estimates are affected by a wider range of collateral including cash, charges over real estate property, fixed assets, trade goods, receivables and floating charges such as mortgage debentures. Unfunded mitigants, such as third party guarantees, are also taken into consideration in LGD estimates where there is evidence that they reduce loss expectation.
The main types of provider of guarantees are banks, other financial institutions and corporates, the latter typically in support of subsidiaries of their company group. Across HSBC, the nature of such customers and transactions is very diverse and the creditworthiness of guarantors accordingly spans a wide spectrum. The creditworthiness of providers of unfunded credit risk mitigation is taken into
consideration as part of the guarantor’s risk profile when, for example, assessing the risk of other exposures such as direct lending to the guarantor. Internal limits for such contingent exposure are approved in the same way as direct exposures.
EAD and LGD values, in the case of individually assessed exposures, are determined by reference to regionally approved internal risk parameters based on the nature of the exposure. For retail portfolios, credit risk mitigation data is incorporated into the internal risk parameters for exposures and feeds into the calculation of the EL band value summarising both customer delinquency and product or facility risk. Credit and credit risk mitigation data form inputs submitted by all Group offices to centralised databases and processing, including performance of calculations to apply the relevant regulatory rules and approach. A range of collateral recognition approaches are applied to IRB capital treatments:
• unfunded protection, which includes credit derivatives and guarantees, is reflected through adjustment or determination of PD, or LGD. Under the IRB advanced approach, recognition may be through PD (as a significant factor in grade determination) or LGD, or both;
• eligible financial collateral under the IRB advanced approach is taken into account in LGD models. Under the IRB foundation approach, regulatory LGD values are adjusted. The adjustment to LGD is based on the degree to which the exposure value would be adjusted notionally if the financial collateral comprehensive method were applied; and
• for all other types of collateral, including real estate, the LGD for exposures calculated under the IRB advanced approach are calculated by models. For IRB foundation, base regulatory LGDs are adjusted depending on the value and type of the asset taken as collateral relative to the exposure. The types of eligible mitigant recognised under the IRB foundation approach are more limited.
Table 43 sets out, for IRB exposures, the exposure value and the effective value of credit risk mitigation expressed as the exposure value covered by the credit risk mitigant. IRB credit risk mitigation reductions of EAD were immaterial at 31 December 2015.

Capital and Risk Management Pillar 3 Disclosures at 31 December 2015 (continued)
HSBC HOLDINGS PLC
76
Table 43: IRB exposure – credit risk mitigation At 31 December 2015 At 31 December 2014
Exposurevalue covered
by credit derivatives
or guarantees1
Totalexposure
value
Exposure value covered
by credit derivatives
or guarantees1
Totalexposure
value $bn $bn $bn $bnExposures under the IRB advanced approach Central governments and central banks 0.5 327.4 0.3 327.4Institutions 0.4 90.5 0.8 130.4Corporates 86.4 597.3 82.3 625.8Retail 20.3 404.5 21.3 419.4Securitisation positions – 40.9 – 38.3Non-credit obligation assets – 50.2 – 52.5
1,510.8 1,593.8
Exposures under the IRB foundation approach Central governments and central banks – 0.1 – 0.1Institutions – 0.3 – 0.1Corporates2 0.5 43.3 0.5 25.6
1 Figures presented in an ‘obligor basis’. 2 The value of exposures under the IRB foundation approach covered by eligible financial and other collateral was $7.9bn (2014: $0.5bn).
Application of the standardised approach
The standardised approach is applied where exposures do not qualify for use of an IRB approach and/or where an exemption from IRB has been granted. The standardised approach requires banks to use risk assessments prepared by ECAIs or Export Credit Agencies to determine the risk weightings applied to rated counterparties.
ECAI risk assessments are used within the Group as part of the determination of risk weightings for the following classes of exposure:
• central governments and central banks;
• institutions;
• corporates;
• securitisation positions;
• short-term claims on institutions and corporates;
• regional governments and local authorities; and
• multilateral development banks.
We have nominated three ECAIs for this purpose – Moody’s, S&P and Fitch. We have not nominated any Export Credit Agencies.
Data files of external ratings from the nominated ECAIs are matched with customer records in our centralised credit database.
When calculating the risk-weighted value of an exposure using ECAI risk assessments, risk systems identify the customer in question and look up the available ratings in the central database according to the rating selection rules. The systems then apply the prescribed credit quality step mapping to derive from the rating the relevant risk weight.
All other exposure classes are assigned risk weightings as prescribed in the PRA’s Rulebook.
Credit quality step
Moody’s assessments
S&P’s assessments
Fitch’s assessments
1 Aaa to Aa3 AAA to AA– AAA to AA–2 A1 to A3 A+ to A– A+ to A–3 Baa1 to Baa3 BBB+ to BBB– BBB+ to BBB–4 Ba1 to Ba3 BB+ to BB– BB+ to BB–5 B1 to B3 B+ to B– B+ to B–6 Caa1 and below CCC+ and below CCC+ and below
Exposures to, or guaranteed by, central governments and central banks of EEA States are risk-weighted at 0% using the standardised approach, provided they would be eligible under that approach for a 0% risk weighting.
Associates’ exposures are calculated under the standardised approach and, at 31 December 2015, represented approximately 18% (2014: 16%) of Group credit risk RWAs.
Recognition of risk mitigation under the standardised approach
Where credit risk mitigation is available in the form of an eligible guarantee, non-financial collateral, or credit derivatives, the exposure is divided into covered and uncovered portions. The covered portion, which is determined after applying an appropriate ‘haircut’ for currency and maturity mismatches (and for omission of restructuring clauses for credit derivatives, where appropriate) to the amount of the protection provided, attracts the risk weight of the protection provider. The uncovered portion attracts the risk weight of the obligor. For exposures fully or partially covered by eligible financial collateral, the value of the exposure is adjusted under the financial collateral comprehensive method using supervisory volatility adjustments, including those arising from currency mismatch, which are determined by the specific type of collateral (and, in the case of eligible debt securities, their credit quality) and its liquidation period. The adjusted exposure value is subject to the risk weight of the obligor.

Capital and Risk Management Pillar 3 Disclosures at 31 December 2015 (continued)
HSBC HOLDINGS PLC
77
Table 44 sets out the credit risk mitigation for exposures under the standardised approach, expressed as the exposure value covered by the credit risk mitigant, and table 45 sets out the distribution of standardised exposures across credit quality steps. This analysis excludes regional governments or local authorities, short-term claims, securitisation
positions, CIUs and MDBs, as these exposures continue to be immaterial as a percentage of total standardised exposures. Also excluded, because the credit quality step methodology does not apply, are retail, equity, exposures in default and exposures secured by mortgages on immovable property.
Table 44: Standardised exposure – credit risk mitigation 2015 2014
Exposure value covered by eligible financial and other collateral1
Exposure value covered by credit derivatives or guarantees1
Total exposure value
Exposure value covered by eligible financial and other collateral1
Exposure value covered by credit derivatives or guarantees1
Total Exposure value
$bn $bn $bn $bn $bn $bnExposures under the standardised
approach
Central governments and central banks – 0.2 199.9 – – 189.3Institutions – 4.3 38.9 – 2.5 30.1Corporates 14.5 5.0 226.4 14.8 4.8 240.1Retail 0.7 0.1 44.2 0.8 0.1 47.9Secured by mortgages on immovable
property – – 40.3 0.2 – 38.6 Exposures in default – – 4.9 – – 4.7Regional governments or local authorities – – 2.8 – – 1.1Equity – – 7.0 – – 13.2Other2 – 27.6 – – 25.5
At 31 December 592.0 590.5
1 Figures presented on an ‘obligor basis’. 2 This includes the exposure class ‘other items’ with an exposure value of $19.4bn as well as other less material standardised exposure classes not
individually shown above.
Table 45: Standardised exposure – by credit quality step At 31 December 2015 At 31 December 2014
Original exposure1
Exposure value RWAs
Original exposure1
Exposure value
RWAs
$bn $bn $bn $bn $bn $bnCentral governments and central banks Credit quality step 1 138.1 145.5 171.0 177.1 Credit quality step 2 1.4 1.9 0.7 0.8 Credit quality step 3 2.5 2.8 0.6 0.9 Credit quality step 4 0.4 0.1 0.5 0.5 Credit quality step unrated 49.6 49.6 9.9 10.0
192.0 199.9 20.0 182.7 189.3 19.7Institutions Credit quality step 1 1.6 0.7 1.2 0.6 Credit quality step 2 4.7 1.4 2.1 1.1 Credit quality step 5 0.1 0.1 – – Credit quality step unrated 36.8 36.7 28.7 28.4
43.2 38.9 14.7 32.0 30.1 11.2Corporates Credit quality step 1 1.6 0.8 2.3 1.3 Credit quality step 2 6.2 4.2 7.3 4.8 Credit quality step 3 2.7 1.4 2.7 1.6 Credit quality step 4 2.1 1.6 2.7 1.7 Credit quality step 5 1.3 0.8 1.6 1.0 Credit quality step 6 2.8 2.0 3.1 2.3 Credit quality step unrated 330.6 215.6 345.9 227.4
347.3 226.4 210.6 365.6 240.1 224.7
1 Figures presented on an ‘obligor basis’.

Capital and Risk Management Pillar 3 Disclosures at 31 December 2015 (continued)
HSBC HOLDINGS PLC
78
Counterparty credit risk
CCR risk arises for derivatives and SFTs. It is calculated in both the trading and non-trading books, and is the risk that a counterparty may default before settlement of the transaction. An economic loss occurs if the transaction or portfolio of transactions with the counterparty has a positive economic value at the time of default. CCR is generated primarily in our wholesale global businesses.
Three approaches may be used under CRD IV to calculate exposure values for CCR: mark-to-market, standardised and IMM. Exposure values calculated under these approaches are used to determine RWAs. Across the Group, we use the mark-to-market and IMM approaches. Under the mark-to-market approach, the EAD is calculated as current exposure plus regulatory add-ons. We use this approach for all products not covered by our IMM permission. Under the IMM approach, EAD is calculated by multiplying the effective expected positive exposure with a multiplier called ‘alpha’.
Alpha (set to a default value of 1.4) accounts for several portfolio features that increase EL above that indicated by effective expected positive exposure in the event of default:
• co-variance of exposures; • correlation between exposures and default; • level of volatility/correlation that might coincide with
a downturn; • concentration risk; and • model risk.
The effective expected exposure is derived from simulation, pricing and aggregation internal models approved by regulators. These models cover a range of asset classes including interest rate products, foreign exchange products, credit derivatives and equity derivatives.
The IMM model is subject to on-going model validation including monthly model performance monitoring. We also perform quarterly backtesting of the model’s risk measures on a set of hypothetical portfolios as well as the market risk factor predictions. Calibration is performed using a minimum of three years historical data.
The only IMM site is London where approximately 88% of the trade population falls under the IMM approach.
From a risk management perspective, including daily monitoring of credit limit utilisation, products not covered by IMM are subject to conservative asset class add-on tables calculated outside of the IMM framework.
The potential future exposure measures used for CCR management are calibrated to the 95th percentile. The measures consider volatility, trade maturity and the counterparty legal documentation covering netting and collateral.
Limits for CCR exposures are assigned within the overall credit process. The Credit Risk function assigns a limit against each counterparty to cover derivatives exposure which may arise as a result of a counterparty default. The magnitude of this limit will depend on the overall risk
appetite and type of derivatives trading undertaken with the counterparty.
The models and methodologies used in the calculation of CCR are approved by the Markets MOC. Models are subject to ongoing monitoring and validation. Additionally, they are subject to independent review at inception and annually thereafter.
Credit valuation adjustment
CRD IV introduced a regulatory capital charge to cover CVA risk, the risk of adverse moves in the credit valuation adjustments taken for expected credit losses on derivative transactions. Where we have both specific risk VaR approval and internal model method approval for a product, the CVA VaR approach has been used to calculate the CVA capital charge. Where we do not hold both approvals, the standardised approach has been applied. Certain counterparty exposures are exempt from CVA, such as non-financial counterparties and sovereigns.
Collateral arrangements
It is our policy to revalue all traded transactions and associated collateral positions on a daily basis. An independent collateral management function manages the collateral process including pledging and receiving collateral and investigating disputes and non-receipts.
Eligible collateral types are controlled under a policy to ensure price transparency, price stability, liquidity, enforce-ability, independence, reusability and eligibility for regulatory purposes. A valuation ‘haircut’ policy reflects the fact that collateral may fall in value between the date the collateral was called and the date of liquidation or enforcement. At least 96% of collateral held as credit risk mitigation under CSA’s is either cash or liquid government securities.
Credit ratings downgrade
A credit rating downgrade clause in a Master Agreement or a credit rating downgrade threshold clause in a CSA are designed to trigger an action if the credit rating of the affected party falls below a specified level. These actions may include the requirement to pay or increase collateral, the terminationn of transactions by the non-affected party or the assignment of transactions by the affected party.
We control the inclusion of credit ratings downgrade language in a Master Agreement or a CSA by requiring each Group office to obtain the endorsement of the relevant credit authority together with the approval of the Regional Global Markets Chief Operating Officer via a Documentation Approval Committee.
Relevant management information is in place to enable us to identify any additional collateral requirements, where the threshold levels for these are affected by a credit ratings downgrade clause within a collateral agreement.
At 31 December 2015, the potential value of the additional collateral pertaining to International Swaps and Derivatives Association CSA downgrade thresholds that we would need to post with counterparties in the event of a one-notch downgrade of our rating was $0.3bn (2014: $0.5bn) and for a two-notch downgrade was $0.5bn (2014: $1.2bn).

Capital and Risk Management Pillar 3 Disclosures at 31 December 2015 (continued)
HSBC HOLDINGS PLC
79
Counterparty credit risk exposures
The following tables analyse CCR exposures and RWAs.
Table 46: Counterparty credit risk exposure – credit derivative transactions1 2015 2014
Protection
bought Protection
sold Total Protection
bought Protection
sold Total $bn $bn $bn $bn $bn $bnCredit derivative products used for own credit portfolio Credit default swaps 3.5 0.7 4.2 1.9 0.1 2.0
Total notional value 3.5 0.7 4.2 1.9 0.1 2.0
Credit derivative products used for intermediation2 Credit default swaps 222.5 217.7 440.2 263.3 262.5 525.8Total return swaps 11.2 7.7 18.9 7.2 15.2 22.4
Total notional value 233.7 225.4 459.1 270.5 277.7 548.2
Total credit derivative notional value at 31 December 237.2 226.1 463.3 272.4 277.8 550.2
1 This table provides a further breakdown of totals reported on page 396 of the Annual Report and Accounts 2015 on an accounting consolidation basis. 2 This is where we act as an intermediary for our clients, enabling them to take a position in the underlying securities. This does not increase risk for
HSBC.
Table 47: Counterparty credit risk – net derivative credit exposure1 2015 2014 $bn $bnCounterparty credit risk2 Gross total fair values 394.3 595.5Accounting offset arrangements (105.9) (250.5)Total gross derivatives 288.4 345.0Less: netting benefits3 (215.8) (263.4)Netted current credit exposure 72.6 81.6Less: collateral held (43.0) (49.9)Net derivative credit exposure at 31 December 29.6 31.7
1 This table provides a further breakdown of totals reported on page 395 in the Annual Report and Accounts 2015 on an accounting consolidation basis. 2 Excludes add-on for potential future credit exposure. 3 This is the netting benefit available for regulatory capital purposes which is not recognised under accounting rules.
Under IFRSs, netting is only permitted if legal right of set-off exists and the cash flows are intended to be settled on a net basis. Under the PRA’s regulatory rules, however, netting is applied for capital calculations if there is legal certainty and the positions are managed on a net collateralised basis. As a consequence, we recognise greater netting under the PRA’s rules, reflecting the close-
out provisions that would take effect in the event of default of a counterparty rather than just those transactions that are actually settled net in the normal course of business. Table 48 shows how the total OTC derivative regulatory exposures in table 49 are derived from the gross total fair values reported in table 47.

Capital and Risk Management Pillar 3 Disclosures at 31 December 2015 (continued)
HSBC HOLDINGS PLC
80
Table 48: Comparison of derivative accounting balances and counterparty credit risk exposure
Accounting
balances Regulatory exposures
$bn $bnGross total fair values
OTC derivatives 381.3 381.3Spot transactions1 10.3 –Exchange traded derivatives 2.7 2.7Derivatives Held for sale5 – 1.8
394.3 385.8Initial margin posted to central counterparties2 – 8.8Derivatives under the securitisation framework (0.9)Accounting offset arrangements
IFRSs basis (105.9) –Mark-to-market method
Potential future credit exposure – 147.2Legal right of offset3 – (201.2)
IMM method Modelling impact4 – (212.2)
Total derivative exposures at 31 December 2015 288.4 126.6 Gross total fair values
OTC derivatives 578.0 578.0Spot transactions1 13.7 –Exchange traded derivatives 3.8 3.8
595.5 581.8Initial margin posted to central counterparties2 – 9.9Accounting offset arrangements
IFRSs basis (250.5) –Mark-to-market method
Potential future credit exposure – 157.5Legal right of offset3 – (314.3)
IMM method Modelling impact4 – (286.8)
Total derivative exposures at 31 December 2014 345.0 148.1
1 Spot transactions attract a zero risk-weight under CRD IV rules. 2 Under CRD IV rules, in addition to derivatives transacted with CCPs, initial margin posted to CCPs is included in the regulatory exposures when
calculating RWAs. 3 Legal right of offset derivative netting is a component of the $258.8bn derivatives offset in the ‘Maximum exposure to credit risk’ table on page 123 of
the Annual Report and Accounts 2015. 4 The modelling impact for IMM exposures represents the difference between fair value and the EAD (calculated as 1.4 times the Effective Expected
Potential Exposure) resulting from the model; the model incorporates offsets for netting benefits, correlation impacts and collateral as well as simulating the impact of potential market movements.
5 Derivatives in entities held for sale are not reported as derivatives in the balance sheet, however continue to be included in the calculation of regulatory EAD for counterparty credit risk until the point of sale.

Capital and Risk Management Pillar 3 Disclosures at 31 December 2015 (continued)
HSBC HOLDINGS PLC
81
Table 49: Counterparty credit risk exposure – by exposure class, product and method Modelled approaches Non-modelled approaches Total CCR Exposure Exposure Exposure value RWAs value RWAs value RWAs $bn $bn $bn $bn $bn $bnBy exposure class IRB advanced approach 24.4 10.9 104.8 33.8 129.2 44.7
– central governments and central banks 2.0 0.3 11.3 1.0 13.3 1.3– institutions 6.7 2.5 53.7 13.2 60.4 15.7– corporates 15.7 8.1 39.8 19.6 55.5 27.7
IRB foundation approach – – 5.4 2.1 5.4 2.1– corporates – – 5.4 2.1 5.4 2.1
Standardised approach 2.4 – 6.7 4.7 9.1 4.7– central governments and central banks 2.4 – 1.7 – 4.1 –– institutions – – 0.5 0.1 0.5 0.1– corporates – – 4.5 4.6 4.5 4.6
CVA advanced2 – 3.3 – – – 3.3CVA standardised2 – – – 12.2 – 12.2CCP standardised 0.1 – 34.8 2.2 34.9 2.2
At 31 December 2015 26.9 14.2 151.7 55.0 178.6 69.2
By product Derivatives (OTC and Exchange traded derivatives) 26.9 10.9 99.7 32.3 126.6 43.2SFTs – – 45.1 7.0 45.1 7.0Other1 – – 6.9 2.2 6.9 2.2CVA advanced2 – 3.3 – – – 3.3CVA standardised2 – – – 12.2 – 12.2CCP default funds3 – – – 1.3 – 1.3
At 31 December 2015 26.9 14.2 151.7 55.0 178.6 69.2 By exposure class IRB advanced approach 27.1 14.4 107.6 45.3 134.7 59.7
– central governments and central banks 1.5 0.3 7.7 0.8 9.2 1.1– institutions 9.0 4.4 62.8 21.8 71.8 26.2– corporates 16.6 9.7 37.1 22.7 53.7 32.4
IRB foundation approach – – 5.6 2.3 5.6 2.3– corporates – – 5.6 2.3 5.6 2.3
Standardised approach 3.0 – 8.3 4.4 11.3 4.4– central governments and central banks 3.0 – 3.7 – 6.7 –– institutions – – 0.3 0.1 0.3 0.1– corporates – – 4.3 4.3 4.3 4.3
CVA advanced2 – 3.5 – – – 3.5CVA standardised2 – – – 18.0 – 18.0CCP standardised 0.1 – 49.4 2.8 49.5 2.8
At 31 December 2014 30.2 17.9 170.9 72.8 201.1 90.7
By product Derivatives (OTC and Exchange traded derivatives) 30.2 14.4 117.9 42.8 148.1 57.2SFTs – – 44.5 7.7 44.5 7.7Other1 – – 8.5 2.6 8.5 2.6CVA advanced2 – 3.5 – – – 3.5CVA standardised2 – – – 18.0 – 18.0CCP default funds3 – – – 1.7 – 1.7
At 31 December 2014 30.2 17.9 170.9 72.8 201.1 90.7
1 Includes free deliveries not deducted from regulatory capital. 2 The RWA impact due to the CVA capital charge is calculated based on the exposures under the IRB and standardised approaches. No additional
exposures are taken into account. 3 Default fund contributions are cash balances posted to CCP by all members. These cash balances are not included in the total reported exposure.
Key points • Market movements, principally in foreign exchange derivatives, and position reductions as a result of reduced client demand and
portfolio compressions decreased RWAs by $15.3bn. • The reclassification of long dated derivative transactions to the banking book resulted in an RWA decrease of $1.5bn which was offset
by an increase in credit risk RWAs. • In addition, RWA initiatives resulted in RWA reductions of $4.4bn.
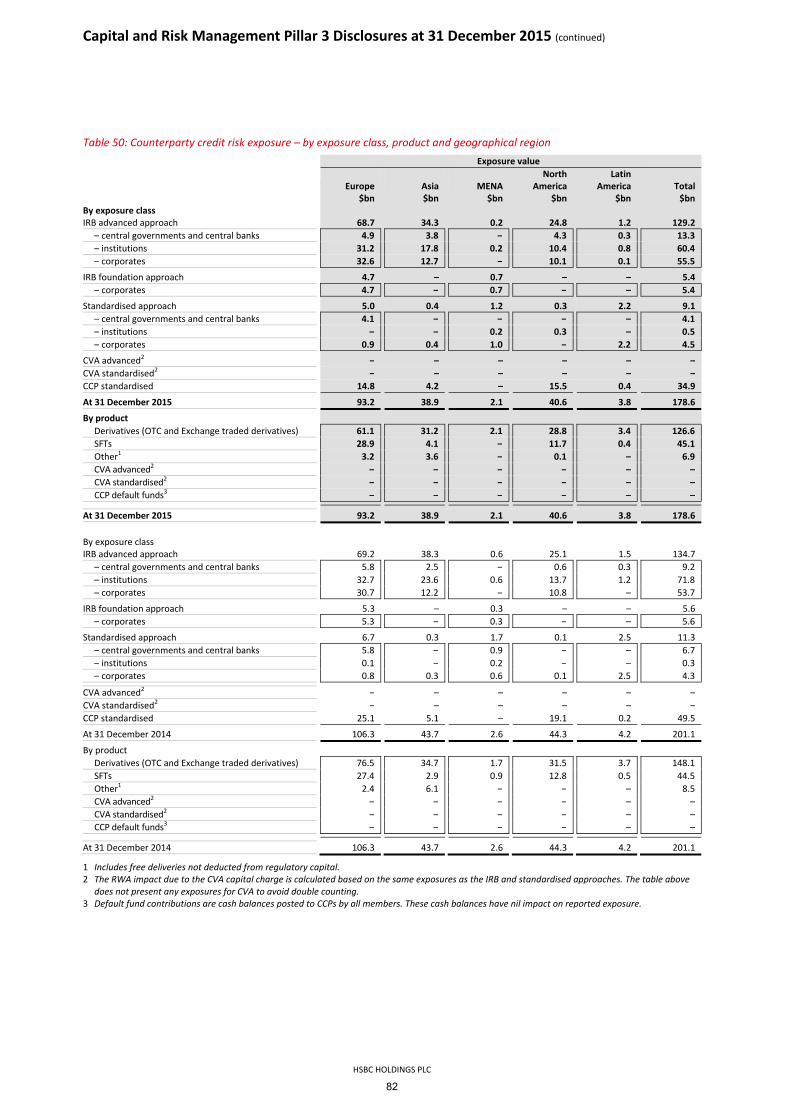
Capital and Risk Management Pillar 3 Disclosures at 31 December 2015 (continued)
HSBC HOLDINGS PLC
82
Table 50: Counterparty credit risk exposure – by exposure class, product and geographical region Exposure value
Europe Asia MENA North
America Latin
America
Total $bn $bn $bn $bn $bn $bnBy exposure class IRB advanced approach 68.7 34.3 0.2 24.8 1.2 129.2
– central governments and central banks 4.9 3.8 – 4.3 0.3 13.3– institutions 31.2 17.8 0.2 10.4 0.8 60.4– corporates 32.6 12.7 – 10.1 0.1 55.5
IRB foundation approach 4.7 – 0.7 – – 5.4– corporates 4.7 – 0.7 – – 5.4
Standardised approach 5.0 0.4 1.2 0.3 2.2 9.1– central governments and central banks 4.1 – – – – 4.1– institutions – – 0.2 0.3 – 0.5– corporates 0.9 0.4 1.0 – 2.2 4.5
CVA advanced2 – – – – – –CVA standardised2 – – – – – –CCP standardised 14.8 4.2 – 15.5 0.4 34.9
At 31 December 2015 93.2 38.9 2.1 40.6 3.8 178.6
By product Derivatives (OTC and Exchange traded derivatives) 61.1 31.2 2.1 28.8 3.4 126.6SFTs 28.9 4.1 – 11.7 0.4 45.1Other1 3.2 3.6 – 0.1 – 6.9CVA advanced2 – – – – – –CVA standardised2 – – – – – –CCP default funds3 – – – – – –
At 31 December 2015 93.2 38.9 2.1 40.6 3.8 178.6 By exposure class IRB advanced approach 69.2 38.3 0.6 25.1 1.5 134.7
– central governments and central banks 5.8 2.5 – 0.6 0.3 9.2– institutions 32.7 23.6 0.6 13.7 1.2 71.8– corporates 30.7 12.2 – 10.8 – 53.7
IRB foundation approach 5.3 – 0.3 – – 5.6– corporates 5.3 – 0.3 – – 5.6
Standardised approach 6.7 0.3 1.7 0.1 2.5 11.3– central governments and central banks 5.8 – 0.9 – – 6.7– institutions 0.1 – 0.2 – – 0.3– corporates 0.8 0.3 0.6 0.1 2.5 4.3
CVA advanced2 – – – – – –CVA standardised2 – – – – – –CCP standardised 25.1 5.1 – 19.1 0.2 49.5
At 31 December 2014 106.3 43.7 2.6 44.3 4.2 201.1
By product Derivatives (OTC and Exchange traded derivatives) 76.5 34.7 1.7 31.5 3.7 148.1SFTs 27.4 2.9 0.9 12.8 0.5 44.5Other1 2.4 6.1 – – – 8.5CVA advanced2 – – – – – –CVA standardised2 – – – – – –CCP default funds3 – – – – – –
At 31 December 2014 106.3 43.7 2.6 44.3 4.2 201.1
1 Includes free deliveries not deducted from regulatory capital. 2 The RWA impact due to the CVA capital charge is calculated based on the same exposures as the IRB and standardised approaches. The table above
does not present any exposures for CVA to avoid double counting. 3 Default fund contributions are cash balances posted to CCPs by all members. These cash balances have nil impact on reported exposure.
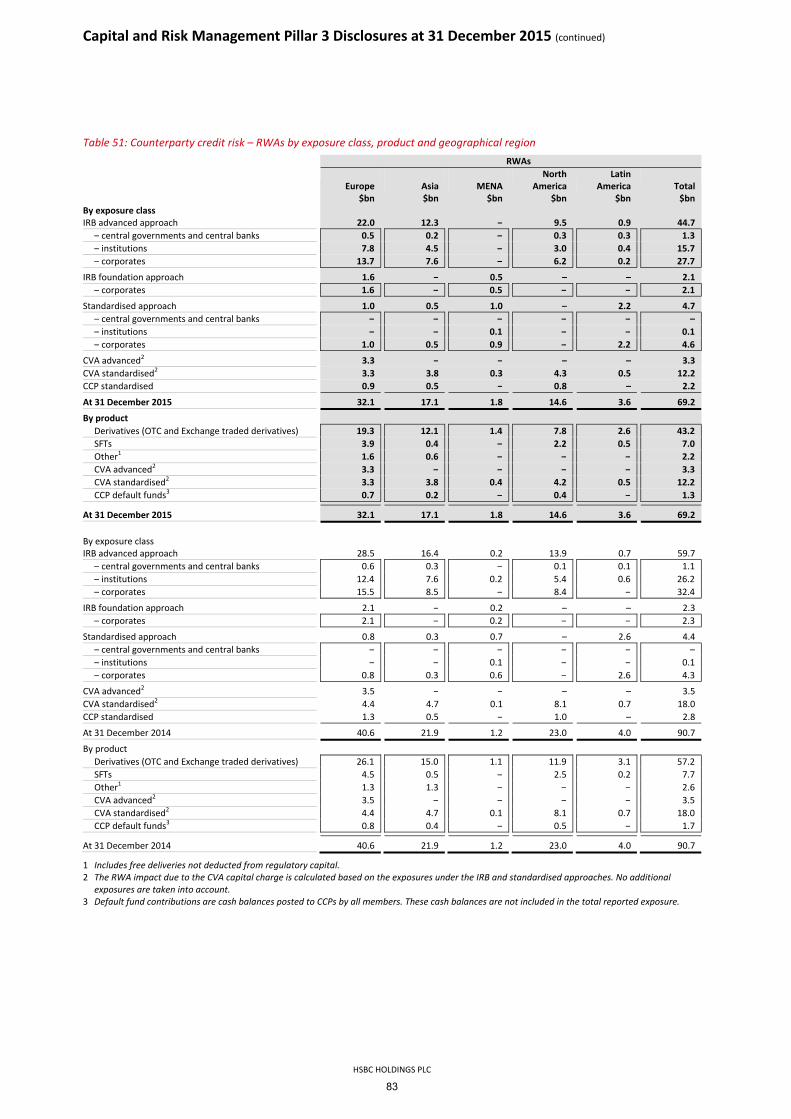
Capital and Risk Management Pillar 3 Disclosures at 31 December 2015 (continued)
HSBC HOLDINGS PLC
83
Table 51: Counterparty credit risk – RWAs by exposure class, product and geographical region RWAs
Europe Asia MENA North
America Latin
America Total $bn $bn $bn $bn $bn $bnBy exposure class IRB advanced approach 22.0 12.3 – 9.5 0.9 44.7
– central governments and central banks 0.5 0.2 – 0.3 0.3 1.3– institutions 7.8 4.5 – 3.0 0.4 15.7– corporates 13.7 7.6 – 6.2 0.2 27.7
IRB foundation approach 1.6 – 0.5 – – 2.1– corporates 1.6 – 0.5 – – 2.1
Standardised approach 1.0 0.5 1.0 – 2.2 4.7– central governments and central banks – – – – – –– institutions – – 0.1 – – 0.1– corporates 1.0 0.5 0.9 – 2.2 4.6
CVA advanced2 3.3 – – – – 3.3CVA standardised2 3.3 3.8 0.3 4.3 0.5 12.2CCP standardised 0.9 0.5 – 0.8 – 2.2
At 31 December 2015 32.1 17.1 1.8 14.6 3.6 69.2
By product Derivatives (OTC and Exchange traded derivatives) 19.3 12.1 1.4 7.8 2.6 43.2SFTs 3.9 0.4 – 2.2 0.5 7.0Other1 1.6 0.6 – – – 2.2CVA advanced2 3.3 – – – – 3.3CVA standardised2 3.3 3.8 0.4 4.2 0.5 12.2CCP default funds3 0.7 0.2 – 0.4 – 1.3
At 31 December 2015 32.1 17.1 1.8 14.6 3.6 69.2 By exposure class IRB advanced approach 28.5 16.4 0.2 13.9 0.7 59.7
– central governments and central banks 0.6 0.3 – 0.1 0.1 1.1– institutions 12.4 7.6 0.2 5.4 0.6 26.2– corporates 15.5 8.5 – 8.4 – 32.4
IRB foundation approach 2.1 – 0.2 – – 2.3– corporates 2.1 – 0.2 – – 2.3
Standardised approach 0.8 0.3 0.7 – 2.6 4.4– central governments and central banks – – – – – –– institutions – – 0.1 – – 0.1– corporates 0.8 0.3 0.6 – 2.6 4.3
CVA advanced2 3.5 – – – – 3.5CVA standardised2 4.4 4.7 0.1 8.1 0.7 18.0CCP standardised 1.3 0.5 – 1.0 – 2.8
At 31 December 2014 40.6 21.9 1.2 23.0 4.0 90.7
By product Derivatives (OTC and Exchange traded derivatives) 26.1 15.0 1.1 11.9 3.1 57.2SFTs 4.5 0.5 – 2.5 0.2 7.7Other1 1.3 1.3 – – – 2.6CVA advanced2 3.5 – – – – 3.5CVA standardised2 4.4 4.7 0.1 8.1 0.7 18.0CCP default funds3 0.8 0.4 – 0.5 – 1.7
At 31 December 2014 40.6 21.9 1.2 23.0 4.0 90.7
1 Includes free deliveries not deducted from regulatory capital. 2 The RWA impact due to the CVA capital charge is calculated based on the exposures under the IRB and standardised approaches. No additional
exposures are taken into account. 3 Default fund contributions are cash balances posted to CCPs by all members. These cash balances are not included in the total reported exposure.

Capital and Risk Management Pillar 3 Disclosures at 31 December 2015 (continued)
HSBC HOLDINGS PLC
84
Table 52: Counterparty credit risk – RWA density by exposure class, product and geographical region RWA density
Europe Asia MENA
North America
Latin America Total
% % % % % %By exposure class IRB advanced approach
Central governments and central banks 10 6 – 8 76 10Institutions 25 25 – 29 55 26Corporates 42 60 – 61 221 50
IRB foundation approach Corporates 35 – 50 – – 37
Standardised approach Central governments and central banks – – – – – –Institutions – – 47 – – 47Corporates 114 103 97 – 101 103
CVA advanced2 – – – – – –CVA standardised2 – – – – – –CCP standardised 7 12 – 5 – 6
At 31 December 2015 34 44 83 36 96 39 By product
Derivatives (OTC and Exchange traded derivatives) 32 39 67 27 78 34SFTs 13 10 – 19 123 15Other1 48 17 – – – 32CVA advanced2 – – – – – –CVA standardised2 – – – – – –CCP default funds3 – – – – – –
At 31 December 2015 34 44 83 36 96 39 By exposure class IRB advanced approach
Central governments and central banks 10 14 – 17 38 12Institutions 38 32 34 39 48 36Corporates 50 70 – 78 – 60
IRB foundation approach Corporates 40 – 57 – – 41
Standardised approach Institutions – – 37 – – 37Corporates 100 100 97 – 102 99
CVA advanced2 – – – – – –CVA standardised2 – – – – – –CCP standardised 5 9 – 5 – 6At 31 December 2014 38 50 47 52 95 45 By product
Derivatives (OTC and Exchange traded derivatives) 34 43 62 38 82 39SFTs 17 18 – 19 40 17Other1 52 22 – – – 31CVA advanced2 – – – – – –CVA standardised2 – – – – – –CCP default funds3 – – – – – –
At 31 December 2014 38 50 47 52 95 45
1 Includes free deliveries not deducted from regulatory capital. 2 The RWA impact due to the CVA capital charge is calculated based on the exposures under the IRB and standardised approaches. No additional
exposures are taken into account. 3 Default fund contributions are cash balances posted to CCPs by all members. These cash balances are not included in the total reported exposure.

Capital and Risk Management Pillar 3 Disclosures at 31 December 2015 (continued)
HSBC HOLDINGS PLC
85
Wrong-way risk
Wrong-way risk occurs when a counterparty’s exposures are adversely correlated with its credit quality. There are two types of wrong-way risk:
• General wrong-way risk occurs when the probability of counterparty default is positively correlated with general risk factors, for example, where a counterparty is resident and/or incorporated in a higher-risk country and seeks to sell a non-domestic currency in exchange for its home currency; and
• Specific wrong-way risk occurs when the exposure to a particular counterparty is positively correlated with the probability of counterparty default such as a reverse repo on the counterparty’s own bonds. It is HSBC’s policy that specific wrong-way transactions are approved on a case by case basis.
We use a range of tools to monitor and control wrong-way risk, including requiring the business to obtain prior approval before undertaking wrong-way risk transactions outside pre-agreed guidelines. The regional Traded Risk functions are responsible for the control and monitoring process within an overarching Group framework and limit framework.
Central counterparties
Whilst exchange traded derivatives have been cleared through CCP’s for many years, recent regulatory initiatives designed to reduce systemic risk in the banking system are directing increasing volumes of OTC derivatives to be cleared through CCPs.
A dedicated CCP risk team has been established to manage the interface with CCPs and undertake in-depth due diligence of the unique risks associated with these organisations. This is to address an implication of the regulations that the Group’s risk will be transferred from being distributed among individual, bilateral counterparties to a significant level of risk concentration on CCPs. We have developed a risk appetite framework to manage risk accordingly, on an individual CCP and global basis.
Securitisation
Group securitisation strategy
HSBC acts as originator, sponsor, liquidity provider and derivative counterparty to our own originated and sponsored securitisations, as well as those of third-parties. Our strategy is to use securitisation to meet our needs for aggregate funding or capital management, to the extent that market, regulatory treatments and other conditions are suitable, and for customer facilitation. We do not provide support to any of our originated or sponsored securitisations, and it is not our policy to do so. We have senior exposures to the SICs: Mazarin Funding Limited, Barion Funding Limited, Malachite Funding Limited and we hold all of the commercial paper issued by Solitaire Funding Limited. These are considered legacy businesses, and exposures are being repaid as the securities they hold amortise.
Group securitisation roles
Our roles in the securitisation process are as follows:
• Originator: where we originate the assets being securitised, either directly or indirectly;
• Sponsor: where we establish and manage a securitisation programme that purchases exposures from third parties; and
• Investor: where we invest in a securitisation transaction directly or provide derivatives or liquidity facilities to a securitisation.
HSBC as originator
We use SPEs to securitise customer loans and advances and other debt that we have originated in order to diversify our sources of funding for asset origination and for capital efficiency purposes. In such cases, we transfer the loans and advances to the SPEs for cash, and the SPEs issue debt securities to investors to fund the cash purchases. This activity is conducted in a number of regions and across a number of asset classes. We also act as a derivative counterparty. Credit enhancements to the underlying assets may be used to obtain investment grade ratings on the senior debt issued by the SPEs. The majority of these securitisations are consolidated for accounting purposes (see page 87 for the regulatory treatment).
In addition, we use SPEs to mitigate the capital absorbed by some of the customer loans and advances we have originated. Credit derivatives are used to transfer the credit risk associated with such customer loans and advances to an SPE, using securitisations commonly known as synthetic securitisations by which the SPE writes CDS protection for HSBC. These SPEs are consolidated for accounting purposes when the substance of the relationship indicates that we control them.
During the year HSBC issued a synthetic securitisation, comprising drawn and undrawn seasoned corporate loans to relationship clients with a portfolio maximum notional amount of $5bn. The significant risk transfer for this synthetic securitisation is effected via an SPE which has sold protection on a $0.3bn tranche. The protection is collateralised from the proceeds of bonds issued by the SPE. The SPE for this securitisation is accounting consolidated but is not regulatory consolidated.
HSBC as sponsor
We are sponsor to a number of types of securitisation entities, including:
• a multi-seller conduit vehicle established to provide finance to clients – Regency Assets Limited – to which we provide senior liquidity facilities and programme-wide credit enhancement;
• three SICs established to provide tailored investments to third-party clients, backed primarily by senior tranches of securitisations and securities issued by financial institutions. Mazarin Funding Limited is an ABCP conduit to which we provide transaction-specific liquidity facilities; Barion Funding Limited and Malachite Funding Limited are vehicles to which we provide senior term funding; and

Capital and Risk Management Pillar 3 Disclosures at 31 December 2015 (continued)
HSBC HOLDINGS PLC
86
• Solitaire Funding Limited, HSBC’s principal SIC, funded entirely by commercial paper issued to HSBC. HSBC also provides a liquidity facility and a first loss letter of credit to Solitaire Funding Limited. Solitaire has no need to draw on it as long as HSBC purchases its issued commercial paper, which HSBC intends to do for the foreseeable future.
The performance of our exposure to the SICs is primarily subject to the credit risk of the underlying securities.
The table below summarises the nature of exposures, including the relevant accounting and regulatory treatment applicable, to the most material of these sponsored entities. Further details of these entities may be found in note 39 of the Annual Report and Accounts 2015.
Entity Entity description and nature of exposure Accounting
consolidation Regulatory
consolidation Regulatory treatment
Solitaire ABCP conduit to which a first-loss letter of credit and transaction-specific liquidity facilities are provided
Look through to risk weights of underlying assets
Barion Vehicle to which senior term funding is provided
Exposures (including derivatives and liquidity
facilities) are risk-weighted as securitisation positions
Malachite Vehicle to which senior term funding is provided
Mazarin ABCP conduit to which transaction-specific liquidity facilities are provided
Regency Multi-seller conduit to which senior liquidity facilities and programme-wide credit enhancement are provided
HSBC as investor
We have exposure to third-party securitisations across a wide range of sectors in the form of investments, liquidity facilities and as a derivative counterparty. These are primarily legacy exposures.
Monitoring of securitisation positions
Securitisation positions are managed by a dedicated team that use a combination of market standard systems and third-party data providers to monitor performance data and manage market and credit risks.
In the case of re-securitisation positions, similar processes are conducted in respect of the underlying securitisations.
Liquidity risk of securitised assets is consistently managed as part of the Group’s liquidity and funding risk management framework and further details are provided on page 159 of the Annual Report and Accounts 2015.
Valuation of securitisation positions
The valuation process of our investments in securitisation exposures primarily focuses on quotations from third parties, observed trade levels and calibrated valuations from market standard models. This process did not change in 2015.
Our hedging and credit risk mitigation strategy, with regards to retained securitisation and re-securitisation exposures, is to continually review our positions on an ongoing basis. Currently there are no material hedges in place and no credit risk mitigation is recognised on RWAs for our retained securitisation or re-securitisation positions.
Securitisation accounting treatment
For accounting purposes, we consolidate structured entities (including SPEs) when the substance of the relationship indicates that we control them, that is, we
are exposed, or have rights, to variable returns from our involvement with the structured entity and have the ability to affect those returns through our power over the entity. Full details of these assessments and our accounting policy on structured entities may be found in note 1(g) and note 39 respectively of the Annual Report and Accounts 2015.
We reassess the required consolidation whenever there is a change in the substance of the relationship between HSBC and a structured entity.
HSBC enters into transactions in the normal course of business by which it transfers financial assets to structured entities. Depending on the circumstances, these transfers may either result in these financial assets being fully or partially derecognised or continuing to be recognised in their entirety.
Full derecognition occurs when we transfer our contractual right to receive cash flows from the financial assets, or retain the right but assume an obligation to pass on the cash flows from the assets, and transfer substantially all the risks and rewards of ownership. Only in the event that derecognition is achieved are sales and any resultant gains on sales recognised in the financial statements.
Partial derecognition occurs when we sell or otherwise transfer financial assets in such a way that some but not substantially all of the risks and rewards of ownership are transferred and control is retained. These financial assets are recognised on the balance sheet to the extent of our continuing involvement and an associated liability is also recognised. The net carrying amount of the financial asset and associated liability will be based on the measurements basis of the financial asset, either the amortised cost or the fair value of the rights and obligations retained by the entity. Further disclosure of such transfers may be found in note 18 of the Annual Report and Accounts 2015.

Capital and Risk Management Pillar 3 Disclosures at 31 December 2015 (continued)
HSBC HOLDINGS PLC
87
Securitisation regulatory treatment
For regulatory purposes, any reduction in RWAs which would be achieved by our own originated securitisations must receive the PRA’s permission and be justified by a commensurate transfer of credit risk to third parties. If achieved, the associated SPEs and underlying assets are not consolidated but exposures to them, including derivatives or liquidity facilities, are risk-weighted as securitisation positions.
For the majority of our securitisation non-trading book positions we use the IRB approach, and within this principally the RBM, with lesser amounts on IAA and SFM. We also use the standardised approach for an immaterial amount of non-trading book positions. Securitisation positions in the trading book are overseen within Market Risk, using the standardised approach. Our securitisation and re-securitisation RWAs do not benefit from any credit risk mitigation.
The IAA is limited to exposures arising from Regency Assets Limited, mainly related to liquidity facilities and credit enhancement. Eligible ECAI rating methodology, which includes stress factors, is applied to each asset class in order to derive the equivalent rating level for each transaction. This methodology is verified by the internal credit function as part of the approval process for each new transaction. The performance of each underlying asset portfolio, including residential and commercial mortgages and re-securitisations, is monitored to confirm that the applicable equivalent rating level still applies and is independently verified. Our IAA approach is also audited periodically by Internal Audit and reviewed by the PRA.
There was $1.0bn (2014: $0.8bn) of unrealised losses on ABS in the year, also disclosed on page 152 of the Annual Report and Accounts 2015, which fully relates to assets within SPEs that are consolidated for regulatory purposes.
Analysis of securitisation exposures
HSBC’s involvement in securitisation activities reflects the following:
• securitisation positions are not backed by revolving exposures other than trade receivables in Regency Assets Limited which is unchanged from 2014;
• facilities are not subject to early amortisation provisions (2014: nil);
• $4.7bn positions held as synthetic transactions (2014: not material);
• no assets awaiting securitisation (2014: nil);
• total exposures include off-balance sheet exposure of $17.1bn (2014: $21.4bn), mainly relating to contingent liquidity lines provided to securitisation vehicles where we act as sponsor, with a small amount from derivative exposures where we are an investor. The off-balance sheet exposures are held in the non-trading book and the exposure types are residential mortgages $0.1bn, commercial mortgages $1.9bn, trade receivables $13.8bn and re-securitisations $1.3bn; and
• no realised losses (2014: $0.2bn) on securitisation asset disposals during the year.
Further details of our securitisation exposures may be found on page 152 of the Annual Report and Accounts 2015.
Table 53: Securitisation exposure – by approach 2015 2014
Trading
bookNon-trading
book TotalTrading
bookNon-trading
book
Total $bn $bn $bn $bn $bn $bnIRB approach 2.8 40.9 43.7 2.9 38.3 41.2
– ratings based 2.8 21.6 24.4 2.9 23.6 26.5– internal assessment approach1 – 19.3 19.3 – 14.7 14.7
Standardised – 0.7 0.7 – 0.4 0.4At 31 December 2.8 41.6 44.4 2.9 38.7 41.6
1 Applies to exposures in Regency Assets Limited.
Table 54: Securitisation exposure – movement in the year Total at Movement in year Total at 1 January As originator As sponsor As investor 31 December $bn $bn $bn $bn $bnAggregate amount of securitisation exposures
Residential mortgages1 4.2 – – (1.0) 3.2Commercial mortgages1 4.2 – – (0.4) 3.8Leasing 0.1 – – – 0.1Loans to corporates or SMEs 1.1 4.7 – 0.4 6.2Consumer loans 0.3 – – 0.2 0.5Trade receivables2 15.9 – 4.5 – 20.4Re-securitisations1 15.8 (0.4) (4.6) (0.6) 10.2
2015 41.6 4.3 (0.1) (1.4) 44.4

Capital and Risk Management Pillar 3 Disclosures at 31 December 2015 (continued)
HSBC HOLDINGS PLC
88
Total at Movement in year Total at 1 January As originator As sponsor As investor 31 December $bn $bn $bn $bn $bn Aggregate amount of securitisation exposures
Residential mortgages1 2.5 – – 1.7 4.2Commercial mortgages1 4.8 – – (0.6) 4.2Leasing – – – 0.1 0.1Loans to corporates or SMEs 0.2 – – 0.9 1.1Consumer loans 0.4 – – (0.1) 0.3Trade receivables2 17.7 – (1.8) – 15.9Re-securitisations1 25.6 (0.3) (8.8) (0.7) 15.8Other assets 0.4 – (0.4) – –
2014 51.6 (0.3) (11.0) 1.3 41.6
1 Residential and Commercial mortgages and re-securitisations principally include exposures to Solitaire Funding Limited, Mazarin Funding Limited, Barion Funding Limited and Malachite Funding Limited and restructured on-balance sheet assets. The pools primarily comprise the senior tranches of retail mortgage backed securities, commercial mortgage backed securities, auto ABS, credit card ABS, student loans, collateralised debt obligations, and also include bank subordinated debt.
2 Trade receivables largely relate to Regency Assets Limited and pools are senior with a maturity of less than 10 years.
Table 55: Securitisation exposure – by trading and non-trading book 2015 2014 Trading Non-trading Trading Non-trading book book Total book book Total $bn $bn $bn $bn $bn $bnAs originator – 6.4 6.4 – 2.1 2.1
– loans to corporates or SMEs – 4.7 4.7 – – –– re-securitisations – 1.7 1.7 – 2.1 2.1
As sponsor – 27.8 27.8 – 27.9 27.9– trade receivables – 19.8 19.8 – 15.3 15.3– re-securitisations – 8.0 8.0 – 12.6 12.6
As investor 2.8 7.4 10.2 2.9 8.7 11.6– residential mortgages 1.1 2.1 3.2 1.7 2.5 4.2– commercial mortgages 0.7 3.1 3.8 0.8 3.4 4.2– leasing 0.1 – 0.1 – 0.1 0.1– loans to corporates or SMEs 0.4 1.1 1.5 0.1 1.0 1.1– consumer loans 0.2 0.3 0.5 0.1 0.2 0.3– trade receivables 0.1 0.5 0.6 0.1 0.5 0.6– re-securitisations 0.2 0.3 0.5 0.1 1.0 1.1
At 31 December 2.8 41.6 44.4 2.9 38.7 41.6 Table 56: Securitisation – asset values and impairments 2015 2014 Underlying assets1 Securitisation Underlying assets1 Securitisation Impaired exposures Impaired exposures Total4 and past due impairment Total and past due impairment $bn $bn $bn $bn $bn $bnAs originator 6.7 1.6 0.5 2.2 2.1 0.7
– residential mortgages 0.1 – – 0.3 – –– loans to corporates and SMEs 5.0 – – – – –– re-securitisations2 1.6 1.6 0.5 1.9 2.1 0.7
As sponsor 30.8 0.1 0.1 28.9 0.3 0.2– commercial mortgages 2.2 – – 2.3 – –– trade receivables 18.7 – – 12.4 – –– re-securitisations2 9.9 0.1 0.1 14.2 0.3 0.2
As investor3 – –– residential mortgages – –– commercial mortgages – –– re-securitisations – –
At 31 December 0.6 0.9
1 Securitisation exposures may exceed the underlying asset values when HSBC provides liquidity facilities while also acting as derivative counterparty and a note holder in the SPE.
2 The amount of underlying assets reported for re-securitisations denotes the value of collateral within the re-securitisation vehicles. 3 For securitisations where HSBC acts as investor, information on third-party underlying assets is not available. 4 As originator and sponsor, all associated underlying assets are held in the non-trading book. These assets are all underlying to traditional
securitisations with the exception of ‘loans to corporates and SMEs’ which is underlying to a synthetic securitisation.

Capital and Risk Management Pillar 3 Disclosures at 31 December 2015 (continued)
HSBC HOLDINGS PLC
89
Table 57: Securitisation exposure – by risk weighting Exposure value1 Capital required6 Trading book Non-trading book2 Trading book3 Non-trading book S4 R5 S4 R5 S4 R5 S4 R5
$bn $bn $bn $bn $bn $bn $bn $bnLong-term category – risk weights
– less than or equal to 10% 0.8 – 21.4 2.5 – – 0.2 –– > 10% and ≤ 20% 0.8 – 7.2 0.9 – – 0.1 –– > 20% and ≤ 50% 0.3 0.2 1.1 3.3 – – – 0.2– > 50% and ≤ 100% 0.4 – 1.5 0.7 – – 0.1 –– > 100% and ≤ 650% 0.2 – 0.1 0.8 0.1 – – 0.2– > 650% and < 1,250% – – – 0.1 – – – –1,250%7 0.1 – 0.3 1.7 0.1 – 0.3 1.3
At 31 December 2015 2.6 0.2 31.6 10.0 0.2 – 0.7 1.7 Long-term category – risk weights
– less than or equal to 10% 0.9 – 16.7 – – – – –– > 10% and ≤ 20% 0.9 0.1 8.0 5.6 – – – –– > 20% and ≤ 50% 0.2 – 1.1 1.4 – – – 0.1– > 50% and ≤ 100% 0.3 – 1.5 0.7 – – – 0.1– > 100% and ≤ 650% 0.3 – 0.1 1.3 0.2 – 0.1 0.3– > 650% and < 1,250% – – – – – – – –1,250% 0.2 – 1.1 1.2 0.2 – 1.1 1.2
At 31 December 2014 2.8 0.1 28.5 10.2 0.4 – 1.2 1.7
1 There are no short-term category exposures at 31 December 2015 (2014: nil). 2 Non-trading book figures at 31 December 2015 include $0.7bn exposures treated under the standardised approach (2014: $0.4bn). 3 Trading book securitisation capital requirements are also disclosed in table 58 within the market risk section. 4 Securitisation. 5 Re-securitisation. The total re-securitisation exposure value is less than that presented in tables 54 and 55, reflecting a differing treatment of Solitaire
Funding Limited. In tables 54 and 55, Solitaire is treated as a re-securitisation, while the figures above are based on the fact that Solitaire is consolidated for regulatory purposes, and present the exposure values as securitisations allocated to the RWA bands of Solitaire’s underlying pool of assets.
6 All our re-securitisation positions and the majority of our securitisation positions have their capital requirements calculated using the IRB approach. There is an immaterial amount of securitisation positions in the non-trading book that have their capital requirement calculated using the standardised approach. The standardised risk weight applicable and the resulting capital requirement at 31 December 2015 is 100% and $0.1bn, respectively, (2014: 100% and $0.1bn).
7 At 31 December 2015, positions risk weighted at 1,250% are, in the non-trading book, re-securitisation positions $1.7bn, residential mortgages $0.3bn, consumer loans $0.1bn and in the trading book commercial mortgages $0.1bn. Impairments are not included in the exposure values but they are reflected in the capital required.
Key points • The increase in exposure is a result of a $4.7bn newly issued HSBC synthetic securitisation, a $4.5bn exposure increase in Regency liquidity
facilities offset by a $5.6bn reduction in re-securitisation exposures. • The net movement in capital is a result of a lower risk weight being applied at 31 December 2015 while the total exposures increased in the year.
Total exposures at 31 December 2015, compared to those at 31 December 2014, are on average of a higher credit quality, based on their external ratings, and this is reflected in the capital required.

Capital and Risk Management Pillar 3 Disclosures at 31 December 2015 (continued)
HSBC HOLDINGS PLC
90
Market risk Overview and objectives
Market risk is the risk that movements in market factors, such as foreign exchange rates, interest rates, credit spreads, equity prices and commodity prices, will reduce our income or the value of our portfolios.
Exposure to market risk Exposure to market risk is separated into two portfolios: • Trading portfolios comprise positions arising from
market-making and the warehousing of customer-derived positions.
• Non-trading portfolios comprise positions that primarily arise from the interest rate management of our retail and commercial banking assets and liabilities, financial investments designated as AFS and held to maturity, and exposures arising from our insurance operations.
Where appropriate, we apply similar risk management policies and measurement techniques to both trading and non-trading portfolios. Our objective is to manage and control market risk exposures in order to optimise return on risk while maintaining a market profile consistent with our status as one of the world’s largest banking and financial services organisations.
The nature of the hedging and risk mitigation strategies performed across the Group corresponds to the market risk management instruments available within each operating jurisdiction. These strategies range from the use of traditional market instruments, such as interest rate swaps, to more sophisticated hedging strategies to address a combination of risk factors arising at portfolio level.
Overview of market risk in global businesses
The diagram below summarises the main business areas where trading and non-trading market risks reside and the market risk measures used to monitor and limit exposures.
1 The interest rate risk on the fixed-rate securities issued by HSBC Holdings is not included in the Group VaR.
Market risk governance
Market risk is managed and controlled through limits approved by the RMM for HSBC Holdings and our various global businesses. These limits are allocated across business lines and to the Group’s legal entities.
The management of market risk is principally undertaken in GB&M, where 94% of the total VaR of HSBC (excluding insurance) and almost all trading VaR resides, using risk limits approved by the GMB. VaR limits are set for portfolios, products and risk types, with market liquidity being a primary factor in determining the level of limits set.
Global Risk is responsible for setting market risk management policies and measurement techniques. Each major operating entity has an independent market risk management and control function which is responsible for measuring market risk exposures in accordance with policies defined by Global Risk, and monitoring and reporting these exposures against the prescribed limits on a daily basis. The market risk limits are governed according to the framework illustrated to the right.
Each operating entity is required to assess the market risks arising on each product in its business and to transfer them to either its local GB&M unit for management, or to separate books managed under the supervision of the local ALCO.
Trading risk Non-trading risk
Risk types– Foreign exchange and commodities– Interest rates– Credit spreads– Equities
– Structural foreign exchange
– Interest rates1
– Credit spreads
Risk measure VaR Sensitivity Stress testing
Global businesses GB&M, including BSM GB&M, incl BSM GPB CMB RBWM
VaR Sensitivity Stress testing
Chairman/CEO
Risk Management Meeting of the GMB
HSBC Holdings Board
Entity Risk Management Committee
Principal Office Manager
Business/Desk/Trader
Group Traded Risk
Gene
ral m
easu
res
Spec
ific
mea
sure
s
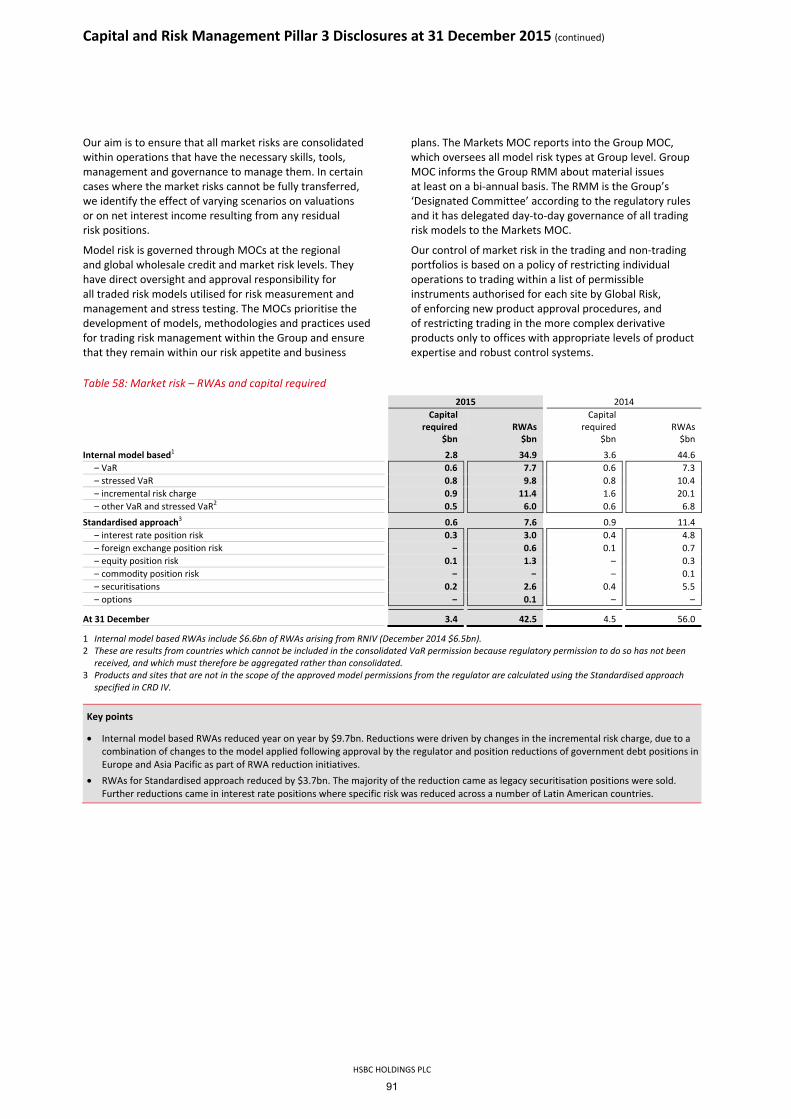
Capital and Risk Management Pillar 3 Disclosures at 31 December 2015 (continued)
HSBC HOLDINGS PLC
91
Our aim is to ensure that all market risks are consolidated within operations that have the necessary skills, tools, management and governance to manage them. In certain cases where the market risks cannot be fully transferred, we identify the effect of varying scenarios on valuations or on net interest income resulting from any residual risk positions.
Model risk is governed through MOCs at the regional and global wholesale credit and market risk levels. They have direct oversight and approval responsibility for all traded risk models utilised for risk measurement and management and stress testing. The MOCs prioritise the development of models, methodologies and practices used for trading risk management within the Group and ensure that they remain within our risk appetite and business
plans. The Markets MOC reports into the Group MOC, which oversees all model risk types at Group level. Group MOC informs the Group RMM about material issues at least on a bi-annual basis. The RMM is the Group’s ‘Designated Committee’ according to the regulatory rules and it has delegated day-to-day governance of all trading risk models to the Markets MOC.
Our control of market risk in the trading and non-trading portfolios is based on a policy of restricting individual operations to trading within a list of permissible instruments authorised for each site by Global Risk, of enforcing new product approval procedures, and of restricting trading in the more complex derivative products only to offices with appropriate levels of product expertise and robust control systems.
Table 58: Market risk – RWAs and capital required 2015 2014
Capital
required RWAs Capital
required
RWAs $bn $bn $bn $bn
Internal model based1 2.8 34.9 3.6 44.6– VaR 0.6 7.7 0.6 7.3– stressed VaR 0.8 9.8 0.8 10.4– incremental risk charge 0.9 11.4 1.6 20.1– other VaR and stressed VaR2 0.5 6.0 0.6 6.8
0 6 0Standardised approach3 0.6 7.6 0.9 11.4– interest rate position risk 0.3 3.0 0.4 4.8– foreign exchange position risk – 0.6 0.1 0.7– equity position risk 0.1 1.3 – 0.3– commodity position risk – – – 0.1– securitisations 0.2 2.6 0.4 5.5– options – 0.1 – –
At 31 December 3.4 42.5 4.5 56.0
1 Internal model based RWAs include $6.6bn of RWAs arising from RNIV (December 2014 $6.5bn). 2 These are results from countries which cannot be included in the consolidated VaR permission because regulatory permission to do so has not been
received, and which must therefore be aggregated rather than consolidated. 3 Products and sites that are not in the scope of the approved model permissions from the regulator are calculated using the Standardised approach
specified in CRD IV.
Key points
• Internal model based RWAs reduced year on year by $9.7bn. Reductions were driven by changes in the incremental risk charge, due to a combination of changes to the model applied following approval by the regulator and position reductions of government debt positions in Europe and Asia Pacific as part of RWA reduction initiatives.
• RWAs for Standardised approach reduced by $3.7bn. The majority of the reduction came as legacy securitisation positions were sold. Further reductions came in interest rate positions where specific risk was reduced across a number of Latin American countries.

Capital and Risk Management Pillar 3 Disclosures at 31 December 2015 (continued)
HSBC HOLDINGS PLC
92
Market risk measures
Monitoring and limiting market risk exposures Our objective is to manage and control market risk exposures while maintaining a market profile consistent with our risk appetite. We use a range of tools to monitor and limit market risk exposures including sensitivity analysis, VaR and stress testing.
Sensitivity analysis
Sensitivity analysis measures the impact of individual market factor movements on specific instruments or portfolios including interest rates, foreign exchange rates and equity prices, such as the effect of a one basis point change in yield. We use sensitivity measures to monitor the market risk positions within each risk type. Sensitivity limits are set for portfolios, products and risk types, with the depth of the market being one of the principal factors in determining the level of limits set.
Value at risk
VaR is a technique that estimates the potential losses on risk positions in the trading portfolio as a result of movements in market rates and prices over a specified time horizon and to a given level of confidence. The use of VaR is integrated into market risk management and is calculated for all trading positions regardless of how we capitalise those exposures. Where there is not an approved internal model, we use the appropriate local rules to capitalise exposures locally.
In addition, we calculate VaR for non-trading portfolios to have a complete picture of risk. Our models are predominantly based on historical simulation. VaR is calculated at a 99% confidence level for a one-day holding period. Where we do not calculate VaR explicitly, we use alternative tools as summarised in the Market Risk Stress Testing table below.
Our VaR models derive plausible future scenarios from past series of recorded market rates and prices, taking into account inter-relationships between different markets and rates such as interest rates and foreign exchange rates. The models also incorporate the effect of option features on the underlying exposures.
The historical simulation models used incorporate the following features:
• historical market rates and prices are calculated with reference to foreign exchange rates and commodity prices, interest rates, equity prices and the associated volatilities;
• potential market movements utilised for VaR are calculated with reference to data from the past two years; and
• VaR measures are calculated to a 99% confidence level and use a one-day holding period.
The nature of the VaR models means that an increase in observed market volatility will lead to an increase in VaR even without any changes in the underlying positions.
VaR model limitations
Although a valuable guide to risk, VaR should always be viewed in the context of its limitations, for example:
• the use of historical data as a proxy for estimating future events may not encompass all potential events, particularly those which are extreme in nature;
• the use of a holding period assumes that all positions can be liquidated or the risks offset during that period. This may not fully reflect the market risk arising at times of severe illiquidity, when the holding period may be insufficient to liquidate or hedge all positions fully;
• the use of a 99% confidence level by definition does not take into account losses that might occur beyond this level of confidence;
• VaR is calculated on the basis of exposures outstanding at close of business and therefore does not necessarily reflect intra-day exposures; and
• VaR is unlikely to reflect loss potential on exposures that only arise under conditions of significant market movement.
Risk-not-in-VaR framework
Our VaR model is designed to capture significant basis risk such as CDS versus bond, asset swap spreads and cross-currency basis. Other basis risks which are not completely covered in VaR, such as the Libor tenor basis, are complemented by our RNIV calculations and are integrated into our capital framework.
The RNIV framework therefore aims to capture and capitalise material market risks that are not adequately covered in the VaR model. An example of this is Libor-overnight index swap basis risk for minor currencies. In such instances the RNIV framework uses stress tests to quantify the capital requirement. In 2015, the capital requirement derived from these stress tests represented, on average, 2.3% of the total internal model-based market risk requirement.
Risks covered by RNIV represent 19% of market risk RWAs for models with regulatory approval and include those resulting from underlying risk factors which are not observable on a daily basis across asset classes and products, such as dividend risk and implied correlation risks.
Risk factors are reviewed on a regular basis and either incorporated directly in the VaR models, where possible, or quantified through the VaR-based RNIV approach or a stress test approach within the RNIV framework. The severity of the scenarios is calibrated to be in line with the capital adequacy requirements. The outcome of the VaR-based RNIV is included in the VaR calculation and back-testing; a stressed VaR RNIV is also computed for the risk factors considered in the VaR-based RNIV approach.

Capital and Risk Management Pillar 3 Disclosures at 31 December 2015 (continued)
HSBC HOLDINGS PLC
93
Level 3 assets
The fair values of Level 3 assets and liabilities in trading portfolios are disclosed on page 380 of the Annual Report and Accounts 2015, and represent only a small proportion of the overall trading portfolio. Market risk arising from Level 3 instruments is managed by various market risk techniques such as stress testing and notional limits.
Back-testing
We routinely validate the accuracy of our VaR models by back-testing them against both actual, which replaced clean profit and loss from 1 August 2015, and hypothetical profit and loss against the corresponding VaR numbers. Hypothetical profit and loss excludes non-modelled items such as fees, commissions and revenues of intra-day transactions.
We would expect on average to see two or three profits, and two or three losses, in excess of VaR at the 99% confidence level over a one-year period. The actual number of profits or losses in excess of VaR over this period can therefore be used to gauge how well the models are performing.
We back-test our Group VaR at various levels which reflect a full legal entity scope of HSBC, including entities that do not have local permission to use VaR for regulatory purposes.
Back-testing using the regulatory hierarchy includes entities which have approval to use VaR in the calculation of market risk regulatory capital requirement. For example, all Latin American sites are excluded from this hierarchy as they are not approved by the PRA. In this case the
regulatory capital is calculated using Standardised approach, rather than VaR.
In 2015, the PRA VaR approved entities experienced one profit exception and no loss exceptions against both actual and hypothetical profit and loss.
The profit exception was due primarily to profits from increased volatility in foreign exchange currencies, arising from the sharp fall in the Chinese stock market and its effect on the global markets. There is no evidence of model errors or control failures.
HSBC submits separate back-testing results to regulators, including the PRA and the European Central Bank, based on applicable frequencies ranging from two business days after an exception occurs, to quarterly submissions.
Stress testing
Stress testing is an important procedure that is integrated into our market risk management tool to evaluate the potential impact on portfolio values of more extreme, although plausible, events or movements in a set of financial variables. In such scenarios, losses can be much greater than those predicted by VaR modelling.
Stress testing is implemented at legal entity, regional and overall Group levels. A standard set of scenarios is utilised consistently across all regions within the Group. Scenarios are tailored to capture the relevant events or market movements at each level. The risk appetite around potential stress losses for the Group is set and monitored against referral limits.
Market Risk Stress Testing
Sensitivities Technical Hypothetical Historical
Reverse Stress Testing
Impact of a single risk factor, e.g. break of a currency peg
Impact of the largest move in each risk factor without consideration of any underlying market correlation
Impact of potential macroeconomic events, e.g. slowdown in mainland China
Scenarios that incorporate historical observations of market movements, e.g. Black Monday 1987 for equities
Market risk reverse stress tests are undertaken on the premise that there is a fixed loss. The stress testing process identifies which scenarios lead to this loss. The rationale behind the reverse stress test is to understand scenarios which are beyond normal business settings that could have contagion and systemic implications.
Stressed VaR and stress testing, together with reverse stress testing and the management of gap risk, provide management with insights regarding the ‘tail risk’ beyond VaR for which HSBC’s appetite is limited.
Market risk capital models
There are a number of measures which HSBC has permission to use in calculating regulatory capital which are listed in table 59.
For regulatory purposes, the trading book comprises all positions in CRD financial instruments and commodities which are held with trading intent, which are taken with the intention of benefiting from short-term gains or positions where it can be demonstrated that they hedge positions in the trading book. Trading book positions must either be free of any restrictive covenants on their tradability or be capable of being hedged.

Capital and Risk Management Pillar 3 Disclosures at 31 December 2015 (continued)
HSBC HOLDINGS PLC
94
A CRD financial instrument is defined as any contract that gives rise to both a financial asset to one party and a financial liability or equity instrument to another party.
HSBC maintains a Trading Book Policy which defines the minimum requirements for trading book positions and the process for classifying positions as trading or banking book. Positions in the trading book are subject to market risk based rules, i.e. market risk capital, computed using
regulatory approved models. Otherwise the market risk capital is calculated using the Standardised approach. If any of the policy criteria are not met, then the position is categorised as a banking book exposure. Capital add-ons also exist to capture event risk including foreign exchange risk on pegged currencies and concentration risk associated with large equity holdings.
Table 59: Market risk models1
Model component
RWAs for associated asset class
$bn Confidence
level Liquidity
horizon Model description and methodology
VaR 7.7 99% 10 day Uses most recent two years’ history of daily returns to determine a loss distribution. The result is scaled, using the square root of 10, from one day to provide an equivalent 10-day loss.
Stressed VaR 9.8 99% 10 day Stressed VaR is calibrated to a one-year period of stress observed in history.
IRC 11.4 99.9% 1 year Uses a multi-factor Gaussian Monte-Carlo simulation which includes product basis, concentration, hedge mismatch, recovery rate and liquidity as part of the simulation process. A minimum liquidity horizon of three months is applied and is based on a combination of factors including issuer type, currency and size of exposure.
Options 0.1 n/a n/a Uses a standard charge scenario approach based on a spot volatility grid where, for each point on the grid, there is a full revaluation of the portfolio. The regulators prescribe the ranges therefore there is no equivalence with confidence level and liquidity horizon.
1 Non-proprietary details are available in the Financial Services Register on the PRA website.
VaR
VaR used for regulatory purposes differs from VaR used for management purpose with key differences listed below.
VaR Regulatory Management Scope Regulatory
approval(PRA)
Broader population of trading and banking book positions
Confidence interval 99% 99% Liquidity horizon 10 day 1 day Data set Past 2 years Past 2 years
The trading books which received approval from the regulator to be covered via an internal model are used to calculate VaR for regulatory purposes. Regulatory VaR levels contribute to the calculation of market risk RWAs (see Market risk table on page 91).
Table 60: VaR used for regulatory purposes (one-day equivalent) 2015 2014 $m $m
At 31 December 69 71Maximum 91 99Minimum 55 50Average 67 83 The regulatory VaR table is based on the regulatory permissions received, plus aggregated sites. This differs from the daily VaR reported in the Annual Report and Accounts which shows a fully diversified view used for internal risk management.
Stressed VaR
Stressed VaR is primarily used for regulatory capital purposes and is integrated into the risk management process to ensure prudent capital management. Stressed VaR complements other risk measures by providing the potential losses under stressed market conditions. Calculations are based on a continuous one-year period of stress for the trading portfolio, based on the assessment at the Group level.
Stress VaR modelling follows the same approach as our VaR risk measure except for the following: • potential market movements employed for stressed VaR
calculations are based on a continuous one-year period of stress for the trading portfolio;
• the choice of period changed from (November 2007 to November 2008) to (January 2008 to December 2008) in the last quarter of 2015 and is based on the assessment at the Group level of the most volatile period in recent history; and
• it is calculated to a 99% confidence using a 10-day holding period.
Table 61: Stressed value at risk (one-day equivalent) 2015 2014
$m $m
At 31 December 116 125Maximum 172 191Minimum 105 87Average 115 134
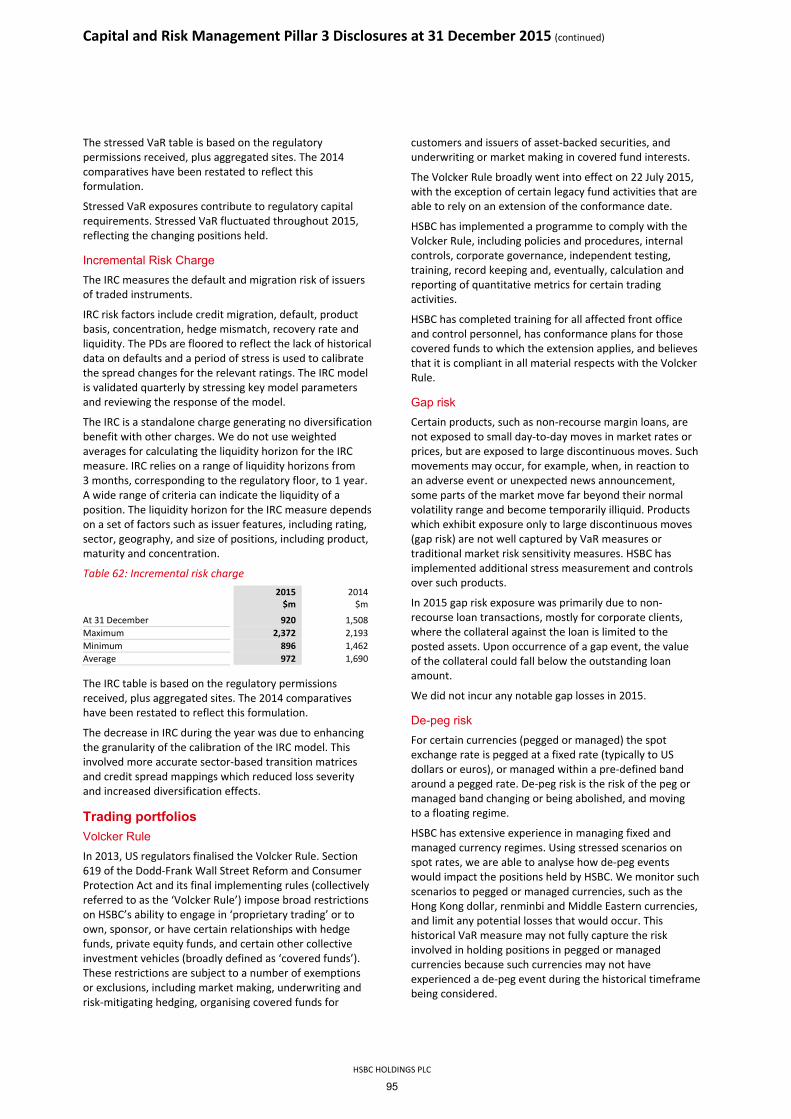
Capital and Risk Management Pillar 3 Disclosures at 31 December 2015 (continued)
HSBC HOLDINGS PLC
95
The stressed VaR table is based on the regulatory permissions received, plus aggregated sites. The 2014 comparatives have been restated to reflect this formulation.
Stressed VaR exposures contribute to regulatory capital requirements. Stressed VaR fluctuated throughout 2015, reflecting the changing positions held.
Incremental Risk Charge
The IRC measures the default and migration risk of issuers of traded instruments.
IRC risk factors include credit migration, default, product basis, concentration, hedge mismatch, recovery rate and liquidity. The PDs are floored to reflect the lack of historical data on defaults and a period of stress is used to calibrate the spread changes for the relevant ratings. The IRC model is validated quarterly by stressing key model parameters and reviewing the response of the model.
The IRC is a standalone charge generating no diversification benefit with other charges. We do not use weighted averages for calculating the liquidity horizon for the IRC measure. IRC relies on a range of liquidity horizons from 3 months, corresponding to the regulatory floor, to 1 year. A wide range of criteria can indicate the liquidity of a position. The liquidity horizon for the IRC measure depends on a set of factors such as issuer features, including rating, sector, geography, and size of positions, including product, maturity and concentration.
Table 62: Incremental risk charge 2015 2014 $m $m
At 31 December 920 1,508Maximum 2,372 2,193Minimum 896 1,462Average 972 1,690
The IRC table is based on the regulatory permissions received, plus aggregated sites. The 2014 comparatives have been restated to reflect this formulation.
The decrease in IRC during the year was due to enhancing the granularity of the calibration of the IRC model. This involved more accurate sector-based transition matrices and credit spread mappings which reduced loss severity and increased diversification effects.
Trading portfolios
Volcker Rule
In 2013, US regulators finalised the Volcker Rule. Section 619 of the Dodd-Frank Wall Street Reform and Consumer Protection Act and its final implementing rules (collectively referred to as the ‘Volcker Rule’) impose broad restrictions on HSBC’s ability to engage in ‘proprietary trading’ or to own, sponsor, or have certain relationships with hedge funds, private equity funds, and certain other collective investment vehicles (broadly defined as ‘covered funds’). These restrictions are subject to a number of exemptions or exclusions, including market making, underwriting and risk-mitigating hedging, organising covered funds for
customers and issuers of asset-backed securities, and underwriting or market making in covered fund interests.
The Volcker Rule broadly went into effect on 22 July 2015, with the exception of certain legacy fund activities that are able to rely on an extension of the conformance date.
HSBC has implemented a programme to comply with the Volcker Rule, including policies and procedures, internal controls, corporate governance, independent testing, training, record keeping and, eventually, calculation and reporting of quantitative metrics for certain trading activities.
HSBC has completed training for all affected front office and control personnel, has conformance plans for those covered funds to which the extension applies, and believes that it is compliant in all material respects with the Volcker Rule.
Gap risk
Certain products, such as non-recourse margin loans, are not exposed to small day-to-day moves in market rates or prices, but are exposed to large discontinuous moves. Such movements may occur, for example, when, in reaction to an adverse event or unexpected news announcement, some parts of the market move far beyond their normal volatility range and become temporarily illiquid. Products which exhibit exposure only to large discontinuous moves (gap risk) are not well captured by VaR measures or traditional market risk sensitivity measures. HSBC has implemented additional stress measurement and controls over such products.
In 2015 gap risk exposure was primarily due to non-recourse loan transactions, mostly for corporate clients, where the collateral against the loan is limited to the posted assets. Upon occurrence of a gap event, the value of the collateral could fall below the outstanding loan amount.
We did not incur any notable gap losses in 2015.
De-peg risk
For certain currencies (pegged or managed) the spot exchange rate is pegged at a fixed rate (typically to US dollars or euros), or managed within a pre-defined band around a pegged rate. De-peg risk is the risk of the peg or managed band changing or being abolished, and moving to a floating regime.
HSBC has extensive experience in managing fixed and managed currency regimes. Using stressed scenarios on spot rates, we are able to analyse how de-peg events would impact the positions held by HSBC. We monitor such scenarios to pegged or managed currencies, such as the Hong Kong dollar, renminbi and Middle Eastern currencies, and limit any potential losses that would occur. This historical VaR measure may not fully capture the risk involved in holding positions in pegged or managed currencies because such currencies may not have experienced a de-peg event during the historical timeframe being considered.

Capital and Risk Management Pillar 3 Disclosures at 31 December 2015 (continued)
HSBC HOLDINGS PLC
96
ABS/MBS exposures
The ABS/MBS exposures within the trading portfolios are managed within sensitivity and VaR limits, used for management purposes, as described on page 167 of the Annual Report and Accounts 2015, and are included within the stress testing scenarios described above.
Non-trading portfolios
Most of the Group’s non-trading VaR relates to BSM or local treasury management functions. Contributions to Group non-trading VaR are driven by interest rates and credit spread risks arising from all global businesses. There is no commodity market risk in the non-trading portfolios.
Non-trading VaR also includes the interest rate risk of non-trading financial instruments held by the global businesses and transferred into portfolios managed by BSM or local treasury functions. In measuring, monitoring and managing risk in our non-trading portfolios, VaR is just one of the tools used. The management of interest rate risk in the banking book is described further in ‘Non-trading interest rate risk’ below, including the role of BSM.
Non-trading VaR excludes equity risk on AFS securities, structural foreign exchange risk, and interest rate risk on fixed rate securities issued by HSBC Holdings, the scope and management of which are described in the relevant sections below.
Our control of market risk in the non-trading portfolios is based on transferring the assessed market risk of non-trading assets and liabilities created outside BSM or Markets, to the books managed by BSM, provided the market risk can be neutralised. The net exposure is typically managed by BSM through the use of fixed rate government bonds (liquid assets held in AFS books) and interest rate swaps. The interest rate risk arising from fixed rate government bonds held within AFS portfolios is reflected within the Group’s non-traded VaR. Interest rate swaps used by BSM are typically classified as either a fair value hedge or a cash flow hedge and are included within the Group’s non-traded VaR. Any market risk that cannot be neutralised in the market is managed by local ALCO in segregated ALCO books.
Equity securities classified as available-for-sale
Potential new commitments are subject to risk appraisal to ensure that industry and geographical concentrations remain within acceptable levels for the portfolio. Regular reviews are performed to substantiate the valuation of the investments within the portfolio and investments held to facilitate ongoing business, such as holdings in government- sponsored enterprises and local stock exchanges. See ‘Other risks – Non-trading book exposures in equities’ on page 101 for additional information.
Prudent valuation adjustment
HSBC has documented policies and maintains systems and controls for the calculation of PVA. Prudent value is the estimated lowest price that would be received to sell an asset or highest price paid to transfer a liability in 90% of orderly transactions occurring between market participants at the balance sheet date. HSBC’s methodology addresses fair value uncertainties arising from a number of sources; market price uncertainty, bid offer (‘close out’) uncertainty, model risk, concentration, administrative cost, CVA (‘unearned credit spread’) and funding fair value adjustment.
Structural foreign exchange exposures
Structural foreign exchange exposures represent net investments in subsidiaries, branches and associates, the functional currencies of which are currencies other than the US dollar. An entity’s functional currency is that of the primary economic environment in which the entity operates.
Exchange differences on structural exposures are recognised in ‘Other comprehensive income’. We use the US dollar as our presentation currency in our consolidated financial statements because the US dollar and currencies linked to it form the major currency bloc in which we transact and fund our business. Our consolidated balance sheet is, therefore, affected by exchange differences between the US dollar and all the non-US dollar functional currencies of underlying subsidiaries.
We hedge structural foreign exchange exposures only in limited circumstances. Our structural foreign exchange exposures are managed with the primary objective of ensuring, where practical, that our consolidated capital ratios and the capital ratios of individual banking subsidiaries are largely protected from the effect of changes in exchange rates. Our policy is to stabilise capital ratios by maintaining, so far as practicable, a suitable amount of regulatory capital denominated in each currency in which it has RWAs. This is usually achieved by ensuring that, for each subsidiary bank, the ratio of structural exposures in a given currency to RWAs denominated in that currency is broadly equal to the capital ratio of the subsidiary in question.
We may also transact hedges where a currency in which we have structural exposures is considered likely to revalue adversely, and it is possible in practice to transact a hedge. Any hedging is undertaken using forward foreign exchange contracts which are accounted for under IFRSs as hedges of a net investment in a foreign operation, or by financing with borrowings in the same currencies as the functional currencies involved. We evaluate residual structural foreign exchange exposures using an expected shortfall method.

Capital and Risk Management Pillar 3 Disclosures at 31 December 2015 (continued)
HSBC HOLDINGS PLC
97
The structural foreign exchange risk is modelled for capital purposes using an internally developed de-peg risk model. The model uses the expected shortfall method to calculate a quantity of capital ‘at risk’ due to the structural foreign exchange exposures. The method translates the capital surplus/deficit based on capital ratios and then measures a US dollar variance in that capital position based on an average of the worst case scenarios arrived at using a Monte Carlo simulation of potential foreign exchange moves. The model also incorporates mean reversion for floating currencies and non-linear movements for pegged and managed currencies. The model is considered to be conservative, as it has fat tails and simulates extreme events. Details of our structural foreign exchange exposures are provided in Note 33 of the Annual Report and Accounts 2015.
Non-trading interest rate risk
Non-trading book interest rate risk arises principally from mismatches between the future yield on assets and their funding cost, as a result of interest rate changes. Analysis of this risk is complicated by having to make assumptions on embedded optionality within certain product areas such as the incidence of mortgage prepayments, and from behavioural assumptions regarding the economic duration of liabilities which are contractually repayable on demand such as current accounts, and the re-pricing behaviour of managed rate products. These assumptions around behavioural features are captured in our interest rate risk behaviouralisation framework, which is described below.
We aim, through our management of market risk in non-trading portfolios, to mitigate the effect of prospective interest rate movements which could reduce future net interest income, while balancing the cost of such hedging activities on the current net revenue stream.
Our funds transfer pricing policies give rise to a two stage funds transfer pricing approach. For details see page 207 of the Annual Report and Accounts 2015.
The economic capital requirement for non-trading interest rate risk is measured using a two-step approach.
The economic capital requirement generated by our banking book is measured by our EVE sensitivity. EVE sensitivity considers all re-pricing mismatches assuming a run-off of the current balance sheet, and quantifies the larger loss in economic value of the Group’s net asset position (including off balance sheet positions) under a +/-200bps shock to interest rates. We hold capital only to the extent that our EVE sensitivity metric is projecting a loss in our banking book (that is, the EVE sensitivity brings the economic value of our banking book below the book value of Tier 1).
We hold a management buffer which is informed by the potential downside risk to the CET1 ratio due to interest rate and credit spread risk in the AFS portfolio is measured by the portfolio’s stressed VaR, using a 99% confidence level and an assumed holding period of a quarter. We hold a management buffer equivalent to our stressed VaR limit.
ALCM is responsible for measuring and controlling non-trading interest rate risk under the supervision of the RMM. Its primary responsibilities are:
• to define the rules governing the transfer of interest rate risk from the commercial bank to BSM;
• to ensure that all market interest rate risk that can be hedged is effectively transferred from the global businesses to BSM; and
• to define the rules and metrics for monitoring the residual interest rate risk in the global businesses.
The different types of non-trading interest rate risk and the controls which the Group uses to quantify and limit its exposure to these risks can be categorised as follows:
• risk which is transferred to BSM and managed by BSM within a defined risk mandate;
• risk which remains outside BSM because it cannot be hedged or which arises due to our behaviouralised transfer pricing assumptions. This risk will be captured by our net interest income EVE sensitivity, and corresponding limits are part of our global and regional risk appetite statement for non-trading interest rate risk. A typical example would be margin compression created by unusually low rates in key currencies;
• basis risk which is transferred to BSM when it can be hedged. Any residual basis risk remaining in the global businesses is reported to ALCO. A typical example would be a managed rate savings product transfer-priced using a Libor-based interest rate curve; and
• model risks which cannot be captured by net interest income or EVE sensitivity but are controlled by our stress testing framework. A typical example would be prepayment risk on residential mortgages or pipeline risk.
Details of the Group’s monitoring of the sensitivity of projected net interest income under varying interest rate scenarios may be found on page 216 of the Annual Report and Accounts 2015.
Interest rate risk behaviouralisation
Unlike liquidity risk, which is assessed on the basis of a very severe stress scenario, non-trading interest rate risk is assessed and managed according to ‘business-as-usual’ conditions. In many cases the contractual profile of non-trading assets/liabilities arising from assets/liabilities created outside Markets or BSM does not reflect the behaviour observed. Behaviouralisation is therefore used to assess the market interest rate risk of non-trading assets/liabilities and this assessed market risk is transferred to BSM, in accordance with the rules governing the transfer of interest rate risk from the global businesses to BSM.
Behaviouralisation is applied in three key areas:
• the assessed re-pricing frequency of managed rate balances;
• the assessed duration of non-interest bearing balances, typically capital and current accounts; and
• the base case expected prepayment behaviour or pipeline take-up rate for fixed rate balances with embedded optionality.

Capital and Risk Management Pillar 3 Disclosures at 31 December 2015 (continued)
HSBC HOLDINGS PLC
98
Interest rate behaviouralisation policies have to be formulated in line with the Group’s behaviouralisation policies and approved at least annually by local ALCOs, regional ALCMs and Group ALCM, in conjunction with local, regional and Group market risk monitoring teams.
The extent to which balances can be behaviouralised is driven by:
• the amount of the current balance that can be assessed as ‘stable’ under business-as-usual conditions; and
• for managed rate balances the historic market interest rate re-pricing behaviour observed; or
• for non-interest bearing balances the duration for which the balance is expected to remain under business-as-usual conditions. This assessment is often driven by the re-investment tenors available to BSM to neutralise the risk through the use of fixed rate government bonds or interest rate derivatives, and for derivatives the availability of cash flow hedging capacity.
Balance Sheet Management
Effective governance across BSM is supported by the dual reporting lines it has to the Chief Executive Officer of GB&M and to the Group Treasurer. In each operating entity, BSM is responsible for managing liquidity and funding under the supervision of the local ALCO (which usually meets on a monthly basis). It also manages the non-trading interest rate positions transferred to it within a Global Markets limit structure.
In executing the management of the liquidity risk on behalf of ALCO, and managing the non-trading interest rate positions transferred to it, BSM invests in highly-rated liquid assets in line with the Group’s liquid asset policy. The majority of the liquidity is invested in central bank deposits and government, supranational and agency securities with most of the remainder held in short-term interbank and central bank loans.
Withdrawable central bank deposits are accounted for as cash balances. Interbank loans, statutory central bank reserves and loans to central banks are accounted for as loans and advances to banks. BSM’s holdings of securities are accounted for as AFS or, to a lesser extent, held-to-maturity assets.
Statutory central bank reserves are not recognised as liquid assets. The statutory reserves that would be released in line with the Group’s stressed customer deposit outflow assumptions are reflected as stressed inflows.
BSM is permitted to use derivatives as part of its mandate to manage interest rate risk. Derivative activity is predominantly through the use of vanilla interest rate swaps which are part of cash flow hedging and fair value hedging relationships.
Credit risk in BSM is predominantly limited to short-term bank exposure created by interbank lending, exposure to central banks and high quality sovereigns, supranationals or agencies which constitute the majority of BSM’s liquidity
portfolio. BSM does not manage the structural credit risk of any Group entity balance sheets.
BSM is permitted to enter into single name and index credit derivatives activity, but it does so to manage credit risk on the exposure specific to its securities portfolio in limited circumstances only. The risk limits are extremely limited and closely monitored. At 31 December 2015, BSM had no open credit derivative index risk.
VaR is calculated on both trading and non-trading positions held in BSM. It is calculated by applying the same methodology used for the Markets business and utilised as a tool for market risk control purposes.
BSM holds trading portfolio instruments in only very limited circumstances. Positions and the associated VaR were not significant during 2015.
Sensitivity of net interest income
A principal part of our management of market risk in non-trading portfolios is to monitor the sensitivity of projected net interest income under varying interest rate scenarios (simulation modelling). This monitoring is undertaken at an entity level by local ALCOs.
Entities apply a combination of scenarios and assumptions relevant to their local businesses, and standard scenarios which are required throughout HSBC. The latter are consolidated to illustrate the combined pro forma effect on our consolidated net interest income.
Projected net interest income sensitivity figures represent the effect of the pro forma movements in net interest income based on the projected yield curve scenarios and the Group’s current interest rate risk profile. This effect, however, does not incorporate actions which would probably be taken by BSM or in the business units to mitigate the effect of interest rate risk. In reality, BSM seeks proactively to change the interest rate risk profile to minimise losses and optimise net revenues. The net interest income sensitivity calculations assume that interest rates of all maturities move by the same amount in the ‘up-shock’ scenario. Rates are not assumed to become negative in the ‘down-shock’ scenario which may, in certain currencies, effectively result in non-parallel shock. In addition, the net interest income sensitivity calculations take account of the effect on net interest income of anticipated differences in changes between interbank interest rates and interest rates over which the entity has discretion in terms of the timing and extent of rate changes.
Defined benefit pension schemes
Market risk arises within our defined benefit pension schemes to the extent that the obligations of the schemes are not fully matched by assets with determinable cash flows. See ‘Other risks – Pension Risk’ on page 101 for additional information.

Capital and Risk Management Pillar 3 Disclosures at 31 December 2015 (continued)
HSBC HOLDINGS PLC
99
Operational risk Overview and objectives
Operational risk is defined as the risk to achieving our strategy or objectives as a result of inadequate or failed internal processes, people and systems or from external events.
Requirements under CRD IV include a capital requirement for operational risk, utilising three levels of sophistication as stated on page 18. We have historically adopted, and currently use, the standardised approach in determining our operational risk capital requirements. We are in the process of implementing an Operational Risk model which we will use for economic capital calculation purposes. The table below sets out our operational risk capital requirement by region and global business.
Operational risk is relevant to every aspect of our business. It covers a wide spectrum of issues, in particular legal,
compliance, security and fraud. Losses arising from breaches of regulation and law, unauthorised activities, error, omission, inefficiency, fraud, systems failure or external events all fall within the definition of operational risk.
We have historically experienced operational risk losses in the following major categories:
• possible mis-selling of products;
• breach of regulatory requirements;
• fraudulent and other external criminal activities;
• breakdowns in processes/procedures due to human error, misjudgement or malice;
• terrorist attacks;
• system failure or non-availability; and
• in certain parts of the world, vulnerability to natural disasters.
Table 63: Operational risk RWAs 2015 2014
Capital
required RWAs Capital
required
RWAs $bn $bn $bn $bnBy geographical region Europe 2.8 34.9 2.8 35.5Asia 3.8 47.1 3.7 45.8Middle East and North Africa 0.5 6.2 0.5 6.2North America 1.1 14.1 1.2 15.2Latin America 1.0 13.1 1.2 15.1
At 31 December 9.2 115.4 9.4 117.8
By global business Retail Banking and Wealth Management1 2.9 35.9 2.9 37.7Commercial Banking1 2.5 31.0 2.6 32.2Global Banking and Markets 3.5 45.2 3.6 44.5Global Private Banking 0.3 3.3 0.3 3.6Other – – – (0.2)
At 31 December 9.2 115.4 9.4 117.8
1 In the first half of 2015, a portfolio of customers was transferred from CMB to RBWM in Latin America in order to better align the combined banking needs of the customers with our established global businesses. Comparative data have been re-presented accordingly.
During 2015, our operational risk profile continued to be dominated by compliance risks as referred to in the ‘Top and emerging risks’ section on page 110 and in the appendix to Risk Section on page 217 of the Annual Report and Accounts 2015. The most material losses experienced in 2015 related largely to events that occurred in previous years. These events included the possible historical mis-selling of payment protection insurance products in the UK (see Note 29 of the Annual Report and Accounts 2015). A number of mitigating actions continue to be taken to prevent future mis-selling incidents.
The regulatory environment in which we operate is increasing the cost of doing business and could reduce our future profitability. The implementation of Global Standards remains one of the key strategic priorities for the Group and is ongoing. For further details on compliance risk, refer to page 178 of the Annual Report and Accounts 2015.
We recognise that operational risk losses can be incurred for a wide variety of reasons, including rare but extreme events.
The objective of our operational risk management is to manage and control operational risk in a cost-effective manner and within our risk appetite, as defined by GMB.
Organisation and responsibilities
Responsibility for minimising operational risk losses lies primarily with HSBC’s management and staff. Each regional, global business, country, business unit and functional head is required to maintain oversight over operational risk and internal control, covering all businesses and operational activities for which they are responsible.
The Group Operational Risk function and the ORMF assist business management in discharging their responsibilities.

Capital and Risk Management Pillar 3 Disclosures at 31 December 2015 (continued)
HSBC HOLDINGS PLC
100
The ORMF defines minimum standards and processes, and the governance structure for operational risk and internal control across the Group. To implement the ORMF, HSBC has implemented a ‘Three lines of defence’ model (an industry best practice approach) to underpin our approach to managing operational risk. It makes clear who does what within HSBC to manage operational risks on a daily basis.
The First Line of Defence owns the risk and is responsible for identifying, recording, reporting, managing the risks and ensuring that the right controls and assessments are in place to mitigate these risks. The Second Line of Defence sets the policy and guidelines for managing the risks and provides advice, guidance and challenge to the First Line of Defence on effective risk management. The Third Line of Defence is Internal Audit which independently ensures we are managing risk effectively. More details on our ORMF may be found on page 176 of the Annual Report and Accounts 2015.
The Global Operational Risk Committee, which reports to RMM, meets monthly to discuss key risk issues and review the effective implementation of the ORMF.
Operational risk is organised as a specific risk discipline within Global Risk. The Group Operational Risk function supports the Group Chief Risk Officer and the Global Operational Risk Committee and is responsible for establishing and maintaining the ORMF, monitoring the level of operational losses and the effectiveness of the control environment. It is also responsible for operational risk reporting at Group level, including preparation of reports for consideration by RMM and GRC.
Measurement and monitoring
We have codified our ORMF in a high level standard, supplemented by detailed policies. These policies explain our approach to identifying, assessing, monitoring and controlling operational risk and give guidance on mitigating actions to be taken when weaknesses are identified.
In 2015, we continued to enhance our ORMF policies and procedures, and undertook various activities, such as a global training programme, to further embed the use of the framework in the management of the business.
Articulation of risk appetite for material operational risks helps the business to understand the level of risk our organisation is willing to take. Monitoring operational risk exposure against risk appetite on a regular basis, and setting out our risk acceptance process, drives risk awareness in a more forward-looking manner. It assists management in determining whether further action is required.
In addition, an enhanced Risk Scenario Analysis process has been implemented across material legal entities to improve the quantification and management of material risks. This provides a top down, forward-looking view of risks to help determine whether they are being effectively managed within our risk appetite or whether further management action is required.
In each of our subsidiaries, business managers are responsible for maintaining an acceptable level of internal control, commensurate with the scale and nature of operations. They are responsible for identifying and assessing risks, designing controls and monitoring the effectiveness of these controls. The ORMF helps managers to fulfil these responsibilities by defining a standard risk assessment methodology and providing a tool for the systematic reporting of operational loss data.
Operational risk and control assessment approach
Operational risk and control assessments are performed by individual business units and functions. The risk and control assessment process is designed to provide business areas and functions with a forward-looking view of operational risks, an assessment of the effectiveness of controls, and a tracking mechanism for action plans so that they can proactively manage operational risks within acceptable levels. Risk and control assessments are reviewed and updated at least annually.
Appropriate means of mitigation and controls are considered. These include:
• making specific changes to strengthen the internal control environment; and
• investigating whether cost-effective insurance cover is available to mitigate the risk.
Recording
We use a centralised database to record the results of our operational risk management process. Operational risk and control assessments, as described above, are input and maintained by business units. Business management and Business Risk and Control Managers monitor and follow up the progress of documented action plans.
Operational risk loss reporting
To ensure that operational risk losses are consistently reported and monitored at Group level, all Group companies are required to report individual losses when the net loss is expected to exceed $10,000 and to aggregate all other operational risk losses under $10,000. Losses are entered into the Operational Risk IT system and are reported to the Group Operational Risk function on a monthly basis.

Capital and Risk Management Pillar 3 Disclosures at 31 December 2015 (continued)
HSBC HOLDINGS PLC
101
Other risks Pension risk
We operate a number of pension plans throughout the world. Some of them are defined benefit plans. Sponsoring Group companies (and in some instances, employees) make regular contributions in accordance with advice from actuaries and in consultation with the plans’ trustees (where relevant). In situations where a funding deficit emerges, sponsoring Group companies agree to make additional contributions to the plans, to address the deficit over an appropriate repayment period.
The defined benefit plans invest these contributions in a range of investments designed to meet their long-term liabilities.
Pension risk principally arises from the potential for a deficit in a defined benefit plan to arise from a number of factors, including: • investments delivering a return below that required
to provide the projected plan benefits. This could arise, for example, when there is a fall in the market value of equities, or when increases in long-term interest rates cause a fall in the value of fixed income securities held;
• the prevailing economic environment leading to corporate failures, thus triggering write-downs in asset values (both equity and debt);
• a change in either interest rates or inflation expectations, causing an increase in the value of the plan liabilities; and
• plan members living longer than expected (known as longevity risk).
Pension risk is assessed by way of an economic capital model that takes into account potential variations in these factors. The impact of the variation on both pension assets and pension liabilities is modelled using VaR methodology, with a 99.5% confidence interval and a one-year time horizon.
Non-trading book exposures in equities
Our non-trading equities exposures are reviewed by RMM at least annually. At 31 December 2015, we had equity investments in the non-trading book of $6.1bn (2014: $10.9bn). These consist of investments held for the purposes shown in table 64.
Table 64: Non-trading book equity investments 2015 2014 Available- Designated Available- Designated for-sale at fair value Total for-sale at fair value Total $bn $bn $bn $bn $bn $bn
Strategic investments 2.1 0.1 2.2 7.5 0.1 7.6Private equity investments 1.9 0.1 2.0 2.0 0.1 2.1Business facilitation1 1.9 – 1.9 1.2 – 1.2
At 31 December 5.9 0.2 6.1 10.7 0.2 10.9
1 Includes holdings in government-sponsored enterprises and local stock exchanges.
We make investments in private equity primarily through managed funds that are subject to limits on the amount of investment. We risk-assess these commitments to ensure that industry and geographical concentrations remain within acceptable levels for the portfolio as a whole, and perform regular reviews to substantiate the valuation of the investments within the portfolio.
Exchange traded investments amounted to $0.8bn (2014: $5.9bn), with the remainder being unlisted. These investments are held at fair value in line with market prices and are mainly strategic in nature. The decrease in strategic investments was largely due to the disposal of the Industrial Bank investment, partially offset by an increase in investments to facilitate ongoing business.
On a regulatory consolidation basis, the net gain from disposal of equity securities amounted to $1.8bn (2014: $1.0bn), while impairment of AFS equities amounted to $0.1bn (2014: $0.4bn). Unrealised gains on equities of $1.8bn at 31 December 2015 were fully recognised in CET1. Details of our accounting policy for AFS equity investments and the valuation of financial instruments may be found on pages 398 and 378, respectively, of the Annual Report and Accounts 2015. A detailed description of the valuation techniques applied to private equity may be found on page 382 of the Annual Report and Accounts 2015.
Risk management of insurance operations
We operate an integrated bancassurance model which provides insurance products principally for customers with whom we have a banking relationship. Insurance products are sold through all global businesses, but predominantly by RBWM and CMB through our branches and direct channels worldwide.
The insurance contracts we sell relate to the underlying needs of our banking customers, which we can identify from our point-of-sale contacts and customer knowledge. The majority of sales are of savings and investment products and term and credit life contracts. By focusing largely on personal and SME lines of business we are able to optimise volumes and diversify individual insurance risks.
We choose to manufacture these insurance products in HSBC subsidiaries based on an assessment of operational scale and risk appetite. Manufacturing insurance allows us to retain the risks and rewards associated with writing insurance contracts by keeping part of the underwriting profit and investment income within the Group.
Where we do not have the risk appetite or operational scale to be an effective insurance manufacturer, we engage with a handful of leading external insurance companies in order to provide insurance products to our customers

Capital and Risk Management Pillar 3 Disclosures at 31 December 2015 (continued)
HSBC HOLDINGS PLC
102
through our banking network and direct channels. These arrangements are generally structured with our exclusive strategic partners and earn the Group a combination of commissions, fees and a share of profits.
We distribute insurance products in all of our geographical regions. We have life insurance manufacturing subsidiaries in nine countries (Argentina, mainland China, France, Hong Kong, Malaysia, Malta, Mexico, Singapore and the UK). We also have life insurance manufacturing associate in Saudi Arabia and a joint venture in India.
We measure the risk profile of our insurance manufacturing businesses using an economic capital approach, where assets and liabilities are measured on a market value basis and a capital requirement is held to ensure that there is less than a 1 in 200 chance of insolvency over the next year, given the risks that the businesses are exposed to. The methodology for the economic capital calculation is largely aligned to the new pan-European Solvency II insurance capital regulations, which are applicable from 2016.
Subsidiaries engaged in insurance activities are excluded from the regulatory consolidation by excluding assets, liabilities and post-acquisition reserves, leaving the investment of these insurance subsidiaries to be recorded at cost and deducted from CET1 subject to thresholds (amounts below the thresholds are risk-weighted). Further details of the management of financial risks and insurance risk arising from the insurance operations are provided from page 180 of the Annual Report and Accounts 2015.
Liquidity and funding risk
Liquidity risk is the risk that the Group does not have sufficient financial resources to meet its obligations as they fall due, or will have to do so at an excessive cost. The risk arises from mismatches in the timing of cash flows.
The objective of our liquidity framework is to allow us to withstand very severe stresses. It is designed to be adaptable to changing business models, markets and regulations. Our liquidity and funding risk management framework requires:
• liquidity to be managed by operating entities on a stand-alone basis with no implicit reliance on the Group or central banks;
• all operating entities to comply with their limits for the advances to core funding ratio; and
• all operating entities to maintain positive stressed cash flow positions out to three months under prescribed Group stress scenarios.
We do not manage liquidity through the explicit allocation of capital as, in common with standard industry practice, this is not considered to be an appropriate or adequate mechanism for managing these risks. However, we recognise that a strong capital base can help to mitigate liquidity risk.
Funding risk is a form of liquidity risk arising when the liquidity needed to fund illiquid asset positions cannot be obtained at the expected terms and when required. Our
primary sources of funding are customer current accounts and customer savings deposits payable on demand or at short notice. We issue wholesale securities (secured and unsecured) to supplement our customer deposits and change the currency mix, maturity profile or location of our liabilities. In the normal course of business we do not seek to utilise secured financing as a source of funding to finance customer assets, beyond the collateralised security financing activities within Global Markets. The table in Appendix II summarises the total on and off-balance sheet assets that are encumbered and unencumbered on liquidity and funding risk basis and unencumbered assets that could be used to support potential future funding and collateral needs.
Forward-looking framework
From 1 January 2016, the Group implemented a new internal Liquidity and Funding Risk Framework, using the external Liquidity Coverage Ratio and Net Stable Funding Requirement regulatory framework as a foundation, but adding extra metrics/limits and overlays to address the risks that we consider are not adequately reflected by the external regulatory framework.
The key aspects of the new internal Liquidity and Funding Risk Framework are:
• stand-alone management of liquidity and funding by operating entity;
• operating entity classification by inherent liquidity risk categorisation;
• minimum operating entity EC Liquidity Coverage Ratio requirement depending on inherent liquidity risk categorisation (EC Liquidity Coverage Ratio Delegated Regulation basis);
• minimum operating entity Net Stable Funding Requirement depending on inherent liquidity risk categorisation (on the basis of the Basel 295 publication, pending finalisation of the EC Net Stable Funding Requirement delegated regulation);
• legal entity depositor concentration limit; • operating entity three-month and twelve-month
cumulative rolling term contractual maturity limits covering deposits from banks, deposits from non-bank financials and securities issued;
• annual individual liquidity adequacy assessment by operating entity; and
• during 2016, we will also introduce a minimum operating entity Liquidity Coverage Ratio requirement by currency.
The new internal Liquidity and Funding Risk Framework and the risk tolerance (limits) were approved by the RMM and the Board on the basis of recommendations made by the GRC.
Our individual liquidity adequacy assessment process has been designed to identify risks that are not reflected in the Group framework and where additional limits are assessed to be required locally, and to validate the risk tolerance at the operating entity level.

Capital and Risk Management Pillar 3 Disclosures at 31 December 2015 (continued)
HSBC HOLDINGS PLC
103
The decision to create an internal framework modelled around the external regulatory framework was driven by the need to ensure that the external and internal frameworks are directionally aligned and to ensure that the Group’s internal funds transfer pricing framework incentivises the global businesses within each operating entity to collectively comply with both the external (regulatory) and the internal risk tolerance. Details of our Liquidity and Funding Risk parameters are provided from page 154 of the Annual Report and Accounts 2015.
Reputational risk
Reputational risk is the risk of failure to meet stakeholder expectations as a result of any event, behaviour, action or inaction, either by HSBC itself, our employees or those with whom we are associated, that might cause stakeholders to form a negative view of the Group. This may have financial or non-financial effects, resulting in a loss of confidence, or have other consequences. Reputational risk relates to stakeholders’ perceptions, whether based on fact or otherwise. Stakeholders’ expectations are constantly changing and thus reputational risk is dynamic and varies between geographical regions, groups and individuals. As a global bank, HSBC has an unwavering commitment to operating to the high standards we have set for ourselves in every jurisdiction. Any lapse in standards of integrity, compliance, customer service or operating efficiency represents a potential reputational risk. For further details, please refer to the Reputational Risk section on page 189 of the Annual Report and Accounts 2015.
Sustainability risk
Sustainability risk arises from the provision of financial services to companies or projects which indirectly result in unacceptable impacts on people or on the environment.Sustainability risk is:
• measured by assessing the potential sustainability effect of a customer’s activities and assigning a Sustainability Risk Rating to all high-risk transactions;
• monitored quarterly by the RMM and monthly by Group Sustainability Risk; and
• managed using sustainability risk policies covering project finance lending and sector-based sustainability policies for sectors and themes with potentially high environmental or social impacts.
Business risk
The PRA specifies that banks, as part of their ICAAP, should review their exposure to business risk.
Business risk is the potential negative effect on profits and capital from the Group not meeting our strategic objectives, as a result of unforeseen changes in the business and regulatory environment, exposure to economic cycles and technological changes.
We manage and mitigate business risk through our risk appetite, business planning and stress testing processes, so that our business model and planned activities are monitored, resourced and capitalised consistent with the commercial, economic and risk environment in which the Group operates, and that any potential vulnerabilities of our business plans are identified at an early stage so that mitigating actions can be taken.
Dilution risk
Dilution risk is the risk that an amount receivable is reduced through cash or non-cash credit to the obligor, and arises mainly from factoring and invoice discounting transactions.
Where there is recourse to the seller, we treat these transactions as loans secured by the collateral of the debts purchased and do not report dilution risk for them. For our non-recourse portfolio, we do not report any dilution risk as we obtain an indemnity from the seller which indemnifies us against this risk. Moreover, factoring transactions involve lending at a discount to the face-value of the receivables which provides protection against dilution risk. Details of our management of these risks may be found on the following pages of the Annual Report and Accounts 2015: liquidity and funding 204, reputational 224 and sustainability 226.
Remuneration Details of the Group’s remuneration policy, including details on the remuneration committee membership, activities, our remuneration strategy and tables showing the remuneration details of HSBC’s Identified Staff and Material Risk Takers may be found under the Remuneration Policy on our website (www.hsbc.com/investor-relations/governance) and the Directors’ Remuneration Report on page 285 of the Annual Report and Accounts 2015.

Capital and Risk Management Pillar 3 Disclosures at 31 December 2015 (continued)
HSBC HOLDINGS PLC
104
Appendix I Simplified organisation chart for regulatory purposes1
1 At 31 December 2015 showing entities in home and priority markets, wholly owned unless shown otherwise (part ownership rounded down to the
nearest per cent), except 2, below. 2 Control of special purpose entities is not based on ownership. 3 Middle East and North Africa.

Capital and Risk Management Pillar 3 Disclosures at 31 December 2015 (continued)
HSBC HOLDINGS PLC
105
Appendix II Asset encumbrance
The following is the disclosure of on-balance sheet encumbered and unencumbered assets and off-balance sheet collateral (represented by median values of monthly data points in 2015) based on the requirement in Part Eight of CRD IV. The related Guideline, issued by the EBA on 27 June 2014, was implemented by the PRA through Supervisory Statement SS11/14.
Table 65: Asset encumbrance A – Assets Carrying amount
of encumbered assets
Fair value of encumbered assets
Carrying amount of unencumbered assets
Fair value of unencumbered assets
010 040 060 090 $m $m $m $m
010 Assets of the reporting institution 130,079 – 2,545,834 –030 Equity instruments 8,085 8,085 72,608 72,493040 Debt securities 67,903 67,805 451,722 442,657120 Other assets 2,723 – 471,168 – B – Collateral received Fair value of encumbered
collateral received or own debt securities issued
Fair value of collateral received or own debt securities issued available for encumbrance
010 040 $m $m
130 Assets of the reporting institution 143,295 118,790150 Equity instruments 25,505 11,790160 Debt securities 116,571 97,066230 Other collateral received – 4,771240 Own debt securities issued other than own covered bonds
or ABSs – – C – Encumbered assets/collateral received and associated liabilities
Matching liabilities, contingent liabilities or securities lent
Assets, collateral received and own debt securities issued other than covered bonds and ABSs encumbered
010 030 $m $m
010 Carrying amount of selected financial liabilities 180,483 258,910 Information on importance of encumbrance
We are a deposit-led bank and hence the majority of our funding is from customer current accounts and customer savings deposits payable on demand or at short notice. This is part of our Group framework, where we have defined the limit for the ratio of advances to deposits to be below 90% (2015: 72%). Given this structural unsecured funding position we have little requirement to fund ourselves in secured markets, and therefore our overall low level of encumbrance reflects this position. However, we do provide collateralised financing services to clients as part of our GB&M business model, providing cash financing or specific securities, and these result in off-balance sheet encumbrance. The other sources which contribute to encumbrance are securities pledged in derivative transactions, mostly for hedging purposes, issuance of asset-backed securities, and covered bond programmes in the UK, France and Australia. HSBC Holdings ALCO reviews the asset encumbrance of the institution as a whole quarterly and any events changing the asset encumbrance level are examined. For details on-balance sheet encumbered and unencumbered assets, please refer to Annual Report and Accounts 2015, page 163.

Capital and Risk Management Pillar 3 Disclosures at 31 December 2015 (continued)
HSBC HOLDINGS PLC
106
Appendix III Table 66: Transitional own funds disclosure
Ref1 Ref2
At 31 December 2015
CRD IV prescribed residual amount
Final CRD IV text
$m $m $m Common equity tier 1 (CET1) capital: instruments and reserves
1 Capital instruments and the related share premium accounts 20,858 – 20,858 of which: ordinary shares a 20,858 – 20,858
2 Retained earnings a 143,976 – 143,9763 Accumulated other comprehensive income (and other reserves) a (453) – (453)5 Minority interests (amount allowed in consolidated CET1) d 3,519 3,519
5a Independently reviewed interim net profits net of any foreseeable charge or dividend (3,717) (3,717)
6 Common equity tier 1 capital before regulatory adjustments 164,183 164,183
Common equity tier 1 capital: regulatory adjustments
7 Additional value adjustments (1,151) (1,151)8 Intangible assets (net of related deferred tax liability) h (20,650) (20,650)
10 Deferred tax assets that rely on future profitability excluding those arising from temporary differences (net of related tax liability)
n(1,204) (1,204)
11 Fair value reserves related to gains or losses on cash flow hedges (52) (52)12 Negative amounts resulting from the calculation of expected loss amounts i (4,920) (4,920)14 Gains or losses on liabilities valued at fair value resulting from changes in own
credit standing (495) (495)15 Defined-benefit pension fund assets g (4,009) (4,009)16 Direct and indirect holdings of own CET1 instruments (839) (839)
Regulatory adjustments applied to common equity tier 1 in respect of amounts subject to pre-CRD IV treatment – –
28 Total regulatory adjustments to Common equity tier 1 (CET1) (33,320) – (33,320)
29 Common equity tier 1 (CET1) capital 130,863 – 130,863
Additional Tier 1 (AT1) capital: instruments
30 Capital instruments and the related share premium accounts 9,261 – 9,26131 of which: classified as equity under applicable accounting standards c, j 9,261 – 9,26133 Amount of qualifying items and the related share premium accounts subject to
phase out from AT1 b, j 8,972 (8,972) – 34 Qualifying tier 1 capital included in consolidated AT1 capital (including minority
interests not included in CET1) issued by subsidiaries and held by third parties d,
e, j 4,388 (4,219) 169 35 of which: instruments issued by subsidiaries subject to phase out e, j 2,842 (2,842) –
36 AT1 capital before regulatory adjustments 22,621 (13,191) 9,430
Additional Tier 1 capital: regulatory adjustments
37 Direct and indirect holdings of own AT1 instruments (60) – (60)41b Residual amounts deducted from Additional Tier 1 capital with regard to deduction
from Tier 2 capital during the transitional period (121) 121
– of which: Direct and indirect holdings by the institution of the T2 instruments and
subordinated loans of financial sector entities where the institution has a significant investment in those entities (121) 121 –
43 Total regulatory adjustments to Additional Tier 1 (AT1) capital (181) 121 (60)
44 Additional Tier 1 (AT1) capital 22,440 (13,070) 9,370
45 Tier 1 capital (T1 = CET1 + AT1) 153,303 (13,070) 140,233
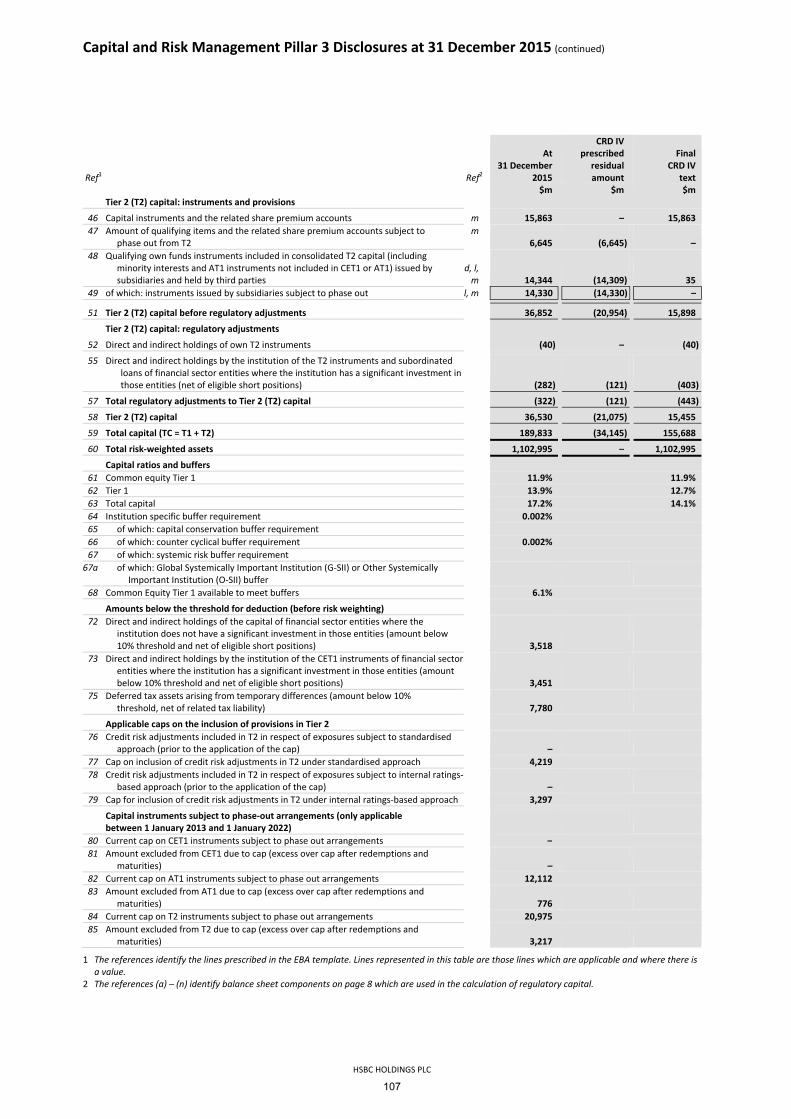
Capital and Risk Management Pillar 3 Disclosures at 31 December 2015 (continued)
HSBC HOLDINGS PLC
107
Ref1 Ref2
At 31 December 2015
CRD IV prescribed residual amount
Final CRD IV text
$m $m $m Tier 2 (T2) capital: instruments and provisions
46 Capital instruments and the related share premium accounts m 15,863 – 15,86347 Amount of qualifying items and the related share premium accounts subject to
phase out from T2 m
6,645 (6,645) – 48 Qualifying own funds instruments included in consolidated T2 capital (including
minority interests and AT1 instruments not included in CET1 or AT1) issued by subsidiaries and held by third parties
d, l, m 14,344 (14,309) 35
49 of which: instruments issued by subsidiaries subject to phase out l, m 14,330 (14,330) –
51 Tier 2 (T2) capital before regulatory adjustments 36,852 (20,954) 15,898
Tier 2 (T2) capital: regulatory adjustments
52 Direct and indirect holdings of own T2 instruments (40) – (40)
55 Direct and indirect holdings by the institution of the T2 instruments and subordinated loans of financial sector entities where the institution has a significant investment in those entities (net of eligible short positions) (282) (121) (403)
57 Total regulatory adjustments to Tier 2 (T2) capital (322) (121) (443)758 Tier 2 (T2) capital 36,530 (21,075) 15,455
59 Total capital (TC = T1 + T2) 189,833 (34,145) 155,688
60 Total risk-weighted assets 1,102,995 – 1,102,995
Capital ratios and buffers 61 Common equity Tier 1 11.9% 11.9%62 Tier 1 13.9% 12.7%63 Total capital 17.2% 14.1%64 Institution specific buffer requirement 0.002% 65 of which: capital conservation buffer requirement 66 of which: counter cyclical buffer requirement 0.002% 67 of which: systemic risk buffer requirement
67a of which: Global Systemically Important Institution (G-SII) or Other Systemically Important Institution (O-SII) buffer
68 Common Equity Tier 1 available to meet buffers 6.1%
Amounts below the threshold for deduction (before risk weighting) 72 Direct and indirect holdings of the capital of financial sector entities where the
institution does not have a significant investment in those entities (amount below 10% threshold and net of eligible short positions) 3,518
73 Direct and indirect holdings by the institution of the CET1 instruments of financial sector entities where the institution has a significant investment in those entities (amount below 10% threshold and net of eligible short positions) 3,451
75 Deferred tax assets arising from temporary differences (amount below 10% threshold, net of related tax liability) 7,780
Applicable caps on the inclusion of provisions in Tier 2 76 Credit risk adjustments included in T2 in respect of exposures subject to standardised
approach (prior to the application of the cap) – 77 Cap on inclusion of credit risk adjustments in T2 under standardised approach 4,219 78 Credit risk adjustments included in T2 in respect of exposures subject to internal ratings-
based approach (prior to the application of the cap) – 79 Cap for inclusion of credit risk adjustments in T2 under internal ratings-based approach 3,297
Capital instruments subject to phase-out arrangements (only applicable between 1 January 2013 and 1 January 2022)
80 Current cap on CET1 instruments subject to phase out arrangements – 81 Amount excluded from CET1 due to cap (excess over cap after redemptions and
maturities) – 82 Current cap on AT1 instruments subject to phase out arrangements 12,112 83 Amount excluded from AT1 due to cap (excess over cap after redemptions and
maturities) 776 84 Current cap on T2 instruments subject to phase out arrangements 20,975 85 Amount excluded from T2 due to cap (excess over cap after redemptions and
maturities) 3,217
1 The references identify the lines prescribed in the EBA template. Lines represented in this table are those lines which are applicable and where there is a value.
2 The references (a) – (n) identify balance sheet components on page 8 which are used in the calculation of regulatory capital.

Capital and Risk Management Pillar 3 Disclosures at 31 December 2015 (continued)
HSBC HOLDINGS PLC
108
CRD IV own funds disclosure requirements determine that firms must provide a detailed disclosure of the nature and amounts of specific items on own funds following an EBA specified uniform template. During the transitional period, the relevant template is the one set out in annex VI of Commission Implementing Regulation 1423/2013, which became applicable from 31 March 2014.
The capital position is presented on a CRD IV transitional basis as implemented by the PRA in the Definition of Capital part of the PRA Rulebook. Where appropriate, additional line items have been included to accommodate certain amounts not captured by the template. We have also
provided additional information in the column, ‘CRD IV prescribed residual amount’, for completeness, to facilitate the reading of the end point capital resources position which results from adding the two columns together.
A list of the features of our capital instruments in accordance with annex III of Commission Implementing Regulation 1423/2013 is also being published on our website with reference to our balance sheet on 31 December 2015. This is in addition to the full terms and conditions of our securities, also available on our website.

Capital and Risk Management Pillar 3 Disclosures at 31 December 2015 (continued)
HSBC HOLDINGS PLC
109
Appendix IV PD, LGD, RWA and exposure by country
The following tables set out the exposure-weighted average PD, exposure-weighted average LGD, RWAs and exposure by the location of the principal operations of the lending subsidiary or, in the case of operations of The Hongkong and Shanghai Banking Corporation, HSBC Bank, HSBC Bank Middle East and HSBC Bank USA, by the location of the lending branch.
Table 67a: PD, LGD, RWA and exposure by country – wholesale IRB advanced approach all asset classes1 Exposure-
weightedaverage PD
Exposure-weighted
average LGD RWAs Exposure
value % % $bn $bnEurope
– UK 2.31 30.5 87.5 209.4– France 3.48 31.4 12.4 28.8– Germany 0.41 41.9 0.3 1.3– Switzerland 0.02 42.8 0.8 15.5– Turkey 0.79 45.1 1.1 1.5
Asia – Hong Kong 0.62 41.7 74.0 262.4– Australia 1.05 42.7 7.1 19.2– India 1.03 54.0 9.3 17.0– Indonesia 7.98 54.5 5.5 6.6– Mainland China 0.92 46.5 28.7 69.6– Malaysia 0.98 47.1 6.4 14.6– Singapore 0.64 42.7 8.7 34.5– Taiwan 0.24 47.9 3.8 16.6
Middle East and North Africa – Egypt 2.14 45.0 5.2 5.3– UAE 0.12 39.0 1.9 10.7
North America – US 0.78 39.2 52.6 139.6– Canada 1.83 38.4 21.7 50.0
Latin America – Argentina 7.11 45.5 2.8 1.7– Brazil 0.48 45.0 6.0 9.5– Mexico 1.44 44.5 2.8 7.5
Table 67b: PD, LGD, RWA and exposure by country – wholesale IRB advanced approach central governments and central banks Exposure-
weightedaverage PD
Exposure-weighted
average LGD RWAs Exposure
value % % $bn $bnEurope
– UK 0.06 45.0 2.2 16.4– France 0.05 45.1 0.3 2.3– Germany 0.10 45.0 0.1 0.6– Switzerland 0.01 45.0 0.6 13.9– Turkey 0.68 45.0 0.9 1.3
Asia – Hong Kong 0.02 45.0 6.4 105.8– Australia 0.01 45.0 0.3 5.7– India 0.13 45.0 2.2 6.3– Indonesia 0.31 45.0 0.6 1.4– Mainland China 0.04 45.0 2.7 21.4– Malaysia 0.05 45.0 0.8 5.4– Singapore 0.01 45.0 0.5 13.0– Taiwan 0.02 45.0 0.6 9.7
Middle East and North Africa – Egypt 2.34 45.0 4.7 4.3– UAE 0.05 45.0 0.6 5.8
North America – US 0.01 45.1 5.5 45.6– Canada 0.02 45.1 2.7 15.9
Latin America – Argentina 7.09 45.0 2.7 1.7– Brazil 0.37 45.0 4.3 7.8– Mexico 0.10 45.0 2.5 6.8

Capital and Risk Management Pillar 3 Disclosures at 31 December 2015 (continued)
HSBC HOLDINGS PLC
110
Table 67c: PD, LGD, RWA and exposure by country – wholesale IRB advanced approach institutions Exposure-
weightedaverage PD
Exposure-weighted
average LGD RWAs Exposure
value % % $bn $bn
Europe – UK 0.35 21.3 3.2 21.0– France 0.25 41.9 0.7 1.6– Germany 0.10 38.1 0.2 0.6– Switzerland 0.05 23.2 0.2 1.6– Turkey 2.25 45.0 0.1 0.1
Asia – Hong Kong 0.06 42.7 4.3 29.6– Australia 0.06 34.1 0.5 2.7– India 0.18 45.2 0.2 0.6– Indonesia – – – –– Mainland China 0.12 45.6 1.9 8.6– Malaysia 0.27 47.5 0.4 1.2– Singapore 0.08 44.0 0.8 5.5– Taiwan 0.08 45.0 0.1 0.5
Middle East and North Africa – Egypt 0.08 45.0 0.1 0.5– UAE 0.09 46.5 0.1 0.3
North America – US 0.23 41.0 2.0 5.2– Canada 0.06 28.2 0.3 2.3
Latin America – Argentina – – – –– Brazil 0.97 45.1 1.7 1.7– Mexico 0.26 45.0 0.2 0.3
Table 67d: PD, LGD, RWA and exposure by country – wholesale IRB advanced approach corporates1 Exposure-
weightedaverage PD
Exposure-weighted
average LGD RWAs Exposure
value % % $bn $bn
Europe – UK 2.77 30.2 82.1 172.0– France 4.00 29.4 11.4 24.9– Germany 0.77 47.7 – 0.1– Switzerland – – – –– Turkey 0.73 45.7 0.1 0.1
Asia – Hong Kong 1.25 38.7 63.3 127.0– Australia 1.85 43.7 6.3 10.8– India 1.63 60.0 6.9 10.1– Indonesia 10.04 57.0 4.9 5.2– Mainland China 1.56 47.5 24.1 39.6– Malaysia 1.72 48.4 5.2 8.0– Singapore 1.34 40.3 7.4 16.0– Taiwan 0.57 52.4 3.1 6.4
Middle East and North Africa – Egypt 2.58 45.2 0.4 0.5– UAE 0.20 30.8 1.2 4.6
North America – US 1.21 36.1 45.1 88.8– Canada 2.86 35.8 18.7 31.8
Latin America – Argentina 8.84 80.8 0.1 –– Brazil – – – –– Mexico 22.57 37.0 0.1 0.4

Capital and Risk Management Pillar 3 Disclosures at 31 December 2015 (continued)
HSBC HOLDINGS PLC
111
Table 67e: PD, LGD, RWA and exposure by country – wholesale IRB foundation approach all asset classes Exposure-
weightedaverage PD
Exposure-weighted
average LGD RWAs Exposure
value % % $bn $bn
Europe – UK 2.22 41.4 5.2 8.9– France 5.36 45.0 0.2 0.2– Germany 1.04 44.7 10.5 16.2– Switzerland – – – –– Turkey – – – –
Asia – Hong Kong – – – –– Australia – – – –– India – – – –– Indonesia – – – –– Mainland China – – – –– Malaysia – – – –– Singapore – – – –– Taiwan – – – –
Middle East and North Africa – Egypt – – – –– UAE 2.44 44.2 8.1 12.4
North America – US – – – –– Canada – – – –
Latin America – Argentina – – – –– Brazil – – – –– Mexico – – – –
Table 67f: PD, LGD, RWA and exposure by country – wholesale IRB foundation approach central governments and central banks Exposure-
weightedaverage PD
Exposure-weighted
average LGD RWAs Exposure
value % % $bn $bn
Europe – UK – – – –– France – – – –– Germany – – – –– Switzerland – – – –– Turkey – – – –
Asia – Hong Kong – – – –– Australia – – – –– India – – – –– Indonesia – – – –– Mainland China – – – –– Malaysia – – – –– Singapore – – – –– Taiwan – – – –
Middle East and North Africa – Egypt – – – –– UAE 0.04 45.0 – 0.1
North America – US – – – –– Canada – – – –
Latin America – Argentina – – – –– Brazil – – – –– Mexico – – – –

Capital and Risk Management Pillar 3 Disclosures at 31 December 2015 (continued)
HSBC HOLDINGS PLC
112
Table 67g: PD, LGD, RWA and exposure by country – wholesale IRB foundation approach institutions Exposure-
weightedaverage PD
Exposure-weighted
average LGD RWAs Exposure
value % % $bn $bn
Europe – UK – – – –– France – – – –– Germany – – – –– Switzerland – – – –– Turkey – – – –
Asia – Hong Kong – – – –– Australia – – – –– India – – – –– Indonesia – – – –– Mainland China – – – –– Malaysia – – – –– Singapore – – – –– Taiwan – – – –
Middle East and North Africa – Egypt – – – –– UAE 0.29 45.0 0.1 0.3
North America – US – – – –– Canada – – – –
Latin America – Argentina – – – –– Brazil – – – –– Mexico – – – –
Table 67h: PD, LGD, RWA and exposure by country – wholesale IRB foundation approach corporates Exposure-
weightedaverage PD
Exposure-weighted
average LGD RWAs Exposure
value % % $bn $bn
Europe – UK 2.22 41.4 5.2 8.9– France 5.36 45.0 0.2 0.2– Germany 1.04 44.7 10.5 16.2– Switzerland – – – –– Turkey – – – –
Asia – Hong Kong – – – –– Australia – – – –– India – – – –– Indonesia – – – –– Mainland China – – – –– Malaysia – – – –– Singapore – – – –– Taiwan – – – –
Middle East and North Africa – Egypt – – – –– UAE 2.50 44.2 8.0 12.0
North America – US – – – –– Canada – – – –
Latin America – Argentina – – – –– Brazil – – – –– Mexico – – – –

Capital and Risk Management Pillar 3 Disclosures at 31 December 2015 (continued)
HSBC HOLDINGS PLC
113
Table 67i: PD, LGD, RWA and exposure by country – retail IRB approach all asset classes Exposure-
weightedaverage PD
Exposure-weighted
average LGD RWAs Exposure
value % % $bn $bn
Europe – UK 1.58 30.8 21.8 182.6– France 5.61 15.1 3.1 23.7– Germany – – – –– Switzerland 0.80 2.7 0.3 10.1– Turkey –
Asia – Hong Kong 0.94 39.0 18.2 97.5– Australia 0.84 10.9 0.6 10.7– India – – – –– Indonesia – – – –– Mainland China – – – –– Malaysia 3.57 12.3 1.0 4.7– Singapore 0.69 21.2 1.4 8.2– Taiwan 1.21 11.2 0.4 3.9
Middle East and North Africa – Egypt – – – –– UAE – – – –
North America – US 12.05 64.0 43.7 42.1– Canada 1.04 19.8 2.4 18.0
Latin America – Argentina – – – –– Brazil – – – –– Mexico – – – –
Table 67j: PD, LGD, RWA and exposure by country – retail IRB approach – retail secured by mortgages on immovable property non-SME Exposure-
weightedaverage PD
Exposure-weighted
average LGD RWAs Exposure
value % % $bn $bn
Europe – UK 1.32 12.5 7.1 134.2– France 7.21 13.5 0.4 2.5– Germany – – – –– Switzerland – – – –– Turkey – – – –
Asia – Hong Kong 0.76 10.0 8.9 59.7– Australia 0.84 10.9 0.6 10.7– India – – – –– Indonesia – – – –– Mainland China – – – –– Malaysia 3.57 12.3 1.0 4.7– Singapore 0.69 21.2 1.4 8.2– Taiwan 1.21 11.2 0.4 3.9
Middle East and North Africa – Egypt – – – –– UAE – – – –
North America – US 13.68 58.1 38.2 34.3– Canada 0.93 17.5 1.8 15.8
Latin America – Argentina – – – –– Brazil – – – –– Mexico – – – –

Capital and Risk Management Pillar 3 Disclosures at 31 December 2015 (continued)
HSBC HOLDINGS PLC
114
Table 67k: PD, LGD, RWA and exposure by country – retail IRB approach retail secured by mortgages on immovable property SME Exposure-
weightedaverage PD
Exposure-weighted
average LGD RWAs Exposure
value % % $bn $bn
Europe – UK – – – –– France 8.01 18.8 0.5 2.0– Germany – – – –– Switzerland – – – –– Turkey – – – –
Asia – Hong Kong 0.99 11.1 – 0.6– Australia – – – –– India – – – –– Indonesia – – – –– Mainland China – – – –– Malaysia – – – –
– Singapore – – – –– Taiwan – – – –
Middle East and North Africa – Egypt – – – –– UAE – – – –
North America – US – – – –– Canada 2.21 30.7 0.1 0.3
Latin America – Argentina – – – –– Brazil – – – –– Mexico – – – –
Table 67l: PD, LGD, RWA and exposure by country – retail IRB approach retail QRRE Exposure-
weightedaverage PD
Exposure-weighted
average LGD RWAs Exposure
value % % $bn $bn
Europe – UK 1.17 85.2 6.1 33.2– France – – – –– Germany – – – –– Switzerland – – – –– Turkey – – – –
Asia – Hong Kong 1.11 100.1 8.0 30.6– Australia – – – –– India – – – –– Indonesia – – – –– Mainland China – – – –– Malaysia – – – –– Singapore – – – –– Taiwan – – – –
Middle East and North Africa – Egypt – – – –– UAE – – – –
North America – US 1.49 93.7 1.0 3.6– Canada 2.91 61.2 0.1 0.4
Latin America – Argentina – – – –– Brazil – – – –– Mexico – – – –

Capital and Risk Management Pillar 3 Disclosures at 31 December 2015 (continued)
HSBC HOLDINGS PLC
115
Table 67m: PD, LGD, RWA and exposure by country – retail IRB approach other SME Exposure-
weightedaverage PD
Exposure-weighted
average LGD RWAs Exposure
value % % $bn $bn
Europe – UK 7.07 66.0 4.7 8.1– France 16.46 26.5 0.9 3.5– Germany – – – –– Switzerland – – – –– Turkey – – – –
Asia – Hong Kong 0.13 10.8 – 0.1– Australia – – – –– India – – – –– Indonesia – – – –– Mainland China – – – –– Malaysia – – – –– Singapore – – – –– Taiwan – – – –
Middle East and North Africa – Egypt – – – –– UAE – – – –
North America – US 1.82 95.7 0.1 0.1– Canada 4.31 47.3 0.1 0.2
Latin America – Argentina – – – –– Brazil – – – –– Mexico – – – –
Table 67n: PD, LGD, RWA and exposure by country – retail IRB approach other non-SME Exposure-
weightedaverage PD
Exposure-weighted
average LGD RWAs Exposure
value % % $bn $bn
Europe – UK 2.18 83.2 3.9 7.1– France 2.63 12.4 1.3 15.7– Germany – – – –– Switzerland 0.80 2.7 0.3 10.1– Turkey – – – –
Asia – Hong Kong 1.85 21.1 1.3 6.5– Australia – – – –– India – – – –– Indonesia – – – –– Mainland China – – – –– Malaysia – – – –– Singapore – – – –– Taiwan – – – –
Middle East and North Africa – Egypt – – – –– UAE – – – –
North America – US 8.11 85.7 4.4 4.1– Canada 0.99 28.1 0.3 1.3
Latin America – Argentina – – – –– Brazil – – – –– Mexico – – – –
1 Excludes specialised lending exposures subject to supervisory slotting approach.

Capital and Risk Management Pillar 3 Disclosures at 31 December 2015 (continued)
HSBC HOLDINGS PLC
116
Appendix V Summary of disclosures withheld due to their immateriality, confidentiality or proprietary nature
CRD IV reference Description Rationale
438(e) and 445 Capital requirements – Own funds requirements for settlement risk.
Materiality Settlement risk arises where certain transactions are unsettled after their due delivery date and is required to be separately disclosed. However, as settlement risk RWAs are not material and included within counterparty credit risk, they have not been separately disclosed.
442(c) Credit Risk Adjustments – In relation to exposure to credit risk and dilution risk, the total amount of exposures after accounting offsets and without taking into account the effects of credit risk mitigation.
Materiality The disclosure has been made after taking into account the effects of credit risk mitigation; there are no significant differences between exposures pre and post credit risk mitigation at exposure class level.
448(a) Key assumptions (including assumptions regarding loan prepayments and behaviour of non-maturity deposits) on their exposure to interest rate risk on positions not included in the trading book.
Proprietary Assumptions regarding fixed term loan repayments and term behaviouralisation of non-maturity deposits and capital drive HSBC’s structural interest rates positioning and market hedging requirements. Disclosure could give key business strategy information to our competitors.

Capital and Risk Management Pillar 3 Disclosures at 31 December 2015 (continued)
HSBC HOLDINGS PLC
117
Appendix VI Glossary
Term Definition
A
Additional valuation adjustment See ‘Prudent valuation adjustment’.
Arrears Customers are said to be in arrears (or in a state of delinquency) when they are behind in fulfilling their obligations, with the result that an outstanding loan is unpaid or overdue. When a customer is in arrears, the total outstanding loans on which payments are overdue are described as delinquent.
Asset-backed securities (‘ABS’s)
Securities that represent an interest in an underlying pool of referenced assets. The referenced pool can comprise any assets which attract a set of associated cash flows but are commonly pools of residential or commercial mortgages.
Available-for-sale (‘AFS’) Those non-derivative financial assets that are designated as available for sale or are not classified as a) loans and receivables b) held-to-maturity investments or c) financial assets at fair value through profit or loss.
B
Back-testing A statistical technique used to monitor and assess the accuracy of a model, and how that model would have performed had it been applied in the past.
Bail-in Bail-in refers to the imposition of losses at the point of non-viability (but before insolvency) on bank liabilities (bail-inable debt) that are not exposed to losses while the institution remains a viable, going concern. Whether by way of write-down or conversion into equity, this has the effect of recapitalising the bank (although it does not provide any new funding).
Bank Recovery and Resolution Directive
A European legislative package issued by the European Commission and adopted by EU Member States. This directive was finalised in July 2014 and the majority of provisions came into effect on 1 January 2015. This introduces a common EU framework for how authorities should intervene to address banks which are failing or are likely to fail. The framework includes early intervention and measures designed to prevent failure and in the event of bank failure for authorities to ensure an orderly resolution.
Basel II The capital adequacy framework issued by the Basel Committee in June 2006 in the form of the ‘International Convergence of Capital Measurement and Capital Standards’, amended by subsequent changes to the capital requirements for market risk and re-securitisations, commonly known as Basel 2.5, which took effect from 31 December 2011.
Basel III In December 2010, the Basel Committee issued ‘Basel III rules: a global regulatory framework for more resilient banks and banking systems’ and ‘International framework for liquidity risk measurement, standards and monitoring’. Together these documents present the Basel Committee’s reforms to strengthen global capital and liquidity rules with the goal of promoting a more resilient banking sector. In June 2011, the Basel Committee issued a revision to the former document setting out the finalised capital treatment for counterparty credit risk in bilateral trades.
Basis risk The risk that prices of offsetting financial instruments in a hedging strategy will not move in entirely opposite directions from each other. There is therefore a risk that the imperfect correlation between the instruments used for the hedging strategy produces an overall gain or loss.
C
Capital conservation buffer (‘CCB’) A capital buffer prescribed by regulators under Basel III and designed to ensure banks build up capital buffers outside periods of stress which can be drawn down as losses are incurred. Should a bank’s CET1 capital fall within the capital conservation buffer range, capital distributions will be constrained by the regulators.
Capital required Capital required represents the Pillar 1 capital charge calculated at 8% of RWAs.
Capital Requirements Directive (‘CRD’) A capital adequacy legislative package adopted by EU member states. The CRD IV package comprises a recast Capital Requirements Directive and a new Capital Requirements Regulation. The package implements the Basel III capital proposals together with transitional arrangements for some of its requirements. CRD IV came into force on 1 January 2014.
Capital resources Capital held on balance sheet that is eligible to satisfy capital requirements.
CET 1 ratio A Basel III measure of CET 1 capital expressed as percentage of total risk exposure amount.

Capital and Risk Management Pillar 3 Disclosures at 31 December 2015 (continued)
HSBC HOLDINGS PLC
118
Term Definition
Commercial paper An unsecured, short-term debt instrument issued by a corporation, typically for the financing of accounts receivable, inventories and meeting short-term liabilities. The debt is usually issued at a discount, reflecting prevailing market interest rates.
Commercial real estate (‘CRE’) Any real estate, comprising buildings or land, intended to generate a profit, either from capital gain or rental income.
Comprehensive risk measure The comprehensive risk measure model covers all positions that are part of the correlation trading portfolio. Comprehensive risk measure covers all price risks including spread, default and migration. Like incremental risk charge, it is calibrated to a 99.9 percentile loss and a one-year capital horizon to generate a capital add-on to VAR.
Conduits HSBC sponsors and manages multi-seller conduits and SICs. The multi-seller conduits hold interests in diversified pools of third-party assets such as vehicle loans, trade receivables and credit card receivables funded through the issuance of short-dated commercial paper and supported by a liquidity facility. The SICs hold predominantly asset-backed securities referencing such items as commercial and residential mortgages, vehicle loans and credit card receivables funded through the issuance of both long-term and short-term debt.
Consumer and Mortgage Lending (‘CML’)
In the US, the CML portfolio consists of our Consumer Lending and Mortgage Services businesses, which are in run-off.
The Consumer Lending business offered secured and unsecured loan products, such as first and second lien mortgage loans, open-ended home equity loans and personal non-credit card loans through branch locations and direct mail. The majority of the mortgage lending products were for refinancing and debt consolidation rather than home purchases. In the first quarter of 2009, we discontinued all originations by our Consumer Lending business.
Prior to the first quarter of 2007, when we ceased loan purchase activity, the Mortgage Services business purchased non-conforming first and second lien real estate secured loans from unaffiliated third parties. The business also included the operations of Decision One Mortgage Company (‘Decision One’), which historically originated mortgage loans sourced by independent mortgage brokers and sold these to secondary market purchasers. Decision One ceased originations in September 2007.
Countercyclical capital buffer (‘CCyB’) A capital buffer prescribed by regulators under Basel III which aims to ensure that capital requirements take account of the macro-financial environment in which banks operate. This will provide the banking sector with additional capital to protect it against potential future losses, when excess credit growth in the financial system as a whole is associated with an increase in system-wide risk.
Counterparty credit risk (‘CCR’) Counterparty credit risk, in both the trading and non-trading books, is the risk that the counterparty to a transaction may default before completing the satisfactory settlement of the transaction.
Credit Conversion Factor (‘CCF’) CCFs are used in determining the EAD in relation to credit risk exposures. The CCF is an estimate of the proportion of undrawn commitments expected to have been drawn down at the point of default.
Credit default swap (‘CDS’) A derivative contract whereby a buyer pays a fee to a seller in return for receiving a payment in the event of a defined credit event (e.g. bankruptcy, payment default on a reference asset or assets, or downgrades by a rating agency) on an underlying obligation (which may or may not be held by the buyer).
Credit enhancements Facilities used to enhance the creditworthiness of financial obligations and cover losses due to asset default.
Credit quality step A step in the CRD IV credit quality assessment scale which is based on the credit ratings of ECAIs. It is used to assign risk weights under the standardised approach.
Credit risk Risk of financial loss if a customer or counterparty fails to meet an obligation under a contract. It arises mainly from direct lending, trade finance and leasing business but also from products such as guarantees, derivatives and debt securities.
Credit risk adjustment (‘CRA’) Credit risk adjustments are all amounts by which CET1 has been reduced in order to reflect losses exclusively related to credit risk under IFRSs, resulting from impairments, value adjustments or provisions for off-balance sheet items that are recognised in the profit or loss account.
Credit risk mitigation A technique to reduce the credit risk associated with an exposure by application of credit risk mitigants such as collateral, guarantees and credit protection.
Credit spread risk The risk that movements in credit spreads will affect the value of financial instruments.
Credit Support Annex (‘CSA’) A legal document that regulates credit support (collateral) for OTC derivative transactions between two parties.

Capital and Risk Management Pillar 3 Disclosures at 31 December 2015 (continued)
HSBC HOLDINGS PLC
119
Term Definition
Credit valuation adjustment (‘CVA’) An adjustment to the valuation of derivative contracts to reflect the creditworthiness of derivative counterparties.
Customer risk rating (‘CRR’) An internal scale of 23 grades measuring obligor PD.
CVA risk capital charge A capital charge under CRD IV to cover the risk of mark-to-market losses on expected counterparty risk to derivatives.
D
Debit valuation adjustment An adjustment made by an entity to the valuation of OTC derivative liabilities to reflect within fair value the entity’s own credit risk.
Debt securities Financial assets on the Group’s balance sheet representing certificates of indebtedness of credit institutions, public bodies or other undertakings, excluding those issued by central banks.
Delinquency See ‘Arrears’.
E
Economic capital The internally calculated capital requirement which is deemed necessary by HSBC to support the risks to which it is exposed.
Economic Value of Equity (‘EVE’) sensitivity
Considers all re-pricing mismatches in the current balance sheet and calculates the change in market value that would result from a set of defined interest rate shocks.
Equity risk The risk arising from positions, either long or short, in equities or equity-based instruments, which create exposure to a change in the market price of the equities or equity instruments.
Expected loss (‘EL’) A regulatory calculation of the amount expected to be lost on an exposure using a 12-month time horizon and downturn loss estimates. EL is calculated by multiplying the PD (a percentage) by the EAD (an amount) and LGD (a percentage).
Exposure A claim, contingent claim or position which carries a risk of financial loss.
Exposure at default (‘EAD’) Under the standardised approach, the amount expected to be outstanding after any credit risk mitigation, if and when the counterparty defaults. Under IRB, the amount outstanding if and when the counterparty defaults.
EAD reflects drawn balances as well as allowance for undrawn amounts of commitments and contingent exposures.
Exposures in default ‘Exposures in default’ is an exposure class under the standardised approach to credit risk. A financial asset falls into this exposure class if it is more than 90/180 days past due or the obligor is deemed unlikely to pay his credit obligations. A financial asset such as a loan is past due when the counterparty has failed to make a payment when contractually due.
Exposure value Exposure at default.
External Credit Assessment Institutions (‘ECAI’)
ECAIs include external credit rating agencies such as Standard & Poor’s, Moody’s and Fitch.
F
Fair value Fair value is the price that would be received to sell an asset or paid to transfer a liability in an orderly transaction between market participants at the measurement date.
Financial collateral comprehensive method
This method applies a volatility adjustment (or ‘haircut’) to the value of the collateral to allow for the fact that the collateral taken may fall in value when it comes to taking control of the collateral and selling it. This adjusted collateral value is then subtracted from the exposure to create an ‘adjusted exposure’. Firms on the standardised approach will then apply the risk weight of the borrower to the adjusted exposure value, while firms using foundation IRB make a formulaic adjustment to the LGD number which has a similar effect. To calculate these ‘haircuts’, the firm can use either a table of supervisory numbers or its own numbers if it meets certain requirements.
Financial Conduct Authority The Financial Conduct Authority regulates the conduct of financial firms and, for certain firms, prudential standards in the UK. It has a strategic objective to ensure that the relevant markets function well.
Financial Policy Committee (‘FPC’) The Financial Policy Committee, at the Bank of England, is charged with a primary objective of identifying, monitoring and taking action to remove or reduce systemic risks with a view to protecting and enhancing the resilience of the UK financial system. The FPC has a secondary objective to support the economic policy of the UK Government.

Capital and Risk Management Pillar 3 Disclosures at 31 December 2015 (continued)
HSBC HOLDINGS PLC
120
Term Definition
G
Global Systemically Important Bank (‘G-SIB’)
The FSB established in November 2011 a methodology to identify G-SIBs based on 12 principal indicators. Designation will result in the application of a CET1 buffer between 1% and 3.5%, to be phased in by 1 January 2019.
The list of G-SIBs is re-assessed through annual re-scoring of banks and a triennial review of the methodology. National regulators have discretion to introduce higher charges than the minima. In CRD IV this is implemented via the Global Systemically Important Institutions (G-SII) Buffer.
The requirements, initially for those banks identified in November 2014 as G-SIBs, are being phased in from 1 January 2016, becoming fully effective on 1 January 2019. National regulators have discretion to introduce higher thresholds than the minima.
H
Haircut A discount applied by management when determining the amount at which an asset can be realised. The discount takes into account the method of realisation including the extent to which an active market for the asset exists. With respect to credit risk mitigation, a downward adjustment to collateral value to reflect any currency or maturity mismatches between the credit risk mitigant and the underlying exposure to which it is being applied. Also a valuation adjustment to reflect any fall in value between the date the collateral was called and the date of liquidation or enforcement.
Held-to-maturity An accounting classification for investments acquired with the intention and ability of being held until they mature.
I
Impaired loans Loans where the Group does not expect to collect all the contractual cash flows or expects to collect them later than they are contractually due.
Impairment allowances Management’s best estimate of losses incurred in the loan portfolios at the balance sheet date.
Impairment charge Impairment charges represent a movement in the impairment allowance balance during the year, reflecting loss events which occurred during the financial year and changes in estimates of losses arising on events which occurred prior to the current year.
Incremental risk charge (‘IRC’) The IRC model captures the potential distribution of profit and loss due to default and migration for a portfolio of credit positions. For credit positions held on the trading book, and subject to specific interest rate risk VAR for regulatory capital, an IRC based on the 99.9th percentile of the IRC distribution, over a one-year capital horizon, is used as a capital add-on to VAR.
Institutions Under the standardised approach, Institutions comprise credit institutions or investment firms. Under the IRB approach, Institutions also include regional governments and local authorities, public sector entities and multilateral development banks.
Insurance risk A risk, other than financial risk, transferred from the holder of a contract to the insurance provider. The principal insurance risk is that, over time, the combined cost of claims, administration and acquisition of the contract may exceed the aggregate amount of premiums received and investment income.
Interest rate risk Exposure to adverse movements in interest rates. Accepting this risk is a normal part of banking and can be an important source of profitability and shareholder value.
Internal Assessment Approach (‘IAA’)
One of three calculation methods defined under the IRB approach for securitisations.
Internal Capital Adequacy Assessment Process (‘ICAAP’)
The Group’s own assessment of the levels of capital that it needs to hold through an examination of its risk profile from regulatory and economic capital viewpoints.
Internal Model Method (‘IMM’) One of three approaches defined in the Basel framework to determine exposure values for counterparty credit risk.
Internal ratings-based approach (‘IRB’)
A method of calculating credit risk capital requirements using internal, rather than supervisory, estimates of risk parameters.
IRB advanced approach A method of calculating credit risk capital requirements using internal PD, LGD and EAD models.
IRB foundation approach A method of calculating credit risk capital requirements using internal PD models but with supervisory estimates of LGD and conversion factors for the calculation of EAD.
L
Leverage ratio A measure which is the ratio of tier 1 capital to total exposures. Total exposures include on-balance sheet items, off-balance sheet items and derivatives, and should generally follow the accounting measure of exposure. This supplementary measure to the risk-based capital requirements is intended to constrain the build-up of excess leverage in the banking sector.

Capital and Risk Management Pillar 3 Disclosures at 31 December 2015 (continued)
HSBC HOLDINGS PLC
121
Term Definition
Liquidity risk The risk that HSBC does not have sufficient financial resources to meet its obligations as they fall due, or will have to do so at an excessive cost. This risk arises from mismatches in the timing of cash flows.
Loss given default (‘LGD’) The estimated ratio (percentage) of the loss on an exposure to the amount outstanding at default (‘EAD’) upon default of a counterparty.
M
Market risk The risk that movements in market risk factors, including foreign exchange rates and commodity prices, interest rates, credit spreads and equity prices will reduce income or portfolio values.
Mark-to-market approach One of three approaches to determine exposure values for counterparty credit risk.
Minimum capital requirement The minimum amount of regulatory capital that a financial institution must hold to meet the Pillar 1 requirements for credit, market and operational risk. Also see ‘capital required’.
Model validation The process of assessing how well a credit risk model performs using a predefined set of criteria including the discriminatory power of the model, model accuracy, the appropriateness of the inputs and expert opinion.
Multilateral Development Bank (‘MDB’) An institution created by a group of countries to provide financing for the purpose of development. Under the standardised approach to credit risk, eligible multilateral development banks attract a zero per cent risk weight.
N
Net interest income The amount of interest received or receivable on assets net of interest paid or payable on liabilities.
O
Obligor grade Obligor grades, summarising a more granular underlying counterparty risk rating scale for estimates of PD, are defined as follows:
• ‘Minimal Default Risk’: The strongest credit risk, with a negligible PD. • ‘Low Default Risk’: A strong credit risk, with a low PD. • ‘Satisfactory Default Risk’: A good credit risk, with a satisfactory PD. • ‘Fair Default Risk’: The risk of default remains fair, but identified weaknesses may warrant
more regular monitoring. • ‘Moderate Default Risk’: The overall position will not be causing any immediate concern,
but more regular monitoring will be necessary as a result of sensitivities to external events that give rise to the possibility of risk of default increasing.
• ‘Significant Default Risk’: Performance may be limited by one or more troublesome aspects, known deterioration, or the prospect of worsening financial status. More regular monitoring required.
• ‘High Default Risk’: Continued deterioration in financial status, that requires frequent monitoring and ongoing assessment. The PD is of concern but the borrower currently has the capacity to meet its financial commitments.
• ‘Special Management’: The PD is of increasing concern and the borrower’s capacity to fully meet its financial commitments is becoming increasingly less likely.
• ‘Default’: A default is considered to have occurred with regard to a particular obligor when either or both of the following events has taken place: the Group considers that the obligor is unlikely to pay its credit obligations in full, without recourse by the Group to actions such as realising security; or the obligor is past due more than 90 days, (90 days to 180 days for retail), on any material credit obligation to the Group.
Operational risk The risk of loss resulting from inadequate or failed internal processes, people and systems, or from external events, including legal risk.
Original exposure Original exposure is the exposure value without taking into account value adjustments and provisions, credit conversion factors and the effect of credit risk mitigation techniques.
Over-the-counter (‘OTC’) A bilateral transaction (e.g. derivatives) that is not exchange traded and that is valued using valuation models.
P
Pillar 1 Minimum capital requirements – the calculation of regulatory capital for credit, market, and operational risk.
Pillar 2 The supervisory review process – sets out the process by which a bank should review its overall capital adequacy and the processes under which the supervisors evaluate how well financial institutions are assessing their risks and take appropriate actions in response to the assessments.

Capital and Risk Management Pillar 3 Disclosures at 31 December 2015 (continued)
HSBC HOLDINGS PLC
122
Term Definition
Pillar 3 Market discipline – sets out the disclosure requirements for banks to publish certain details of their risks, capital and risk management, with the aim of strengthening market discipline.
Point-in-time (‘PIT’) Estimates of PD (or other measures) generally covering a short time horizon (usually a 12-month period) and that are sensitive to changes in the economic cycle. This differs from a TTC basis which uses long run average economic and risk data to reduce such sensitivity.
Potential future exposure (‘PFE’)
The potential future credit exposure on derivatives contracts, calculated using the mark-to-market approach.
PRA Standard rules The method prescribed by the PRA for calculating market risk capital requirements in the absence of VaR model approval.
Present value of in-force long-term insurance business
An asset representing the present value of the equity holders’ interest in the issuing insurance companies’ profits, expected to emerge from long-term insurance business or long-term investment contracts with discretionary participating features, written at the balance sheet date.
Private equity investments Equity securities in operating companies not quoted on a public exchange, often involving the investment of capital in private companies or the acquisition of a public company that results in its delisting.
Probability of default (‘PD’) The probability that an obligor will default within one year.
Prudential Regulation Authority (‘PRA’) The Prudential Regulation Authority in the UK is responsible for prudential regulation and supervision of banks, building societies, credit unions, insurers and major investment firms.
Prudent Valuation Adjustment (‘PVA’) A deduction from common equity tier 1 capital where the prudent value of trading assets or other financial assets measured at fair value is materially lower than the fair value recognised in the financial statements.
Q
Qualifying revolving retail exposures Retail IRB exposures that are revolving, unsecured, and, to the extent they are not drawn, immediately and unconditionally cancellable, such as credit cards.
R
Ratings Based Method (‘RBM’) One of three calculation methods defined under the IRB approach to securitisations. The approach uses risk weightings based on ECAI ratings, the granularity of the underlying pool and the seniority of the position and whether it is a re-securitisation.
Reference PD HSBC’s master CRR scale has been constructed using a set of PD points, falling at regular intervals along an exponential PD curve and determining the boundaries of 23 CRR bands. Reference PDs have been determined, which for most bands fall mid-way between that band’s boundary PD points. The determination of the bands and corresponding reference PDs takes into account the need to avoid concentration in any one band, and to ensure effective mapping to risk management portfolio quality scales.
Regulatory capital The capital which HSBC holds, determined in accordance with CRD IV as implemented by the PRA for the consolidated Group and by local regulators for individual Group companies.
Repo/reverse repo (or sale and repurchase agreement)
A short-term funding agreement that allows a borrower to create a collateralised loan by selling a financial asset to a lender. As part of the agreement the borrower commits to repurchase the security at a date in the future repaying the proceeds of the loan. For the party on the other end of the transaction (buying the security and agreeing to sell in the future) it is a reverse repurchase agreement or a reverse repo.
Re-securitisation A securitisation exposure, where the risk associated with an underlying pool of exposures is tranched and at least one of the underlying exposures is a securitisation exposure.
Residual maturity The period outstanding from the reporting date to the maturity or end date of an exposure.
Retail Internal Ratings Based (‘Retail IRB’) approach
Retail exposures that are treated under the IRB approach.
Return on equity Profit attributable to ordinary shareholders of the parent company divided by average ordinary shareholders’ equity.
Risk appetite The aggregate level and types of risk a firm is willing to assume within its risk capacity to achieve its strategic objectives and business plan.
Risk-weighted assets (‘RWAs’) Calculated by assigning a degree of risk expressed as a percentage (risk weight) to an exposure value.
Run-off portfolios Legacy credit in GB&M, the US CML portfolio and other US run-off portfolios, including the treasury services related to the US CML businesses and commercial operations in run-off. Origination of new business in the run-off portfolios has been discontinued and balances are being managed down through attrition and sale.

Capital and Risk Management Pillar 3 Disclosures at 31 December 2015 (continued)
HSBC HOLDINGS PLC
123
Term Definition
RWA density The average risk weight, expressed as a percentage of RWAs divided by exposure value, based on those RWA and exposure value numbers before they are rounded to the nearest $0.1bn for presentation purposes.
S Securities Financing Transactions (‘SFT’) A repurchase or reverse repurchase transaction, a securities or commodities lending or borrowing
transaction, or a margin lending transaction.
Securitisation A transaction or scheme whereby the credit risk associated with an exposure, or pool of exposures, is tranched and where payments to investors in the transaction or scheme are dependent upon the performance of the exposure or pool of exposures.
A traditional securitisation involves the transfer of the exposures being securitised to a SPE which issues securities. In a synthetic securitisation, the tranching is achieved by the use of credit derivatives and the exposures are not removed from the balance sheet of the originator.
Securitisation position Securitisation position means an exposure to a securitisation.
Six filters An internal measure designed to improve capital deployment across the Group. Five of the filters examine the strategic relevance of each business in each country, in terms of connectivity and economic development, and the current returns, in terms of profitability, cost efficiency and liquidity. The sixth filter requires adherence to global risk standards.
Specialised lending exposure Specialised lending exposures are defined as exposures to an entity which was created specifically to finance and/or operate physical assets, where the contractual arrangements give the lender a substantial degree of control over the assets and the income that they generate and the primary source of repayment of the obligation is the income generated by the assets being financed, rather than the independent capacity of a broader commercial enterprise.
Special Purpose Entity (‘SPE’) A corporation, trust or other non-bank entity, established for a narrowly defined purpose, including for carrying on securitisation activities. The structure of the SPE and its activities are intended to isolate its obligations from those of the originator and the holders of the beneficial interests in the securitisation.
Standardised approach (‘STD’) In relation to credit risk, a method for calculating credit risk capital requirements using rating agencies and supervisory risk weights.
In relation to operational risk, a method of calculating the operational capital requirement by the application of a supervisory defined percentage charge to the gross income of eight specified business lines.
Stressed VaR A market risk measure based on potential market movements for a continuous one-year period of stress for a trading portfolio.
Subordinated liabilities Liabilities which rank after the claims of other creditors of the issuer in the event of insolvency or liquidation.
Supervisory Formula Method (‘SFM’)
An alternative Ratings Based Method to be used primarily on HSBC sponsored securitisations. It is used to calculate the capital requirements of exposures to a securitisation as a function of the collateral pool and contractual properties of the tranche or tranches retained.
Supervisory slotting approach A method for calculating capital requirements for specialised lending exposures where the internal rating of the obligor is mapped to one of five supervisory categories, each associated with a specific supervisory risk weight.
Systemic Risk Buffer (‘SRB’) A capital buffer prescribed in the EU under CRD IV, to address risks in the financial sector as a whole, or one or more sub-sectors, to be deployed as necessary by each EU member state with a view to mitigate structural macro-prudential risk. In the UK this was transposed in January 2015 and is intended to apply to ring-fenced banks and building societies over a certain threshold.
T
Through-the-cycle (‘TTC’) A rating methodology which seeks to take cyclical volatility out of the estimation of default risk by assessing a borrower's performance over the business cycle.
Tier 1 capital A component of regulatory capital, as defined in CRD IV, comprising common equity tier 1 and additional tier 1. Additional tier 1 includes eligible non-common equity capital securities and any related share premium.
Tier 2 capital A component of regulatory capital, as defined in CRD IV, comprising eligible capital securities and any related share premium.
Total Loss Absorbing Capacity (‘TLAC’) Requirements set out by the FSB for global systemically important banks to have a sufficient amount of specific types of liabilities which can be used to absorb losses and recapitalise a bank in resolution. These requirements were finalised in November 2015 and are intended to facilitate an orderly resolution that minimises any impact on financial stability, ensures the continuity of critical functions, and avoids exposing taxpayers to loss.

Capital and Risk Management Pillar 3 Disclosures at 31 December 2015 (continued)
HSBC HOLDINGS PLC
124
Term Definition
Total return swap A credit derivative transaction that swaps the total return on a financial instrument (cash flows and capital gains and losses), for a guaranteed interest rate, such as an inter-bank rate, plus a margin.
Trading book Positions in financial instruments and commodities held either with intent to trade or in order to hedge other elements of the trading book. To be eligible for trading book capital treatment, financial instruments must either be free of any restrictive covenants on their tradability or able to be hedged completely.
Trading risk Market risk arising from trading portfolios.
V
Value at risk (‘VaR’) A measure of the loss that could occur on risk positions as a result of adverse movements in market risk factors (e.g. rates, prices, volatilities) over a specified time horizon and to a given level of confidence.
W
Write-down/write-off When a financial asset is written down or written off, a customer balance is partially or fully removed, respectively, from the balance sheet. Loans (and related impairment allowance accounts) are normally written off, either partially or in full, when there is no realistic prospect of recovery. Where loans are secured, this is generally after receipt of any proceeds from the realisation of security. In circumstances where the net realisable value of any collateral has been determined and there is no reasonable expectation of further recovery, write-off may be earlier.
Wrong-way risk An adverse correlation between the counterparty’s PD and the mark-to-market value of the underlying transaction.

Capital and Risk Management Pillar 3 Disclosures at 31 December 2015 (continued)
HSBC HOLDINGS PLC
125
Appendix VII Cautionary statement regarding forward-looking statements
The Capital and Risk Management Pillar 3 Disclosures 2015 contains certain forward-looking statements with respect to HSBC’s financial condition, results of operations, capital position and business.
Statements that are not historical facts, including statements about HSBC’s beliefs and expectations, are forward-looking statements. Words such as ‘expects’, ‘anticipates’, ‘intends’, ‘plans’, ‘believes’, ‘seeks’, ‘estimates’, ‘potential’ and ‘reasonably possible’, variations of these words and similar expressions are intended to identify forward-looking statements. These statements are based on current plans, estimates and projections, and therefore undue reliance should not be placed on them. Forward-looking statements speak only as of the date they are made. HSBC makes no commitment to revise or update any forward-looking statements to reflect events or circumstances occurring or existing after the date of any forward-looking statements.
Written and/or oral forward-looking statements may also be made in the periodic reports to the US Securities and Exchange Commission, summary financial statements to shareholders, proxy statements, offering circulars and prospectuses, press releases and other written materials, and in oral statements made by HSBC’s Directors, officers or employees to third parties, including financial analysts.
Forward-looking statements involve inherent risks and uncertainties. Readers are cautioned that a number of factors could cause actual results to differ, in some instances materially, from those anticipated or implied in any forward-looking statement. These include, but are not limited to:
• changes in general economic conditions in the markets in which we operate, such as continuing or deepening recessions and fluctuations in employment beyond those factored into consensus forecasts; changes in foreign exchange rates and interest rates; volatility in equity markets; lack of liquidity in wholesale funding markets; illiquidity and downward price pressure in national real estate markets; adverse changes in central banks’ policies with respect to the provision of liquidity support to financial markets; heightened market concerns over sovereign creditworthiness in over-indebted countries; adverse changes in the funding
status of public or private defined benefit pensions; and consumer perception as to the continuing availability of credit and price competition in the market segments we serve;
• changes in government policy and regulation, including the monetary, interest rate and other policies of central banks and other regulatory authorities; initiatives to change the size, scope of activities and interconnectedness of financial institutions in connection with the implementation of stricter regulation of financial institutions in key markets worldwide; revised capital and liquidity benchmarks which could serve to deleverage bank balance sheets and lower returns available from the current business model and portfolio mix; imposition of levies or taxes designed to change business mix and risk appetite; the practices, pricing or responsibilities of financial institutions serving their consumer markets; expropriation, nationalisation, confiscation of assets and changes in legislation relating to foreign ownership; changes in bankruptcy legislation in the principal markets in which we operate and the consequences thereof; general changes in government policy that may significantly influence investor decisions; extraordinary government actions as a result of current market turmoil; other unfavourable political or diplomatic developments producing social instability or legal uncertainty which in turn may affect demand for our products and services; the costs, effects and outcomes of product regulatory reviews, actions or litigation, including any additional compliance requirements; and the effects of competition in the markets where we operate including increased competition from non-bank financial services companies, including securities firms; and
• factors specific to HSBC, including discretionary RWA growth and our success in adequately identifying the risks we face, such as the incidence of loan losses or delinquency, and managing those risks (through account management, hedging and other techniques). Effective risk management depends on, among other things, our ability through stress testing and other techniques to prepare for events that cannot be captured by the statistical models it uses; and our success in addressing operational, legal and regulatory, and litigation challenges, notably compliance with the DPA.

Capital and Risk Management Pillar 3 Disclosures at 31 December 2015 (continued)
HSBC HOLDINGS PLC
126
Appendix VIII Contacts
Enquiries relating to HSBC’s strategy or operations may be directed to: Senior Manager Investor Relations HSBC Holdings plc 8 Canada Square London E14 5HQ United Kingdom
Head of Investor Relations, Asia-Pacific The Hongkong and Shanghai Banking Corporation Limited 1 Queen’s Road Central Hong Kong
Telephone: 44 (0) 20 7991 3643 852 2822 4908

HSBC Holdings plc8 Canada SquareLondon E14 5HQUnited KingdomTelephone: 44 020 7991 8888www.hsbc.com