hsbc holdings plc annual results 2016...1. source: hsbc holdings plc annual report and accounts 2016...
TRANSCRIPT

1Fixed Income UpdateHSBC Holdings plc Annual Results 2016
Reduce Group RWAs by c. $290bn and re-deploy towards higher performing businesses; return GB&M to Group target profitability
Optimise global network
Rebuild NAFTA profitability
Set up UK Ring-Fenced Bank
Realise $4.5-5.0bn cost savings, deliver an exit rate in 2017 equal to 2014 operating expenses
Revenue growth above GDP from our international network
Capture growth opportunities in Asia: Pearl River Delta, ASEAN, Asset Management, Insurance
Extend leadership in RMB internationalisation
Complete Global Standards implementation
4
5
1
2
3
9
7
8
6
2
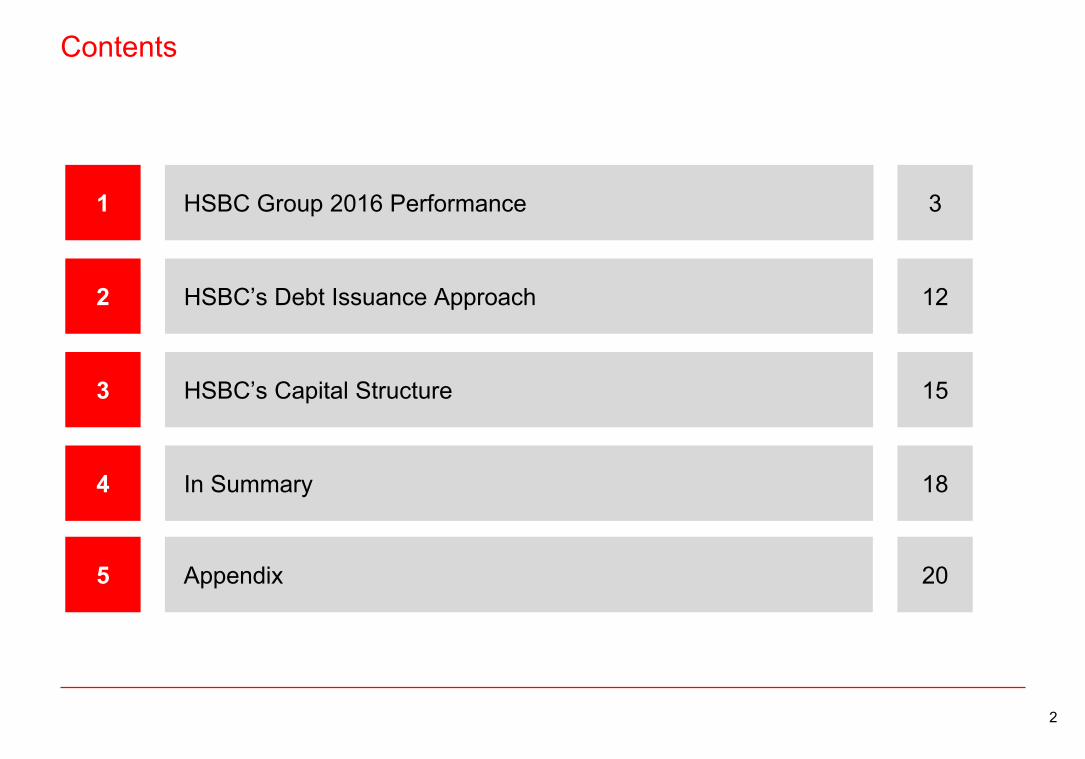
Contents
HIGHLY RESTRICTED
HSBC’s Debt Issuance Approach 2
1 HSBC Group 2016 Performance
HSBC’s Capital Structure3
In Summary4
12
3
15
18
Appendix5 20

HSBC Group 2016 Performance
HIGHLY RESTRICTED
44
Our highlights
HIGHLY RESTRICTED
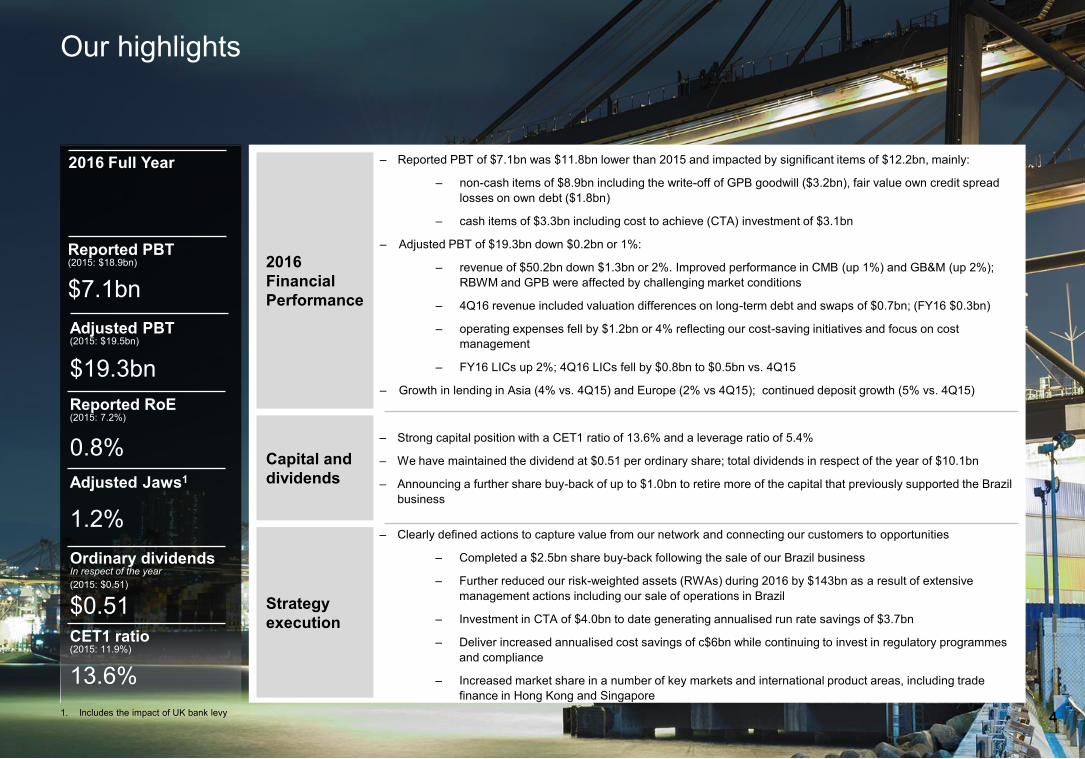
2016 Full Year
Reported PBT(2015: $18.9bn)
$7.1bn2016 Financial Performance
Capital and dividends
Strategy execution
‒ Reported PBT of $7.1bn was $11.8bn lower than 2015 and impacted by significant items of $12.2bn, mainly:
‒ non-cash items of $8.9bn including the write-off of GPB goodwill ($3.2bn), fair value own credit spread losses on own debt ($1.8bn)
‒ cash items of $3.3bn including cost to achieve (CTA) investment of $3.1bn
‒ Adjusted PBT of $19.3bn down $0.2bn or 1%:
‒ revenue of $50.2bn down $1.3bn or 2%. Improved performance in CMB (up 1%) and GB&M (up 2%); RBWM and GPB were affected by challenging market conditions
‒ 4Q16 revenue included valuation differences on long-term debt and swaps of $0.7bn; (FY16 $0.3bn)
‒ operating expenses fell by $1.2bn or 4% reflecting our cost-saving initiatives and focus on cost management
‒ FY16 LICs up 2%; 4Q16 LICs fell by $0.8bn to $0.5bn vs. 4Q15
‒ Growth in lending in Asia (4% vs. 4Q15) and Europe (2% vs 4Q15); continued deposit growth (5% vs. 4Q15)
Adjusted PBT(2015: $19.5bn)
$19.3bnReported RoE(2015: 7.2%)
0.8%Adjusted Jaws1
1.2%
CET1 ratio(2015: 11.9%)
13.6%
‒ Strong capital position with a CET1 ratio of 13.6% and a leverage ratio of 5.4%
‒ We have maintained the dividend at $0.51 per ordinary share; total dividends in respect of the year of $10.1bn
‒ Announcing a further share buy-back of up to $1.0bn to retire more of the capital that previously supported the Brazil business
‒ Clearly defined actions to capture value from our network and connecting our customers to opportunities
‒ Completed a $2.5bn share buy-back following the sale of our Brazil business
‒ Further reduced our risk-weighted assets (RWAs) during 2016 by $143bn as a result of extensive management actions including our sale of operations in Brazil
‒ Investment in CTA of $4.0bn to date generating annualised run rate savings of $3.7bn
‒ Deliver increased annualised cost savings of c$6bn while continuing to invest in regulatory programmes and compliance
‒ Increased market share in a number of key markets and international product areas, including trade finance in Hong Kong and Singapore
Ordinary dividendsIn respect of the year(2015: $0.51)
$0.51
1. Includes the impact of UK bank levy

5
HIGHLY RESTRICTED
2016 Key financial metrics
Return on average ordinary shareholders’ equity
Return on average tangible equity
Jaws (adjusted)1, 2
Dividends per ordinary share in respect of the period
Key financial metrics
7.2% 0.8%
8.1% 2.6%
(3.7)% 1.2%
$0.51 $0.51
2015 2016
Advances to deposits ratio
Net asset value per ordinary share (NAV)
Tangible net asset value per ordinary share (TNAV)
71.7% 67.7%
$8.73 $7.91
$7.48 $6.92
Earnings per share
Common equity tier 1 ratio
Leverage ratio
$0.65 $0.07
11.9% 13.6%
5.0% 5.4%
Revenue 8,984 (24)% 47,966 (20)%
LICs (468) 72% (3,400) 9%
Costs (12,459) (8)% (39,808) 0%
Associates 498 (10)% 2,354 (8)%
(Loss) / Profit before tax (3,445) <(200)% 7,112 (62)%
Revenue 11,000 (3)% 50,153 (2)%
LICs (468) 64% (2,652) (2)%
Costs (8,411) 3% (30,556) 4%
Associates 498 (6)% 2,355 (4)%
Profit before tax 2,619 39% 19,300 (1)%
Adjusted Income Statement, $m
4Q16 vs. 4Q15 2016 vs. 2015
Reported Income Statement, $m
4Q16 vs. 4Q15 2016 vs. 2015
1. Includes the impact of UK bank levy2. 2015 Jaws as reported in 2015
6
2016 Profit before tax performance1% lower profit before tax with reduced costs more than offset by a fall in revenue
HIGHLY RESTRICTED
2016 vs. 2015 PBT analysis
RBWM 5,690 5,333 (357) (6)%
CMB 5,423 6,052 629 12%
GB&M 5,534 5,597 63 1%
GPB 387 289 (98) (25)%
Corporate Centre 2,494 2,029 (465) (19)%
Group 19,528 19,300 (228) (1)%
Europe 2,147 1,598 (549) (26)%
Asia 14,227 14,203 (24) -%
Middle East and North Africa 1,417 1,595 178 13%
North America 1,537 1,329 (208) (14)%
Latin America 200 575 375 >100%
Group 19,528 19,300 (228) (1)%
Adjusted PBT by global business, $m 2015 2016 vs. 2015 %
Adjusted PBT by geography,$m 2015 2016 vs. 2015 %
Revenue
LICs
Operating expenses
Share of profits in associates and joint ventures
Profit before tax
Adjusted PBT by item
$50,153m
2016 vs. 2015
$(2,652)m
$(30,556)m
$2,355m
$19,300m
(1,266)
(48)
1,174
(88)
(228) (1)%
(2)%
(2)%
(4)%
4%
adverse favourable
1.2%Jaws1
1. Includes the impact of UK bank levy

7
4Q16 Profit before tax performanceHigher profit before tax from reduced costs and lower LICs
HIGHLY RESTRICTED
4Q16 vs. 4Q15 PBT analysis
RBWM 1,323 1,140 (183) (14)%
CMB 786 1,393 607 77%
GB&M 689 1,328 639 93%
GPB 81 26 (55) (68)%
Corporate Centre (998) (1,268) (270) 27%
Group 1,881 2,619 738 39%
Europe (1,325) (1,155) 170 13%
Asia 2,942 3,194 252 9%
Middle East and North Africa 227 226 (1) 0%
North America 77 262 185 >200%
Latin America (40) 92 132 >300%
Group 1,881 2,619 738 39%
Revenue
LICs
Operating expenses
Share of profits in associates and joint ventures
Profit before tax
Adjusted PBT by item
$11,000m
4Q16 vs. 4Q15
$(468)m
$(8,411)m
$498m
$2,619m
(31)
738
(339)
283
825
39%
(3)%
64%
(6)%
Adjusted PBT by global business, $m 4Q15 4Q16 vs. 4Q15 %
Adjusted PBT by geography,$m 4Q15 4Q16 vs. 4Q15 %
3%
adverse favourable
Jaws1
0.3%
Includes valuation differences on long-term debt and swaps of $742m
1. Includes the impact of UK bank levy

8
Loan impairment chargesLower impairment charges in 4Q16
HIGHLY RESTRICTED
Loan impairment charges and other credit risk provisions (LICs) analysis
16.1 12.7
6.3 5.8
11.58.6
11.712.35.6
Dec-16
18.24.8 1.7
Dec-15
23.85.9
Dec-14
27.1
Dec-13
33.9
WholesalePersonal excl. CMLCML
Q416 benign environment
− Better economic conditions
− LICs as a % of gross loans are c. 0.22%
− Impaired loans down $5.6bn in 2016 to $18.2bn
13% 25%
15%
26%
21%
Latin America
North America
Middle East andNorth Africa
Asia
Europe
24% 16%
15%
37%
8%
26%6%
28%
27%
13%
Impaired loansExcluding Brazil
LICs by region, %
4Q15 3Q16 4Q16
LICs by global business
2015 2016
2,604 2,6520.30 0.31
1,060 1,171
0.36 0.39
1,434 1,000
0.53 0.36
74 457
0.03 0.20
11 (1)
0.03 0.00
25 25
0.08 0.13
$0.5bn $0.3bn
$0.1bn $0.4bn
vs.4Q15 vs. 3Q16
825 830.38 0.04
37 79
0.06 0.11
681 33
0.98 0.05
91 11
0.16 0.02
(5) (8)
(0.06) (0.08)
19 (35)
0.45 (0.46)
$0.5bn $0.1bn
$nil $0.1bn
Reported LICs
3.9 3.33.65.15.45.66.1 0.10.1
0.76.57.92.9
201120102009
13.0
13.5
2013 2016201520142012
Rest of HSBC ($bn)
HSBC Finance Corporation ($bn)
4Q15 3Q16 4Q16
Group, $m 1,293 551 468as a % of gross loans 0.59 0.26 0.22
RBWM, $m 296 338 259
as a % of gross loans 0.40 0.44 0.34
CMB, $m 882 234 201
as a % of gross loans 1.26 0.33 0.28
GB&M, $m 103 23 12
as a % of gross loans 0.18 0.04 0.02
GPB, $m 3 0 8
as a % of gross loans 0.03 0.00 0.09
Corporate Centre, $m 9 (45) (10)
as a % of gross loans 0.14 (0.94) (0.31)
Of which:
- Oil and gas $0.4bn $nil $(0.1)bn
- Metals and mining $nil $0.1bn $nil
9
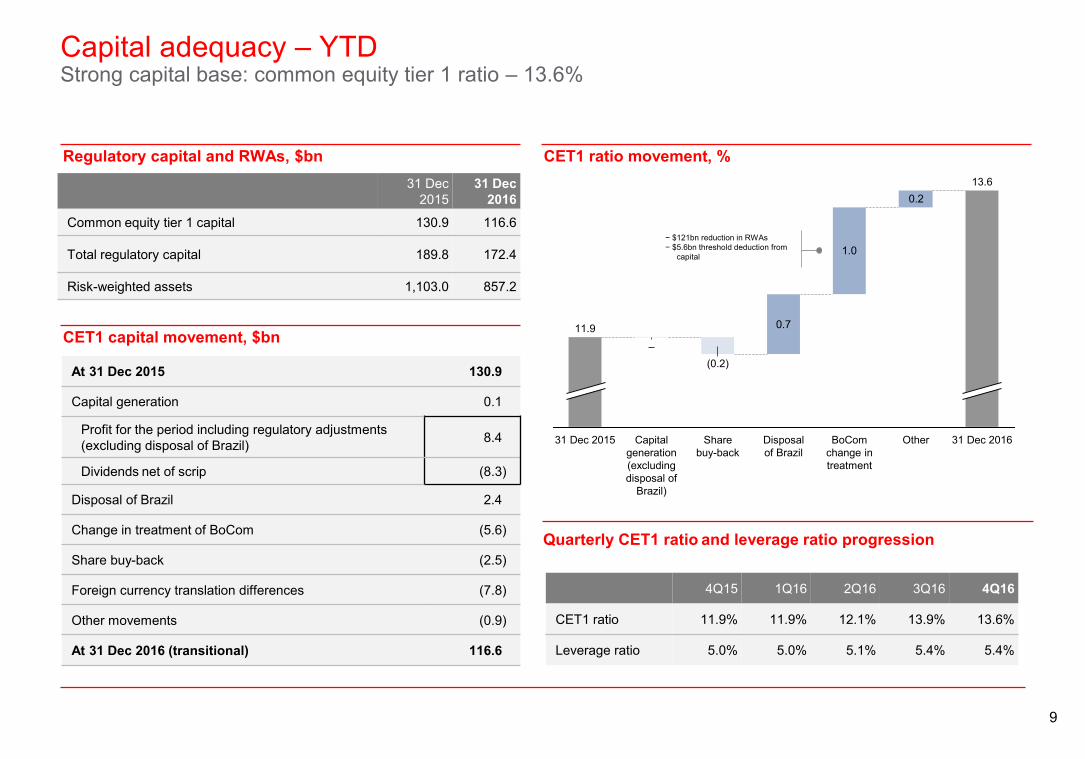
Capital adequacy – YTD Strong capital base: common equity tier 1 ratio – 13.6%
HIGHLY RESTRICTED
Regulatory capital and RWAs, $bn CET1 ratio movement, %
CET1 capital movement, $bn
At 31 Dec 2015 130.9
Capital generation 0.1
Profit for the period including regulatory adjustments (excluding disposal of Brazil) 8.4
Dividends net of scrip (8.3)
Disposal of Brazil 2.4
Change in treatment of BoCom (5.6)
Share buy-back (2.5)
Foreign currency translation differences (7.8)
Other movements (0.9)
At 31 Dec 2016 (transitional) 116.6
31 Dec 2015
31 Dec 2016
Common equity tier 1 capital 130.9 116.6
Total regulatory capital 189.8 172.4
Risk-weighted assets 1,103.0 857.2
Quarterly CET1 ratio and leverage ratio progression
4Q15 1Q16 2Q16 3Q16 4Q16
CET1 ratio 11.9% 11.9% 12.1% 13.9% 13.6%
Leverage ratio 5.0% 5.0% 5.1% 5.4% 5.4%
0.7
1.0
0.2
31 Dec 2016Other
13.6
BoCom change in treatment
Disposal of Brazil
Share buy-back
(0.2)
Capital generation (excluding disposal of
Brazil)
–
31 Dec 2015
11.9
− $121bn reduction in RWAs − $5.6bn threshold deduction from
capital
10
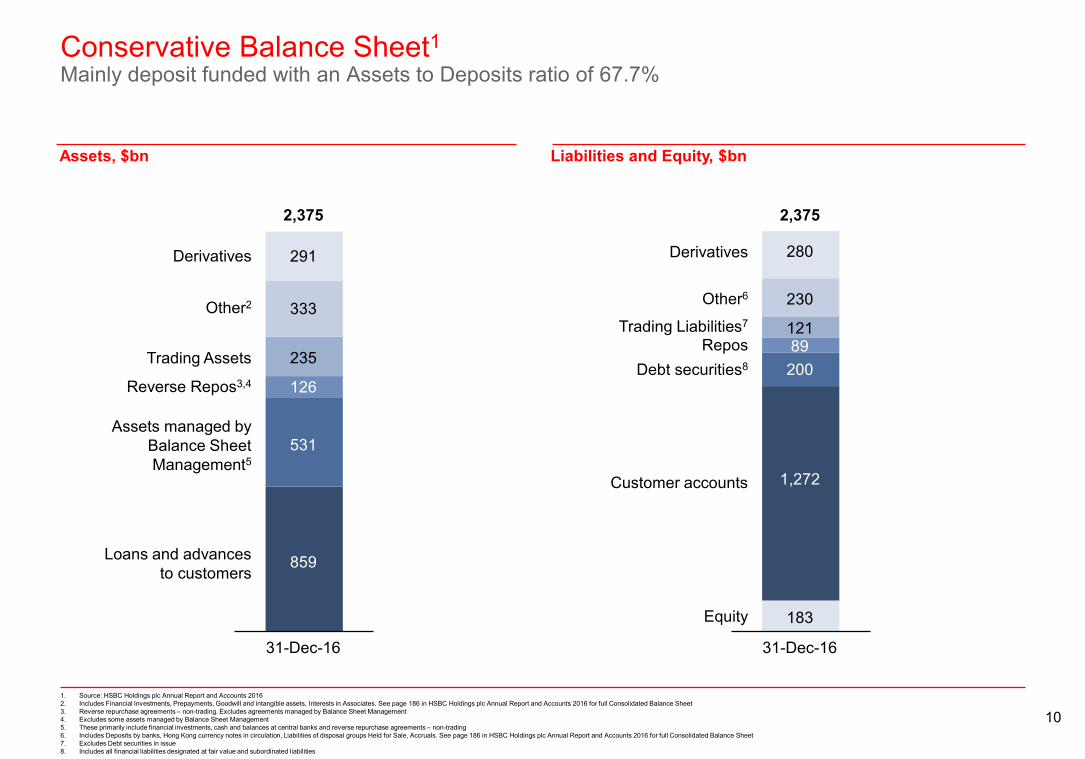
Conservative Balance Sheet1Mainly deposit funded with an Assets to Deposits ratio of 67.7%
HIGHLY RESTRICTED
1. Source: HSBC Holdings plc Annual Report and Accounts 20162. Includes Financial Investments, Prepayments, Goodwill and intangible assets, Interests in Associates. See page 186 in HSBC Holdings plc Annual Report and Accounts 2016 for full Consolidated Balance Sheet3. Reverse repurchase agreements – non-trading. Excludes agreements managed by Balance Sheet Management4. Excludes some assets managed by Balance Sheet Management5. These primarily include financial investments, cash and balances at central banks and reverse repurchase agreements – non-trading6. Includes Deposits by banks, Hong Kong currency notes in circulation, Liabilities of disposal groups Held for Sale, Accruals. See page 186 in HSBC Holdings plc Annual Report and Accounts 2016 for full Consolidated Balance Sheet7. Excludes Debt securities in issue8. Includes all financial liabilities designated at fair value and subordinated liabilities
Assets, $bn Liabilities and Equity, $bn
Reverse Repos3,4
Loans and advancesto customers
Assets managed byBalance SheetManagement5
31-Dec-16
Trading Assets
2,375
Other2
Derivatives
31-Dec-16
Derivatives
Equity
Debt securities8
Other6
Trading Liabilities7
2,375
Customer accounts
Repos
531
859
126
333
235
291
183
200
1,272
89121
230
280

11
Key Credit Metrics
HIGHLY RESTRICTED
Distributable reserves3 $42bn
Profit for the period including regulatory adjustments $8.4bn
Ordinary dividends in respect of the year4 $10.1bn
2016 demonstrated the fundamental strength of our business
HSBC came through 2016 securely as our diversified business model and geographic profile again demonstrated resilience in difficult market conditions
Our 2016 profit1 of $8.4bn along with a strong CET1 capital ratio of 13.6% enabled us to maintain the dividend.
2016 Summary Capital Generation & Distributions
CET1 Capital ratio 13.6%
Total Capital ratio 20.1%
RWA change $245.8bn reduction
Leverage ratio (CRR basis) 5.4%
LCR2 136%
Advances to Deposits Ratio 67.7%
1. Profit for the period including regulatory adjustments excluding Brazil.2. The HSBC application of the Liquidity Coverage Ratio (‘LCR’) metric involves the following two key assumptions about the definition of operational deposits and the ability to transfer liquidity from non-EU legal entities: we define operational deposits as transactional
(current) accounts arising from the provision of custody services by HSBC Security Services or Global Liquidity and Cash Management, where the operational component is assessed to be the lower of the current balance and the separate notional values of debits and credits across the account in the previous calculation period; and we assume no transferability of liquidity from non-EU entities other than to the extent currently permitted.
3. Of HSBC Holdings plc4. Includes 2016 1st, 2nd and 3rd interim dividends paid in the year and 2016 4th interim dividend declared.

HSBC’s Debt Issuance Approach
HIGHLY RESTRICTED

13
HSBC’s Approach to MREL1
HIGHLY RESTRICTED
HSBC Holdings
Latin AmericaAsiaEuropeUS
External MREL Debt raised
MREL1 Debt Downstreamed in Accordance with Local Rules
Issuing Entity
In 2017 HSBC Holdings plc will be the sole issuer of external MREL debt for the Group MREL debt will be downstreamed in a form compliant with local regulations Once regulatory rules have been finalised MREL debt could be issued directly from regional / local
Intermediate Holding Companies
Illustrative example of MREL Debt HoldCo Downstreaming to subsidiaries
Issuance Strategy
HSBC Holdings will maintain regular access through the year in material G3 benchmark currency issuance The above will be supplemented with issuance in selected local currency markets, principally where the
currency meets the functional requirements of the local entities HSBC will minimise the issuance of non-MREL debt by its subsidiaries although some issuance may
continue to meet the specific senior funding and liquidity requirements of operating subsidiaries
Volume requirements
HSBC plans to issue approximately $30-50bn2 of MREL debt to meet regulatory MREL requirements between 2017 and 2018, and issued approximately $31bn in 2016
1. Minimum Requirement for Own Funds and Eligible Liabilities (MREL). On a regional/local level, resolution groups and material subsidiaries may need to comply with MREL, Total Loss-Absorbing Capacity (TLAC) or equivalent requirements as applicable under local resolution regimes.
2. This is based on “The Bank of England’s approach to setting a minimum requirement for own funds and eligible liabilities (MREL)”, published in November 2016. This establishes that G-SIBs with resolution entities incorporated in the UK will be required to meet the minimum requirements set out in the Financial Stability Board’s (“FSB”) “Principles on Loss-absorbing and Recapitalisation Capacity of G-SIBs in Resolution” (“FSB Term Sheet”), published in November 2015, being the higher of 16% of RWAs or twice the Basel III Tier 1 leverage ratio of 3%, from 1 January 2019. The MREL requirement for HSBC, to apply from 1 January 2019 onwards, is yet to be formally confirmed by the Bank of England. In November 2016, the European Commission published proposed amendments to MREL which are yet to be finalised and not yet reflected in our estimates.

14
HSBC Issuance and maturities of existing long-term debt
HIGHLY RESTRICTED
HSBC Group debt maturity profile1,2, $bn
1. For illustration. Funding issues and maturities: Senior and structured note issues greater than $250m equivalent size at issue, with original maturity above 18 months2. Non Common Equity Capital issued and maturities: Includes fully compliant and grandfathered AT1 and Tier 2 securities; non common equity capital redemptions include callable securities at final maturity date3. Maturities of senior debt from both HSBC Holdings and its subsidiaries are included for illustration4. Bail-in-able debt issued by HSBC Holdings in 2016
4.6
31.4
3.0 0.5 1.7 1.8 2.0 2.9 1.4 0.8
22.0
12.5 11.9
5.59.8 7.3
4.0 1.3
8.0
5.9
3.2
Bail-in-able maturitiesSenior maturitiesNon Common Equity Capital maturitiesBail-in-able/Senior issuedNon Common Equity Capital issued
2016-21: $76bn senior funding maturity profile
2016 2017 2018 2019 2020 2021 2022 2023
HSBC is a predominantly deposit funded organisation and reduced its external debt in each of 2012-15
HSBC Holdings issued approximately $31bn of MREL senior debt in 2016
Recent Supply
3
4
2
2
4

HSBC’s Capital Structure
HIGHLY RESTRICTED

16
Group Capital Requirements1 to 2020HSBC’s Capital Structure – Maximum Distributable Amount (MDA) Requirements
HIGHLY RESTRICTED
4.5% 4.5% 4.5% 4.5% 4.5%
1.6% 1.6% 1.6% 1.6% 1.6%
0.6%1.3% 1.5% 2.0% 2.0%0.6%
1.3%1.9%
2.5% 2.5%
0.1%
0.2%
0.3%
0.3%0.3%
13.6%
7.4%
8.9%
9.8%
10.9% 10.9%
0%
1%
2%
3%
4%
5%
6%
7%
8%
9%
10%
11%
12%
13%
14%
DEC16 JAN17 JAN18 JAN19 JAN20CCyB CCB G-SII P2A (56% CET1) CET1 minimum CET13 4 5
Common equity tier 1 ratio of 13.6% as at 31 December 2016
6
Buffer to MDA2
$53bn
$41bn$33bn
$23bn $23bn
1. Known CET1 capital requirements (% of RWA), as confirmed by the PRA, including Pillar 2A and CRD IV buffers, as per UK implementation of CRD IV. Excludes non MDA buffers (e.g. PRA buffer).2. Pro forma buffer to MDA trigger based on RWAs and CET1 capital resources at 31 December 2016.3. The Countercyclical Capital Buffer (CCyB) is dependent on the buffer rates set by regulators and is subject to change (numbers shown for 31 December 2016 are based on effective rates as at that date; future increases in the CCyB rates have been included, where formally confirmed as at 31
January 2017). 4. The Capital Conservation Buffer (CCB) is a fixed buffer, set at 2.5%. It is phased-in from 1 January 2016 to 1 January 2019.5. The Global Systemically Important Institutions (G-SII) buffer is currently set at 2.5% but reduces to 2% from 1 January 2018 (as confirmed by the PRA). It is phased-in from 1 January 2016 to 1 January 2019.6. The Pillar 2A requirement is a point in time assessment of the amount of capital the PRA consider the Group should hold to meet the overall financial adequacy rule and is subject to change pending annual assessment and supervisory review process; it is held constant in the chart.
CombinedBuffer
17
CET1 AT1 T2 MREL debt > 1 Year
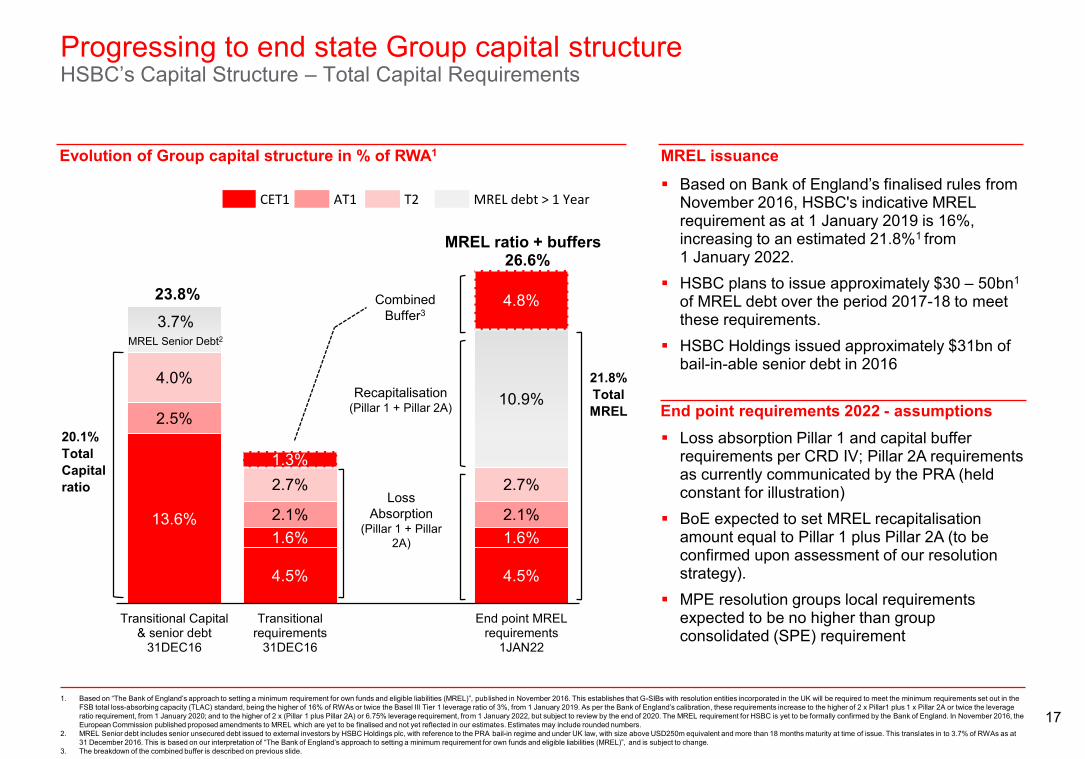
Progressing to end state Group capital structureHSBC’s Capital Structure – Total Capital Requirements
HIGHLY RESTRICTED
Based on Bank of England’s finalised rules from November 2016, HSBC's indicative MREL requirement as at 1 January 2019 is 16%, increasing to an estimated 21.8%1 from 1 January 2022.
HSBC plans to issue approximately $30 – 50bn1
of MREL debt over the period 2017-18 to meet these requirements.
HSBC Holdings issued approximately $31bn of bail-in-able senior debt in 2016
Loss absorption Pillar 1 and capital buffer requirements per CRD IV; Pillar 2A requirements as currently communicated by the PRA (held constant for illustration)
BoE expected to set MREL recapitalisation amount equal to Pillar 1 plus Pillar 2A (to be confirmed upon assessment of our resolution strategy).
MPE resolution groups local requirements expected to be no higher than group consolidated (SPE) requirement
13.6%
4.5% 4.5%
1.6% 1.6%
2.5%
2.1% 2.1%
4.0%
2.7% 2.7%
3.7%
10.9%
1.3%
4.8%
Transitional Capital& senior debt
31DEC16
Transitionalrequirements
31DEC16
End point MRELrequirements
1JAN22
Loss Absorption
(Pillar 1 + Pillar 2A)
Recapitalisation(Pillar 1 + Pillar 2A)
CombinedBuffer3
End point requirements 2022 - assumptions20.1% Total Capital ratio
MREL ratio + buffers 26.6%
Evolution of Group capital structure in % of RWA1 MREL issuance
21.8% Total MREL
23.8%
MREL Senior Debt2
1. Based on “The Bank of England’s approach to setting a minimum requirement for own funds and eligible liabilities (MREL)”, published in November 2016. This establishes that G-SIBs with resolution entities incorporated in the UK will be required to meet the minimum requirements set out in the FSB total loss-absorbing capacity (TLAC) standard, being the higher of 16% of RWAs or twice the Basel III Tier 1 leverage ratio of 3%, from 1 January 2019. As per the Bank of England’s calibration, these requirements increase to the higher of 2 x Pillar1 plus 1 x Pillar 2A or twice the leverage ratio requirement, from 1 January 2020; and to the higher of 2 x (Pillar 1 plus Pillar 2A) or 6.75% leverage requirement, from 1 January 2022, but subject to review by the end of 2020. The MREL requirement for HSBC is yet to be formally confirmed by the Bank of England. In November 2016, the European Commission published proposed amendments to MREL which are yet to be finalised and not yet reflected in our estimates. Estimates may include rounded numbers.
2. MREL Senior debt includes senior unsecured debt issued to external investors by HSBC Holdings plc, with reference to the PRA bail-in regime and under UK law, with size above USD250m equivalent and more than 18 months maturity at time of issue. This translates in to 3.7% of RWAs as at 31 December 2016. This is based on our interpretation of “The Bank of England’s approach to setting a minimum requirement for own funds and eligible liabilities (MREL)”, and is subject to change.
3. The breakdown of the combined buffer is described on previous slide.
In Summary
HIGHLY RESTRICTED
19
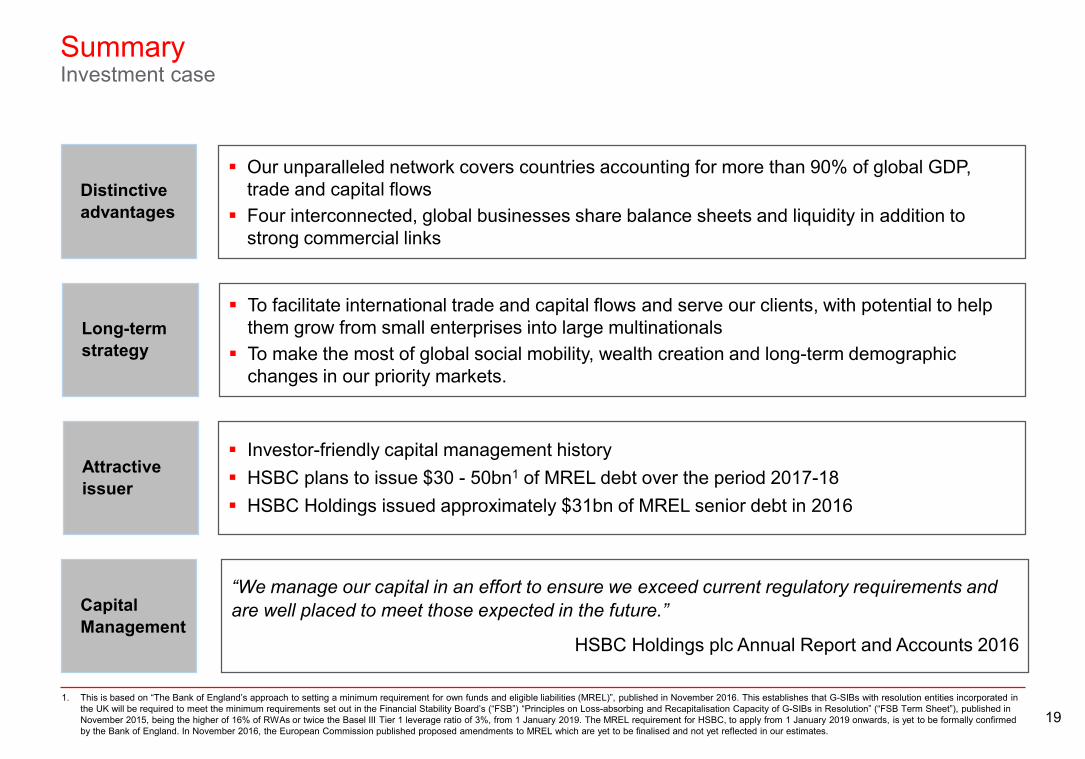
SummaryInvestment case
HIGHLY RESTRICTED
Our unparalleled network covers countries accounting for more than 90% of global GDP, trade and capital flows
Four interconnected, global businesses share balance sheets and liquidity in addition to strong commercial links
Distinctive advantages
“We manage our capital in an effort to ensure we exceed current regulatory requirements and are well placed to meet those expected in the future.”
HSBC Holdings plc Annual Report and Accounts 2016
Investor-friendly capital management history HSBC plans to issue $30 - 50bn1 of MREL debt over the period 2017-18 HSBC Holdings issued approximately $31bn of MREL senior debt in 2016
Attractive issuer
Capital Management
Long-term strategy
To facilitate international trade and capital flows and serve our clients, with potential to help them grow from small enterprises into large multinationals
To make the most of global social mobility, wealth creation and long-term demographic changes in our priority markets.
1. This is based on “The Bank of England’s approach to setting a minimum requirement for own funds and eligible liabilities (MREL)”, published in November 2016. This establishes that G-SIBs with resolution entities incorporated in the UK will be required to meet the minimum requirements set out in the Financial Stability Board’s (“FSB”) “Principles on Loss-absorbing and Recapitalisation Capacity of G-SIBs in Resolution” (“FSB Term Sheet”), published in November 2015, being the higher of 16% of RWAs or twice the Basel III Tier 1 leverage ratio of 3%, from 1 January 2019. The MREL requirement for HSBC, to apply from 1 January 2019 onwards, is yet to be formally confirmed by the Bank of England. In November 2016, the European Commission published proposed amendments to MREL which are yet to be finalised and not yet reflected in our estimates.

Appendix
HIGHLY RESTRICTED
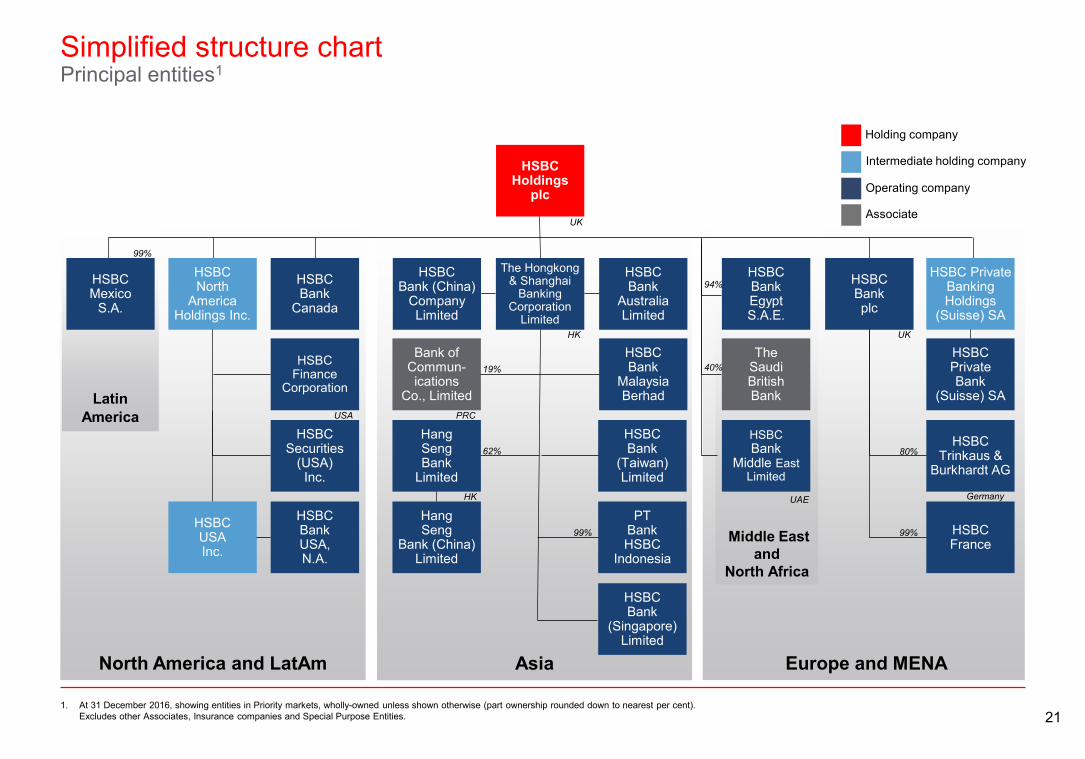
21
Simplified structure chartPrincipal entities1
HIGHLY RESTRICTED
North America and LatAm
LatinAmerica
Asia Europe and MENA
HSBCHoldings
plc
Middle Eastand
North Africa
UK
HSBCBankplc
HSBCMexico
S.A.
HSBCUSAInc.
HSBC North
America Holdings Inc.
The Hongkong& Shanghai
Banking Corporation
Limited
HSBCPrivateBank
(Suisse) SA
HSBC Private Banking Holdings
(Suisse) SA
HSBCFrance
HSBC Trinkaus &
Burkhardt AG
Bank of Commun-ications
Co., Limited
HSBCBank
(Taiwan)Limited
HangSeng
Bank (China)Limited
HSBCBank (China)
CompanyLimited
HSBCBank
Malaysia Berhad
HSBCBank
AustraliaLimited
HSBCFinance
Corporation
HSBCBankUSA,N.A.
HSBC Securities
(USA)Inc.
HSBCBank
Canada
TheSaudiBritishBank
HSBCBank
Middle EastLimited
HSBCBankEgyptS.A.E.
99%
USA
HK
62%
19%
PRC
Germany
99%
UK
80%
94%
40%
HangSengBank
LimitedHK
PT Bank HSBC
Indonesia
99%
HSBCBank
(Singapore) Limited
Holding company
Intermediate holding company
Operating company
Associate
UAE
1. At 31 December 2016, showing entities in Priority markets, wholly-owned unless shown otherwise (part ownership rounded down to nearest per cent). Excludes other Associates, Insurance companies and Special Purpose Entities.
22
RBWM37%
CMB29%
GBM30%
C.C.1%
GPB3%
RBWM44%
CMB27%
GBM25%
GPB4%
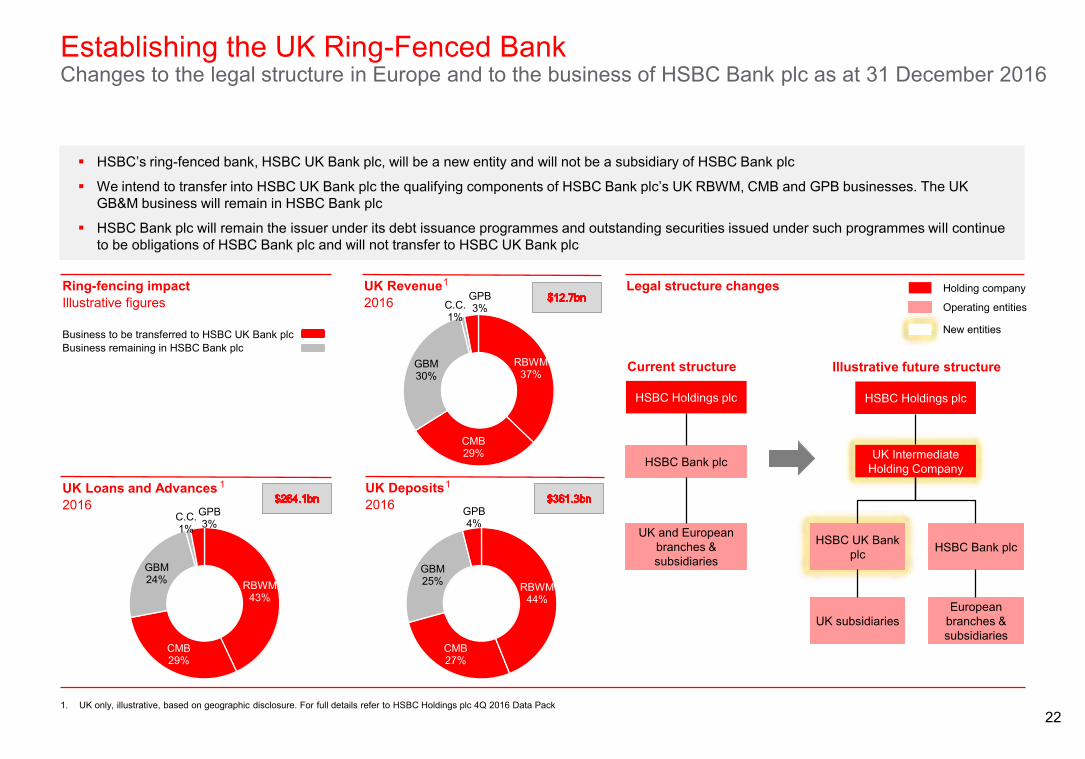
Establishing the UK Ring-Fenced BankChanges to the legal structure in Europe and to the business of HSBC Bank plc as at 31 December 2016
HIGHLY RESTRICTED
HSBC’s ring-fenced bank, HSBC UK Bank plc, will be a new entity and will not be a subsidiary of HSBC Bank plc
We intend to transfer into HSBC UK Bank plc the qualifying components of HSBC Bank plc’s UK RBWM, CMB and GPB businesses. The UK GB&M business will remain in HSBC Bank plc
HSBC Bank plc will remain the issuer under its debt issuance programmes and outstanding securities issued under such programmes will continue to be obligations of HSBC Bank plc and will not transfer to HSBC UK Bank plc
Ring-fencing impactIllustrative figures
Business to be transferred to HSBC UK Bank plcBusiness remaining in HSBC Bank plc
UK Revenue2016
UK Loans and Advances2016
UK Deposits2016
Legal structure changes Holding company
Operating entities
New entities
RBWM43%
CMB29%
GBM24%
C.C.1%
GPB3%
HSBC Holdings plc HSBC Holdings plc
UK Intermediate Holding CompanyHSBC Bank plc
HSBC Bank plcHSBC UK Bank plc
UK and European branches & subsidiaries
UK subsidiariesEuropean
branches & subsidiaries
Current structure Illustrative future structure
1
1 1
1. UK only, illustrative, based on geographic disclosure. For full details refer to HSBC Holdings plc 4Q 2016 Data Pack

23
Transmission of Losses from Banking Subsidiaries Each Banking Subsidiary absorbs losses to the extent of its equity capacity and write-
down/conversion of internal and external NCEC1 securities in accordance with the terms of the securities
Banking Subsidiary resolution => Local Resolution Authority write-down/convert intercompany MREL2 debt and assume responsibility for the Banking Subsidiary
Any write-down/conversion of internal regulatory capital issued by the Banking Subsidiary, impacts HSBC Holdings balance sheet and cashflow
HSBC’s Creditor Loss Hierarchy
HIGHLY RESTRICTED
Impact of Banking Subsidiary Resolution on HSBC Holdings Consolidated CET1 ratio would be eroded by any losses in Banking Subsidiaries
‒ But CET1 ratio has substantial buffers versus regulatory minima
Any write down of internal NCEC1 assets would impact HSBC Holdings balance sheet
Any write down would reduce interest income which would erode HSBC Holdings cashflows
‒ But the Group’s diversified model provides flexibility to absorb deterioration in Banking Subsidiaries
If any deterioration erodes consolidated capital ratios then AT1 could be converted according to contractual terms
If any conversion of AT1 cannot recover HSBC Holdings financial profile/consolidated capital ratios then Resolution Authority intervenes, with subsidiary debt directly issued to the market, Tier 2, followed by MREL2 debt, written down
CBRegion
NCEC1 and MREL2
debt downstreamed intra-Group
1
2
DA
External NCEC1 and MREL2 Debt Raised
HSBC Holdings
1. Non Common Equity Capital i.e. Tier 2 and Additional Tier 1 instruments 2. MREL eligible instruments include regulatory capital and debt instruments eligible as per “The Bank of England’s approach to setting a minimum requirement for own funds and eligible liabilities (MREL)”, published in November
2016. In November 2016, the European Commission also published proposed amendments to MREL which are yet to be finalised. On a regional/local level, resolution groups and material subsidiaries may need to comply with MREL, Total Loss-Absorbing Capacity (TLAC) as defined in the Financial Stability Board’s TLAC Term Sheet, or equivalent requirements as applicable under local resolution regimes.

24
This slide should be read in conjunction with Note 27 and Note 35 of the HSBC Holdings plc Annual Report and Accounts 2016.
Legal proceedings and regulatory mattersAs at 31 December 2016
HIGHLY RESTRICTED
Provisions relating to legal proceedings and regulatory matters, $m Commentary on selected items1
Jaffe securitieslitigation
Madoff
In June 2016, HSBC reached an agreement to pay $1.6bn to settle all claims. Final court approval of the settlement and a final court order of dismissal with prejudice was granted in November 2016.
Based upon the information currently available, management’s estimate of possible aggregate damages that might arise as a result of all claims in the various Madoff-related proceedings is up to or exceeding $800m, excluding costs and interest. Due to uncertainties and limitations of this estimate, the ultimate damages could differ significantly from this amount.
Due to the high degree of uncertainty involved, it is not practicable to estimate the possible financial impact of these matters, which could be significant.
HSBC is cooperating with the relevant authorities. As at 31 December 2016, HSBC has recognised a provision for these various matters in the amount of $773m. There are many factors that may affect the range of outcomes, and the resulting financial impact, of these investigations and reviews.
Due to uncertainties and limitations of these estimates, the ultimate penalties could differ significantly from the amount provided.
As at 31 December 2016, a provision of $919m (2015: $1,039m) was held relating to the estimated liability for redress in respect of the possible mis-selling of Payment Protection Insurance (‘PPI’) policies in previous years.
An increase in provisions of $492m was recognised during the year, primarily reflecting a delay to the inception of the expected time bar on inbound complaints; and an anticipated adjustment to the redress parameters surrounding ‘Plevin’.
Tax-related investigations
PPI
-0-0
1,258
Amounts utilised
(1,831)
AdditionsAt 1 Jan 2016
3,174
At 31 Dec 2016
2,436
Exchange and other
movements
Unwinding of discounts
Unused amounts reversed
(165)
-0
762
At 1 Jan 2016
1,340
At 31 Dec 2016
1,124
Exchange and other
movements
(204)
Unwinding of discounts
Unused amounts reversed
(94)
Amounts utilised
(680)
Additions
Provisions relating to customer remediation, $m
$919mAs at 31 December 2016, provision held relating to the estimated liability for redress in respect of the possible
mis-selling of PPI policies in previous years
$1.2bnAs at 31 December 2016, HSBC has
recognised a provision for foreign exchange rate investigations and
litigation2
1. This slide contains selected items only, as at 31 December 2016. For further information, please refer to Note 27 and Note 35 of the HSBC Holdings plc Annual Report and Accounts 20162. There are many factors that may affect the range of outcomes, and the resulting financial impact, of these matters. Due to uncertainties and limitations of these estimates, the ultimate penalties could differ significantly from the
amount provided.
US mortgage securitisation activity and litigation

25
Important notice and forward-looking statements
HIGHLY RESTRICTED
Important notice
The information set out in this presentation and subsequent discussion does not constitute a public offer for the purposes of any applicable law or an offer to sell or solicitation of any offer to purchase any securities or other financial instruments or any recommendation in respect of such securities or instruments.
Forward-looking statements
This presentation and subsequent discussion may contain projections, estimates, forecasts, targets, opinions, prospects, results, returns and forward-looking statements with respect to the financial condition, results of operations, capital position and business of the Group (together, “forward-looking statements”). Any such forward-looking statements are not a reliable indicator of future performance, as they may involve significant assumptions and subjective judgements which may or may not prove to be correct and there can be no assurance that any of the matters set out in forward-looking statements are attainable, will actually occur or will be realised or are complete or accurate. Forward-looking statements are statements about the future and are inherently uncertain and generally based on stated or implied assumptions. The assumptions may prove to be incorrect and involve known and unknown risks, uncertainties, contingencies and other important factors, many of which are outside the control of the Group. Actual achievements, results, performance or other future events or conditions may differ materially from those stated, implied and/or reflected in any forward-looking statements due to a variety of risks, uncertainties and other factors (including without limitation those which are referable to general market conditions or regulatory changes). Any such forward-looking statements are based on the beliefs, expectations and opinions of the Group at the date the statements are made, and the Group does not assume, and hereby disclaims, any obligation or duty to update them if circumstances or management’s beliefs, expectations or opinions should change. For these reasons, recipients should not place reliance on, and are cautioned about relying on, any forward-looking statements. Additional detailed information concerning important factors that could cause actual results to differ materially is available in our 2016 Annual Report and Accounts.
This presentation contains non-GAAP financial information. The primary non-GAAP financial measure we use is ‘adjusted performance’ which is computed by adjusting reported results for the period-on-period effects of foreign currency translation differences and significant items which distort period-on-period comparisons. Significant items are those items which management and investors would ordinarily identify and consider separately when assessing performance in order to better understand the underlying trends in the business. Reconciliations between non-GAAP financial measurements and the most directly comparable measures under GAAP are provided in the 2016 Annual Report and Accounts and theReconciliations of Non-GAAP Financial Measures document which are both available at www.hsbc.com.

26
Issued by HSBC Holdings plcGroup Investor Relations8 Canada SquareLondon E14 5HQUnited Kingdomwww.hsbc.com
Cover image: The Hong Kong-Zhuhai-Macau Bridge: one of the most ambitious infrastructure projects in the Pearl River Delta.
Photography: courtesy of Dragages-China Harbour-VSL JV
HIGHLY RESTRICTED