hrsa health information technology and quality webinar · pdf filehrsa health information...
TRANSCRIPT

U.S. Department of Health and Human Services
Health Resources and Services Administration
HRSA Health Information Technology
and Quality Webinar
“Using Data for Evidence Based Quality
Improvement”
Date: 7/27/2012 US Department of Health and Human Services
Health Resources and Services Administration
Office of Health Information Technology and
Quality
Additional HRSA Health IT and Quality Toolboxes and
Resources including past webinars can be found at:
http://www.hrsa.gov/healthit
http://www.hrsa.gov/quality
Please visit HRSA’s New Clinical Quality & Performance Measures Toolkit,
located on HRSA Quality Improvement website
(http://www.hrsa.gov/quality)
Additional questions can sent to the following e-mail address:
[email protected] • US Department of Health and Human Services
• Health Resources and Services Administration

Upcoming HRSA Health IT and Quality
Announcements
HIMSS Jobmine for Safety Net Providers (Free Job Postings for HRSA Grantees and Safety Net
Providers). Email [email protected] for more information.
Competency Exam for Health IT Professionals, vouchers available for free exams, email
Next HRSA Health IT and Quality Webinar, "Overview of Telehealth Resources for Safety Net
Providers," Friday August 17th, 2 PM EST
New HRSA Clinical Quality & Performance Measures Toolkit, located on HRSA Quality
Improvement website (http://www.hrsa.gov/quality)
NACHC Health IT Communities of Practice- Registration Open- Learn more and sign up
today! And please help us spread the word within your organization and centers.
http://www.nachc.com/NACHC%20COMMUNITIES%20OF%20PRACTICE%20(CoP).cfm
Agency for Healthcare Research and Quality Health IT and Quality Measurement webinar
“Overviews of New AHRQ Environmental Snapshot Report and Issuance of Non-regulatory
Request for Information (RFI),” July 31, 2012, 1:30-3:00 p.m., EST

Introduction
Presenters:
• Rebecca Steinfield-Institute for Healthcare
Improvement
• Maria Casaverde Marin-Northwest Colorado Visiting
Nurse Association
• Tamarah Duperval Brownlee, MD-Lone Star Circle of
Care

Introduction to the Science of
Improvement: Using Data for Learning
Rebecca Steinfield, Improvement Advisor
Institute for Healthcare Improvement
July 2012

©2012 Institute for Healthcare Improvement/
Institute for Healthcare Improvement
We Exist Because…
“Between the health care we have
and the care we could have lies
not just a gap, but a chasm.” - Institute of Medicine, Crossing the Quality Chasm, 2001

©2012 Institute for Healthcare Improvement/
This is the result of systems and processes
not adequately designed for the need.
“Every system is perfectly designed to get
exactly the results it gets.”
-Paul Batalden, MD

IHI MISSION To improve health and health care worldwide.
WHO WE ARE
We are a reliable source of energy, knowledge, and support for a never-ending campaign to improve health and
health care worldwide.
WHAT WE WILL ACCOMPLISH
In the US and abroad, we will improve the lives of patients, the health of communities, and the joy of the health
care workforce, and reduce health care costs. We work with health care providers and others to accelerate the
measurable and continual progress of health care systems throughout the world toward safety, effectiveness,
patient-centeredness, timeliness, efficiency, and equity.
WHAT WE WILL BECOME
We will be a recognized and generous leader, a trustworthy partner, and the first place to turn for expertise, help,
and encouragement for anyone, anywhere who wants to change health care fundamentally for the better.
CORE STRATEGIES FOR DRIVING IMPROVEMENT
Strategy #1:
Motivate
Stimulate the
desire and
optimism for
change
Strategy #2:
Innovate
Create, find, and
test new models of
care
Strategy #3:
Get Results
Ensure spread and
adoption of sound
changes
Strategy #4:
Raise Joy in Work
Help build a better
health care
workforce
Strategy #5:
Stay Vital for the
Long Haul
Sustain IHI’s
viability

IHI’s Online Resources
• Subscribe to This
Week @ IHI, IHI’s free
weekly e-newsletter
• Listen to WIHI, a free
audio program from IHI
• Check out the great
resources, tools,
stories, and contacts
available on
www.IHI.org
Follow @TheIHI
©2012 Institute for Healthcare Improvement/
IHI Group
IHI Fan Page
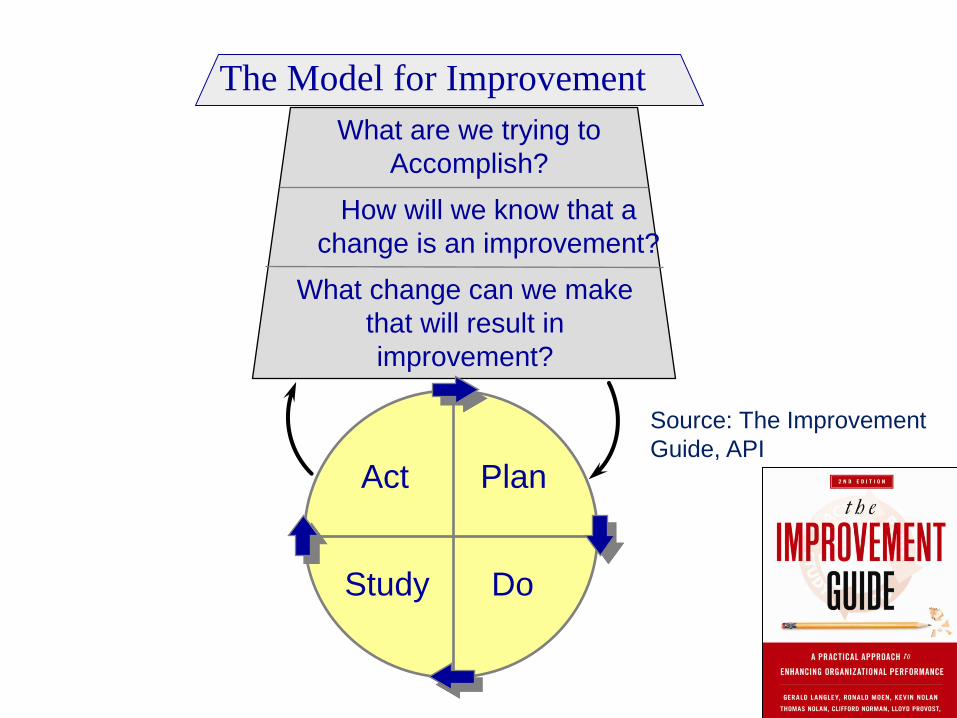
The Model for Improvement
What are we trying to
Accomplish?
How will we know that a
change is an improvement?
What change can we make
that will result in
improvement?
Act Plan
Study Do
Source: The Improvement
Guide, API

©2012 Institute for Healthcare Improvement/
Repeated Use of the Cycle
A P
S D
A P
S D
Model for Improvement What are we trying to
accomplish? How will we know that a
change is an improvement?
What change can we make that will result in improvement?
Hunches
Theories
Ideas
Changes That
Result in
Improvement
Source: Improvement Guide, p 10

©2012 Institute for Healthcare Improvement/
Repeated Use of the PDSA Cycle
A P
S D
A P
S D
Model for Improvement What are we trying to
accomplish? How will we know that a
change is an improvement?
What change can we make thatwill result in improvement?
Reduce pt medication harm by 50%
-Med Harm rate per admission,
-% patients w/harm
Change Pkg.
-med recon
-high haz meds
-med ordering
Hunches
Theories
Ideas Very Small
Scale Test
Follow-up
Tests
Wide-Scale Tests
of Change
Implementation of
Change
Changes That
Result in
Improvement

©2012 Institute for Healthcare Improvement/
Resources: Free “On-Demand” Streaming
Video taught by Dr. Robert Lloyd
Available on ihi.org:
• An Introduction to the Model for Improvement
Provides a framework for organizing and guiding a team’s
improvement journey
• Building Skills in Data Collection and Understanding
Variation
Designed to help teams successfully manage the
milestones along the quality measurement journey
• Using Run and Control Charts to Understand Variation
Addresses the application of statistical process control
(SPC) methods, with specific attention given to run and
control charts

2 Institute for Healthcare Improve01©2 ment/
Question #2: How do we know if a
change is an improvement?
“You can’t fatten a cow by weighing it” - Palestinian Proverb
10
Improvement is
NOT just about
measurement!
However, without measurement you will
never be able to know if a change actually
leads to improvement!
©2012 Institute for Healthcare Improvement/
11
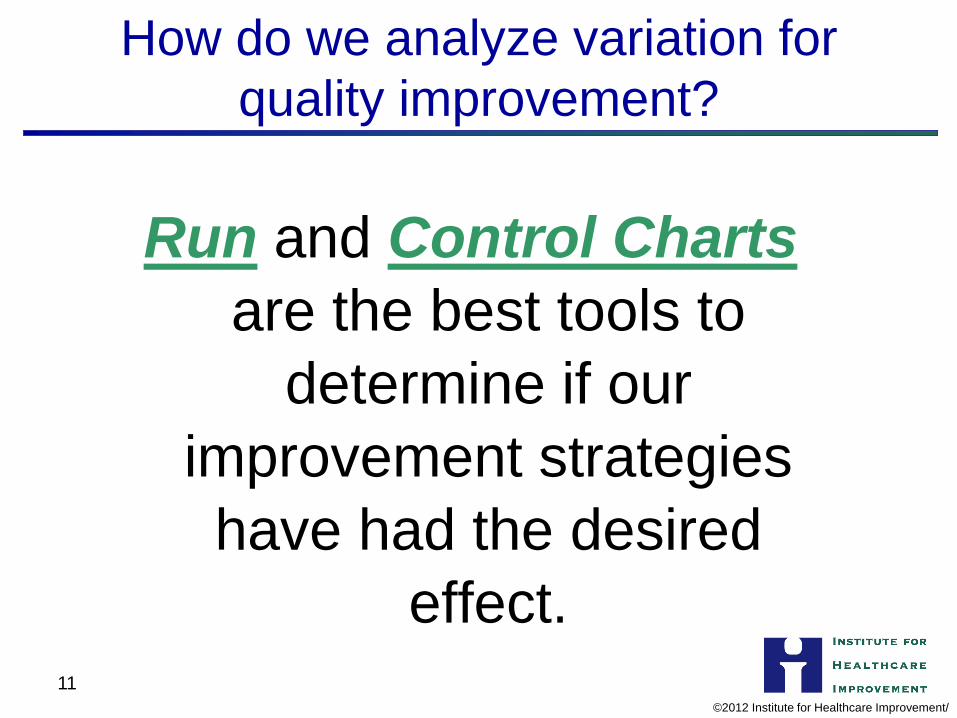
How do we analyze variation for
quality improvement?
Run and Control Charts
are the best tools to
determine if our
improvement strategies
have had the desired
effect.
LCL
©Copyright 2009 Institute for Healthcare Improvement and R. C. Lloyd & Associates
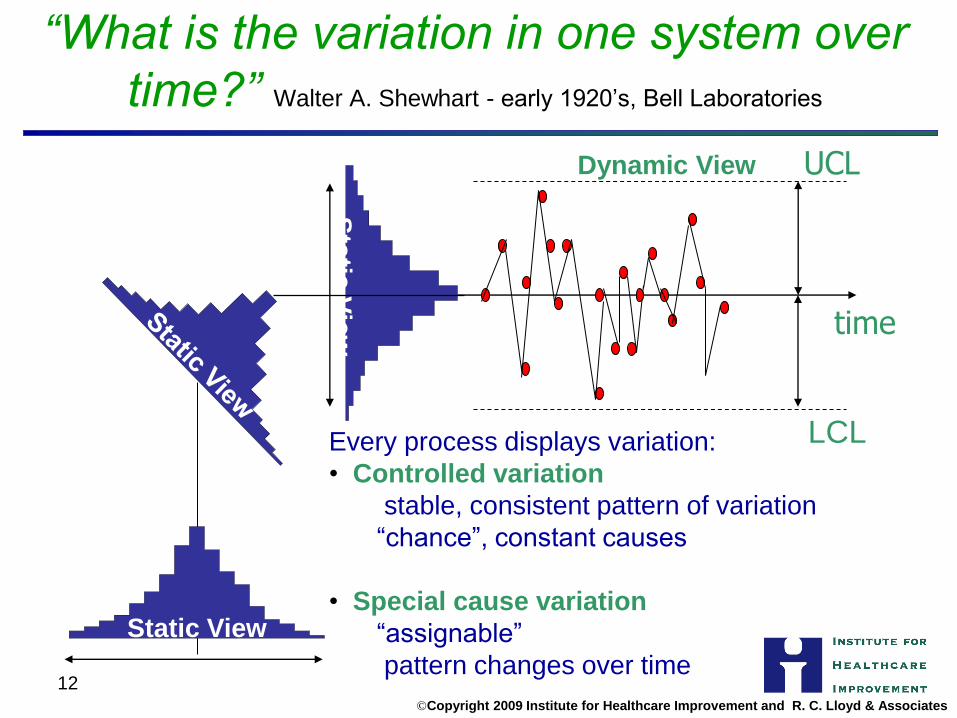
“What is the variation in one system over
time?” Walter A. Shewhart - early 1920’s, Bell Laboratories
Every process displays variation:
• Controlled variation
stable, consistent pattern of variation
“chance”, constant causes
• Special cause variation
“assignable”
pattern changes over time 12
Static View
time
UCL
Sta
tic V
iew
Dynamic View

©Copyright 2008 Institute for Healthcare
Improvement
and R. C. Lloyd & Associates
13
Elements of a Run Chart
X (CL)
Mea
su
re
Time
~
The centerline
(CL) on a Run
Chart is the
Median
Four simple run rules are used to determine
if special cause variation is present
©Copyright 2008 Institute for Healthcare
Improvement
and R. C. Lloyd & Associates
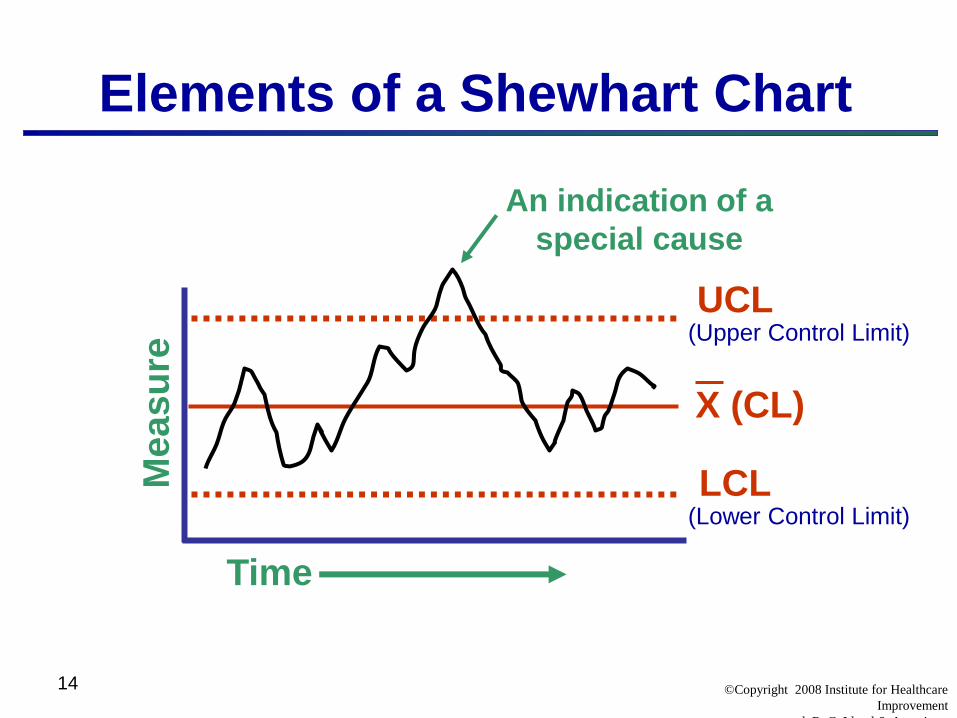
14
Elements of a Shewhart Chart
UCL
LCL
X (CL)
Mea
su
re
Time
An indication of a
special cause
(Upper Control Limit)
(Lower Control Limit)

Cycle Time Results for Units 1, 2 and 3

2 Institute for Healthcare Improvement/ ©201
16
Average CABG Mortality Before and After the Implementation of a New Protocol
Perc
ent
Mort
alit
y
Time 1 Time 2
3.8
5.2
5.0%
4.0%
WOW!
A “significant drop”
from 5% to 4%
Conclusion -The protocol was a success!
A 20% drop in the average mortality!

©2012 Institute for Healthcare Improvement/
17
Average CABG Mortality
Before and After the Implementation of a New Protocol
A Second Look at the Data
Perc
en
t M
ort
ality
24 Months
1.0
9.0
5.0
UCL= 6.0
LCL = 2.0
CL = 4.0
Protocol implemented here
Now what do you conclude about the impact of the
protocol?
©2012 Institute for Healthcare Improvement/
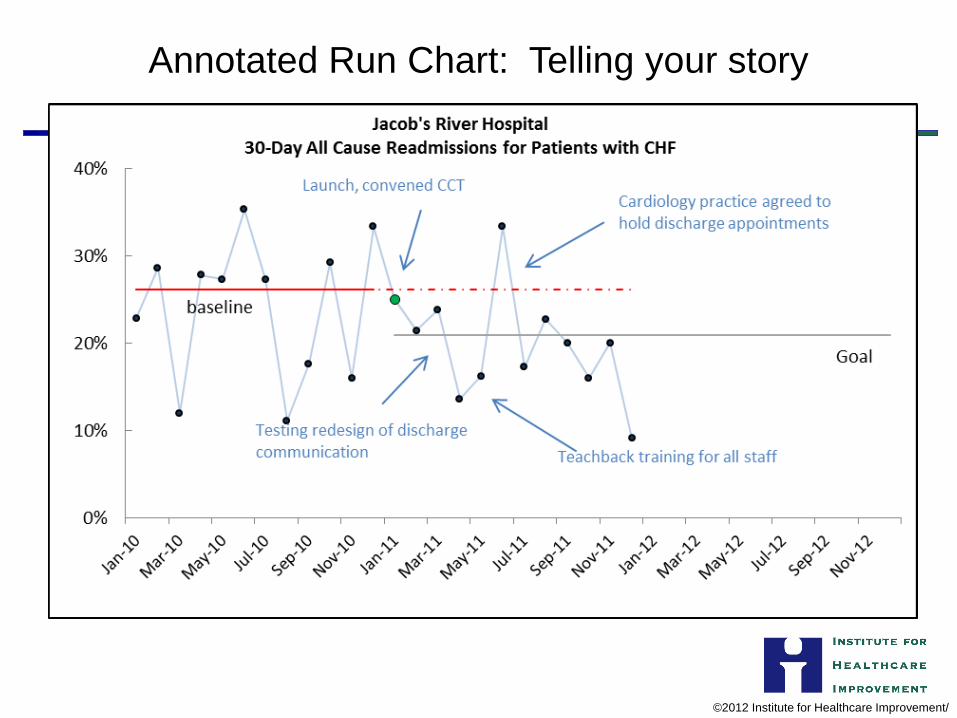
Annotated Run Chart: Telling your story

19
Non-Random Rules for Run Charts
A Shift:
6 or more
An astronomical
data point
Too many or
too few runs
A Trend
5 or more
Source: The Data Guide by L. Provost and S. Murray, Jossey-Bass, 2011, p.78
Resource Article:
The run chart: a simple analytical
tool for learning from variation in
healthcare processes
British Medical Journal Quality and Safety, 2011, Rocco Perla, Lloyd
Provost, Sandy Murray
©2012 Institute for Healthcare Improvement/
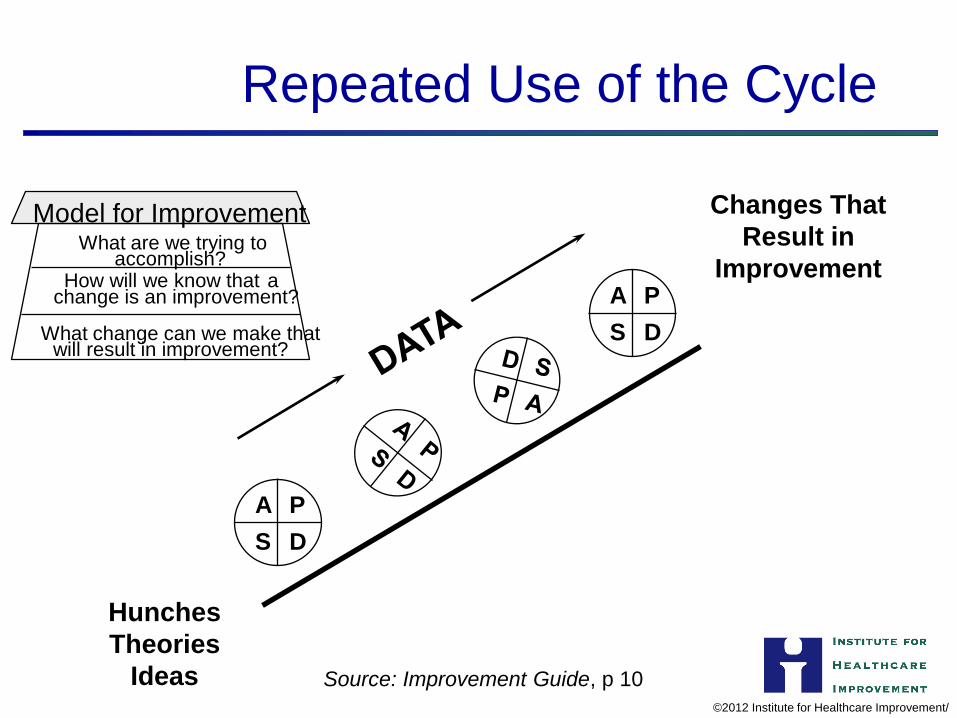
Repeated Use of the Cycle
A P
S D
A P
S D
Model for Improvement
Source: Improvement Guide, p 10
What are we trying to accomplish?
How will we know that a change is an improvement?
What change can we make that will result in improvement?
Hunches
Theories
Ideas
Changes That
Result in
Improvement

©2012 Institute for Healthcare Improvement/
In Summary….
• Help your teams answer the three
questions as you work on improving the
quality and value of health care
• Use data for learning (not judgment)
• Access resources for learning more about
the science of improvement
Using Data for Evidence Based Quality Improvement
Your reports are as good as the data that goes in your EHR

Public Health Wellness and Aging
Hospice Home Health
Community Health Center
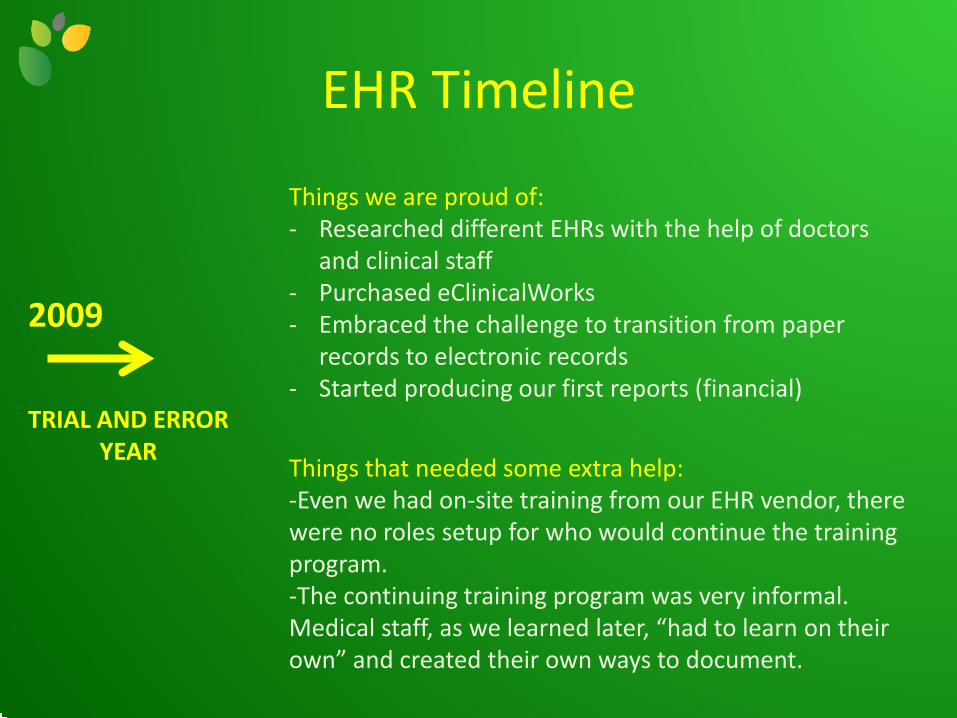
EHR Timeline
2009
TRIAL AND ERROR YEAR
Things we are proud of: - Researched different EHRs with the help of doctors
and clinical staff - Purchased eClinicalWorks - Embraced the challenge to transition from paper
records to electronic records - Started producing our first reports (financial)
Things that needed some extra help: -Even we had on-site training from our EHR vendor, there were no roles setup for who would continue the training program. -The continuing training program was very informal. Medical staff, as we learned later, “had to learn on their own” and created their own ways to document.

How we used data - 2009
As we started to use our EHR, the Director of Clinical and Quality Services started to work with the Clinical Management team deciding how we would approach our QI projects. Before we started presenting data to the clinic, we needed to decide what measures we would needed to track. By the end of the year we started working with Health Team Works to provide coaching on Quality Improvement initiatives
NO DATA!

EHR Timeline
2009 2010
GIMME THE NUMBERYEA
Things we are proud of: -Developed baseline numbers -Realized that we needed help to correEHR system if we wanted to track QI pr
S R
ct our ojects
-Awarded a HRSA grant from the Office of Rural Health Policy to implement a Quality Improvement Program.
- QI Project started taking shape thanks to full-time person who focused on retrieving information from our system and presenting it to our clinical staff.
Things that needed some extra help: -Did not have one assigned person to perform changes in the system -Every person in the clinic had their own way of working in the EHR -Little help from our EHR vendor -Choose a “let’s do it all” approach rather than introducing one measure at the time method.
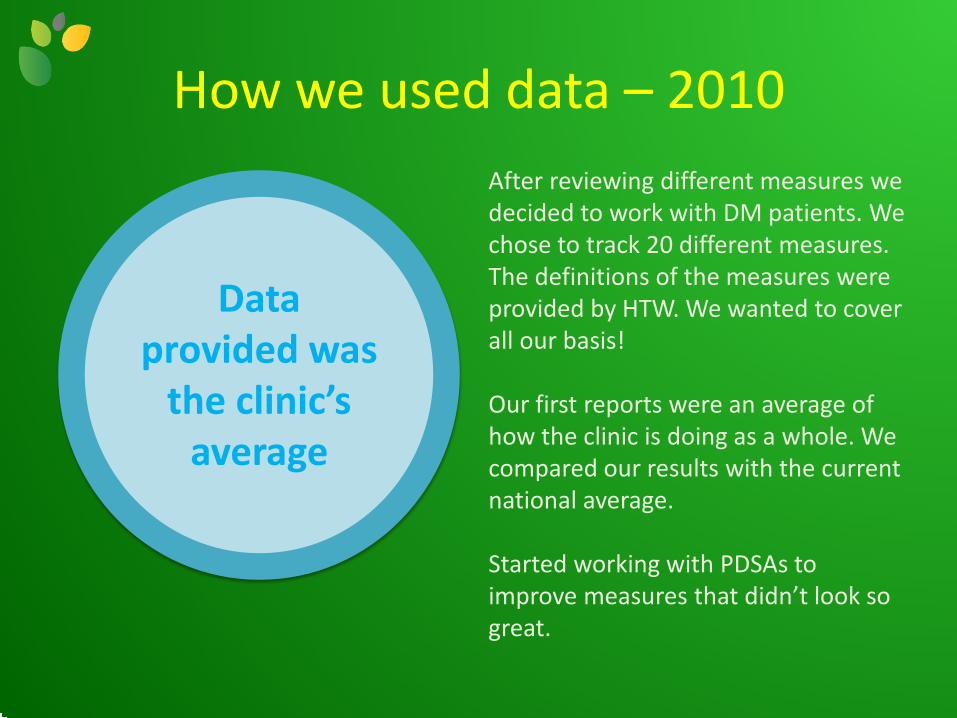
How we used data – 2010
Data provided was
the clinic’s average
After reviewing different measures we decided to work with DM patients. We chose to track 20 different measures. The definitions of the measures were provided by HTW. We wanted to cover all our basis! Our first reports were an average of how the clinic is doing as a whole. We compared our results with the current national average. Started working with PDSAs to improve measures that didn’t look so great.


Flowsheets help you to determine what care items a
patient is missing or are due.
Reminders and alerts also help.

EHR Timeline
2009 2010
GIMME THE NUMBERS YEAR
Things we are proud of: -Developed baseline numbers -Realized that we needed help to correct our EHR system if we wanted to track QI projects -Awarded a HRSA grant from the Office of Rural Health Policy to implement a Quality Improvement Program.
- QI Project started taking shape thanks to full-time person who focused on retrieving information from our system and presenting it to our clinical staff.
Things that needed some extra help: -Did not have one assigned person to perform changes in the system -Every person in the clinic had their own way of working in the EHR -Little help from our EHR vendor -Choose a “let’s do it all” approach rather than introducing one measure at the time method.
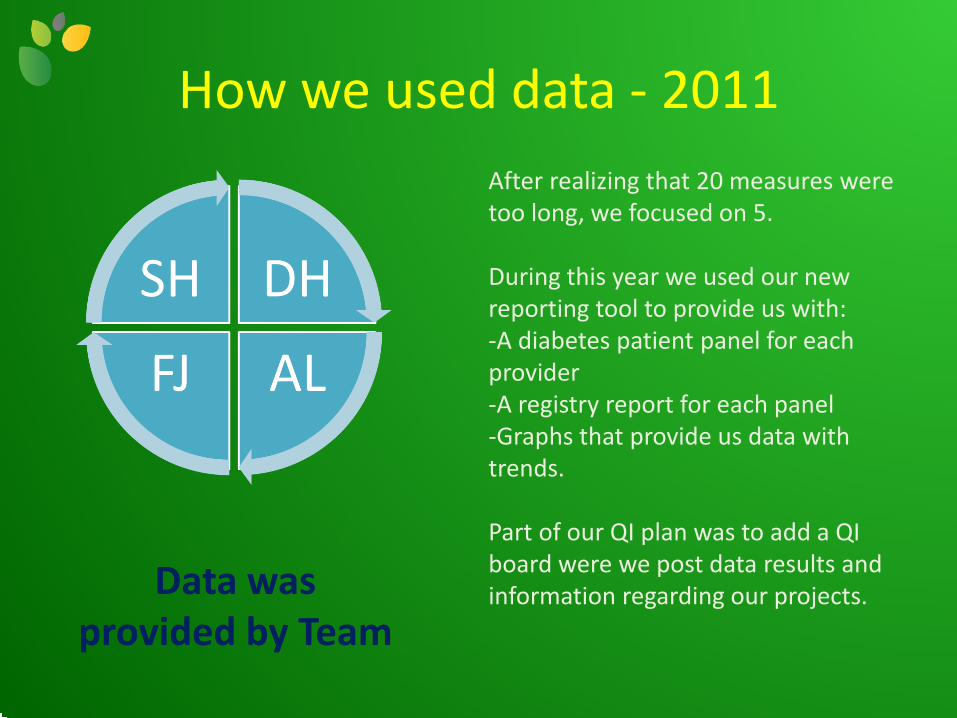
How we used data - 2011 After realizing that 20 measures were too long, we focused on 5. During this year we used our new reporting tool to provide us with: -A diabetes patient panel for each provider -A registry report for each panel -Graphs that provide us data with trends.
Part of our QI plan was to add a QI board were we post data results and information regarding our projects.
Data was provided by Team

QI Meetings – 2011
Medical Provider
Medical Assistant
Front Desk
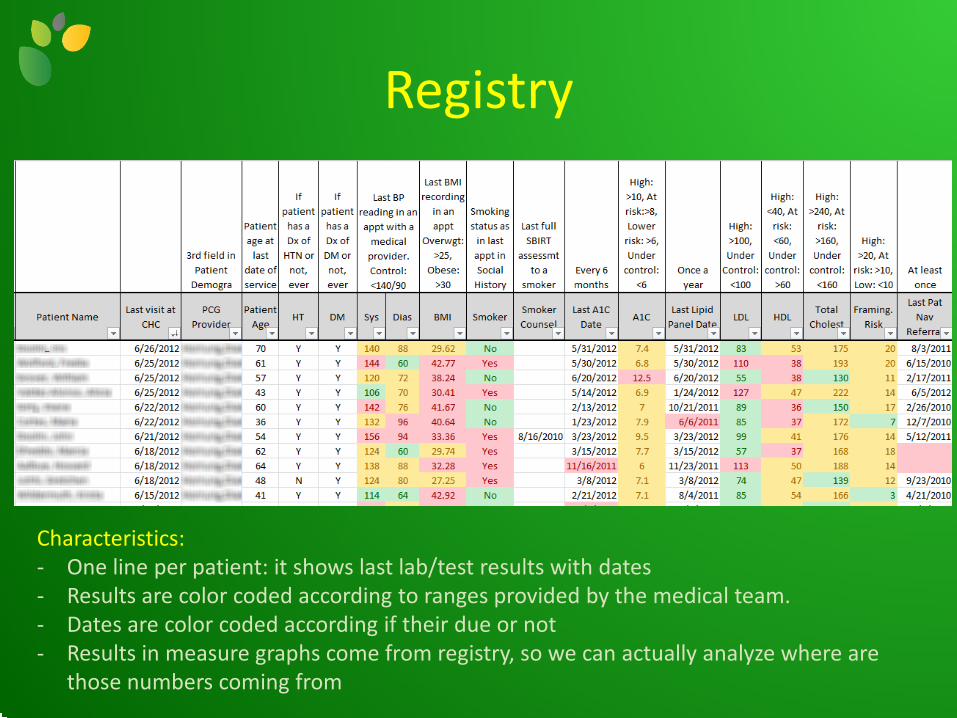
Registry
Characteristics: - One line per patient: it shows last lab/test results with dates - Results are color coded according to ranges provided by the medical team. - Dates are color coded according if their due or not - Results in measure graphs come from registry, so we can actually analyze where are
those numbers coming from

QI Board
Improvement results by team. Each team has their picture next to their
results
Our Improvement Model:
Chronic Care Model Each month we
explain the model and on which part we are
working
Goal of the month
Motivational Interviewing:
Each month we provide new strategies on how
to motivate our patients through MI

Roadmap of how to use Motivational Interviewing
during a patient’s first appointment

Step by step process how to enter information in our Electronic Health Record
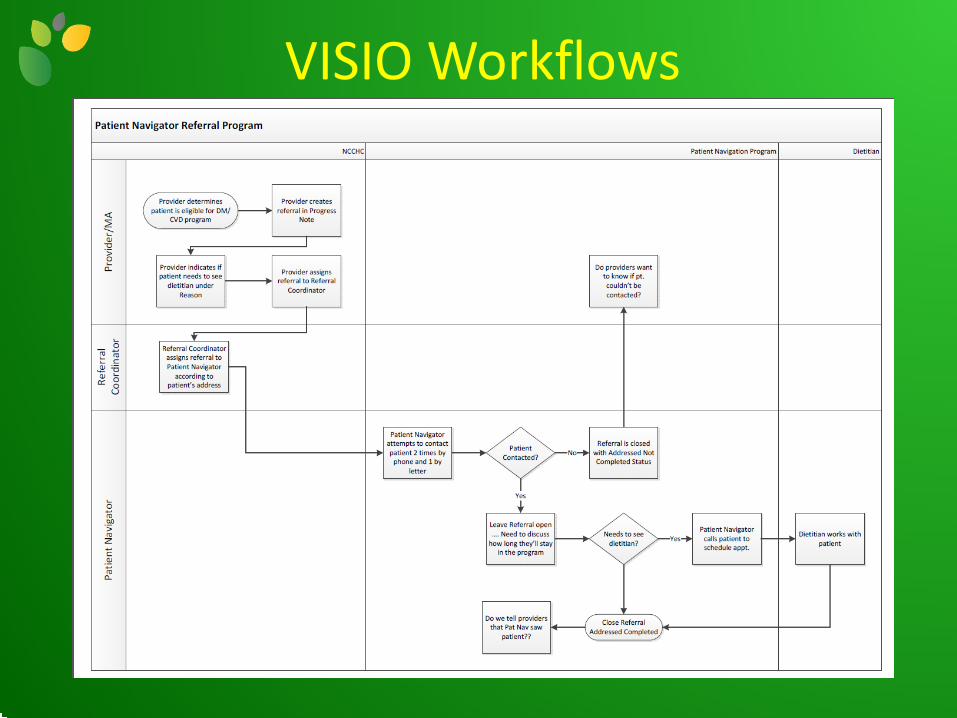
VISIO Workflows

EHR Timeline
2009 2010
EXPANSION YEAR
2012 2011
Things we are doing now: -Expanding to include patients with CVD (adding more than 1000 patients to our current registry) -Moving to briefer and more quality-oriented meetings. We have moved the one hour a month meeting with all staff to a half hour meeting with each team once a month. This way we are decreasing the amount of time we have with a provider so they can see more patients.
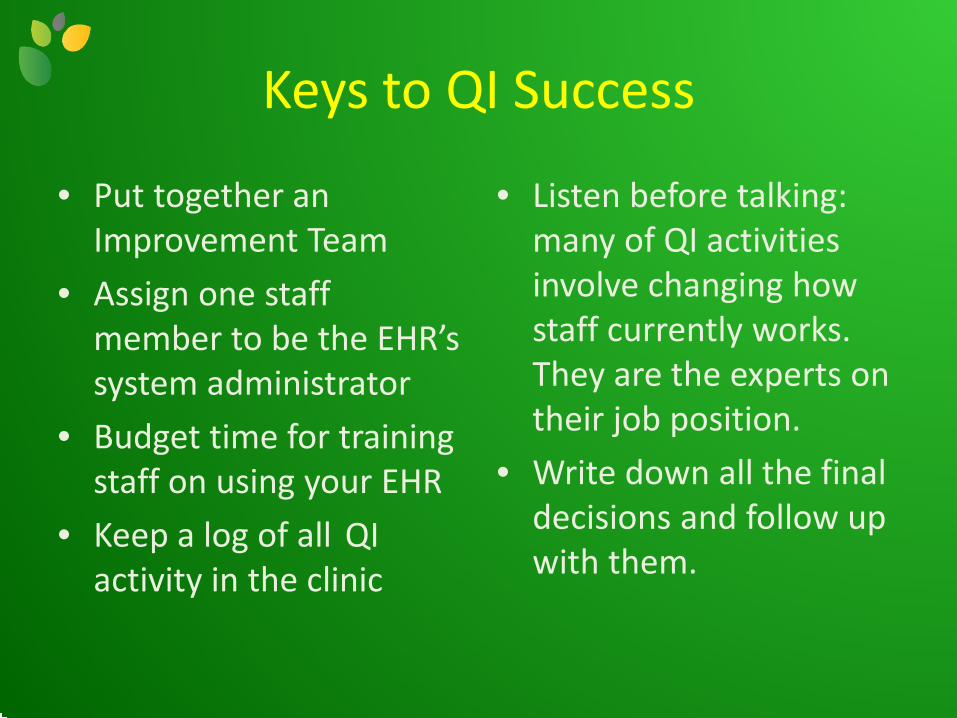
Keys to QI Success
• Put together an Improvement Team
• Assign one staff member to be the EHR’s system administrator
• Budget time for training staff on using your EHR
• Keep a log of all QI activity in the clinic
• Listen before talking: many of QI activities involve changing how staff currently works. They are the experts on their job position.
• Write down all the final decisions and follow up with them.

Quotes on My Door
It is not the strongest of the species that survives, nor the most intelligent that survives.
It is the one that is the most adaptable to change. ~Charles Darwin~
A person who never made a mistake never
tried anything new. ~Albert Einstein~

Websites • He alth Team works www.healthteamworks.org
• UDS clinical quality measures http://bphc.hrsa.gov/healthcenterdatastatistics/nationaldata/index.html
• Healthy people 2020 http://www.healthypeople.gov/2020/topicsobjectives2020/default.aspx
• Meaningful Use Quality Measures https://www.cms.gov/Medicare/Quality-Initiatives-Patient-Assessment-Instruments/QualityMeasures/index.html?redirect=/QualityMeasures/03_ElectronicSpecifications.asp
• SNAGIT http://www.techsmith.com/snagit.html
• TECHSOUP www.techsoup.org

Maria F. Casaverde Health Information Analyst| Northwest Colorado Visiting Nurse Association
[email protected] • direct: 970-875-1881
940 Central Park Drive, Suite 101, Steamboat Springs, CO 80487 www.nwcovna.org
Follow us on Facebook www.facebook.com/nwcovna

Health care that revolves around you.
0 © 2012 Lone Star Circle of Care
Lone Star Circle of Care A Behaviorally-Enhanced, Patient Centered Health Home
Health care that revolves around you.
Using Data For Process and Quality Improvement Tamarah Duperval-Brownlee, MD, MPH, FAAFP
Chief Executive and CMO for Clinical Services, Lone Star Circle of Care ([email protected])
July 27, 2012

1 © 2011 Lone Star Circle of Care
Overview
•Overview of Lone Star Circle of Care
•EHR Integration/PCMH Strategies
•Quality: Data Measurement and Application
towards process and care improvement
•Lessons Learned
2 © 2011 Lone Star Circle of Care
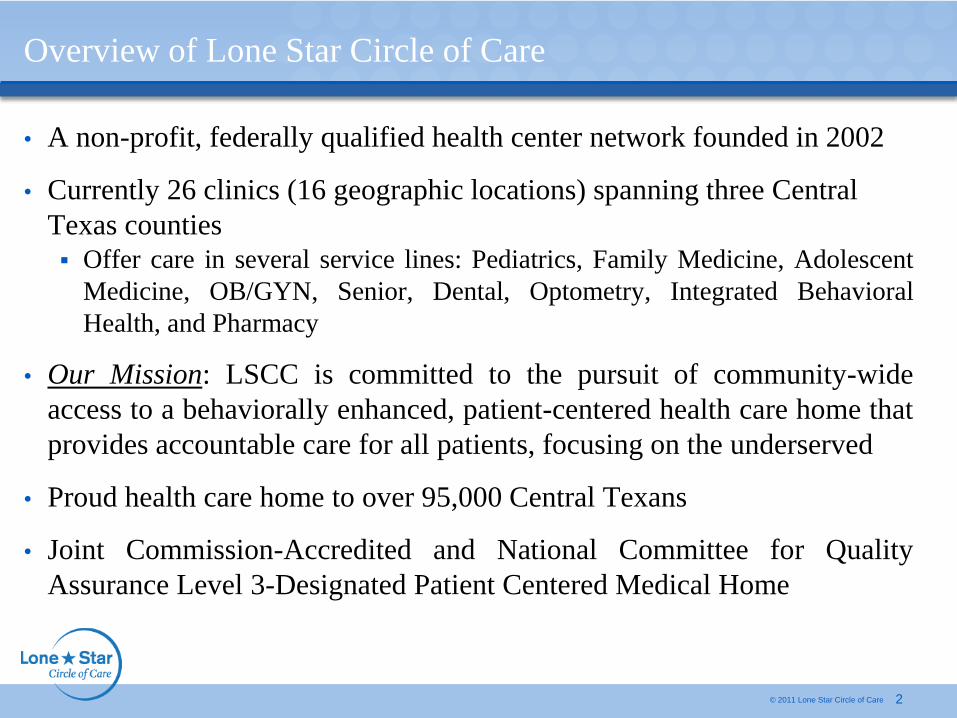
Overview of Lone Star Circle of Care
• A non-profit, federally qualified health center network founded in 2002
• Currently 26 clinics (16 geographic locations) spanning three Central
Texas counties
Offer care in several service lines: Pediatrics, Family Medicine, Adolescent
Medicine, OB/GYN, Senior, Dental, Optometry, Integrated Behavioral
Health, and Pharmacy
• Our Mission: LSCC is committed to the pursuit of community-wide
access to a behaviorally enhanced, patient-centered health care home that
provides accountable care for all patients, focusing on the underserved
• Proud health care home to over 95,000 Central Texans
• Joint Commission-Accredited and National Committee for Quality
Assurance Level 3-Designated Patient Centered Medical Home

Increasing Access
3 © 2011 Lone Star Circle of Care
0
50,000
100,000
150,000
200,000
250,000
300,000
350,000
400,000
2005 2006 2007 2008 2009 2010 2011 Conservative
Projection
FY2012
24,895 35,348
74,224 96,131
127,121
202,568
298,269
360,832
Lone Star Circle of Care Visits
FY2005 - FY2012 (Projected)
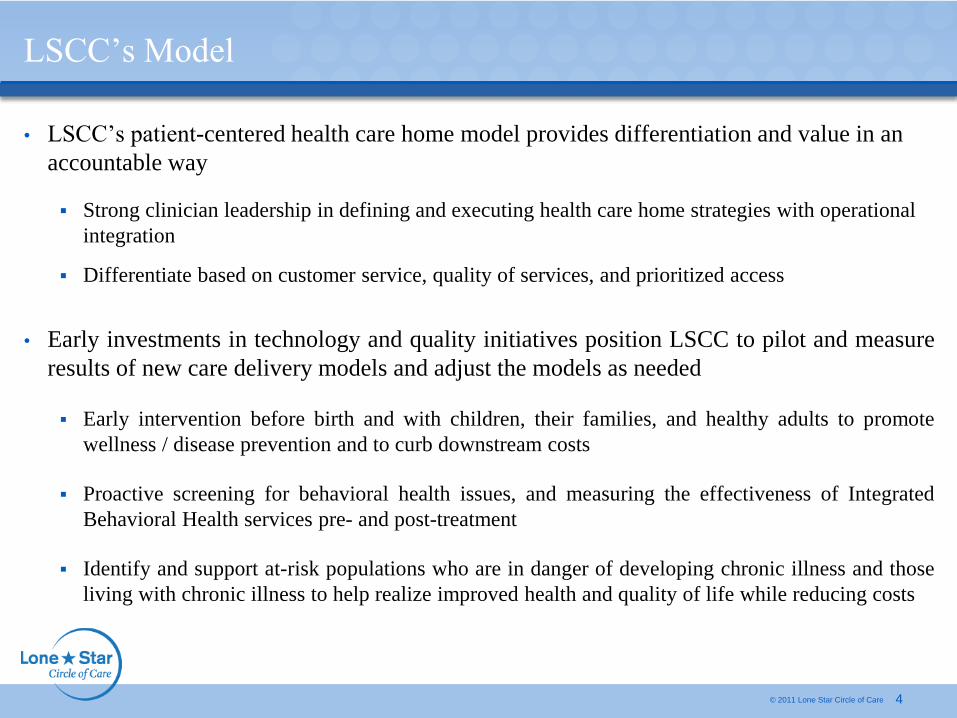
LSCC’s Model
4 © 2011 Lone Star Circle of Care
• LSCC’s patient-centered health care home model provides differentiation and value in an
accountable way
Strong clinician leadership in defining and executing health care home strategies with operational
integration
Differentiate based on customer service, quality of services, and prioritized access
• Early investments in technology and quality initiatives position LSCC to pilot and measure
results of new care delivery models and adjust the models as needed
Early intervention before birth and with children, their families, and healthy adults to promote
wellness / disease prevention and to curb downstream costs
Proactive screening for behavioral health issues, and measuring the effectiveness of Integrated
Behavioral Health services pre- and post-treatment
Identify and support at-risk populations who are in danger of developing chronic illness and those
living with chronic illness to help realize improved health and quality of life while reducing costs
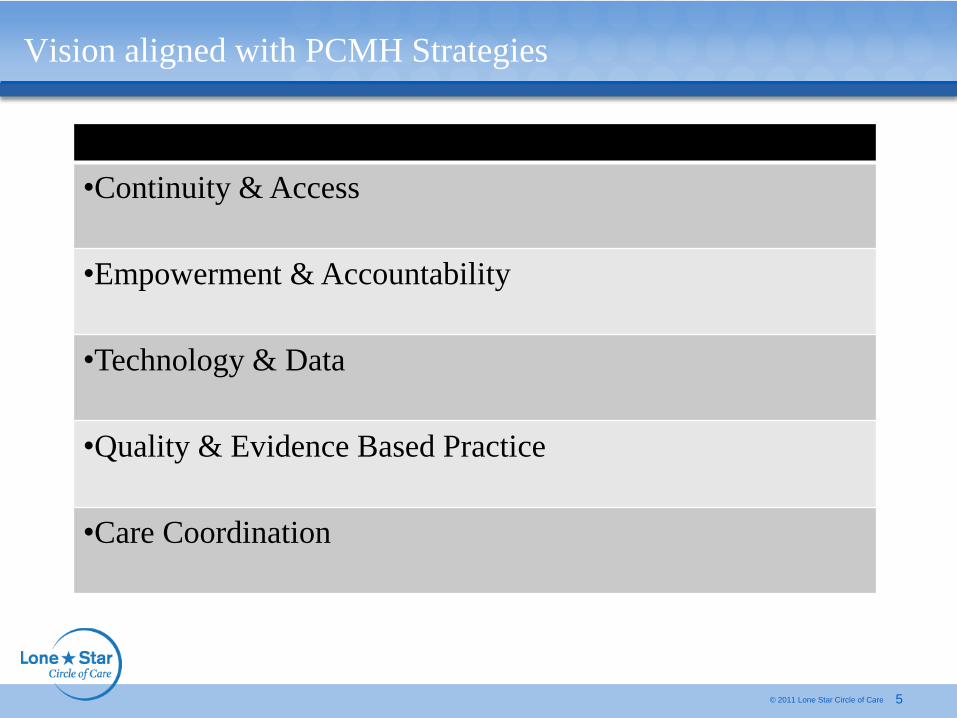
Vision aligned with PCMH Strategies
5 © 2011 Lone Star Circle of Care
•Continuity & Access
•Empowerment & Accountability
•Technology & Data
•Quality & Evidence Based Practice
•Care Coordination
6 © 2011 Lone Star Circle of Care
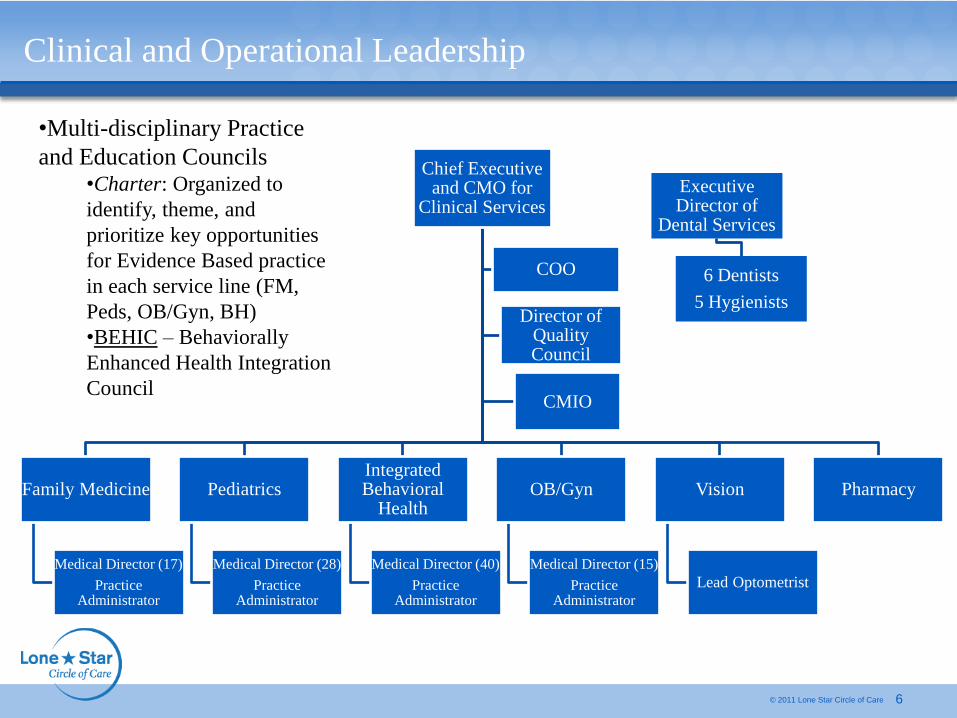
Clinical and Operational Leadership
•Multi-disciplinary Practice
and Education Councils •Charter: Organized to
identify, theme, and
prioritize key opportunities
for Evidence Based practice
in each service line (FM,
Peds, OB/Gyn, BH)
•BEHIC – Behaviorally
Enhanced Health Integration
Council
Chief Executive and CMO for
Clinical Services
)
COO
Director of Quality Council
CMIO
Family Medicine
Medical Director (17)
Practice Administrator
Pediatrics
Medical Director (28
Practice Administrator
Integrated Behavioral
Health
Medical Director (40)
Practice Administrator
OB/Gyn
Medical Director (15)
Practice Administrator
Vision
Lead Optometrist
Pharmacy
Executive Director of
Dental Services
6 Dentists
5 Hygienists
7 © 2011 Lone Star Circle of Care
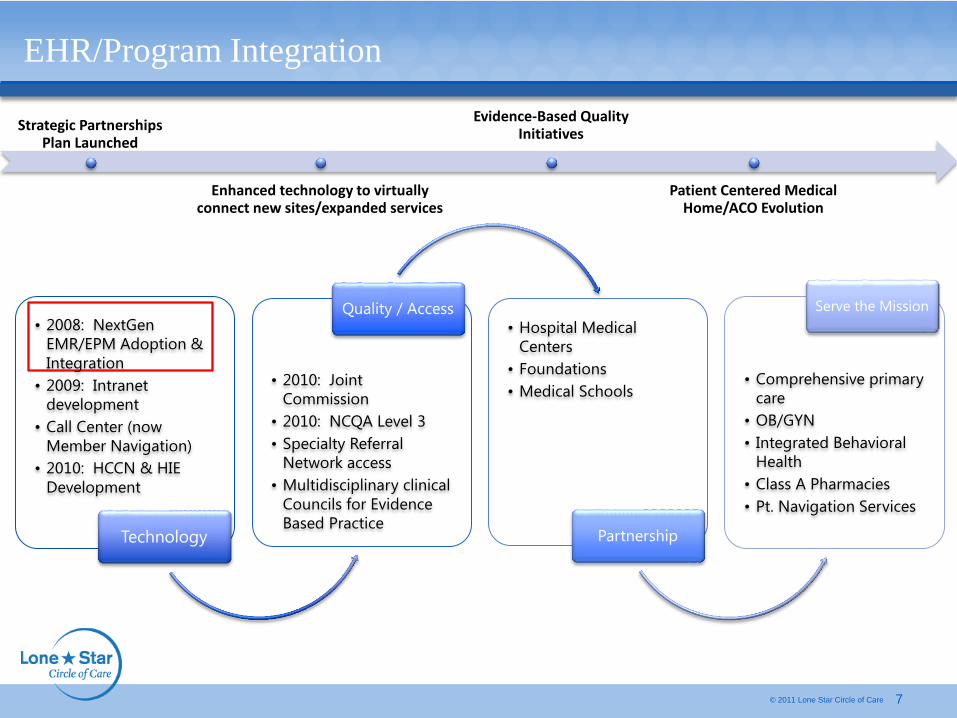
EHR/Program Integration
Strategic Partnerships Plan Launched
Enhanced technology to virtually connect new sites/expanded services
Evidence-Based Quality Initiatives
Patient Centered Medical Home/ACO Evolution
• 2008: NextGen
EMR/EPM Adoption &
Integration
• 2009: Intranet
development
• Call Center (now
Member Navigation)
• 2010: HCCN & HIE
Development
Technology
• 2010: Joint
Commission
• 2010: NCQA Level 3
• Specialty Referral
Network access
• Multidisciplinary clinical
Councils for Evidence
Based Practice
Quality / Access
• Hospital Medical
Centers
• Foundations
• Medical Schools
Partnership
Serve the Mission
• Comprehensive primary
care
• OB/GYN
• Integrated Behavioral
Health
• Class A Pharmacies
• Pt. Navigation Services

8 © 2011 Lone Star Circle of Care
EHR Integration

9 © 2011 Lone Star Circle of Care
EHR Integration
10 © 2011 Lone Star Circle of Care
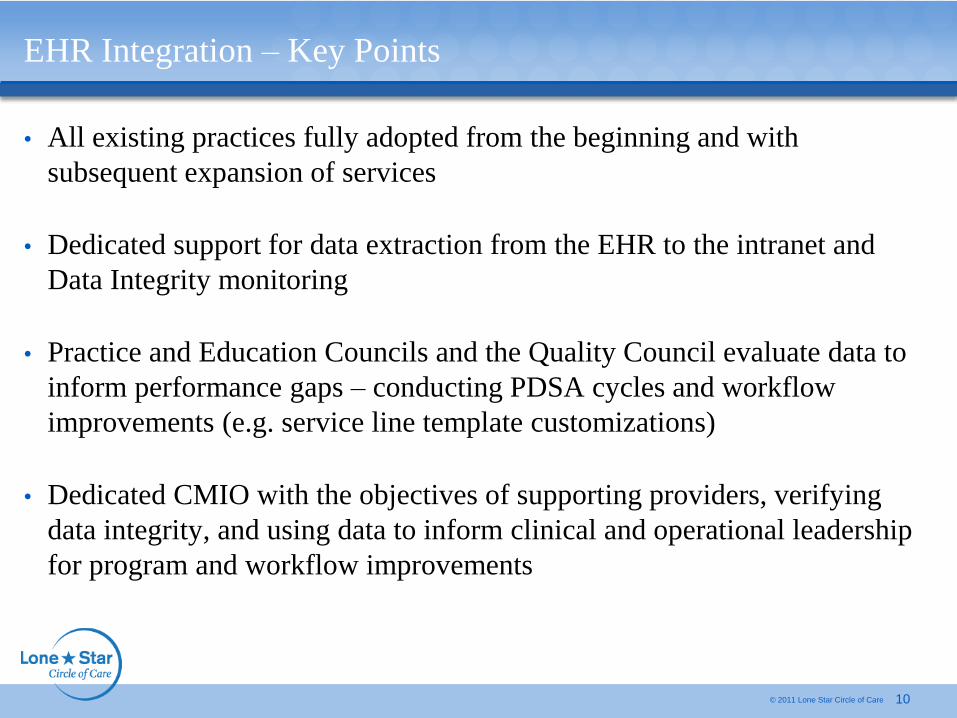
EHR Integration – Key Points
• All existing practices fully adopted from the beginning and with
subsequent expansion of services
• Dedicated support for data extraction from the EHR to the intranet and
Data Integrity monitoring
• Practice and Education Councils and the Quality Council evaluate data to
inform performance gaps – conducting PDSA cycles and workflow
improvements (e.g. service line template customizations)
• Dedicated CMIO with the objectives of supporting providers, verifying
data integrity, and using data to inform clinical and operational leadership
for program and workflow improvements

11 © 2011 Lone Star Circle of Care
Member Navigation Center
• Far beyond a traditional call center, LSCC’s Member Navigation Center (MNC)
proactively manages LSCC patients (members) using state-of-the-art technology,
connecting them to every service they need throughout the healthcare continuum
Goal is to provide patient-centered, responsive, proactive care that focuses on
improving quality and reducing costs
• The MNC’s functionality is maximized via LSCC’s EHR, as MNC staff can access
data across LSCC’s entire network versus a single clinic site
Functionality will be further enhanced with HIE integration and Clinical Decision
Support and Care Coordination Software
• Vision: Utilize technology and highly trained, experienced teams to provide quality
communication, health education, Chronic Disease management, care coordination, and
overall navigation experiences throughout the community to “evolutionize” the
delivery of healthcare

Member Navigation Center - Clinical Interventionists
12 © 2011 Lone Star Circle of Care
‒ Obesity
• LSCC Clinical Interventionists - experienced Registered Nurses
Identify risks and proactively manage patient care continuum needs
Increase compliance to visits and care plans
Serve as part of the integrated care team with provider directed protocols
Hospitalization Follow Up (in-patient and ER) ‒ Records
‒ Medication Update
‒ Orders
Medication Management
Prevention: Well Child Visits, Well Woman Care
Chronic Disease Management: protocol and evidence driven ‒ Asthma
‒ Diabetes
‒ Hypertension
13 © 2011 Lone Star Circle of Care
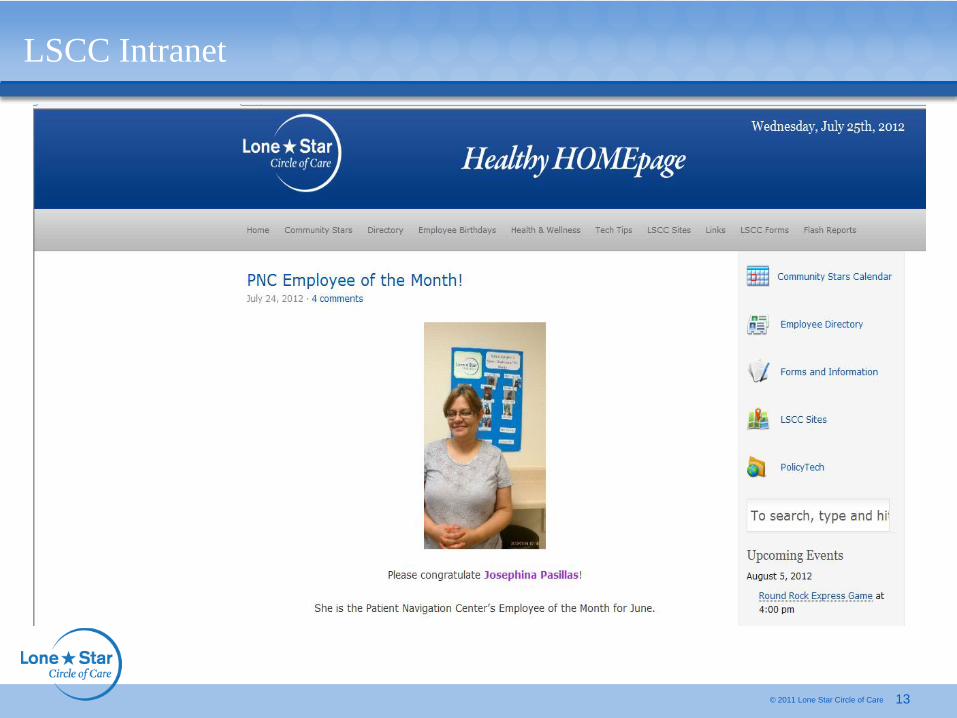
LSCC Intranet

Intranet Reports
14 © 2011 Lone Star Circle of Care

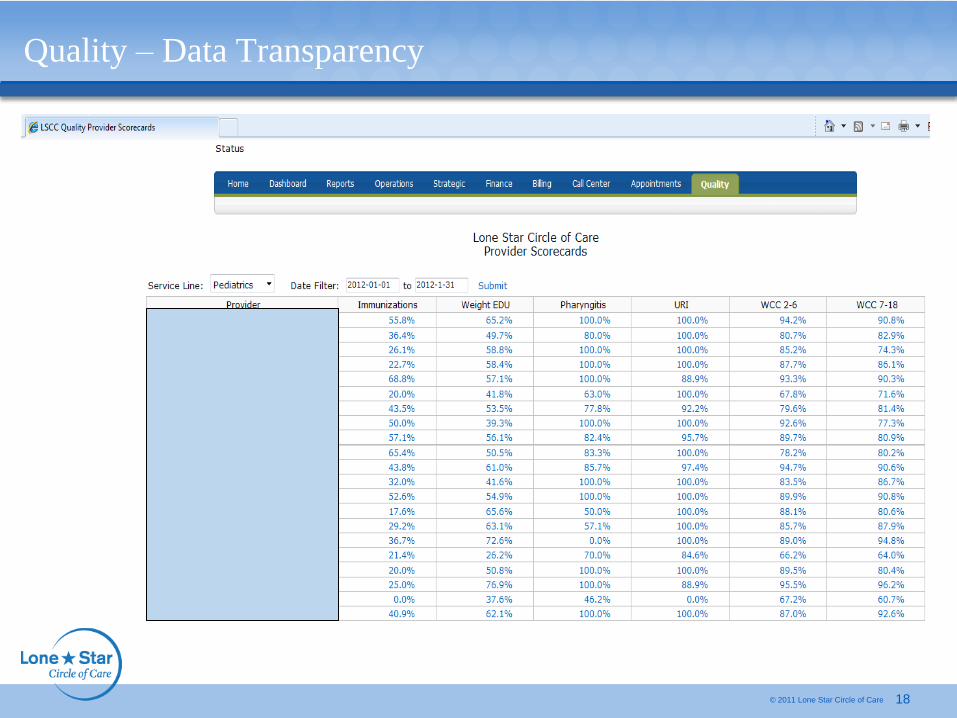
Quality – Data Transparency
15 © 2011 Lone Star Circle of Care
16 © 2011 Lone Star Circle of Care
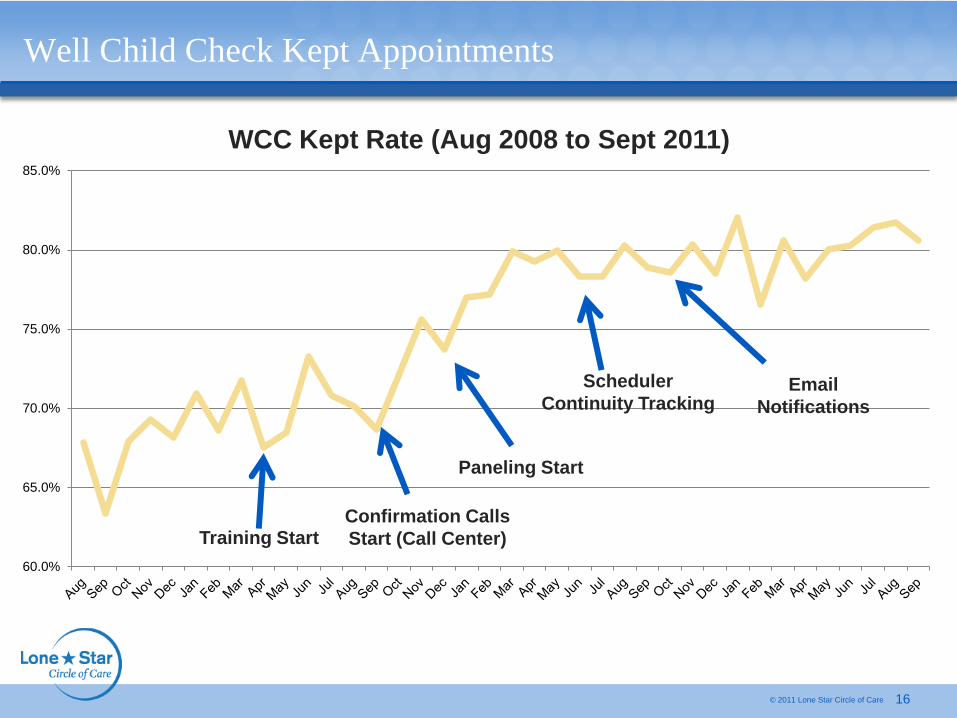
Well Child Check Kept Appointments
WCC Kept Rate (Aug 2008 to Sept 2011)
60.0%
65.0%
70.0%
75.0%
80.0%
85.0%
Scheduler
Continuity Tracking
Training Start Confirmation Calls
Start (Call Center)
Paneling Start
Notifications

Quality – Data Transparency
17 © 2011 Lone Star Circle of Care
18 © 2011 Lone Star Circle of Care
Quality – Data Transparency
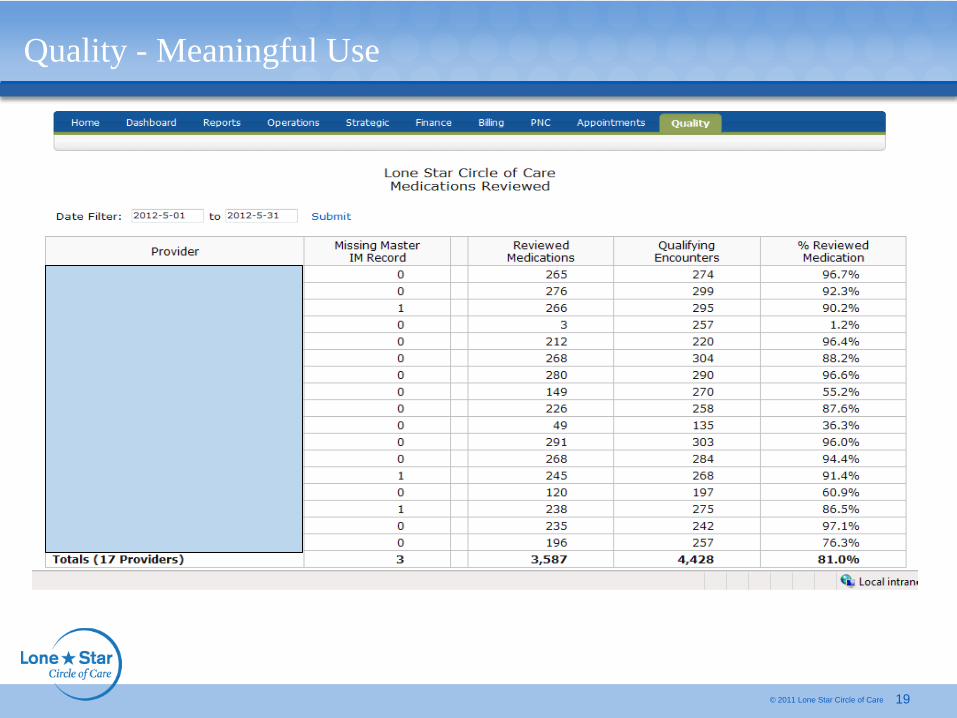
19 © 2011 Lone Star Circle of Care
Quality - Meaningful Use

20 © 2011 Lone Star Circle of Care
Service
Line
Provider Name
FP Bane FNP, Ginger
FP Bettes PA, Jeanette L
FP Dent DO, Marenda
FP Duarte ANP, Maria C
FP Eapen MD, Prakash
FP Fiedler MD , Benjamin P
FP Folarin MD, Hope
FP Ghaffar MD, Anila
FP Gildersleeve MD, Roger
FP Hartline FNP, Meredith
FP Hauser FNP, Cammie
FP MacDonald FNP, Kristin
FP McLemore DO, C
FP Moeller MD, Erica
FP Schiller FNP, Jessica
FP Snider FNP, Ashley
FP Vicknair FNP, Ann N
Quality - Meaningful Use
CPOE eRx Active Record Vitals Smoke Med Allergy Patient Problem
≥ 31% ≥ 41% Med List
≥ 81%
Demogr
≥ 51%
≥ 51% Status
≥ 51% Recon
≥ 51%
List
≥ 81%
Plan
≥ 51%
List
≥ 81%
99% 88% 100% 100% 94% 94% 96% 98% 93% 100%
100% 85% 100% 100% 97% 78% 100% 99% 93% 100%
99% 97% 100% 100% 100% 95% 92% 100% 97% 100%
99% 91% 99% 100% 100% 95% 100% 97% 97% 100%
100% 83% 100% 99% 97% 70% 97% 98% 97% 100%
99% 65% 100% 100% 99% 97% 97% 100% 99% 100%
100% 79% 100% 100% 94% 78% 87% 95% 80% 100%
99% 90% 100% 99% 98% 92% 100% 99% 99% 100%
97% 87% 100% 100% 96% 93% 100% 100% 98% 100%
100% 86% 100% 100% 97% 94% 100% 99% 89% 100%
100% 85% 100% 100% 97% 92% 100% 100% 97% 100%
100% 89% 100% 99% 99% 78% 100% 98% 100% 100%
99% 78% 100% 99% 100% 97% 100% 100% 91% 100%
100% 78% 100% 100% 99% 94% 100% 100% 93% 100%
99% 84% 99% 99% 97% 84% 98% 98% 97% 100%
98% 75% 100% 100% 99% 92% 100% 100% 93% 100%
100% 81% 100% 100% 95% 91% 95% 97% 86% 100%

Summary – Lessons learned
© 2011 Lone Star Circle of Care 21
• Early investments in technology infrastructure and its clinically integrated support,
as well as a vision for quality informed and evidence based care are critical
Avoid the trap of collecting data for ‘collecting sake’
• Strong Clinical Leadership in Quality
Integrated forums for data evaluation, piloting processes and care improvement
Utilization of real-time data through multiple dashboards
• Integration across the clinical practice team – avoid the silos
• Data transparency and testing for accuracy and integrity are critical
• Culture setting for Quality and Improvement is continuous and ever-evolving


Office of Health Information Technology and
Quality
Additional HRSA Health IT and Quality Toolboxes and
Resources including past webinars can be found at:
http://www.hrsa.gov/healthit
http://www.hrsa.gov/quality
Please visit HRSA’s New Clinical Quality & Performance Measures Toolkit,
located on HRSA Quality Improvement website
(http://www.hrsa.gov/quality)
Additional questions can sent to the following e-mail address:
[email protected] • US Department of Health and Human Services
• Health Resources and Ser vices Administration