hrs documentation report dr-027 new measures of fluid ... · new measures of fluid intelligence in...
TRANSCRIPT

1
HRS Documentation Report DR-027
New Measures of Fluid Intelligence in the HRS
Quantitative Reasoning Verbal Reasoning Verbal Fluency
Report Prepared by:
Gwenith G. Fisher, John J. McArdle, Ryan J. McCammon, Amanda Sonnega, & David R. Weir
Survey Research Center, Institute for Social Research
University of Michigan
Last Updated: January 30, 2014

2
New Measures of Fluid Intelligence in the HRS
Contents Background ....................................................................................................................................................................... 4
Pilot Development for New Cognitive Measures .............................................................................................................. 5
HRS 2010 Number Series ................................................................................................................................................. 5
Figure 1. Number Series flow ................................................................................................................................... 6
Task Instructions and Sample Items: ......................................................................................................................... 6
HRS 2010 Number Series Items.................................................................................................................................... 8
Administration Time ..................................................................................................................................................... 9
Methodological Issues ................................................................................................................................................... 9
Scoring .......................................................................................................................................................................... 9
Calculating 2010 Number Series Score ................................................................................................................... 11
Table 1. 2010 Number Series Scoring Tables. ........................................................................................................ 11
Data Quality ................................................................................................................................................................ 12
Missing Data ............................................................................................................................................................ 12
Psychometric Characteristics ................................................................................................................................... 12
Figure 2. HRS 2010 Number Series Item Characteristic Curves ............................................................................ 13
Table 2. Item Response Theory Item Difficulty parameters (1-PL model) – HRS 2010 Number Series .............. 14
Construct Validity ................................................................................................................................................... 14
Table 3. Descriptive Statistics - Number Series in HRS 2010 by Age and Gender ................................................ 15
Table 4. Correlation of Cognitive Measures – HRS 2010 ....................................................................................... 16
Table 5. Partial Correlations – HRS 2010 ............................................................................................................... 17
Table 6. Samples sizes for Correlations in Tables 4-5 – HRS 2010........................................................................ 18
HRS 2010 Retrieval Fluency ........................................................................................................................................... 19
Test Administration Protocol ...................................................................................................................................... 19
Question Text and Interviewer Instructions ................................................................................................................ 19
Administration Time ................................................................................................................................................... 22
Test Scoring ................................................................................................................................................................. 22
Data Quality ................................................................................................................................................................ 22
Missing data ............................................................................................................................................................ 22
Construct Validity ................................................................................................................................................... 22
HRS 2012 Number Series ............................................................................................................................................... 23
Changes in 2012 .......................................................................................................................................................... 23

3
Task Instructions ..................................................................................................................................................... 23
2012 Number Series Items: ..................................................................................................................................... 26
Administration Time ................................................................................................................................................... 27
2012 Number Series Scoring ....................................................................................................................................... 27
Data Quality ................................................................................................................................................................ 28
Table 7. Correlations of Cognitive measures 2010 - 2012 ...................................................................................... 28
Missing Data ............................................................................................................................................................ 29
Table 8. Reasons for Number Series 2012 Missing Data ........................................................................................ 29
Table 9. Number Series Missing Data in 2010 and 2012 ........................................................................................ 29
Table10. HRS 2012 Number Series Completion by 2010 Number Series Score .................................................... 30
HRS 2012 Retrieval Fluency ........................................................................................................................................... 30
HRS 2012 Verbal Analogies ........................................................................................................................................... 30
Question Text and Interviewer Instructions ................................................................................................................ 31
Figure 3. Verbal Analogies flow ................................................................................................................................. 33
2012 Verbal Analogies Items: ..................................................................................................................................... 34
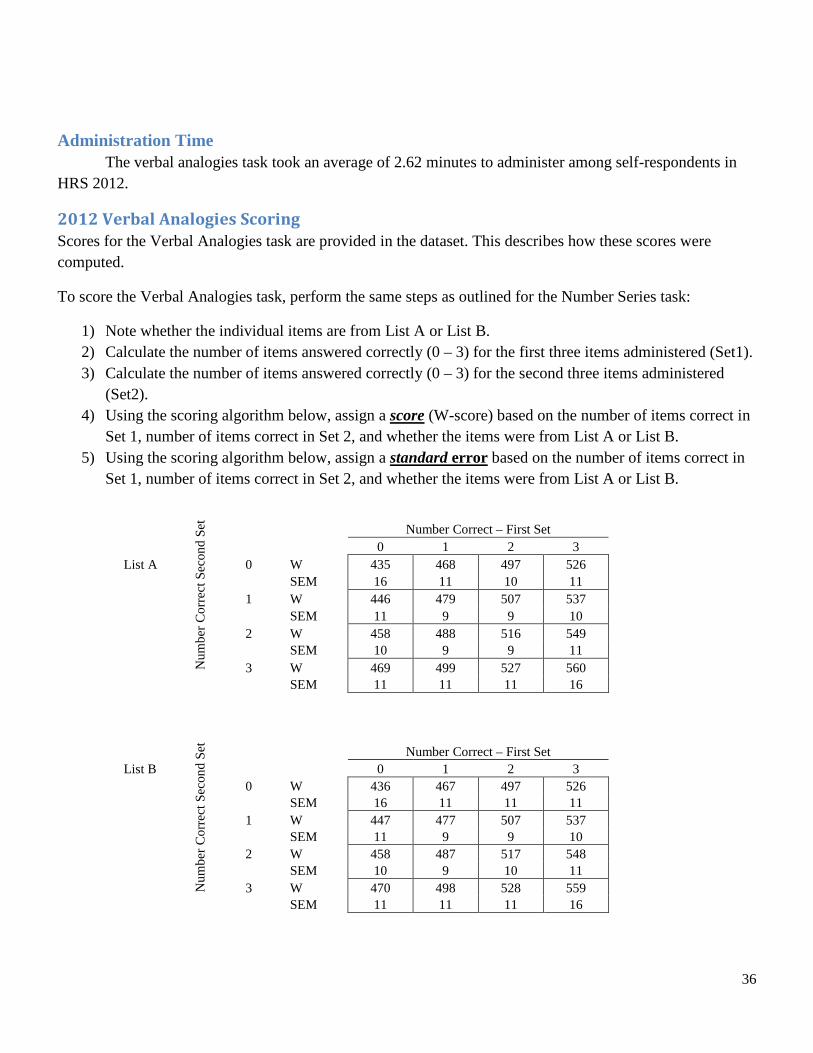
Administration Time ................................................................................................................................................... 36
2012 Verbal Analogies Scoring .................................................................................................................................. 36
Data Quality ................................................................................................................................................................ 38
Missing Data ............................................................................................................................................................ 38
Construct Validity ................................................................................................................................................... 38
Table 11. Correlation of Cognitive Measures – HRS 2012 ..................................................................................... 39
Table 12. Sample sizes for correlations in Table 10. ............................................................................................... 40
Table 13. 2012 HRS verbal analogies score by age and gender. ............................................................................. 41
References ....................................................................................................................................................................... 42
Appendix 1. HRS 2010 Number Series SAS Code for Score Computation ................................................................... 43
Appendix 2. HRS 2012 Number Series SAS Code for Score Computation ................................................................... 45
Appendix 3. HRS 2012 Verbal Analogies SAS Code for Score Computation ............................................................... 47

4
New Measures of Fluid Intelligence in the HRS
Background In 2002, the Health and Retirement Study (HRS) Data Monitoring Committee commissioned a
thorough review of the content in the HRS. Drs. Margie Lachman and Avron Spiro reviewed the section on cognitive functioning. In their report, Lachman and Spiro suggested that the existing measures of word recall, serial 7s, backwards counting, data and object naming, and vocabulary yielded valuable information about respondents’ cognitive abilities but that measures were needed to assess fluid abilities, including executive functioning and speed of response. On April 14, 2003, an expert panel meeting was convened at the Hyatt Regency in Bethesda, MD by the National Institute on Aging (NIA) to discuss options for the development of new cognitive measures in the HRS. The meeting included psychologists with expertise in cognitive functioning as well as economists, sociologists, epidemiologists, and medical doctors who would provide feedback on the recommendations from the psychologists. Meeting Organizers: John J. McArdle, Ph.D. – University of Virginia, now at University of Southern California (organizer) Christopher Hertzog, Ph.D. – Georgia Tech (organizer) Meeting Participants (listed in alphabetical order): David Cutler, Ph.D. – Harvard University and NBER
Gwenith G. Fisher, Ph.D. – University of Michigan Steven G. Heeringa, Ph.D. – University of Michigan
John Horn, Ph.D. – University of Southern California Robert Hauser, Ph.D. – University of Wisconsin Michael Hurd, Ph.D. – RAND
Margie Lachman, Ph.D. – Brandeis University David Laibson, Ph.D. – Harvard University Kenneth M. Langa, M.D., Ph.D. – University of Michigan Chuck Manski, Ph.D. – Northwestern University
Michael Marsiske, Ph.D. – University of Florida Mary Beth Ofstedal, Ph.D. – University of Michigan
Brenda Plassman, Ph.D. – Duke University Medical Center Willard L. Rodgers, Ph.D. – University of Michigan Timothy Salthouse, Ph.D. – University of Virginia Martin Sliwinski, Ph.D. – Syracuse University Ron Spiro, Ph.D. – Boston University
Peter Ubel – University of Michigan Robert Wallace, M.D., M. Sc. – University of Iowa David R. Weir, Ph.D. – University of Michigan Keith Widaman, Ph.D. – University of California, Davis Robert J. Willis, Ph.D. – University of Michigan Richard Suzman, Ph.D. – NIA Marcelle Morrison-Bogorad, Ph.D. – NIA

5
Pilot Development for New Cognitive Measures Following the report by Lachman and Spiro (2002) and discussion at the April, 2003 meeting, HRS
co-investigators worked with Dr. John J. McArdle, now a co-investigator of the HRS, to develop new measures of cognitive functioning in the HRS. The objective was to broaden the content domain using brief measures of cognition that could be administered over the telephone and face-to-face. In other words, the aim was to maximize the amount of information that could be assessed regarding respondent’s cognitive ability in just a few minutes of test administration.
There were several opportunities to develop and test new measures. A measure of quantitative
reasoning, the Number Series test, was first pilot-tested in a module in HRS 2004. Details of this module are in an appendix at the end of this report. A measure of verbal reasoning, the Verbal Analogies test, was first pilot- tested in a module in HRS 2006. In 2007, Drs. Jack McArdle, Willard Rodgers, and Gwenith Fisher launched a new study of Cognition and Aging in the USA (CogUSA) to measure multiple cognitive abilities in a national sample of older adults (age 51 and older). This study provided another opportunity to develop and validate new measures for use in the HRS. A measure of verbal fluency (the Retrieval Fluency test) was administered in CogUSA along with the Verbal Analogies test and the Number Series test. Results from these studies were used to refine all three measures for inclusion in HRS. The Number Series test and Retrieval Fluency test were administered in the 2010 and 2012 waves of HRS to the full sample. The Verbal Analogies test was administered to a 10 percent random sample of the full HRS sample in 2012. These new measures are described in detail in this report.
HRS 2010 Number Series
Number Series measures quantitative reasoning, a specific type of fluid cognitive ability or fluid intelligence. Quantitative reasoning ability involves reasoning with concepts that depend upon mathematical relationships. The number series task requires the respondent to look at a series of numbers with a number missing from the series. The respondent must determine the numerical pattern and then provide the missing number in the series.
The HRS Number Series task is a 6-item block-adaptive test. “Block-adaptive” refers to the skip pattern among the items during test administration that changes (adapts) based on the respondents’ ability-level. The Number Series task is based on two lists of 15 items. The 15 items are grouped into five sets or “blocks” of three items by item difficulty level. Item difficulty level refers to the probability that a respondent will answer the item correctly. All respondents are first asked the same first three items (termed Block 3 here), which consist of an easier item (item #4), a moderately difficult item (#7), and a more difficult item (#11). Based on the number of items answered correctly in the first block of three items, respondents are then asked one of 4 remaining sets of three items: the easiest set (#1,2,and 3), a somewhat easy set (#5,6, and 8), a more difficult set (#9, 10, and 12), or a most difficult set (#13, 14, an 15). A score for the both sets is then calculated.

6
Figure 1. Number Series flow
Task Instructions and Sample Items: The following instructions were used in HRS 2010:
D200_NSIntro.
Next I'm going to read you several numbers and I'd like you to write them down. There will be a blank number in the series that I read to you. I would like you to tell me what number goes in the blank. IWER: Make sure R has pencil and paper ready for writing down the numbers. Clarify instructions for the R if necessary. For example, if I said the numbers “1 2 BLANK 4,” then what number would go in the blank?” CORRECT RESPONSE: 3 IWER: If R does not give the correct response (3) then say: The number 3 goes in the blank because the correct order is 1 2 3 4. (Probe to check that the respondent understands.) IWER: If the respondent says they do not know the answer, record Ctrl-D. Do not record a “:Don’t Know response as “unable to do.”
1. Correct (Go to D242) 5. Incorrect (Go to D240) 6. R Doesn’t Understand Instructions (Go to D240) 7. R Unable to do* *Note: Code value 7 was added in post-processing based on manual review of data and F2 comments.
Set 1 (Block 3)
Set 2 – Block 1
Set 2 – Block 2
Set 2 – Block 4
Set 2 – Block 5
Calculate Set 1 Score
Calculate Set 2 Score
Calculate Total Score
& Standard Error
0
1
2
3
7
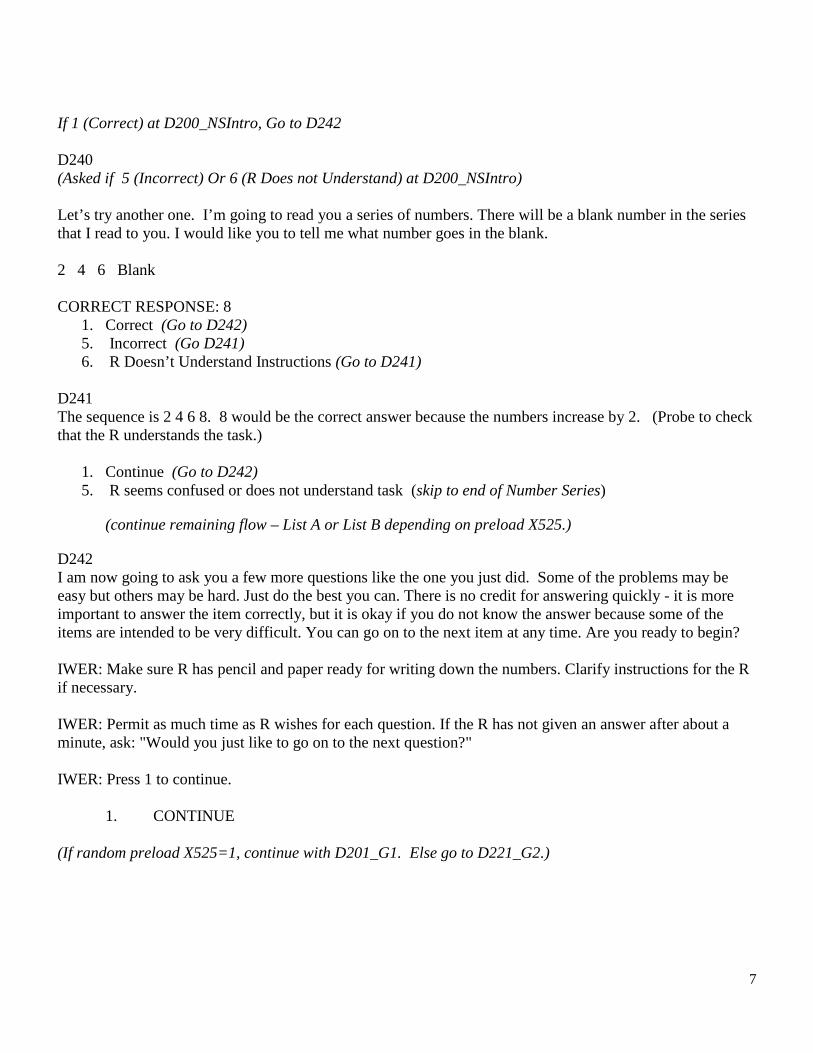
If 1 (Correct) at D200_NSIntro, Go to D242 D240 (Asked if 5 (Incorrect) Or 6 (R Does not Understand) at D200_NSIntro) Let’s try another one. I’m going to read you a series of numbers. There will be a blank number in the series that I read to you. I would like you to tell me what number goes in the blank. 2 4 6 Blank CORRECT RESPONSE: 8
1. Correct (Go to D242) 5. Incorrect (Go D241) 6. R Doesn’t Understand Instructions (Go to D241)
D241 The sequence is 2 4 6 8. 8 would be the correct answer because the numbers increase by 2. (Probe to check that the R understands the task.)
1. Continue (Go to D242) 5. R seems confused or does not understand task (skip to end of Number Series)
(continue remaining flow – List A or List B depending on preload X525.)
D242 I am now going to ask you a few more questions like the one you just did. Some of the problems may be easy but others may be hard. Just do the best you can. There is no credit for answering quickly - it is more important to answer the item correctly, but it is okay if you do not know the answer because some of the items are intended to be very difficult. You can go on to the next item at any time. Are you ready to begin? IWER: Make sure R has pencil and paper ready for writing down the numbers. Clarify instructions for the R if necessary. IWER: Permit as much time as R wishes for each question. If the R has not given an answer after about a minute, ask: "Would you just like to go on to the next question?" IWER: Press 1 to continue.
1. CONTINUE
(If random preload X525=1, continue with D201_G1. Else go to D221_G2.)

8
HRS 2010 Number Series Items
Block_1
List A
List B
MD204-A1 6 7 __ 9
MD204-A2 4 5 6 __
Correct: 8
Correct: 7 MD205-B1 6 __ 4 3
MD205-B2 5 4 3 __
Correct: 5
Correct: 2 MD206-C1 5 8 11 __
MD206-C2 11 __ 15 17
Correct: 14
Correct: 13 Block 2
MD207-D1 8 __ 12 14
MD207-D2 7 10 13 __
Correct: 10
Correct: 16 MD208-E1 __ 4 6 8
MD208-E2 __ 15 13 11
Correct: 2
Correct: 17 MD209-F1 1 3 3 5 7 7 __
MD209-F2 10 6 3 __
Correct: 9
Correct: 1
Block_3 (All Rs Start Here)
MD201 - G1 23 26 30 35 __
MD201 - G1 __ 13 15 18 22
Correct: 41
Correct: 12
MD202 - H1 18 10 6 __ 3
MD202 - H1 11 9 6 __
Correct: 4
Correct: 2
MD203 - I1 17 __ 12 8
MD203 - I1 1 3 9 __
Correct: 15
Correct: 27
Block 4
MD210-J1 10 __ 3 1
MD210-J2 13 15 19 __
Correct: 6
Correct: 27,35,25,26
MD211-K1 18 17 15 __ 8
MD211-K2 18 17 __ 12 8
Correct: 12
Correct: 15
MD212-L1 17 16 14 10 __
MD212-L2 3 3 4 6 6 7 __ __
Correct: 2,3
Correct: 9,9
Block 5
MD213-M1 __ 20 26 38 62
MD213-M2 6 __ 15 27 51
Correct: 17
Correct: 9
MD214-N1 5 __ 11 19 35
MD214-N2 __ 18 24 36 60
Correct: 7
Correct: 15
MD215-O1 70 __ __ 84
MD215-O2 60 33 24 21 __
Correct: 72,76,78,82
Correct: 20

9
Administration Time The 2010 number series task, including instructions and answers to six items, took 4.5 minutes on average to administer, including the introduction, sample items, and test items.
Methodological Issues Number series items were only asked of self-respondents in the core HRS survey. In other words,
proxy respondents were not asked these questions.
The initial item sets included published test items that are part of the Woodcock Johnson III Number Series test published by Riverside. Because of copyright restrictions, 12 items with comparable levels of item difficulty were selected from a set of unpublished items and replaced in May, 2010. The version used can be tracked by using the data model version variable (MVDATE, available in Section D). The initial items were asked in Data Models 1-3, and replaced in Data Model 4. The final set of items is presented above. The same scoring key may be used for both versions.
A second issue is that the 2010 version the ordering of the questions did not correspond as intended with the item difficulty. Specifically, the first set of three items should have consisted of items 4, 7, and 11 when ordered by difficulty level. However, the first set actually consisted of items 7, 8, and 9. This resulted in the very first item being more difficult than intended and the third item in the first set being slightly easier than intended. Unfortunately, this problem was not discovered until after all the HRS 2010 fieldwork had been completed. The scoring tables were established in a manner that took this error into account. For a few scores, the standard errors are quite large.. The correction was made for the 2012 version of the test.
Scoring Scores for the Number Series task are provided in the dataset (Section D): MNSSCORE for the total
score, and MNSSCORESE for the standard error. (In the RAND data the total score is termed RwNSSCRE and standard error is termed RwNSSCSE.) The items used in HRS 2010 allow for a range of W scores from 390.2 to 579.6, where higher scores indicate better performance on the Number Series task.
The total score, MNSSCORE, is a calculated score that attempts to take into account which blocks of
items were asked (i.e., the difficulty level of the items presented in terms of the probability that a respondent will answer correctly) and the number of items answered correctly in each block. This calculated score is a standardized score based on a logit scale that takes into account the probability of answering the item correctly. This standardized score is called a W-score, comparable to the W-scores in the Woodcock-Johnson III (WJ-III) test battery on which this task was based (Jaffe, 2009). The W-score metric was developed by scaling the performance of the WJ-III norming sample so that a score of 500 represents the average performance of a 10 year-old child. The W-scale is a transformation of the difficulty parameters from a Rasch (1 parameter logistic, 1PL) item response theory (IRT) model, so logits could be used instead. The exact distribution of scores in the HRS or other samples is likely to differ from the WJ-III norming sample such that the mean may not be exactly equal to 500. The W-scale is intended to be an interval scale, so it is not arbitrary, and - the difference in performance represented by a given difference in scores is the same, regardless of where the scores fall on the scale. For example, the difference in performance between two individuals scoring 390 and 400 is supposed to be the same as the difference in performance between two individuals scoring 500 and 510, respectively.

10
The scaling of W-scores is such that a 10-point decrease in the W-score represents halving the probability of a correct response to an item of equal difficulty. For example, a 10-point decline in an individual’s W-score (e.g., 510 to 500) between two occasions of measurement suggests a decline in the probability of a correct response from 0.50 to 0.25 for items of equal difficulty (Jaffe, 2009). In HRS, the Number Series test was designed to be administered quickly (approximately 4 minutes). While the block adaptive design allows for assessment across a range of performance levels, the W-score estimates lack the internal consistency reliability and measurement precision of the full WJ-III quantitative reasoning test because it uses only 6 items per respondent. MNSSCORESE is the standard error of the Number Series score. The value indicates the measurement precision of the total score. As shown by the standard errors of the estimates (Table 1), the precision of the W-score estimate is limited. It is also important to note that the standard errors are larger for more extreme scores, where there is less measurement precision. Standard errors can be used in analysis to model measurement uncertainty or as a weight. The limited number of Number Series items administered and the block-adaptive design make it unfeasible to report a reliability coefficient for the number series items in HRS. The published internal consistency reliability for the W-JIII quantitative concepts test is 0.91. While this is an upper bound for the reliability of the items as administered, it does provide reasonable evidence that the items are correlated with another in a consistent manner.
Although the W-score (MNSSCORE) has a number of desirable characteristics that make it the recommended score to be used when analyzing results of the Number Series task; however, users may wish to explore alternative scoring approaches. For this reason, the public data includes variables for each of the number series items (MD201-MD215 & MD221-MD235). The three items within each block are in order of increasing difficulty. The calculated W-score, however, is based simply on the number of items answered correctly in the block administered in the second set, and is the average score across the possible item scoring combinations.
The next section describes how these scores were computed.

11
Calculating 2010 Number Series Score To score the Number Series task, perform the following steps:
1) Note whether the individual items are from List A or List B. 2) Calculate the number of items answered correctly (0 – 3) for the first three items administered (Set1). 3) Calculate the number of items answered correctly (0 – 3) for the second three items administered
(Set2). 4) Using the scoring algorithm below, assign a score (W-score) based on the number of items correct in
Set 1, number of items correct in Set 2, and whether the items were from List A or List B. 5) Using the scoring algorithm below, assign a standard error based on the number of items correct in
Set 1, number of items correct in Set 2, and whether the items were from List A or List B.
Table 1. 2010 Number Series Scoring Tables.
Num
ber C
orre
ct S
econ
d Se
t
Number Correct – First Set
0 1 2 3
List A 0 W 390.2 480.5 518.3 530.6
SEM 16.3 12.2 8.2 9
1 W 403.4 495.6 525.2 540.8
SEM 13.2 11.4 7.8 10.6
2 W 442.7 508.1 532 560.4
SEM 38.2 9.9 8.2 16.8
3 W 491.8 518 540.8 579.6
SEM 18.5 10.9 10.2 18
Num
ber C
orre
ct S
econ
d Se
t
Number Correct – First Set
List B
0 1 2 3
0 W 403.6 483.2 519.1 523.5
SEM 18.3 12.0 8.2 9.2
1 W 427.1 497.7 526.0 542.4
SEM 21 11.2 7.8 9.2
2 W 461 509.8 532.9 554.5
SEM 16.6 9.7 8.2 11.5
3 W 492.5 519.5 541.7 565.9
SEM 18.5 9.2 10.2 15.9
12
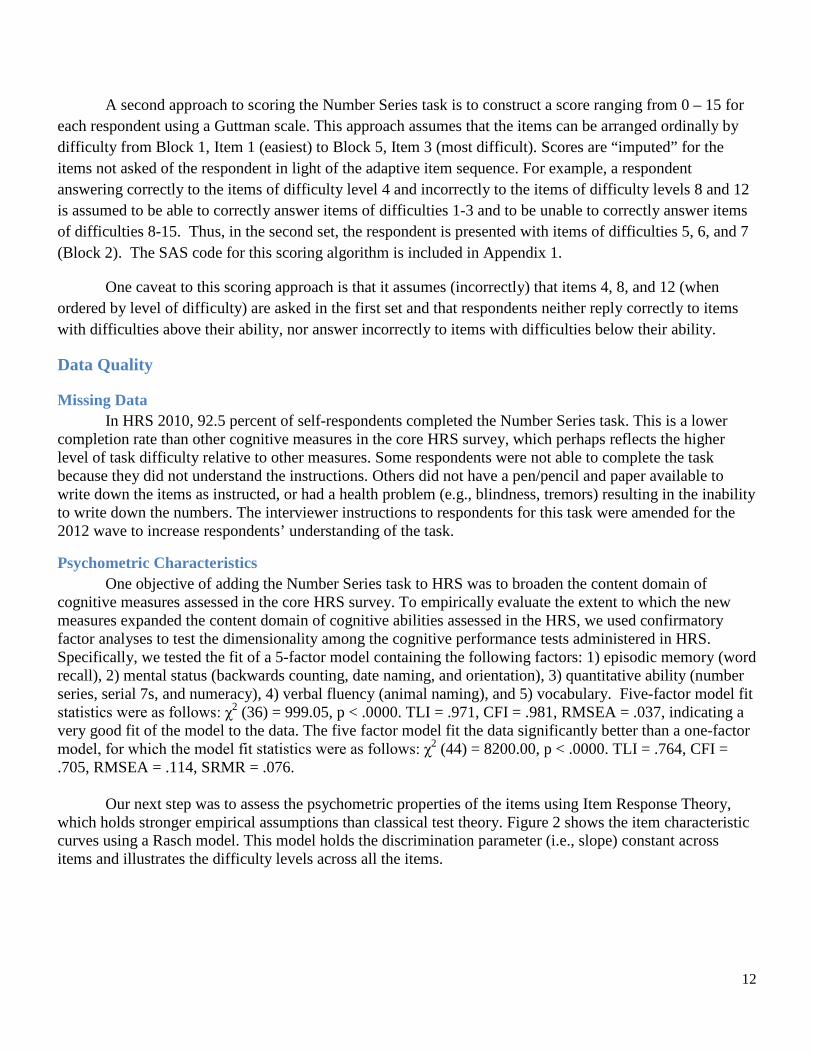
A second approach to scoring the Number Series task is to construct a score ranging from 0 – 15 for each respondent using a Guttman scale. This approach assumes that the items can be arranged ordinally by difficulty from Block 1, Item 1 (easiest) to Block 5, Item 3 (most difficult). Scores are “imputed” for the items not asked of the respondent in light of the adaptive item sequence. For example, a respondent answering correctly to the items of difficulty level 4 and incorrectly to the items of difficulty levels 8 and 12 is assumed to be able to correctly answer items of difficulties 1-3 and to be unable to correctly answer items of difficulties 8-15. Thus, in the second set, the respondent is presented with items of difficulties 5, 6, and 7 (Block 2). The SAS code for this scoring algorithm is included in Appendix 1.
One caveat to this scoring approach is that it assumes (incorrectly) that items 4, 8, and 12 (when ordered by level of difficulty) are asked in the first set and that respondents neither reply correctly to items with difficulties above their ability, nor answer incorrectly to items with difficulties below their ability.
Data Quality
Missing Data In HRS 2010, 92.5 percent of self-respondents completed the Number Series task. This is a lower
completion rate than other cognitive measures in the core HRS survey, which perhaps reflects the higher level of task difficulty relative to other measures. Some respondents were not able to complete the task because they did not understand the instructions. Others did not have a pen/pencil and paper available to write down the items as instructed, or had a health problem (e.g., blindness, tremors) resulting in the inability to write down the numbers. The interviewer instructions to respondents for this task were amended for the 2012 wave to increase respondents’ understanding of the task.
Psychometric Characteristics One objective of adding the Number Series task to HRS was to broaden the content domain of
cognitive measures assessed in the core HRS survey. To empirically evaluate the extent to which the new measures expanded the content domain of cognitive abilities assessed in the HRS, we used confirmatory factor analyses to test the dimensionality among the cognitive performance tests administered in HRS. Specifically, we tested the fit of a 5-factor model containing the following factors: 1) episodic memory (word recall), 2) mental status (backwards counting, date naming, and orientation), 3) quantitative ability (number series, serial 7s, and numeracy), 4) verbal fluency (animal naming), and 5) vocabulary. Five-factor model fit statistics were as follows: χ2 (36) = 999.05, p < .0000. TLI = .971, CFI = .981, RMSEA = .037, indicating a very good fit of the model to the data. The five factor model fit the data significantly better than a one-factor model, for which the model fit statistics were as follows: χ2 (44) = 8200.00, p < .0000. TLI = .764, CFI = .705, RMSEA = .114, SRMR = .076.
Our next step was to assess the psychometric properties of the items using Item Response Theory,
which holds stronger empirical assumptions than classical test theory. Figure 2 shows the item characteristic curves using a Rasch model. This model holds the discrimination parameter (i.e., slope) constant across items and illustrates the difficulty levels across all the items.

13
Figure 2. HRS 2010 Number Series Item Characteristic Curves
0
0.2
0.4
0.6
0.8
1
-4 -3 -2 -1 0 1 2 3 4
Prob
abili
ty
THETA
2010 HRS Number Series ICC 1-PL model
MDNS11
MDNS12
MDNS13
MDNS21
MDNS22
MDNS23
MDNS31
MDNS32
MDNS33
MDNS41
MDNS42
MDNS43
MDNS51
MDNS52
MDNS53

14
Next, we fitted a 2-parameter logistic model (2PL) to the data to examine 1) the individual items in the measure to determine how well the test discriminates on the ability level being assessed (a parameter), and 2) the item difficulty for each of the items in the measure (b parameter). Each of the 15 items of the Number Series test was included separately as a categorical variable (1=correct, 0=incorrect). Overall, results yielded a discrimination parameter of 2.242, indicating a solid ability of the measure to discriminate on the level of quantitative reasoning ability. Item-level difficulty parameters are shown in Table 2. Lower values indicate easier items, and higher values indicate more difficult items. These results confirm the manner in which the test was constructed such that the first block includes three items each with varying difficulty levels, and each of the items within the remaining blocks include an appropriate level of difficulty relative to the other blocks. In general, the items within each block increase in difficulty. The exception to this is in Block 2, where the second item appears easier than the first item. There is a significant loss of fit for the exact Rasch (1-PL) model compared to the 2-PL model (∆ χ2=2945.8, df=14, p<0.001).
Table 2. Item Response Theory Item Difficulty parameters (1-PL model) – HRS 2010 Number Series
Test Item Item difficulty Block 1 Item 1 -1.836 Block 1 Item 2 -1.310 Block 1 Item 3 -0.461 Block 2 Item 1 -0.189 Block 2 Item 2 -0.298 Block 2 Item 3 0.107 Block 3 Item 1 0.019 Block 3 Item 2 0.542 Block 3 Item 3 1.079 Block 4 Item 1 0.427 Block 4 Item 2 0.565 Block 4 Item 3 0.843 Block 5 Item 1 1.220 Block 5 Item 2 1.269 Block 5 Item 3 1.954
Construct Validity To further examine the data quality of the Number Series measure, we examined the relationship
between the Number Series score and other variables. Table 3 presents the descriptive statistics of Number Series scores in relation to age and gender. As expected, performance on the Number Series task was significantly related to both age and gender. Younger respondents and males performed better than older respondents and females (p <.001).

15
Table 3. Descriptive Statistics - Number Series in HRS 2010 by Age and Gender
Male Female Total
Age Mean SD N Mean SD N Mean SD N 50-54 505.1 42.1 1384 501.8 39.8 1747 503.3 40.9 3131 55-59 504.3 42.8 1488 498.0 41.7 1900 500.7 42.3 3388 60-64 504.8 44.6 1046 496.4 42.1 1543 499.8 43.3 2589 65-69 502.2 42.1 852 491.5 43.4 1301 495.8 43.2 2153 70-74 492.8 44.4 1155 482.2 44.8 1503 486.8 44.9 2658 75-79 487.0 44.5 812 476.9 46.2 1110 481.2 45.8 1922 80-84 485.5 44.8 529 476.9 43.8 666 480.7 44.4 1195 85+ 476.8 44.9 363 468.6 43.3 568 471.8 44.1 931 Total 498.1 44.3 7629 490.1 44.1 10338 493.5 44.4 17967
Note: Respondents born in 1959 or earlier (i.e., age 51+ in 2010); Unweighted.
16
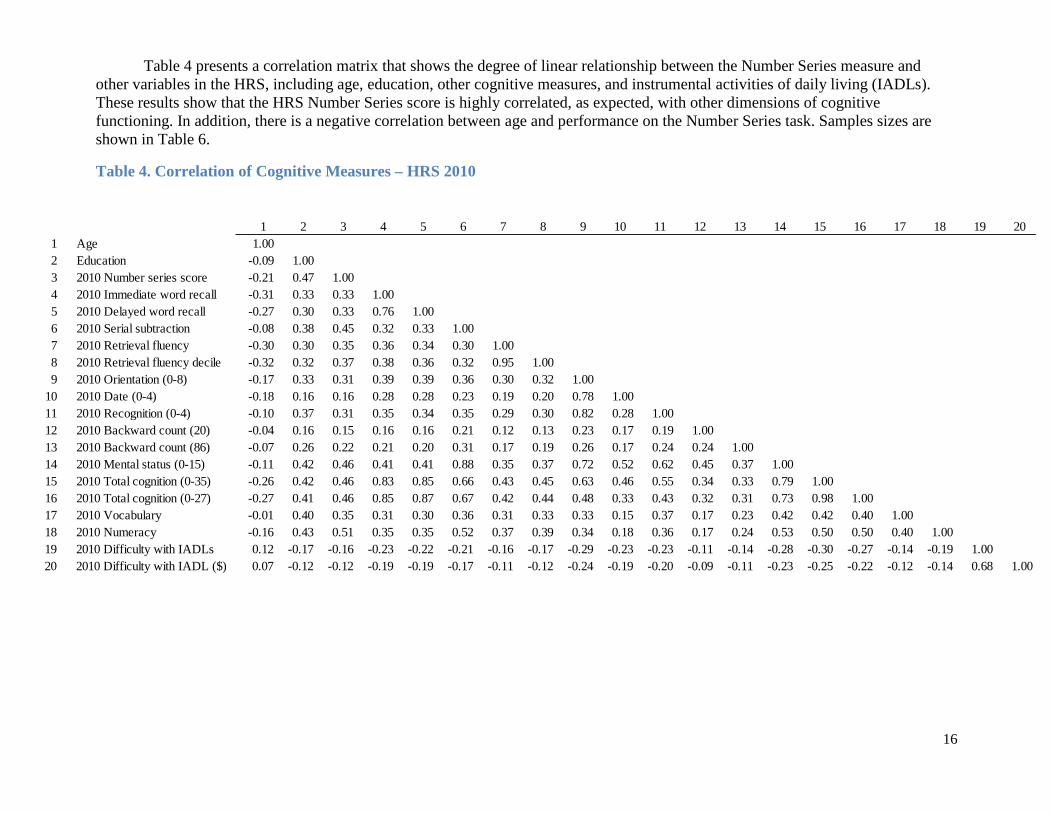
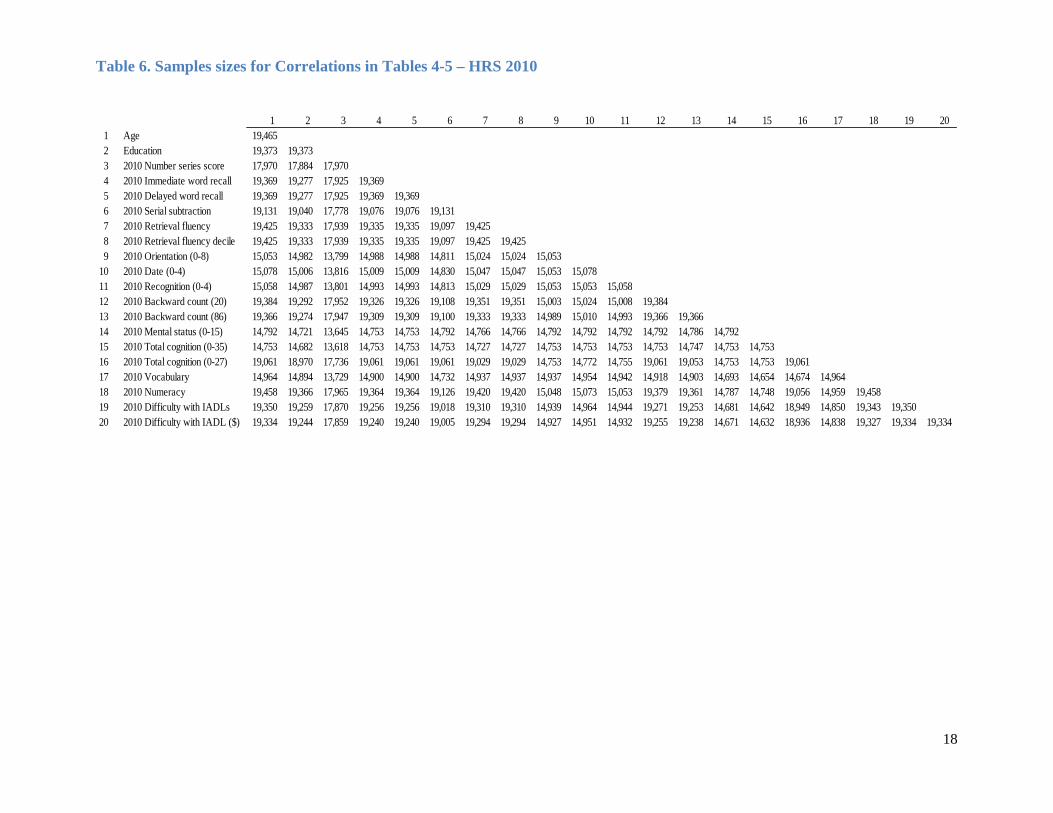
Table 4 presents a correlation matrix that shows the degree of linear relationship between the Number Series measure and other variables in the HRS, including age, education, other cognitive measures, and instrumental activities of daily living (IADLs). These results show that the HRS Number Series score is highly correlated, as expected, with other dimensions of cognitive functioning. In addition, there is a negative correlation between age and performance on the Number Series task. Samples sizes are shown in Table 6.
Table 4. Correlation of Cognitive Measures – HRS 2010
1 2 3 4 5 6 7 8 9 10 11 12 13 14 15 16 17 18 19 201 Age 1.002 Education -0.09 1.003 2010 Number series score -0.21 0.47 1.004 2010 Immediate word recall -0.31 0.33 0.33 1.005 2010 Delayed word recall -0.27 0.30 0.33 0.76 1.006 2010 Serial subtraction -0.08 0.38 0.45 0.32 0.33 1.007 2010 Retrieval fluency -0.30 0.30 0.35 0.36 0.34 0.30 1.008 2010 Retrieval fluency decile -0.32 0.32 0.37 0.38 0.36 0.32 0.95 1.009 2010 Orientation (0-8) -0.17 0.33 0.31 0.39 0.39 0.36 0.30 0.32 1.00
10 2010 Date (0-4) -0.18 0.16 0.16 0.28 0.28 0.23 0.19 0.20 0.78 1.0011 2010 Recognition (0-4) -0.10 0.37 0.31 0.35 0.34 0.35 0.29 0.30 0.82 0.28 1.0012 2010 Backward count (20) -0.04 0.16 0.15 0.16 0.16 0.21 0.12 0.13 0.23 0.17 0.19 1.0013 2010 Backward count (86) -0.07 0.26 0.22 0.21 0.20 0.31 0.17 0.19 0.26 0.17 0.24 0.24 1.0014 2010 Mental status (0-15) -0.11 0.42 0.46 0.41 0.41 0.88 0.35 0.37 0.72 0.52 0.62 0.45 0.37 1.0015 2010 Total cognition (0-35) -0.26 0.42 0.46 0.83 0.85 0.66 0.43 0.45 0.63 0.46 0.55 0.34 0.33 0.79 1.0016 2010 Total cognition (0-27) -0.27 0.41 0.46 0.85 0.87 0.67 0.42 0.44 0.48 0.33 0.43 0.32 0.31 0.73 0.98 1.0017 2010 Vocabulary -0.01 0.40 0.35 0.31 0.30 0.36 0.31 0.33 0.33 0.15 0.37 0.17 0.23 0.42 0.42 0.40 1.0018 2010 Numeracy -0.16 0.43 0.51 0.35 0.35 0.52 0.37 0.39 0.34 0.18 0.36 0.17 0.24 0.53 0.50 0.50 0.40 1.0019 2010 Difficulty with IADLs 0.12 -0.17 -0.16 -0.23 -0.22 -0.21 -0.16 -0.17 -0.29 -0.23 -0.23 -0.11 -0.14 -0.28 -0.30 -0.27 -0.14 -0.19 1.0020 2010 Difficulty with IADL ($) 0.07 -0.12 -0.12 -0.19 -0.19 -0.17 -0.11 -0.12 -0.24 -0.19 -0.20 -0.09 -0.11 -0.23 -0.25 -0.22 -0.12 -0.14 0.68 1.00
17
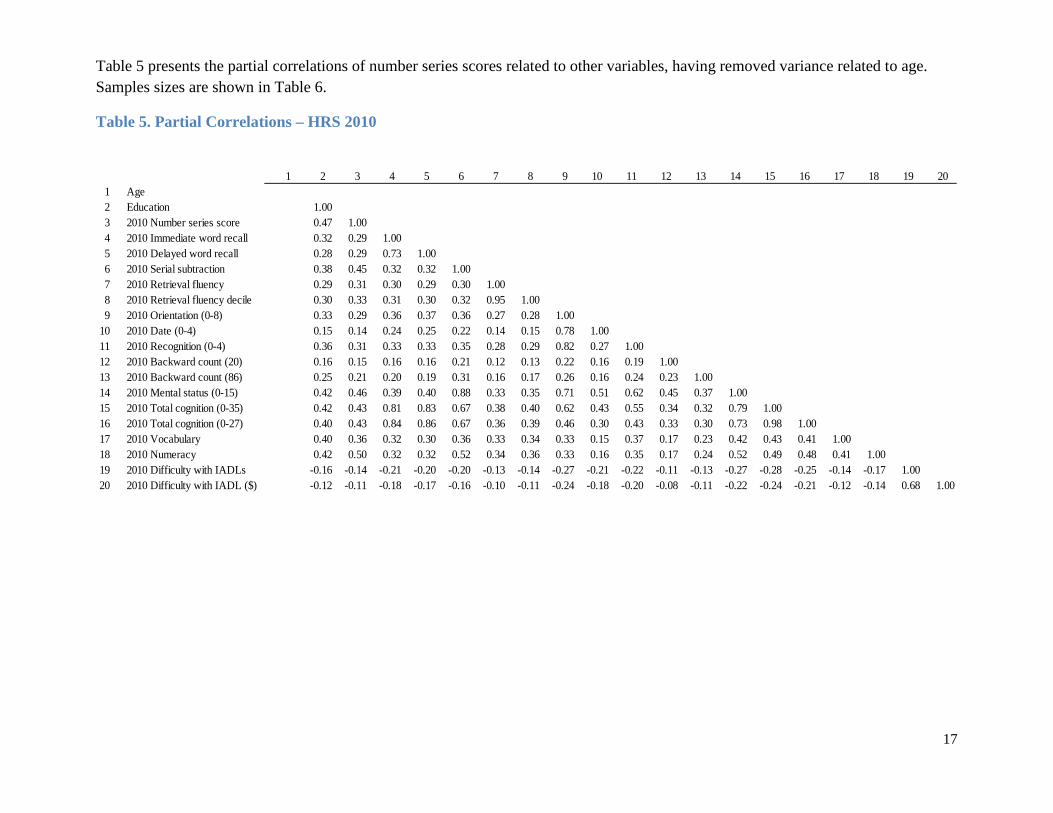
Table 5 presents the partial correlations of number series scores related to other variables, having removed variance related to age. Samples sizes are shown in Table 6.
Table 5. Partial Correlations – HRS 2010
1 2 3 4 5 6 7 8 9 10 11 12 13 14 15 16 17 18 19 201 Age2 Education 1.003 2010 Number series score 0.47 1.004 2010 Immediate word recall 0.32 0.29 1.005 2010 Delayed word recall 0.28 0.29 0.73 1.006 2010 Serial subtraction 0.38 0.45 0.32 0.32 1.007 2010 Retrieval fluency 0.29 0.31 0.30 0.29 0.30 1.008 2010 Retrieval fluency decile 0.30 0.33 0.31 0.30 0.32 0.95 1.009 2010 Orientation (0-8) 0.33 0.29 0.36 0.37 0.36 0.27 0.28 1.00
10 2010 Date (0-4) 0.15 0.14 0.24 0.25 0.22 0.14 0.15 0.78 1.0011 2010 Recognition (0-4) 0.36 0.31 0.33 0.33 0.35 0.28 0.29 0.82 0.27 1.0012 2010 Backward count (20) 0.16 0.15 0.16 0.16 0.21 0.12 0.13 0.22 0.16 0.19 1.0013 2010 Backward count (86) 0.25 0.21 0.20 0.19 0.31 0.16 0.17 0.26 0.16 0.24 0.23 1.0014 2010 Mental status (0-15) 0.42 0.46 0.39 0.40 0.88 0.33 0.35 0.71 0.51 0.62 0.45 0.37 1.0015 2010 Total cognition (0-35) 0.42 0.43 0.81 0.83 0.67 0.38 0.40 0.62 0.43 0.55 0.34 0.32 0.79 1.0016 2010 Total cognition (0-27) 0.40 0.43 0.84 0.86 0.67 0.36 0.39 0.46 0.30 0.43 0.33 0.30 0.73 0.98 1.0017 2010 Vocabulary 0.40 0.36 0.32 0.30 0.36 0.33 0.34 0.33 0.15 0.37 0.17 0.23 0.42 0.43 0.41 1.0018 2010 Numeracy 0.42 0.50 0.32 0.32 0.52 0.34 0.36 0.33 0.16 0.35 0.17 0.24 0.52 0.49 0.48 0.41 1.0019 2010 Difficulty with IADLs -0.16 -0.14 -0.21 -0.20 -0.20 -0.13 -0.14 -0.27 -0.21 -0.22 -0.11 -0.13 -0.27 -0.28 -0.25 -0.14 -0.17 1.0020 2010 Difficulty with IADL ($) -0.12 -0.11 -0.18 -0.17 -0.16 -0.10 -0.11 -0.24 -0.18 -0.20 -0.08 -0.11 -0.22 -0.24 -0.21 -0.12 -0.14 0.68 1.00
18
Table 6. Samples sizes for Correlations in Tables 4-5 – HRS 2010
1 2 3 4 5 6 7 8 9 10 11 12 13 14 15 16 17 18 19 201 Age 19,465 2 Education 19,373 19,373 3 2010 Number series score 17,970 17,884 17,970 4 2010 Immediate word recall 19,369 19,277 17,925 19,369 5 2010 Delayed word recall 19,369 19,277 17,925 19,369 19,369 6 2010 Serial subtraction 19,131 19,040 17,778 19,076 19,076 19,131 7 2010 Retrieval fluency 19,425 19,333 17,939 19,335 19,335 19,097 19,425 8 2010 Retrieval fluency decile 19,425 19,333 17,939 19,335 19,335 19,097 19,425 19,425 9 2010 Orientation (0-8) 15,053 14,982 13,799 14,988 14,988 14,811 15,024 15,024 15,053
10 2010 Date (0-4) 15,078 15,006 13,816 15,009 15,009 14,830 15,047 15,047 15,053 15,078 11 2010 Recognition (0-4) 15,058 14,987 13,801 14,993 14,993 14,813 15,029 15,029 15,053 15,053 15,058 12 2010 Backward count (20) 19,384 19,292 17,952 19,326 19,326 19,108 19,351 19,351 15,003 15,024 15,008 19,384 13 2010 Backward count (86) 19,366 19,274 17,947 19,309 19,309 19,100 19,333 19,333 14,989 15,010 14,993 19,366 19,366 14 2010 Mental status (0-15) 14,792 14,721 13,645 14,753 14,753 14,792 14,766 14,766 14,792 14,792 14,792 14,792 14,786 14,792 15 2010 Total cognition (0-35) 14,753 14,682 13,618 14,753 14,753 14,753 14,727 14,727 14,753 14,753 14,753 14,753 14,747 14,753 14,753 16 2010 Total cognition (0-27) 19,061 18,970 17,736 19,061 19,061 19,061 19,029 19,029 14,753 14,772 14,755 19,061 19,053 14,753 14,753 19,061 17 2010 Vocabulary 14,964 14,894 13,729 14,900 14,900 14,732 14,937 14,937 14,937 14,954 14,942 14,918 14,903 14,693 14,654 14,674 14,964 18 2010 Numeracy 19,458 19,366 17,965 19,364 19,364 19,126 19,420 19,420 15,048 15,073 15,053 19,379 19,361 14,787 14,748 19,056 14,959 19,458 19 2010 Difficulty with IADLs 19,350 19,259 17,870 19,256 19,256 19,018 19,310 19,310 14,939 14,964 14,944 19,271 19,253 14,681 14,642 18,949 14,850 19,343 19,350 20 2010 Difficulty with IADL ($) 19,334 19,244 17,859 19,240 19,240 19,005 19,294 19,294 14,927 14,951 14,932 19,255 19,238 14,671 14,632 18,936 14,838 19,327 19,334 19,334

19
HRS 2010 Retrieval Fluency Retrieval Fluency measures an aspect of long-term retrieval: fluency of retrieval from stored
knowledge. It was first incorporated in the HRS in the 2010 wave. This test is a typical neuropsychology test and was adapted by McArdle and Woodcock from the WJ- III Tests of Achievement: Retrieval Fluency (© Riverside Publishing). The measure consisted of a single item in which respondents were asked to name as many animals as they could within a 60-second time limit. This measure is consistent with animal fluency measures commonly administered in other neuropsychological exams (e.g., the CERAD animal fluency measure; Morris et al., 1989).
Test Administration Protocol Typical administration of this task involves recording the names provided by respondents and
counting the number given in 15-second increments. In order to establish a protocol suitable for administration by lay interviewers on a large scale using CATI/CAPI survey instruments, it was not feasible to separately record the number of responses provided in 15 second increments, nor was it feasible to record the specific answers provided by respondents. The HRS test administration protocol was first pilot-tested in the Study of Cognition and Aging in the USA (CogUSA). Two different methods of data recording were tested: one in which interviewers recorded all answers regardless of whether they did not match the category or included duplicates and a second in which interviewers only recorded “correct” answers. Feedback from interviewers indicated that it was a cognitively demanding task to administer, and it was much easier to record all answers than to make decisions about correct vs. incorrect answers during test administration.
Question Text and Interviewer Instructions NOTE: DON'T KNOW/DK AND REFUSE/RF ARE NOT RECORDED FOR RETRIEVAL FLUENCY TEST (D194-D199).
D194
Now I want to see how many different animals you can name. You will have 60 seconds. When I say, `Begin`, say the animal names as fast as you can. [IWER: GET READY TO TIME 60 SECONDS. REPEAT INSTRUCTIONS IF NECESSARY] [IWER: PRESS [ENTER] FOR EVERY RESPONSE AS IT IS SAID BY THE R - REGARDLESS OF WHETHER YOU THINK IT IS CORRECT. KEEP A MENTAL COUNT OF INCORRECT AND REPEATED RESPONSES. [IWER: START TIMING ENTER [1] AND PRESS [ENTER] AS SOON AS YOU TELL THE R TO BEGIN Are you ready? (PAUSE.) BEGIN.
1. CONTINUE

20
D193
IWER: PRESS [ENTER] FOR EVERY RESPONSE AS IT IS SAID BY THE R - REGARDLESS OF WHETHER YOU THINK IT IS CORRECT. [IWER: KEEP A MENTAL COUNT OF INCORRECT AND REPEATED RESPONSES.] [IWER: COUNT CATEGORIES OF ANIMALS (E.G., DOG), AS WELL AS SPECIFIC TYPES (E.G., COLLIE, TERRIER) AS CORRECT. IF R IS BILINGUAL, COUNT RESPONSE CORRECT IF GIVEN IN ANOTHER LANGUAGE.] [IWER: IF R HAS NOT MENTIONED ANY ANIMALS FOR ABOUT 10 SECONDS, PROBE: `ANYTHING ELSE?`] [IWER: IF NO, PRESS '7' TO END TASK.] [IWER: INSTRUCT THE R TO STOP AS SOON AS THE TIMER REACHES 60 SECONDS. THEN PRESS '7' TO END TASK."]
7. END TASK
D196
TOTAL ANIMAL ANSWERS
NOTE: THIS IS CALCULATED IN BLAISE BY COUNTING THE NUMBER OF TIMES THE IWER PRESSES
‘ENTER’ AT D194.
D197 IWER:
DID YOU RECORD ANY INCORRECT NAMES?
1. YES 2. PROBABLY YES 4. PROBABLY NO 5. NO
GO TO D199
D197 BRANCHPOINT: IF R DID NOT RESPOND WITH ANY ANIMAL ANSWERS (D196=EMPTY), GO TO D200
21
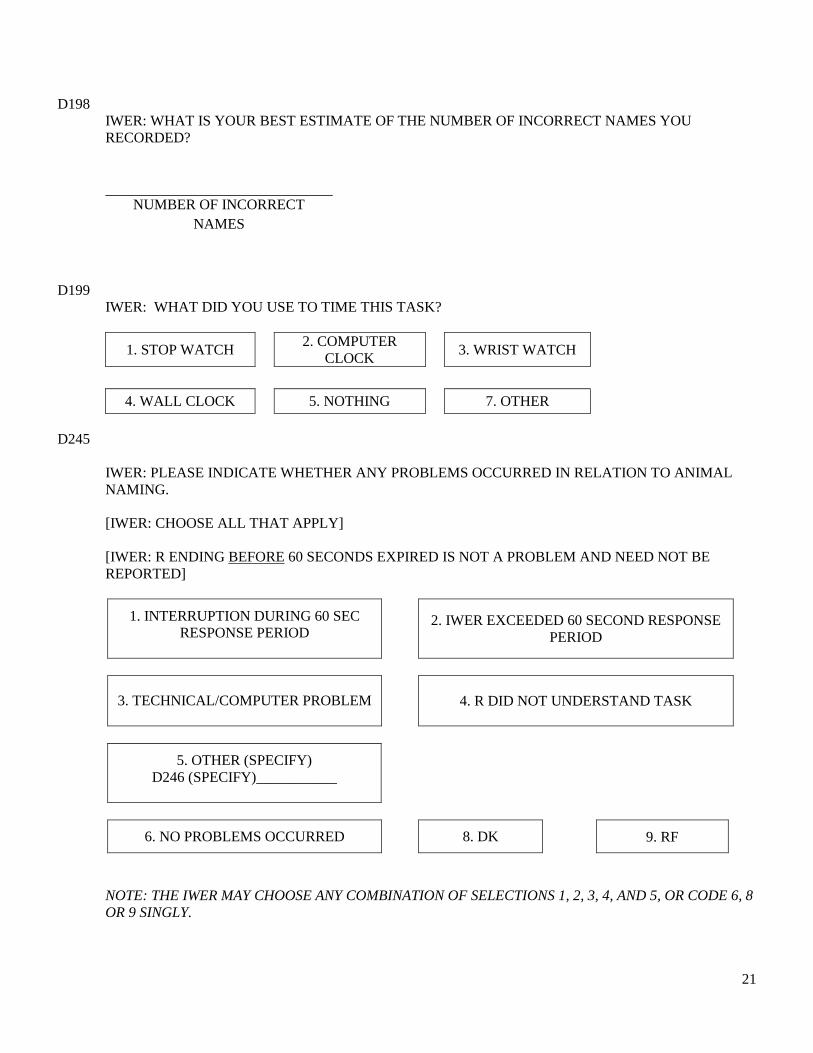
D198 IWER: WHAT IS YOUR BEST ESTIMATE OF THE NUMBER OF INCORRECT NAMES YOU RECORDED?
NUMBER OF INCORRECT NAMES
D199
IWER: WHAT DID YOU USE TO TIME THIS TASK?
1. STOP WATCH 2. COMPUTER CLOCK 3. WRIST WATCH
4. WALL CLOCK 5. NOTHING 7. OTHER
D245
IWER: PLEASE INDICATE WHETHER ANY PROBLEMS OCCURRED IN RELATION TO ANIMAL NAMING.
[IWER: CHOOSE ALL THAT APPLY] [IWER: R ENDING BEFORE 60 SECONDS EXPIRED IS NOT A PROBLEM AND NEED NOT BE REPORTED]
1. INTERRUPTION DURING 60 SEC RESPONSE PERIOD
2. IWER EXCEEDED 60 SECOND RESPONSE
PERIOD
3. TECHNICAL/COMPUTER PROBLEM
4. R DID NOT UNDERSTAND TASK
5. OTHER (SPECIFY) D246 (SPECIFY)___________
6. NO PROBLEMS OCCURRED 8. DK 9. RF
NOTE: THE IWER MAY CHOOSE ANY COMBINATION OF SELECTIONS 1, 2, 3, 4, AND 5, OR CODE 6, 8 OR 9 SINGLY.

22
Administration Time The retrieval fluency task took an average of 1.39 minutes to administer among self-respondents in
HRS 2010.
Test Scoring To score the Retrieval Fluency task, recode values of 97 (invalid test), 98 (DK), or 99 (RF) to missing. Next, subtract the number of incorrect responses (D198) from the total number of words recorded (D196). (Incorrect responses include answers that did not correctly fit the category of “animal” or were repeated/duplicate answers.
Analysts may want to consider dropping cases for which any problems were reported or cases where the value of D198 is greater than D196. Cases like this were encountered due to technical issues or interviewer error.
Data Quality
Missing data Overall this item had very little (less than 1%) missing data among self-respondents. Most respondents were able to understand and perform the task.
Construct Validity Correlations of retrieval fluency with other measures of cognitive functioning are presented in Tables
4 and 5 (previously shown on pages 16-17). As expected, retrieval fluency is negatively correlated with age, positively correlated with education, and related to the other measures of cognitive ability in the HRS.

23
HRS 2012 Number Series
Changes in 2012 Task Instructions In 2012, the instructions preceding the HRS Number Series task were substantially revised based on feedback from the HRS field staff that many respondents were confused or did not understand how to perform the task. Because the instructions to respondents need to be the same across modes (over the telephone and face to face), interviewers in face-to-face interviews were specifically instructed not to write down the items for respondents or show them how the items ought to be written. The complete HRS 2012 instructions and sample items were as follows:
D200
Next I'm going to read you several numbers and I'd like you to write them down from left to right. There will be a blank number in the series that I read to you. Draw a dash or short blank line when I say “blank.” Then look at the pattern of numbers. Based on this pattern, tell me what number goes in the blank. Sometimes the blank will be at the end of the series, and sometimes the blank will be in the beginning or in the middle. [IWER: MAKE SURE R HAS PENCIL AND PAPER READY FOR WRITING DOWN THE NUMBERS. REPEAT INSTRUCTIONS FOR THE R IF NECESSARY. ALLOW ENOUGH TIME WHEN READING NUMBERS FOR R TO WRITE DOWN SEQUENCE.] For example, if I said the numbers ‘1. . . 2. . . BLANK. . .4’ then what number would go in the blank? CORRECT RESPONSE: 3
[IWER: IF R DOES NOT GIVE THE CORRECT RESPONSE (3) THEN SAY: THE ANSWER WE WERE LOOKING FOR IS 3.
(PROBE IF NEEDED TO CHECK THAT THE RESPONDENT UNDERSTANDS THE TASK, BY ASKING: DO YOU UNDERSTAND THE DIRECTIONS FOR THIS TASK?)]
[IWER: IF THE RESPONDENT SAYS HE OR SHE DOES NOT KNOW THE ANSWER, RECORD CTRL-D. DO NOT RECORD A “DON’T KNOW” RESPONSE AS “R DOESN’T UNDERSTAND INSTRUCTIONS.”]
1. CORRECT 5. INCORRECT 6. R DOESN’T
UNDERSTAND INSTRUCTIONS
7. R CAN’T WRITE / NO PAPER/PEN AVAILABLE
8. DK 9. RF GO TO D247
BRANCHPOINT

24
D240
Let’s try another one. I’m going to read you a series of numbers. There will be a blank number in the series that I read to you. I would like you to write down the numbers from left to right and then tell me what number goes in the blank based on the pattern of numbers. 2. . . 4. . . 6. . .BLANK (Now please look at the number you just wrote down and tell me the number that goes in the blank.) CORRECT RESPONSE: 8 [IWER: IF THE RESPONDENT SAYS HE OR SHE DOES NOT KNOW THE ANSWER, RECORD CTRL-D. DO NOT RECORD A “DON’T KNOW” RESPONSE AS “R DOESN’T UNDERSTAND INSTRUCTIONS.”]
1. CORRECT 5. INCORRECT 6. R DOESN’T
UNDERSTAND INSTRUCTIONS
8. DK 9. RF
GO TO D242
D241
[IWER: The sequence is 2 4 6 8.
8 is the answer we were looking for because, in this example, the numbers increase by 2.]
[IWER: PROBE IF NEEDED TO CHECK THAT THE R UNDERSTANDS THE TASK, BY ASKING: DO YOU UNDERSTAND THE DIRECTIONS FOR THIS TASK?]
1. CONTINUE 5. R SEEMS CONFUSED OR DOES NOT UNDERSTAND TASK 8. DK 9. RF
GO TO D247 BRANCHPOINT (AFTER D235)

25
D242 I am now going to ask you six more questions like the one you just did. Sometimes the blank will be at the end of the series, and sometimes it may be at the beginning or in the middle. You may be asked a question with more than one blank in the sequence. The numbers might increase, like 2, 4, 6, or decrease, like 6, 4, 2. Some of the problems may be easy but others may be hard. Just do the best you can. It is more important to answer the item correctly than to answer quickly, so take a little time to think before answering. It is okay if you do not know the answer because some of the items are intended to be very difficult. You can go on to the next item at any time. Are you ready to begin? [IWER: MAKE SURE R HAS PENCIL AND PAPER READY FOR WRITING DOWN THE NUMBERS. REPEAT INSTRUCTIONS FOR THE R IF NECESSARY.] [IWER: PERMIT AS MUCH TIME AS R WIS FOR EACH QUESTION. IF THE R HAS NOT GIVEN AN ANSWER AFTER ABOUT A MINUTE, ASK: WOULD YOU JUST LIKE TO GO ON TO THE NEXT QUESTION?]
1. CONTINUE 8. DK 9. RF
GO TO D247 BRANCHPOINT
D201 BRANCHPOINT: IF R WAS RANDOMLY SELECTED TO BE ASKED SET 2 OF NUMBER SERIES
QUESTIONS (X525=2), GO TO D221

26
2012 Number Series Items:
Block_1
List A
List B
MD204-A1 6 7 __ 9
MD204-A2 4 5 6 __
Correct: 8
Correct: 7 MD205-B1 6 __ 4 3
MD205-B2 5 4 3 __
Correct: 5
Correct: 2 MD206-C1 5 8 11 __
MD206-C2 11 __ 15 17
Correct: 14
Correct: 13 Block 2
MD207-D1 __ 4 6 8
MD207-D2 __ 15 13 11
Correct: 2
Correct: 17 MD208-E1 1 3 3 5 7 7 __
MD208-E2 10 6 3 __
Correct: 9
Correct: 1 MD209-F1 18 10 6 3
MD209-F2 11 9 6 __
Correct: 4
Correct: 1
Block_3 (All Rs Start Here)
MD201 - G1 8 __ 12 14
MD201 - G1 7 10 13 __
Correct: 10
Correct: 16
MD202 - H1 23 26 30 35 __
MD202 - H1 __ 13 15 18 22
Correct: 41
Correct: 12
MD203 - I1 18 17 15 __ 8
MD203 - I1 18 17 __ 12 8
Correct: 12
Correct: 15
Block 4
MD210-J1 17 __ 12 8
MD210-J2 1 3 9 __
Correct: 15
Correct: 27
MD211-K1 10 __ 3 1
MD211-K2 13 15 19 __
Correct: 6
Correct: 27,35,25,26
MD212-L1 17 16 14 10 __
MD212-L2 3 3 4 6 6 7 __ __
Correct: 2,3
Correct: 9,9
Block 5
MD213-M1 __ 20 26 38 62
MD213-M2 6 __ 15 27 51
Correct: 17
Correct: 9
MD214-N1 5 __ 11 19 35
MD214-N2 __ 18 24 36 60
Correct: 7
Correct: 15
MD215-O1 70 __ __ 84
MD215-O2 60 33 24 21 __
Correct: 72,76,78,82
Correct: 20

27
Administration Time The 2012 number series task, including instructions and answers to six items, took 5.74 minutes on average to administer, including the introduction, sample items, and test items. This was longer than the 4.5 minutes in 2010, presumably because the instructions were modified and made longer to make the task instructions clearer to respondents.
2012 Number Series Scoring Please note that the scoring for HRS 2012 differs from HRS 2010. The method for scoring is the same, but the scoring table (i.e., score values) is different.
Num
ber C
orre
ct S
econ
d Se
t
Number Correct – First Set
0 1 2 3
List A 0 W 409 488 518 536
SEM 18 12 10 10
1 W 429 501 528 546
SEM 19 11 9 10
2 W 462 513 536 558
SEM 17 10 9 12
3 W 484 524 546 570
SEM 13 10 10 16
Num
ber C
orre
ct S
econ
d Se
t
Number Correct – First Set
List B
0 1 2 3
0 W 413 489 519 537
SEM 18 12 10 10
1 W 435 503 529 549
SEM 19 11 9 10
2 W 465 514 537 567
SEM 15 10 9 16
3 W 485 525 547 584
SEM 12 10 10 18

28
Data Quality The correlation between Number Series scores in 2010 and 2012 (among respondents who completed both) was r = .59, p < .001. In general, respondents performed better in 2012 compared with 2010. This may be due to the methodological issue in the HRS 2010 version (see p. 9) or a practice effect.
Table 7 shows 2010 – 2012 correlations for all cognitive measures, as well as correlations having partialed out variance related to age.
Table 7. Correlations of Cognitive measures 2010 - 2012
n2010 - 2012 correlation
2010 - 2012 partial
correlation*3 Number series score 14,476 0.59 0.574 Immediate word recall 17,276 0.48 0.445 Delayed word recall 17,276 0.50 0.476 Serial subtraction 16,887 0.66 0.667 Retrieval fluency 17,370 0.57 0.538 Retrieval fluency decile 17,370 0.60 0.569 Orientation (0-8) 8,762 0.59 0.57
10 Date (0-4) 8,787 0.37 0.3511 Recognition (0-4) 8,770 0.61 0.6012 Backward count (20) 17,295 0.23 0.2313 Backward count (86) 17,258 0.29 0.2914 Mental status (0-15) 8,449 0.71 0.7115 Total cognition (0-35) 8,406 0.70 0.6716 Total cognition (0-27) 16,806 0.64 0.6219 Difficulty with IADLs 17,298 0.62 0.6220 Difficulty with IADL ($) 17,280 0.42 0.42
29
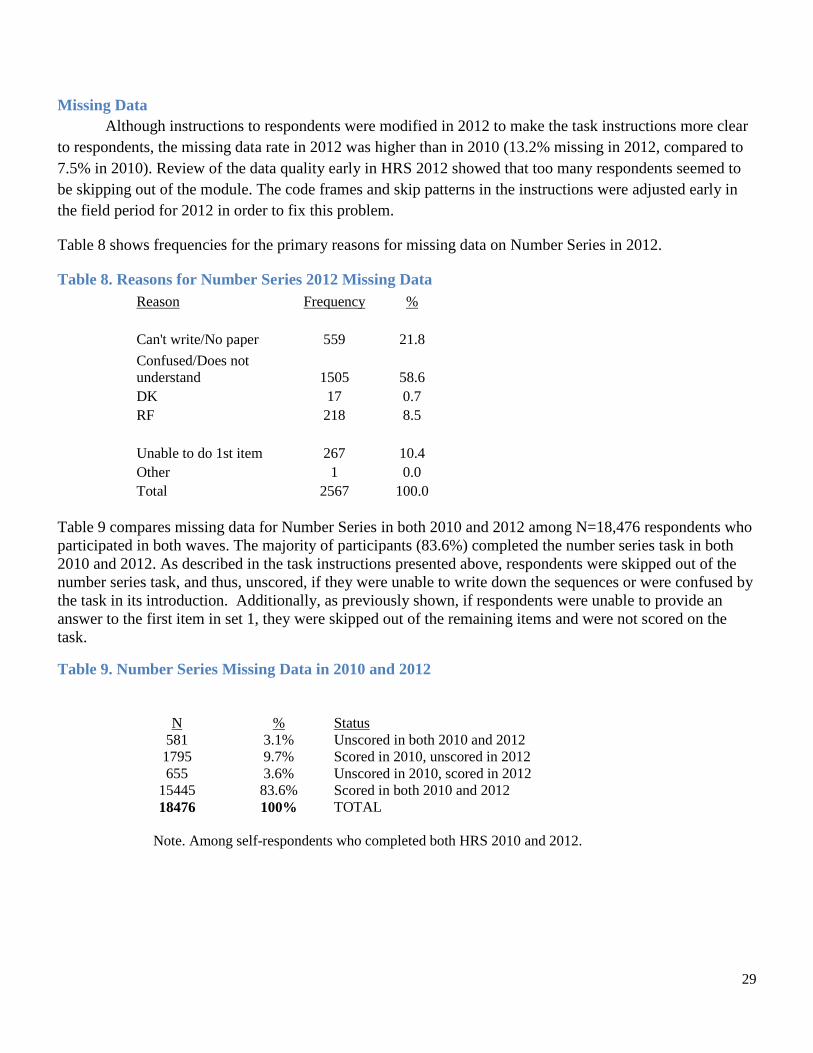
Missing Data Although instructions to respondents were modified in 2012 to make the task instructions more clear to respondents, the missing data rate in 2012 was higher than in 2010 (13.2% missing in 2012, compared to 7.5% in 2010). Review of the data quality early in HRS 2012 showed that too many respondents seemed to be skipping out of the module. The code frames and skip patterns in the instructions were adjusted early in the field period for 2012 in order to fix this problem.
Table 8 shows frequencies for the primary reasons for missing data on Number Series in 2012.
Table 8. Reasons for Number Series 2012 Missing Data Reason Frequency %
Can't write/No paper 559 21.8 Confused/Does not understand 1505 58.6 DK 17 0.7 RF 218 8.5
Unable to do 1st item 267 10.4 Other 1 0.0 Total 2567 100.0
Table 9 compares missing data for Number Series in both 2010 and 2012 among N=18,476 respondents who participated in both waves. The majority of participants (83.6%) completed the number series task in both 2010 and 2012. As described in the task instructions presented above, respondents were skipped out of the number series task, and thus, unscored, if they were unable to write down the sequences or were confused by the task in its introduction. Additionally, as previously shown, if respondents were unable to provide an answer to the first item in set 1, they were skipped out of the remaining items and were not scored on the task.
Table 9. Number Series Missing Data in 2010 and 2012
N % Status 581 3.1% Unscored in both 2010 and 2012 1795 9.7% Scored in 2010, unscored in 2012 655 3.6% Unscored in 2010, scored in 2012
15445 83.6% Scored in both 2010 and 2012 18476 100% TOTAL
Note. Among self-respondents who completed both HRS 2010 and 2012.
30
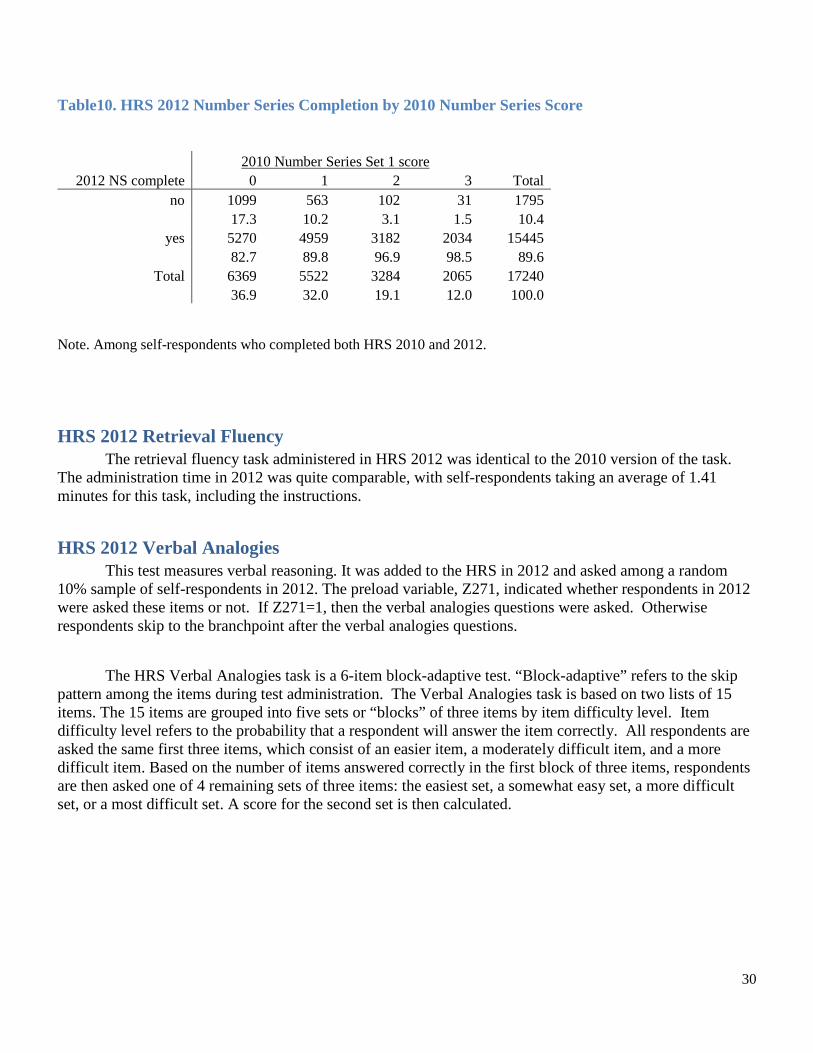
Table10. HRS 2012 Number Series Completion by 2010 Number Series Score
2010 Number Series Set 1 score
2012 NS complete 0 1 2 3 Total no 1099 563 102 31 1795
17.3 10.2 3.1 1.5 10.4
yes 5270 4959 3182 2034 15445
82.7 89.8 96.9 98.5 89.6
Total 6369 5522 3284 2065 17240
36.9 32.0 19.1 12.0 100.0
Note. Among self-respondents who completed both HRS 2010 and 2012.
HRS 2012 Retrieval Fluency The retrieval fluency task administered in HRS 2012 was identical to the 2010 version of the task. The administration time in 2012 was quite comparable, with self-respondents taking an average of 1.41 minutes for this task, including the instructions.
HRS 2012 Verbal Analogies This test measures verbal reasoning. It was added to the HRS in 2012 and asked among a random 10% sample of self-respondents in 2012. The preload variable, Z271, indicated whether respondents in 2012 were asked these items or not. If Z271=1, then the verbal analogies questions were asked. Otherwise respondents skip to the branchpoint after the verbal analogies questions.
The HRS Verbal Analogies task is a 6-item block-adaptive test. “Block-adaptive” refers to the skip
pattern among the items during test administration. The Verbal Analogies task is based on two lists of 15 items. The 15 items are grouped into five sets or “blocks” of three items by item difficulty level. Item difficulty level refers to the probability that a respondent will answer the item correctly. All respondents are asked the same first three items, which consist of an easier item, a moderately difficult item, and a more difficult item. Based on the number of items answered correctly in the first block of three items, respondents are then asked one of 4 remaining sets of three items: the easiest set, a somewhat easy set, a more difficult set, or a most difficult set. A score for the second set is then calculated.

31
Question Text and Interviewer Instructions D247
Next I’m going to read you several words and I’d like you to finish what I say by telling me the word that best completes the phrase.
For example, if I say “Mother is to Daughter as Father is to…” you would say “son.” Mother is to Daughter as Father is to Son.
1. CONTINUE D249
I am now going to read six more statements like the one you just heard. I want you to tell me the word that best completes the phrase. Some of the problems may be easy but others may be hard. Just do the best you can. It is more important to answer the item correctly than to answer quickly, so take a little time to think before answering. It is okay if you do not know the answer because some of the items are intended to be very difficult. You can go on to the next item at any time. Are you ready to begin?
[IWER: REPEAT INSTRUCTIONS IF NECESSARY. PRESS ‘CONTINUE’ WHEN R IS READY TO BEGIN.]
1. CONTINUE
D250 BRANCHPOINT: IF R WAS RANDOMLY SELECTED TO BE ASKED SET 2 OF VERBAL
ANALOGIES QUESTIONS (X526=2), GO TO D270
D247
Next I’m going to read you several words and I’d like you to finish what I say by telling me the word that best completes the phrase.
For example, if I say “Mother is to Daughter as Father is to…” you would say “son.” Mother is to Daughter as Father is to Son.
1. CONTINUE D249
I am now going to read six more statements like the one you just did heard. I want you to tell me the word that best completes the phrase. Some of the problems may be easy but others may be hard. Just

32
do the best you can. It is more important to answer the item correctly than to answer quickly, so take a little time to think before answering. It is okay if you do not know the answer because some of the items are intended to be very difficult. You can go on to the next item at any time. Are you ready to begin? [IWER: REPEAT INSTRUCTIONS IF NECESSARY. PRESS ‘CONTINUE’ WHEN R IS READY TO BEGIN.]
1. CONTINUE
D250 BRANCHPOINT: IF R WAS RANDOMLY SELECTED TO BE ASKED SET 2 OF VERBAL
ANALOGIES QUESTIONS (X526=2), GO TO D270
D250
Please finish what I say: Night is to Dark as Day is to
[IWER: PAUSE AND WAIT FOR R TO ANSWER]
[IWER: PERMIT AS MUCH TIME AS R WISHES FOR THE QUESTION. IF THE R HAS NOT GIVEN AN ANSWER AFTER ABOUT A MINUTE, ASK: WOULD YOU JUST LIKE TO GO ON TO THE NEXT QUESTION?] [IWER: R CAN WRITE THE WORDS DOWN IF HE/SHE WISHES. DO NOT PROVIDE FURTHER PROMPTS, AND DO NOT GIVE THE CORRECT ANSWER OR TELL THE RESPONDENT IF HIS OR HER ANSWER IS CORRECT.] [IWER: IF THE RESPONDENT SAYS HE OR SHE DOES NOT KNOW THE ANSWER, RECORD CTRL-D. IF IWER SAYS ANSWER IN ERROR, RECORD RESPONSE AS INVALID]
CORRECT RESPONSE: LIGHT (LUZ)
1. CORRECT 5. NOT CORRECT
6. INVALID 8. DK 9. RF
(The remainder of the items follows this. Please refer to Figure 2 for the question flow/skip pattern for this test. The verbal analogies item content is provided in Table 6 on the next page.).

33
Figure 3. Verbal Analogies flow
Set 1 (Block 3)
Set 2 – Block 1
Set 2 – Block 2
Set 2 – Block 4
Set 2 – Block 5
Calculate Set 1 Score
Calculate Set 2 Score
Calculate Total Score
& Standard Error
0
1
2
3

34
2012 Verbal Analogies Items: LIST A Block 1
D253 cat/kittens, dog/puppies
Correct: puppies (perritos)
D254 sky/blue, tree/green
Correct: green, brown (verde, pardo, moreno)
D255 son/father, daughter/mother Correct: mother (madre) Block 2
D256 lion/den, bird/nest
Correct: nest (nido)
D257 bird/feather, sheep/wool
Correct: wool (lana)
D258 car/gasoline, computer/electricity or battery Correct: electricity or battery (electricidad or bateria)
D250 night/dark, day/light
Correct: light (luz)
D251 tomato/carrot, red/orange
Correct: orange (naranja)
D252 two/duet, three/trio Correct: trio Block 4
D259 lion/kangaroo, Africa/Australia
Correct: Australia
D260 doctor/veterinarian, person/animal
Correct: animal
D261 walnut/corn, shell, husk Correct: husk (cáscara) Block 5
D262 ring/belt, finger/waist
Correct: waist (cintura)
D263 switch/dark, doorknob/close or closed
Correct: close, closed (cerrar, cerrado)
D264 bedroom/kitchen, sleep/eat or cook Correct: eat, cook (comer, cocinar)

35
LIST B
Block 1 D273 dad/man, mom/woman
Correct: woman (mujer)
D274 grandmother/mother, grandfather/father
Correct: father (padre)
D275 dog/bark, bird/chirp or tweet or sing Correct: chirp, tweet, sing (cantar) Block 2
D276 man/men, woman/women
Correct: women (mujeres)
D277 summer/winter, heat/cold or air conditioning
Correct: cold, air conditioning (frío, aire acondicionado)
D278 milk/egg, cow/chicken or hen or poultry Correct: chicken, hen, poultry (pollo, gallina, aves caseras) Block 3 (All Rs start here) D270 spring/winter, fall/summer
Correct: summer (verano)
D271 ear/two, finger/ten
Correct: ten (diez)
D272 sentence/equation, word/number or symbol Correct: number, symbol (numero or ?) Block 4
D279 egg/yolk, cherry/pit
Correct: pit (hoyo de cereza, semilla)
D280 shampoo/toothpaste, hair/teeth
Correct: teeth (dientes)
D281 today/yesterday, winter/fall or autumn Correct: fall, autumn (otoño) Block 5
D282 flooding/abundant, drought/scarce
Correct: scarce (escaso)
D283 challenger/champion, entrant/winner
Correct: winner (ganador)
D284 picture/field, frame/fence Correct: fence (valla)
Note: Responses are coded as correct if said in English or Spanish.
36
Administration Time The verbal analogies task took an average of 2.62 minutes to administer among self-respondents in
HRS 2012.
2012 Verbal Analogies Scoring Scores for the Verbal Analogies task are provided in the dataset. This describes how these scores were computed.
To score the Verbal Analogies task, perform the same steps as outlined for the Number Series task:
1) Note whether the individual items are from List A or List B. 2) Calculate the number of items answered correctly (0 – 3) for the first three items administered (Set1). 3) Calculate the number of items answered correctly (0 – 3) for the second three items administered
(Set2). 4) Using the scoring algorithm below, assign a score (W-score) based on the number of items correct in
Set 1, number of items correct in Set 2, and whether the items were from List A or List B. 5) Using the scoring algorithm below, assign a standard error based on the number of items correct in
Set 1, number of items correct in Set 2, and whether the items were from List A or List B.
Num
ber C
orre
ct S
econ
d Se
t
Number Correct – First Set
0 1 2 3
List A 0 W 435 468 497 526
SEM 16 11 10 11
1 W 446 479 507 537
SEM 11 9 9 10
2 W 458 488 516 549
SEM 10 9 9 11
3 W 469 499 527 560
SEM 11 11 11 16
Num
ber C
orre
ct S
econ
d Se
t
Number Correct – First Set
List B
0 1 2 3
0 W 436 467 497 526
SEM 16 11 11 11
1 W 447 477 507 537
SEM 11 9 9 10
2 W 458 487 517 548
SEM 10 9 10 11
3 W 470 498 528 559
SEM 11 11 11 16

37

38
Data Quality
Missing Data the introduction to the verbal analogies task was administered to 1,915 respondents . There were six RF and one DK responses to the introduction. In the preliminary 2012 data, another five respondents provided no verbal analogies data beyond the introduction. Forty-tworespondents have a code of ‘6’ (INVALID – IWER error) for one or more of the three items in the first Verbal Analogies (VA) set. Twenty-eight of the 42 go on to answer one or more VA items correctly. If the remaining 14 cases are excluded from scoring, then 1,889 of the 1,915 (98.6%) of the cases receiving the introduction go on to provide scoreable data.
Construct Validity The correlation matrix presented in Table 10 shows the degree of linear relationship between the VA
scores and other variables in the HRS, including age, education, other cognitive measures, and instrumental activities of daily living (IADLs). These results show that the HRS VA score is highly correlated, as expected, with other dimensions of cognitive functioning (especially quantitative reasoning, or number series). In addition, there is a negative correlation between age and performance on the Verbal Analogies task. Table 11 shows partial correlations of Verbal Analogies in relation to other measures after excluding variance related to age. Table 12 presents descriptive statistics for the Verbal Analogies test by age and gender.
A total of 1,661 respondents answered both the Verbal Analogies task and the Number Series task in
2012. Among these respondents, Verbal Analogies scores were highly correlated (r = .55, p < .05) with Number Series scores in HRS 2012.

39
Table 11. Correlation of Cognitive Measures – HRS 2012
1 2 3 4 5 6 7 8 9 10 11 12 13 14 15 16 17 18 191 Age 1.002 Education -0.08 1.003 2012 Number series score -0.19 0.46 1.004 2012 Immediate word recall -0.31 0.30 0.33 1.005 2012 Delayed word recall -0.29 0.29 0.33 0.77 1.006 2012 Serial subtraction -0.08 0.39 0.48 0.32 0.33 1.007 2012 Retrieval fluency -0.31 0.31 0.36 0.38 0.36 0.32 1.008 2012 Retrieval fluency decile -0.32 0.33 0.39 0.40 0.38 0.34 0.93 1.009 2012 Orientation (0-8) -0.23 0.31 0.31 0.42 0.44 0.39 0.34 0.34 1.00
10 2012 Date (0-4) -0.21 0.15 0.17 0.31 0.34 0.27 0.23 0.22 0.83 1.0011 2012 Recognition (0-4) -0.17 0.36 0.32 0.38 0.39 0.38 0.33 0.34 0.81 0.36 1.0012 2012 Backward count (20) -0.05 0.15 0.14 0.16 0.15 0.21 0.14 0.14 0.22 0.15 0.20 1.0013 2012 Backward count (86) -0.07 0.27 0.24 0.21 0.22 0.32 0.19 0.20 0.28 0.20 0.27 0.23 1.0014 2012 Mental status (0-15) -0.19 0.42 0.48 0.44 0.45 0.88 0.38 0.40 0.75 0.58 0.65 0.45 0.39 1.0015 2012 Total cognition (0-35) -0.33 0.41 0.47 0.84 0.86 0.67 0.45 0.47 0.67 0.51 0.59 0.34 0.35 0.81 1.0016 2012 Total cognition (0-27) -0.29 0.40 0.48 0.86 0.88 0.66 0.44 0.46 0.52 0.38 0.47 0.32 0.31 0.74 0.98 1.0017 2012 Difficulty with IADLs 0.14 -0.17 -0.17 -0.24 -0.24 -0.20 -0.19 -0.20 -0.37 -0.31 -0.29 -0.15 -0.14 -0.35 -0.36 -0.28 1.0018 2012 Difficulty with IADL ($) 0.09 -0.11 -0.13 -0.19 -0.18 -0.16 -0.14 -0.15 -0.31 -0.27 -0.25 -0.11 -0.10 -0.29 -0.29 -0.22 0.69 1.0019 2012 Verbal analogies score -0.14 0.50 0.54 0.41 0.38 0.50 0.44 0.46 0.42 0.31 0.40 0.20 0.32 0.55 0.53 0.52 -0.20 -0.15 1.00

40
Table 12. Sample sizes for correlations in Table 10.
1 2 3 4 5 6 7 8 9 10 11 12 13 14 15 16 17 18 191 Age 18,211 2 Education 17,924 17,924 3 2012 Number series score 15,734 15,479 15,736 4 2012 Immediate word recall 18,121 17,835 15,702 18,124 5 2012 Delayed word recall 18,121 17,835 15,702 18,124 18,124 6 2012 Serial subtraction 17,829 17,546 15,578 17,787 17,787 17,832 7 2012 Retrieval fluency 18,211 17,924 15,736 18,124 18,124 17,832 18,214 8 2012 Retrieval fluency decile 18,211 17,924 15,736 18,124 18,124 17,832 18,214 18,214 9 2012 Orientation (0-8) 10,104 9,899 8,318 10,049 10,049 9,852 10,107 10,107 10,107
10 2012 Date (0-4) 10,123 9,917 8,327 10,063 10,063 9,863 10,126 10,126 10,107 10,126 11 2012 Recognition (0-4) 10,110 9,905 8,320 10,051 10,051 9,852 10,113 10,113 10,107 10,107 10,113 12 2012 Backward count (20) 18,135 17,849 15,722 18,079 18,079 17,813 18,138 18,138 10,064 10,079 10,065 18,138 13 2012 Backward count (86) 18,107 17,822 15,718 18,054 18,054 17,802 18,110 18,110 10,042 10,057 10,043 18,110 18,110 14 2012 Mental status (0-15) 9,836 9,635 8,210 9,806 9,806 9,839 9,839 9,839 9,839 9,839 9,839 9,839 9,832 9,839 15 2012 Total cognition (0-35) 9,803 9,602 8,190 9,806 9,806 9,806 9,806 9,806 9,806 9,806 9,806 9,806 9,799 9,806 9,806 16 2012 Total cognition (0-27) 17,767 17,485 15,546 17,770 17,770 17,770 17,770 17,770 9,806 9,817 9,806 17,770 17,759 9,806 9,806 17,770 17 2012 Difficulty with IADLs 18,201 17,915 15,729 18,114 18,114 17,822 18,204 18,204 10,102 10,121 10,108 18,128 18,100 9,834 9,801 17,760 18,204 18 2012 Difficulty with IADL ($) 18,190 17,904 15,721 18,103 18,103 17,812 18,193 18,193 10,092 10,111 10,098 18,117 18,089 9,825 9,792 17,750 18,193 18,193 19 2012 Verbal analogies score 1,809 1,798 1,571 1,801 1,801 1,776 1,809 1,809 1,001 1,002 1,003 1,803 1,802 979 977 1,772 1,809 1,809 1,809

41
Table 13. 2012 HRS verbal analogies score by age and gender.
Age mean sd n mean sd n mean sd n53-59 501 29 234 506.5 28.8 297 504.1 29 53160-69 503.7 30.7 201 505.4 26.6 300 504.7 28.3 50170-79 495.6 27.6 215 500 26.6 275 498 27.1 49080+ 495.1 28 111 493.3 26.6 176 494 27.1 287
Total 499.3 29.1 761 502.3 27.6 1048 501 28.3 1809
Male Female Total

42
References Jaffe, L. (2009). Development, interpretation, and application of the W score and the relative proficiency
index. Woodcock Johnson III Assessment Service Bulletin Number 11. Rolling Meadows, IL: Riverside. Accessed online May 2, 2013 at http://www.riverpub.com/products/wjIIIComplete/pdf/WJ3_ASB_11.pdf
Lachman, M. E. & Spiro, A. (2002). Critique of Cognitive Measures in the Health and Retirement Study
(HRS) and the Asset and Health Dynamics among the Oldest Old (AHEAD) Study. Report to the HRS Data Monitoring Committee.
Morris, J.C., Heyman, A., Mohs, R.C., Hughes, J.P., van Belle, G., Fillenbaum,G.,
Mellits, E.D., Clark,C., and the CERAD investigators (1989). The Consortium to Establish a Registry for Alzheimer's Disease (CERAD). Part I. Clinical and neuropsychological assessment of Alzheimer's disease. Neurology, 39, 1159- 1165.

43
Appendix 1. HRS 2010 Number Series SAS Code for Score Computation The SAS code below demonstrates how the HRS 2010 Number Series W-scores and standard errors and Guttman scale 0-15 score should be computed:
NS10SCORE=.; label NS10SCORE='HRS 2010 CALCULATED NUMBER SERIES TOTAL SCORE'; NS10SCORESE=.; label NS10SCORESE = 'HRS 2010 STANDARD ERROR OF CALCULATED NUMBER SERIES TOTAL SCORE'; NS10GSCORE=.; label NS10GSCORE='HRS 2010 CALCULATED NUMBER SERIES 0-15 SCORE'; *NSLIST=1 corresponds to List A – it is based on a preloaded variable; *NSLIST=2 corresponds to List B - it is based on a preloaded variable; if NSLIST = 1 then do; *Computing 0-15 score for List A; If Set1A=0 then NS10GSCORE = 0 + Set2A; else if Set1A=1 then NS10GSCORE = 4 + Set2A; else if Set1A=2 then NS10GSCORE = 8 + Set2A; else if Set1A=3 then NS10GSCORE = 12 + Set2A; *Computing W scores for List A; If Set1A=0 and Set2A=0 then NS10SCORE=390.2; else if Set1A=0 and Set2A=1 then NS10SCORE=403.4; else if Set1A=0 and Set2A=2 then NS10SCORE=442.7; else if Set1A=0 and Set2A=3 then NS10SCORE=491.8; else if Set1A=1 and Set2A=0 then NS10SCORE=480.5; else if Set1A=1 and Set2A=1 then NS10SCORE=495.6; else if Set1A=1 and Set2A=2 then NS10SCORE=508.1; else if Set1A=1 and Set2A=3 then NS10SCORE=518.0; else if Set1A=2 and Set2A=0 then NS10SCORE=518.3; else if Set1A=2 and Set2A=1 then NS10SCORE=525.2; else if Set1A=2 and Set2A=2 then NS10SCORE=532.0; else if Set1A=2 and Set2A=3 then NS10SCORE=540.8; else if Set1A=3 and Set2A=0 then NS10SCORE=530.6; else if Set1A=3 and Set2A=1 then NS10SCORE=540.8; else if Set1A=3 and Set2A=2 then NS10SCORE=560.4; else if Set1A=3 and Set2A=3 then NS10SCORE=579.6; *Computing standard errors for W scores in List A; If Set1A=0 and Set2A=0 then NS10SCORESE=16.3; else if Set1A=0 and Set2A=1 then NS10SCORESE=13.2; else if Set1A=0 and Set2A=2 then NS10SCORESE=38.2; lse if Set1A=0 and Set2A=3 then NS10SCORESE=18.5; else if Set1A=1 and Set2A=0 then NS10SCORESE=12.2; else if Set1A=1 and Set2A=1 then NS10SCORESE=11.4; else if Set1A=1 and Set2A=2 then NS10SCORESE=9.9; else if Set1A=1 and Set2A=3 then NS10SCORESE=10.9; else if Set1A=2 and Set2A=0 then NS10SCORESE=8.2; else if Set1A=2 and Set2A=1 then NS10SCORESE=7.8; else if Set1A=2 and Set2A=2 then NS10SCORESE=8.2;

44
else if Set1A=2 and Set2A=3 then NS10SCORESE=10.2; else if Set1A=3 and Set2A=0 then NS10SCORESE=9.0; else if Set1A=3 and Set2A=1 then NS10SCORESE=10.6; else if Set1A=3 and Set2A=2 then NS10SCORESE=16.8; else if Set1A=3 and Set2A=3 then NS10SCORESE=18.0; end; if NSLIST = 2 then do; *Computing 0-15 score for List B; If Set1B=0 then NS10GSCORE = 0 + Set2B; else if Set1B=1 then NS10GSCORE = 4 + Set2B; else if Set1B=2 then NS10GSCORE = 8 + Set2B; else if Set1B=3 then NS10GSCORE = 12 + Set2B; *Computing W scores for List B; If Set1B=0 and Set2B=0 then NS10SCORE=403.6; else if Set1B=0 and Set2B=1 then NS10SCORE=427.1; else if Set1B=0 and Set2B=2 then NS10SCORE=461.0; else if Set1B=0 and Set2B=3 then NS10SCORE=492.5; else if Set1B=1 and Set2B=0 then NS10SCORE=483.2; else if Set1B=1 and Set2B=1 then NS10SCORE=497.7; else if Set1B=1 and Set2B=2 then NS10SCORE=509.8; else if Set1B=1 and Set2B=3 then NS10SCORE=519.5; else if Set1B=2 and Set2B=0 then NS10SCORE=519.1; else if Set1B=2 and Set2B=1 then NS10SCORE=526.0; else if Set1B=2 and Set2B=2 then NS10SCORE=532.9; else if Set1B=2 and Set2B=3 then NS10SCORE=541.7; else if Set1B=3 and Set2B=0 then NS10SCORE=523.5; else if Set1B=3 and Set2B=1 then NS10SCORE=542.4; else if Set1B=3 and Set2B=2 then NS10SCORE=554.5; else if Set1B=3 and Set2B=3 then NS10SCORE=565.9; *Computing standard errors for W scores in List B; If Set1B=0 and Set2B=0 then NS10SCORESE=18.3; else if Set1B=0 and Set2B=1 then NS10SCORESE=21.0; else if Set1B=0 and Set2B=2 then NS10SCORESE=16.6; else if Set1B=0 and Set2B=3 then NS10SCORESE=18.5; else if Set1B=1 and Set2B=0 then NS10SCORESE=12.0; else if Set1B=1 and Set2B=1 then NS10SCORESE=11.2; else if Set1B=1 and Set2B=2 then NS10SCORESE=9.7; else if Set1B=1 and Set2B=3 then NS10SCORESE=9.2; else if Set1B=2 and Set2B=0 then NS10SCORESE=8.2; else if Set1B=2 and Set2B=1 then NS10SCORESE=7.8; else if Set1B=2 and Set2B=2 then NS10SCORESE=8.2; else if Set1B=2 and Set2B=3 then NS10SCORESE=10.2; else if Set1B=3 and Set2B=0 then NS10SCORESE=9.2; else if Set1B=3 and Set2B=1 then NS10SCORESE=9.2; else if Set1B=3 and Set2B=2 then NS10SCORESE=11.5; else if Set1B=3 and Set2B=3 then NS10SCORESE=15.9; end;

45
Appendix 2. HRS 2012 Number Series SAS Code for Score Computation The SAS code below demonstrates how the HRS 2010 Number Series W-scores and standard errors should be computed:
NS12SCORE=.; label NS12SCORE='HRS 2012 CALCULATED NUMBER SERIES TOTAL SCORE'; NS12SCORESE=.; label NS12SCORESE = 'HRS 2012 STANDARD ERROR OF CALCULATED NUMBER SERIES TOTAL SCORE'; NS12GSCORE=.; label NS10GSCORE='HRS 2012 CALCULATED NUMBER SERIES 0-15 SCORE'; *NSLIST=1 corresponds to List A – it is based on a preloaded variable; *NSLIST=2 corresponds to List B - it is based on a preloaded variable; if NSLIST = 1 then do; *Computing 0-15 score for List A; If Set1A=0 then NS10GSCORE = 0 + Set2A; else if Set1A=1 then NS10GSCORE = 4 + Set2A; else if Set1A=2 then NS10GSCORE = 8 + Set2A; else if Set1A=3 then NS10GSCORE = 12 + Set2A; *Computing W scores for List A; If Set1A=0 and Set2A=0 then NS12SCORE=409; else if Set1A=0 and Set2A=1 then NS12SCORE=429; else if Set1A=0 and Set2A=2 then NS12SCORE=462; else if Set1A=0 and Set2A=3 then NS12SCORE=484; else if Set1A=1 and Set2A=0 then NS12SCORE=488; else if Set1A=1 and Set2A=1 then NS12SCORE=501; else if Set1A=1 and Set2A=2 then NS12SCORE=513; else if Set1A=1 and Set2A=3 then NS12SCORE=524; else if Set1A=2 and Set2A=0 then NS12SCORE=518; else if Set1A=2 and Set2A=1 then NS12SCORE=528; else if Set1A=2 and Set2A=2 then NS12SCORE=536; else if Set1A=2 and Set2A=3 then NS12SCORE=546; else if Set1A=3 and Set2A=0 then NS12SCORE=536; else if Set1A=3 and Set2A=1 then NS12SCORE=546; else if Set1A=3 and Set2A=2 then NS12SCORE=558; else if Set1A=3 and Set2A=3 then NS12SCORE=570; *Computing standard errors for scores in List A; If Set1A=0 and Set2A=0 then NS12SCORESE=18; else if Set1A=0 and Set2A=1 then NS12SCORESE=19; else if Set1A=0 and Set2A=2 then NS12SCORESE=17; lse if Set1A=0 and Set2A=3 then NS12SCORESE=13; else if Set1A=1 and Set2A=0 then NS12SCORESE=12; else if Set1A=1 and Set2A=1 then NS12SCORESE=11; else if Set1A=1 and Set2A=2 then NS12SCORESE=10; else if Set1A=1 and Set2A=3 then NS12SCORESE=10; else if Set1A=2 and Set2A=0 then NS12SCORESE=10; else if Set1A=2 and Set2A=1 then NS12SCORESE=9;

46
else if Set1A=2 and Set2A=2 then NS12SCORESE=9; else if Set1A=2 and Set2A=3 then NS12SCORESE=10; else if Set1A=3 and Set2A=0 then NS12SCORESE=10; else if Set1A=3 and Set2A=1 then NS12SCORESE=10; else if Set1A=3 and Set2A=2 then NS12SCORESE=12; else if Set1A=3 and Set2A=3 then NS12SCORESE=16; end; if NSLIST = 2 then do; *Computing 0-15 score for List B; If Set1B=0 then NS10GSCORE = 0 + Set2B; else if Set1B=1 then NS10GSCORE = 4 + Set2B; else if Set1B=2 then NS10GSCORE = 8 + Set2B; else if Set1B=3 then NS10GSCORE = 12 + Set2B; *Computing W scores for List B; If Set1B=0 and Set2B=0 then NS12SCORE=413; else if Set1B=0 and Set2B=1 then NS12SCORE=435; else if Set1B=0 and Set2B=2 then NS12SCORE=465; else if Set1B=0 and Set2B=3 then NS12SCORE=485; else if Set1B=1 and Set2B=0 then NS12SCORE=489; else if Set1B=1 and Set2B=1 then NS12SCORE=503; else if Set1B=1 and Set2B=2 then NS12SCORE=514; else if Set1B=1 and Set2B=3 then NS12SCORE=525; else if Set1B=2 and Set2B=0 then NS12SCORE=519; else if Set1B=2 and Set2B=1 then NS12SCORE=529; else if Set1B=2 and Set2B=2 then NS12SCORE=537; else if Set1B=2 and Set2B=3 then NS12SCORE=547; else if Set1B=3 and Set2B=0 then NS12SCORE=537; else if Set1B=3 and Set2B=1 then NS12SCORE=549; else if Set1B=3 and Set2B=2 then NS12SCORE=567; else if Set1B=3 and Set2B=3 then NS12SCORE=584; *Computing standard errors for W scores in List B; If Set1B=0 and Set2B=0 then NS12SCORESE=18; else if Set1B=0 and Set2B=1 then NS12SCORESE=19; else if Set1B=0 and Set2B=2 then NS12SCORESE=15; else if Set1B=0 and Set2B=3 then NS12SCORESE=12; else if Set1B=1 and Set2B=0 then NS12SCORESE=12; else if Set1B=1 and Set2B=1 then NS12SCORESE=11; else if Set1B=1 and Set2B=2 then NS12SCORESE=10; else if Set1B=1 and Set2B=3 then NS12SCORESE=10; else if Set1B=2 and Set2B=0 then NS12SCORESE=10; else if Set1B=2 and Set2B=1 then NS12SCORESE=9; else if Set1B=2 and Set2B=2 then NS12SCORESE=9; else if Set1B=2 and Set2B=3 then NS12SCORESE=10; else if Set1B=3 and Set2B=0 then NS12SCORESE=10; else if Set1B=3 and Set2B=1 then NS12SCORESE=10; else if Set1B=3 and Set2B=2 then NS12SCORESE=16; else if Set1B=3 and Set2B=3 then NS12SCORESE=18; end;

47
Appendix 3. HRS 2012 Verbal Analogies SAS Code for Score Computation *FIRST SET; array VEIt1 [3] VE31 VE32 VE33; *SECOND SET; array VEIt21 [3] VE11 VE12 VE13; array VEIt22 [3] VE21 VE22 VE23; array VEIt23 [3] VE41 VE42 VE43; array VEIt24 [3] VE51 VE52 VE53; *Counting number correct per set; VESCORE1=0; label VESCORE1='VERBAL ANALOGIES-# CORRECT 1ST 3 ITEMS'; VESCORE2=0; label VESCORE2='VERBAL ANALOGIES-# CORRECT 2ND 3 ITEMS'; do i=1 to 3; if VEIt1[i]=1 then VESCORE1=VESCORE1+1; end; If VE31=. and VE32=. and VE33=. then VESCORE1=.; If VE31=7 then VESCORE1=.; do j= 1 to 3; if VESCORE1=0 then do; if VEIt21[j] = 1 then VESCORE2=VESCORE2+1; end; else if VESCORE1=1 then do; if VEIt22[j] = 1 then VESCORE2=VESCORE2+1; end; else if VESCORE1=2 then do; if VEIt23[j] = 1 then VESCORE2=VESCORE2+1; end; else if VESCORE1=3 then do; if VEIt24[j] = 1 then VESCORE2=VESCORE2+1; end; end; VESCORE6=VESCORE1+VESCORE2; label VESCORE6='VERBAL ANALOGIES-# CORRECT OF 6 ITEMS'; VESCORE=.; label VESCORE ='CALCULATED VERBAL ANALOGIES TOTAL SCORE'; VESCORESE=.; label VESCORESE ='STD ERR OF CALCULATED VERBAL ANALOGIES TOT SCORE'; if VEVERSION = 1 then do; If VESCORE1=0 and VESCORE2=0 then do VESCORE=435; VESCORESE=16; end; else if VESCORE1=0 and VESCORE2=1 then do VESCORE=446; VESCORESE=11; end; else if VESCORE1=0 and VESCORE2=2 then do VESCORE=458; VESCORESE=10; end; else if VESCORE1=0 and VESCORE2=3 then do VESCORE=469; VESCORESE=11; end; else if VESCORE1=1 and VESCORE2=0 then do VESCORE=468; VESCORESE=11; end; else if VESCORE1=1 and VESCORE2=1 then do VESCORE=479; VESCORESE=9; end; else if VESCORE1=1 and VESCORE2=2 then do VESCORE=488; VESCORESE=9; end; else if VESCORE1=1 and VESCORE2=3 then do VESCORE=499; VESCORESE=11; end; else if VESCORE1=2 and VESCORE2=0 then do VESCORE=497; VESCORESE=10; end; else if VESCORE1=2 and VESCORE2=1 then do VESCORE=507; VESCORESE=9; end; else if VESCORE1=2 and VESCORE2=2 then do VESCORE=516; VESCORESE=9; end;

48
else if VESCORE1=2 and VESCORE2=3 then do VESCORE=527; VESCORESE=11; end; else if VESCORE1=3 and VESCORE2=0 then do VESCORE=526; VESCORESE=11; end; else if VESCORE1=3 and VESCORE2=1 then do VESCORE=537; VESCORESE=10; end; else if VESCORE1=3 and VESCORE2=2 then do VESCORE=549; VESCORESE=11; end; else if VESCORE1=3 and VESCORE2=3 then do VESCORE=560; VESCORESE=16; end; end; if VEVERSION = 2 then do; If VESCORE1=0 and VESCORE2=0 then do VESCORE=436; VESCORESE=16; end; else if VESCORE1=0 and VESCORE2=1 then do VESCORE=447; VESCORESE=11; end; else if VESCORE1=0 and VESCORE2=2 then do VESCORE=458; VESCORESE=10; end; else if VESCORE1=0 and VESCORE2=3 then do VESCORE=470; VESCORESE=11; end; else if VESCORE1=1 and VESCORE2=0 then do VESCORE=467; VESCORESE=11; end; else if VESCORE1=1 and VESCORE2=1 then do VESCORE=477; VESCORESE=9; end; else if VESCORE1=1 and VESCORE2=2 then do VESCORE=487; VESCORESE=9; end; else if VESCORE1=1 and VESCORE2=3 then do VESCORE=498; VESCORESE=11; end; else if VESCORE1=2 and VESCORE2=0 then do VESCORE=497; VESCORESE=11; end; else if VESCORE1=2 and VESCORE2=1 then do VESCORE=507; VESCORESE=9; end; else if VESCORE1=2 and VESCORE2=2 then do VESCORE=517; VESCORESE=10; end; else if VESCORE1=2 and VESCORE2=3 then do VESCORE=528; VESCORESE=11; end; else if VESCORE1=3 and VESCORE2=0 then do VESCORE=526; VESCORESE=11; end; else if VESCORE1=3 and VESCORE2=1 then do VESCORE=537; VESCORESE=10; end; else if VESCORE1=3 and VESCORE2=2 then do VESCORE=548; VESCORESE=11; end; else if VESCORE1=3 and VESCORE2=3 then do VESCORE=559; VESCORESE=16; end; end;