hrd poverty in the philippines
TRANSCRIPT

8/3/2019 HRD Poverty in the Philippines
http://slidepdf.com/reader/full/hrd-poverty-in-the-philippines 1/44
For comments, suggestions or further inquiries please contact:
Philippine Institute for Development StudiesSurian sa mga Pag-aaral Pangkaunlaran ng Pilipinas
The PIDS Discussion Paper Seriesconstitutes studies that are preliminary andsubject to further revisions. They are be-ing circulated in a limited number of cop-ies only for purposes of soliciting com-ments and suggestions for further refine-ments. The studies under the Series areunedited and unreviewed.
The views and opinions expressedare those of the author(s) and do not neces-sarily reflect those of the Institute.
Not for quotation without permissionfrom the author(s) and the Institute.
August 2005
The Research Information Staff, Philippine Institute for Development Studies3rd Floor, NEDA sa Makati Building, 106 Amorsolo Street, Legaspi Village, Makati City, PhilippinesTel Nos: 8924059 and 8935705; Fax No: 8939589; E-mail: [email protected]
Or visit our website at http://www.pids.gov.ph
DISCUSSION PAPER SERIES NO. 2005-17
Human Resource Developmentand Poverty in the Philippines
Le Thi Ai Lam

8/3/2019 HRD Poverty in the Philippines
http://slidepdf.com/reader/full/hrd-poverty-in-the-philippines 2/44
Human Resource Development and Poverty in the Philippines
Le Thi Ai LamResearch fellow,Institute of World economics and politicsHanoi, Vietnam
ABSTRACT
In the last twenty years, the Philippines has gained a good progress in poverty
reduction. However, compared to other countries in the region, the Philippines is still
behind. In the early years of the 21 st century, more than a third of the Philippine population
lives below the poverty line. With landless status, the poor depended largely on labor with
its embedded educational capital. However, in education, the rich and the poor are
separated by two different educational divisions--private and public--and of high quality
and low-quality education.
Poor children encounter lack of access to quality education due to a high dropping out
rate at an early age and going to public schools that offer low quality education. The lack of
access to quality education has affected the poor more severely when there was poor job
generation, relative deterioration of unskilled labor situation, and low rate of return on
education at basic levels. The poor faced high rate of underemployment and low income.
The government is aware of the educational lack of the poor, but there are a number of
factors that prevent the poor having access to quality education. To an extent, government
spending policies on education was not geared toward pro-poor. Furthermore, opportunity
costs and their unfavorable outcomes in labor markets prevent further improvements of
early and high dropout rate of the poor as a result of weaknesses in policy implementation.
Keywords: poverty, education, human resource development, labor, Philippines

8/3/2019 HRD Poverty in the Philippines
http://slidepdf.com/reader/full/hrd-poverty-in-the-philippines 3/44
1
1. FRAMEWORK FOR HUMAN RESOURCEDEVELOPMENT AND POVERTY IN THE PHILIPPINES
The simple framework of this paper operates within the premise that povertyincidence can be affected in two ways: first by improving educational service toincrease the productive potential of marginalized sectors and second by providingemployment and income opportunities for the poor to afford quality education inorder to compete in the labor markets.
Applying this framework to the Philippine situation, one can see that thefailure of providing education and employment with good quality to the poor tendto perpetuate poverty in the country.
Poverty reduction efforts in the Philippines has proven to be of somefavorable outcomes in late 80’s through the 90’s causing the number of themarginalized poor to drop from the rate of 49.2 % in 1985 to 36.9% in 1997.However, after 1997 the rate of poverty has increased from its 1997 rate of 36.9%to 39.5% in 2000. The current Philippine poverty rate, in both rural and urbanareas in the Philippines is much higher as compared to that of her neighboringcountries. According to the national poverty lines, poverty incidence in Malaysiawas 7.5% in 1999, while in Thailand and Indonesia it was 9.8% and 18.2%respectively in 2002. Even as compared to Vietnam, a country with per capitaincome of about two times lower than the Philippines, Philippine poverty rate isrelatively high. Vietnam’s poverty rate in 2002 was only 28.9%. The comparison
based on the international income poverty threshold of 1USD/ day also givessupports to the above statement. The rate of population having income less than 1USD per day was 15.5% in the Philippines in 2000, while in Malaysia the rate was0.2 % in 1999, in Thailand, Indonesia and Vietnam, the rates were 1.9%, 7.5%and 13.1% respectively in 2002 i.One distinct feature of the Philippine population is that, the citizens have longyears of education. On average, a citizen has more than 8 years of formalschooling in 2000 ii. For the Philippine poor, however, high dropout rate,especially at grades prior to the last year of schooling has a great effect on theincome. The low quality of education of the poor makes education itself less-valued in economic terms. Furthermore, high population growth rate coupled withlow employment generation in the country has pushed large part of labor force toagriculture and informal sectors, making these sectors less productive with
pervasive underemployment. With this economic and educational situation, eventhe long years of formal education that Filipino receive do not guarantee secureand stable jobs, thus education does not mean escape from poverty, (Figure 1)

8/3/2019 HRD Poverty in the Philippines
http://slidepdf.com/reader/full/hrd-poverty-in-the-philippines 4/44
2
Figure 1: HUMAN RESOURCE DEVELOPMENT AND POVERTY :
A frame work for the Philippine case
Poverty:
High incidence and low progress Unpropotional distribution
Poor education:
Inadequate access Low quality
Low incomes: Low effect of basic
education on wage andincome
Degredation of unskilled jobs
Underemployment
Low job generationand highunem lo ment
Capital intensiveindustries
Globalization

8/3/2019 HRD Poverty in the Philippines
http://slidepdf.com/reader/full/hrd-poverty-in-the-philippines 5/44
3
2. PICTURE OF THE PHILIPPINE POVERTYThis section presents the picture of Philippine poverty: the characteristics of the
poor and the trend of poverty from 1985 to 2000.2.1. Status and trends of povertyPoverty is a well studied topic in the Philippines. Poverty incidence has been
studied from different perspectives - expenditure or consumption, self-ratediii
and themost conventional measure - income. Due to scope of this paper, which focuses on theissues of income, this section examines the trend and status of poverty using theconventional income-based poverty incidence.
Philippine poverty reduction has some large progress in prior Asian crisis period,dropped more than 12% in between 1985 and 1997. At the same time, during the
period 1985-2000, the Philippines poor has got better off thanks to an improvement inthe depth and severity of poverty. Poverty gap index which express the depth of
poverty, has decreased upon the time, from 14.7% in 1985 to 10.7% in 2000 showingthat the poor are getting less poor. In the same manner, poverty severity index hasreduced from 6.6% in 1985 to 4.6% in 2000, presenting poverty become less severe.

8/3/2019 HRD Poverty in the Philippines
http://slidepdf.com/reader/full/hrd-poverty-in-the-philippines 6/44
4
Sources: Key indicators 2004: poverty in Asia: Measurement, Estimates and prospect p3, 8 &Reyes (2002) p6
However, poverty is still a widespread phenomenon in the Philippines. After theAsian crisis poverty rate in the country increased again to 39.5% in 2000 (Table 1).Compared to other Southeast Asian countries, currently, Philippine has a higher
poverty rate both in national and international measures (Table 2).If the contrasting situation between the rural and urban poverty is to be examined
closely, one can see that rural poverty incidence is higher and lower to progress.Between 1985-2000, while urban poverty has reduced 13.4% in headcount ratio and13.7% in poverty incidence of families, rural poverty has reduced only 2.4% and3.8% respectively.
Furthermore, poverty incidence and poverty reduction progress are so unequalamong regions in the country. The highest poverty incidence found in MuslimMindanao and then Bicol regions with head count poverty incidence more than 60%in almost the whole period 1985-2003. In 2000, more than two third people who livein Muslim Mindanao are poor and what is worrisome is that while in all other regions
poverty reduction has progresses in period 1985-2003, in Muslim Mindanao it isstagnated. Poverty incidence in Muslim Minadao has increased rapidly from 56% in1991 to 71.3% in 2000 (Table 3). Bicol region is found to be not only the region withsecond highest poverty incidence but also the regions that have the largest number of the poor in 2000 with 3.6 million. Before 2000, the largest number of the poor isfound in Southern Tagalog for all the years of Family Income and Expenditure Survey(FIES) in 1985-1997.
There are several reasons for the slow and unequal progress of poverty reductionsin the Philippines, but the most important ones are related to two groups of factors.The first is slow economic growth rates, especially in per capita income perspectivesand high economic inequality. Poor growth rate of per capita income is evidenced in
Box 1: Poverty depth and poverty severity: concepts and Philippines evidencesAlthough the head count ratio (HCR) is both simple and useful, it fails to describe how poor a poor
person is. Poverty gap index (PGI) and squared poverty gap index (SPGI) have been designed to solve theconceptual problems. The efforts was given first by Sen (1976), and then followed by Foster, Greer andThorbecke (1984), which lead to understandings as followed:
The poverty gap index gives a sense of how poor the poor are and reflects the depth of poverty. It isequivalent to the shortfall of consumption bellow the poverty line per head of the total population and it isexpressed as a percentage of the poverty line.
The squared poverty gap index adds the dimension of inequality among the poor to poverty gap indexesand is said to reflect the severity of poverty. For a given value of the poverty gap index, population with greater dispersion of incomes or expenditures among the poor will show up with a higher value for the squared povertygap index.
Both poverty gap index and squared poverty gap index can be computed by the Foster-Gree-Thorbecke(FGT) formula:
PGI = 1/n ∑ [(Z – Yi )/Z]
SPGI = 2
1
]/)[(/1 Z Yi Z nm
i∑
=
−
Yi is consumption or income of i-th poor Z= poverty line, n = total population, m = number of poor.C. Reyes (2002) has computed poverty gap and poverty severity indexes for the Philippines in period
1985-2000, the results are in table A.Table A: Poverty gap and poverty severity indexes, Philippines , 1985-2000.(In percent)
Poverty gap indexes Poverty severity indexes1985 14.7 6.61988 12.8 5.51991 13.0 5.81994 11.3 5.01997 10.0 4.32000 10.7 4.6

8/3/2019 HRD Poverty in the Philippines
http://slidepdf.com/reader/full/hrd-poverty-in-the-philippines 7/44
5
situation where slow economic growth accompanied to high and even increasing population growth rate. As seen in table 4, Philippine GDP growth rate was around 4% in 90’s and 2000, lower than most of her neighbors. It should be noted however,that the Philippine population growth rate was more than 2% higher than most of her neighbors during that years. As a result, income per capita was stagnated. In period1998 – 2000, per-capita GNP growth rate was as low as 0,8% per year. The country
GDP per capita at the turn of 21th century was about the same as that reached in early1980 iv.
However, growth alone does not give clear explanation for the whole story of poverty situation in the Philippines because the tendency of rising Gini coefficient inthe country shows that the poor gets poorer and the rich gets richer. Gini coefficienthas increased from 0.47 in 1985 to 0.51 in 2000 and the share of bottom incomequintile has reduced from 4,79% in 1985 to 4,67% in 2000 v.
The other important factors that affect poverty reduction in the Philippines arethose strongly associated to human resource development issues. There are poor income opportunities for the poor in labor markets due to inadequate access to qualityeducation and well paid, secured jobs. The problems of human resource development
(HRD) are grave for the Philippine poor because, most of them are landless and theyhave to rely on labor as the only critical source of every day living. There is a highrate of labor among urban poor that engaged in agriculture and those who are landlessare common both among the urban and rural poor. Aldaba & Tuano (1997) shows thatin 1985, only 30% of agriculture household were owner of landholdings and the sizeof their land is very small, mainly less than 2 hectares. Also Aldaba & Tuano (1997)as cited from WB (1996) shows that landholdings by poor decreased by one third
between 1985 and 1992 and recent evidence has shown a further decrease. In 1998,only 20% of poor households possess agricultural land and this number included 8.6%of poor households acquired agricultural land ownership though CARP. In this kindof situation, the need to attain good education is important for the poor .
2.2.Characteristics of the Philippine poorSince 1985, in the Philippines there are special national surveys of characteristics
of the lowest income households were given under Socio –Economic Profile of aSpecial group of Families. The coverage of this survey is the lowest 30 percentileincome households observed under the FIES. Main characteristics of poor inPhilippines may be noted as followed:
First , the poor mainly live in rural area. More than 70% of poor lived in ruralareas in 1985 and until 2000, still almost 70% of poor live there. In 1985, more than ahalf or 50.7% of rural families were poor and the rate has not changed much so far,with 46.9% in 2000. In between 1980s and 1990s there was problems of reclassification of urban-rural areas and it is not really comparable for povertyindicators of 1980s and 1990s vi. However, from table 5 it is seen that even in 1990s
when the poverty indicators are reasonably comparable there was the rise in share of rural poor and the tendency of poor living in rural areas still maintained.Second, most of the poor have inadequate access to housing of adequate quality.
Although two or more households are contained in, the housing for the poor is mainlymade from non-durable materials. In 1998, among poor households, only 39.5% havehousing made from strong material, 60.5% housing made from light material andmakeshift compared to that of 77.7% and 22.3% respectively for the non-poor (Table6). In urban areas, it is common for poor households stay in slum and squatter settlements, which have no legal basis for ownership.

8/3/2019 HRD Poverty in the Philippines
http://slidepdf.com/reader/full/hrd-poverty-in-the-philippines 8/44
6
Third , poor households derive income from variety of activities but the largestsource of income is from entrepreneurial activities (35.3% in 1998), mainly retailedtrade, construction and transport sectors. In addtition, non-gainful occupation, farmingand fishing are important income activities of the poor. The share of wage and salariescome from agricultural activities is much higher compared to non-poor (12.1%compared to 2.1% in 1997). This is may be the income of landless workers in
agriculture. The main income activities of the poor can also seen though the povertyincidence among occupations. As shown in table 8, the highest poverty incidence of families was among agricultural, animal husbandry and forestry workers, fishermenand hunters, 55.5% in 2000, in production and related workers, transport andequipment operators, 33.8% in 2000 and in non-gainful occupation, 29.2% in 2000. Incity, more often, while male heads primarily works in transport, female members of households derive their incomes from trade and services. In rural areas, poor households have the main source of income from crop farming and fishing. The
poorest were farmers and farm workers in the rice, corn sugars and coconut sectors. Fourth , the poor tend to be less educated and more malnutrition than non-poor
due to inadequate access to public service, including clean water, electricity,education, health and sanitation services. Compared to non-poor, the poor has lower access to water and sanitary service with adequate quality, 67.5% compared to 83.5%and 67.4% compared to 89.4% respectively in 1998. The poor has poorer educationcompared to non-poor, with participation rate is lower for all education level but withvery large gaps at the secondary and tertiary levels (Table 6). Poverty is widespreadamong household head with primary education or no schooling. In period 1985-2000,while poverty incidence has reduced for all other household heads, it is increased for the ones with no schooling from 55.9% to 60.5% (Table 8).
Fifth , the poor tend to be more economically active than the rest of populationwith a higher labor participation rate or lower non-labor force, especially among theoldest and youngest age groups but with less access to the formal labor markets.Among non-labor force in 1998, only 19% came from the poor, 81% came from the
non-poor. Two third of poor men and three fourth of poor women worked as self-employed or unpaid family workers compared to 45% national average vii. If look atthe income decile contrast, we can see the share of salary and wage workers increaseas one goes up with income ladder, from 31.2% for the poorest income decile to52.3% for the richest decile.
Sixth, the poor come from bigger families than average from the average ones(Table 7). Data from FIESs show since 1985 poverty incidence by headcount is higher than poverty incidence by families. In 2000, the average size of poor families was 6.0while it was 4.67 for non-poor. Poverty incidence also increased along the size of families, the bigger the family size the higher the poverty incidence among group(Table 8). In period 1985-2000, the poverty reduction progress also reduced along thefamily size, the bigger the family size the lower the progress on poverty reduction.
Based on the national statistics, male headed households those that have largenumber of members (more than five) whose heads have had little or no formalschooling are more vulnerable to poverty. Generally, poor households are younger than non-poor households. Most parents of urban poor households generally migratedfrom the depressed areas in the country. A majority of the urban poor in Metro Manilaoriginate from Biscon, Samar and Leyte.

8/3/2019 HRD Poverty in the Philippines
http://slidepdf.com/reader/full/hrd-poverty-in-the-philippines 9/44
7
3. EDUCATION FOR THE POOR It is a given fact that the poor have few opportunities to get formal schooling and
be equipped with some knowledge which they could use to improve their lives.Inadequate and poor quality education negatively affects people everywhere but themost affected are the poor. The poor in Philippines is critically limited by only oneincome source of their labor due to landless status. In a time of increasing knowledge-driven development in the world and capital and knowledge intensive industrialstructure of the Philippine economy, labor without or with poor knowledge can hardlyfind a job with more or less accepted standards. However, it is likely the commonsituation of poor in the Philippine labor markets.
Education or knowledge acquisition of poor in the Philippine is namely affected by two factors: inadequate access to education, low quality of education. The rest of this section will concentrate on these factors. It should be stressed that, despite theincreasing opportunities for the poor to have access to higher level of education, whatthey receive is mainly basic education. Therefore, to make the section to be morefocused, the paper will give analysis mainly on basic education of the poor in thePhilippines.
3.1. Inadequate access to education of the poorEducation is of high value in the Philippine society. One of distinguished
features of the Philippine education system is that it provides a relatively wide accessto education to citizens. Filipino access to education has gained large progresses in the1980s and the 1990s. Currently, the educational participation rate of the Filipino ineducation at all levels is better than countries with even higher per capita income suchas Malaysia (Table 10).
However some more insights on access of Filipino to education according toregions and income class show an inequitable access to education where the poor tendto have inadequate access compared to non-poor.
In the Philippines the regional differences in educational participation rate exist
in both elementary and secondary levels. These regional gaps are smaller atelementary education, and larger at secondary level. What is worth noting is that thesegaps have considerably been narrowed in the 90’s, particularly at primary level. Inschool year (SY) 1990-1991, the highest rate of elementary education participationrate was in Central Luzon (94%) and the lowest was in Muslim Mindanao (62.2%). InSY 1999-2000, the differences between the highest elementary participation rate andthe lowest among regions in countries reduced from its high record of SY 1990-1991,31.8% to 7.6%. An important progress that should be noted is that Muslim Mindanaohas performed well in the secondary level, although large regional disparities in
participation rate are still observed despite some improvement for the whole the 90’s.In SY 1999-2000, the poorest performance was in Muslim Mindanao (31.1%) whileMetro Manila performed well (80.3%) (table 11).
The general observation in basic education participation rate is that Mindanao(regions IX to XIII) have lagged behind, while National Capital Regions and regions Iand III have been best. To make a contrast regional picture of basic education
participation rate with that of poverty incidence, one can see a considerablecoincidence between the two where poverty incidence is inverted to education
participation rate which shows the higher the poverty incidence in a region coupledwith the lower the education participation rate (figure 2). This situation reveals adegree of correlation between education participation rate and poverty in thePhilippines.

8/3/2019 HRD Poverty in the Philippines
http://slidepdf.com/reader/full/hrd-poverty-in-the-philippines 10/44
8
The observation and correlation between education access and poverty is stronglysupported by evidences on access to education of different income class in thePhilippines. From income class perspectives, there is a large gap in access toeducation at all levels between poorest income deciles and riches income decilesand/or between poor and non-poor
Computing the enrolment rate of different income deciles, research by Balisacan(1994) on the data of 1988 showed that there are pronounced differences in access toeducation between the rich and the poor. The paper asserts that while there is analmost 100 percent enrolment rate for children at age 7-10, it started to drop after thatage, especially for three poorest deciles. It occurred for both rural and urban areaswith enrolment rate for the age group of 13-14 falling down to 75% for the three
poorest deciles in urban areas and 65% for rural areas in 1988, while it remained ashigh as 98% for the upper three deciles in urban and 85% in rural.
More recently, work done by Orbeta A. C (2002) asserts that the low-income endhas poor access to higher education, referring to Tan, E. et al (2002) that in a lowincome economy, the inequity in education will even be more intense than theinequality in income. However, computed data in Orbeta A. C (2002) also give rich
source of further interpretation on access of children of different income deciles in thePhilippine to education at lower levels, which basically support the conclusion of highenrolment rate of poorest income deciles in both urban and rural areas in 1988 byBalisacan and the school attendance rate is higher in urban than rural. In 2000, therewas some deterioration in enrolment rates to basic education for poorest deciles.Between 1988 to 2000, while school attendance at primary level has remained thesame for all income deciles, it has reduced slightly for the three poorest groups and itaffected both rural and urban settings. Moreover, in taking a closer look at therural/urban contrast, one can see that the situation is even worse in the urban than therural area. In the urban, the reduction of school attendance in elementary education isoccurred more frequently and covered a larger scope affecting the first four decilesaffected while in rural areas the reduction has affected three deciles viii.
Orbeta (2002) has pointed out that children of lower educational backgroundfathers did not climbed well the educational ladder compared to his father. This isseen in the unchanged distribution of college graduates by educational background of their fathers between 1978-1995 and tendency that children of high-paid professionfathers continue to capture occupation of their fathers, while children of the poor donot show the tendency getting out of low-educated traps of their father.
By classification on poor and non-poor, using data 1998, Manasan (2001) hasshown the conclusion that the poor has much lower access to education compared tonon-poor and the disparities become wider when education level get higher. However,
poor male tend to suffer more inadequacies in access to education than any other income group.
According to table 13, access to elementary, secondary and higher of both sexesis is 85.97%, 53.46% and 11.94% for the poor and is 92.46%, 74.15% and 30.54% for non-poor. Sex disaggregated data on the other hand, show that for the poor females,the rates are 86.78%, 62.24% and 15.44%, respectively. While for the non-poor females the rates are 92.4%, 77.56% and 34.21%. In comparing the access of poor males and poor females to education it is evident that the males receive lesseducation. In the three levels of education the rate for the poor males who receiveeducation are 85.21%, 45.85% and 9.8% respectively, while the rates for the non-poor male are 92.43%, 70.95% and 27.19%, respectively. The poor males have the lowest

8/3/2019 HRD Poverty in the Philippines
http://slidepdf.com/reader/full/hrd-poverty-in-the-philippines 11/44
9
educational participation rate at all levels, which shows a severe lack of adequateaccess to education.
Although there are about 9% of total enrollment of elementary education in private schools and 21.14% of total enrollment of secondary education, the poor go to public school. In 1998, 98.01% of students from poor household aged 7-12, 90.93%aged 13-16 and 68.7% aged 17-24 go to public schools. The poor population of students make up 61.1% of public elementary school attendees and 49.1% of publicsecondary school attendees (Table 14).
Unlike in many other countries, where the reasons for large gaps in access toeducation between poor and non-poor is that the poor tend not go to school at all, inthe Philippines the main reason is low survival rate or high drop out rate of poor children.
This conclusion is supported by works of different authors using data fromvarious years, showing that while the poor and non-poor have almost the sameeducational participation rate at lower educational level they tend to differentiate after some years in school. Filmer and Pritchett (1998) using date from 1993 NationalDemographic and Health Survey, as cited from Manasan (2001) shows that Filipinos
aged 15-19 in the middle and the riches third of the asset distribution profile tend toattain a Grade 6 education before their participation begins to drop off so that over 70% complete high school. In contrast, those in poorest third of the families start todrop out in the second grade with their participation falling steeply thereafter. Thuswhile over 70% of children belonging to the former complete high school, only 40%of latter do so.
Manasan (2001), using data 1998 Annual Poverty Indicator Survey also showsthat it is mass drop out rate at early school years and at later school years makes thedifferences in the educational participation rate of poor and non-poor in thePhilippines. The educational attainment profile of population 7-24 show that there isalmost no differences in proportion of children from poor and non-poor go to grade 1
but for grade 2 some difference has been observed albeit small where 98.2% childrenfrom poor household complete grade 2 while 99.7% of children from non-poor household go to grade 2. However, while 82.6% of children from poor household areable to complete grade 6, 95.5% of children from non-poor households do so.Furthermore, close to three-quarter of children from non-poor households are able toobtain a high school diploma compared with only 40% from poor households ix.
Across the regions in the country, mass drop out of school for children from poor household started as early as grade 2 in Eastern Visayas and Western Mindanao, andat grade 3 in Central Visayas, Southern Mindanao, Northern Mindanao, ARMM andCARAGA. Central Luzon and National Capital Region shows the mass drop out rateat later school years, at grade 6.
Analysis of school leavers profile has shown that in 1998, 8.5% or 1 million
children at age 6-12, 18.1% or 1.2 million children at age 13-16 and 62.37% or 3.4million children age 17-24 were out of school, most of which belong to poor. 81.25%of school leavers at aged 6-12, 68.69% of school leavers aged 13-17 belongs to the
poor. In all age groups, school leavers who are poor have highest share, accountingfor 12.4% in the total age cohort 6-12, 24.8% in the total age cohort 13-16 and73.98% in the total age cohort 17-24 compared to 3.79%, 11.36% and 55.4%respectively for non-poor. It is worthy noting that the differences are so large for theage group 6-12 as percentage of age cohort, where the rate of school leavers of poor ismore than 4 times higher than that of non-poor. Among all school leavers in given age

8/3/2019 HRD Poverty in the Philippines
http://slidepdf.com/reader/full/hrd-poverty-in-the-philippines 12/44
10
groups, poor school leavers at age group 6-12 have the highest share, accounting for 81% while the non-poor accounts for only 18.75%. Among school leavers at agegroups 13-16 and 17-24 the poor accounts for 68.69% and 44.25% respectively andthe non-poor accounts for 31.31 and 55.75% respectively x.
More insights on sex perspectives of school leavers show that poor male tend todrop out more than poor female or any other income group at given age cohort. This
point again supports the earlier given statement that poor male tend to suffer moresevere inadequacies in access to education than any other social group.
Poor male have the highest proportion of school leavers both as percentage of given age cohort and as percentage of total number of school leavers at given agegroup. The share of male school leavers who are poor accounting for 13.1% of cohort6-12, for 31.58 % of cohort 13-16 and 78.5% of cohort 17-24, is higher than the shareof poor female that are 10.91% of cohort 6-12, 16.96% of age cohort 13-16 and72.16% of age cohort 17-24 and is much higher than the share of male non-poor andfemale non-poor which are 4.09%, 13.96% and 65.25% and 3.48%, 8.64% and60.17% respectively for age cohort 6-12, 13-16 and 17-24 respectively. It is also themale poor has the highest share of total school leavers in given age group which
account for 45.41%, 46.88% and 26.27% of age group 6-12, 13-16 and 17-24respectively compared to 35.84%, 21.80% and 19.01% respectively for female poor,10.42%, 19.84% and 34.26% respectively for non-poor male and 8.33%, 11.54% and28.89% respectively for non-poor female xi.
Broadly, the analysis on drop out rate at grade levels supports the statementsabove that poor tend to drop out more than non-poor and poor males tend to drop outmore than poor females. It also show that there is some exception. At grade 2, poor females drop out more than poor males, registering the highest of drop out among allincome-sex group. At the third year of high school, non-poor dropout more than poor due to non-poor female drop out more than poor female xii.
While the direct cause of the poor people’s lack of education is the poor survivalrate or high drop out rate in the early years of school attendance, it should be notedthat the factor behind the high is the high cost of education which is impossible for the
poor to afford without sacrificing their basic needs. This point is drawn out bydifferent works using data of different survey years.
WB (1996) using the data from survey 1992 on 30% lowest income populationshow that high cost of education and working/looking for work are prominent reasonsfor leaving school and the percentage of respondents for these reasons have increasedfast with older age group, particularly for male. Working/looking for work is thereasons for leaving school of 11.4% respondents aged 7-12, 31.1% respondents aged13-16 and 55.4% respondents aged 17-24. Lack of interest was the first reason of leaving out of school.
Analysis of the causes of school drop outs by Manasan (2001) also show that for
poor children economic reason including high cost of education and working/lookingfor work make important reasons for dropping out of school. High cost of educationranks second among reasons for leaving school after the reason of lack of personalinterest for poor children. 14.19% of children aged 6-12, 31.36 % children aged 13-16and 27% of children aged 17-24 among poor school leavers reported the main reasonfor dropping out of school is high cost of education compared to 8.94%, 24.56% and18.42% respectively for non-poor.
In the two surveys, it is the student’s lack of interest that stands out as the primary reason why students leave school. And this lack of interest is the results of

8/3/2019 HRD Poverty in the Philippines
http://slidepdf.com/reader/full/hrd-poverty-in-the-philippines 13/44

8/3/2019 HRD Poverty in the Philippines
http://slidepdf.com/reader/full/hrd-poverty-in-the-philippines 14/44
12
In developing countries, it is quite common that the kind of education that itsgovernment provides its citizens is of poor quality. In the Philippines this is notalways true. It would be incorrect to say that the Philippines education system
provides low quality of education because a large number of Filipinos who werelocally educated are working outsides of the country. An indication that the educationthey received is good enough for them to globally compete in the international labor
market.In 2004, overseas Filipino workers accounted for 10% of total country’s
population, the highest share in the world xiv. Although, the largest number work asdomestic helpers, many of them work as professionals. Only globally competitiveeducation system produces graduates who can qualify in the overseas labor market.However, in reality when closely examined, only a part of the education system can
provide high quality education, which is administered mainlhy through privateeducation institutions. And this quality education is very expensive even for themiddle class Filipinos. Those that are provided through public education institutionsmaintain high standards thus they are very strict in their admission of students thatmore often than not only those who have previously received high quality educationcould qualify. Other schools that do not fall under the category mentioned above offer cheap, low quality education which the poor Filipinos receive. These schools areeither privately owned or run by the government. The poor have little choice but toreceive this kind of education which is the only one available for them. Indeed, veryfew from the poor sector are fortunate enough to pass the screening exams of publicschools offering high quality education.
The clear segmentation on education between poor and rich can be seen in theways of household spending for education. Between 1988 to 2000, the differences inhousehold spending for education between the richest and poorest income deciles has
been very large and in an increasing trend. In 1988, on the average, a household in poorest quintile spend 181 peso for education, while a household in richest quintilespent pesos 3,412, that was 18.8 times higher. In 2000, on the average, a household in
poorest quintile spend pesos 713 for education, while a household in richest quintilespent pesos 19,855, that was 27.8 times higher xv.It seems that the problem of low quality of education has been experienced for
more than a decade now. Efforts during the 1990s and 2000s were done to addressthis problem which is affecting the marginalized poor in the country. Balisacan(1994), cited from World Bank 1988 that the high quality of education in primary andsecondary public schools is yet to be attained. He showed that in mid 1990, high-quality primary education was limited to less than 10% of total elementary education,mostly in private schools in Metro Manila. Work by Tan (1999) has supported thesame finding on the kind of education that the poor receives by presenting high dropout rate, high segmentation in educational service and poverty in education xvi.
Poverty in education is an indication of both consequences and evidences of thefact that the poor in particular suffer from a low quality education. By Philippineconception, the head-count education poor is the working-age population who reachedgrade 5 and those who complete Grade 6 but failed in the National ElementaryAchievement Test (NEAT) which is the product of failing rate in the NEAT and the
percentage of working-age population who completed Grade 6. If the passing score isas low as at 57 right out of total 160 answers as given by Department of education,Culture and Sport (DECS) the passing rate of examinees was 69,8% . If the passingscore is as high as of 80 right out of 160 answers, the passing rate fell down to 37,4%.

8/3/2019 HRD Poverty in the Philippines
http://slidepdf.com/reader/full/hrd-poverty-in-the-philippines 15/44
13
The poor performance have raised the incidence of poverty in education, which was,according to Tan (1999) 27,6% in the case of the lower passing score and 34,4% inthe case of higher passing score given above.
As analyzed above, the poor have no choice but to go to public schools offeringlow quality education, therefore they are eternally trapped in poverty. As shownabove, most of poor students go to public schools and a large proportion of publicelementary and secondary students come from poorest quintiles. Children of poor household accounts more than 60% of public elementary students. In some regionssuch as Mindanao, the poor children accounts for even higher rate, at 74.5% xvii . At thesame time, the analysis on mean percentage score of NEAT and National SecondaryAchievement Test (NSAT) by types of institutions show that public schools tend togive lower score compared to private schools for the whole period from SY 1993-94to SY 2000-2001. The data on NEAT and NSAT show that average score of NEAT
by private institution higher than public institutions and there is no sustainabletendency of narrowing. In SY 1993-1994, NEAT by private institution was higher than that by public school 1.28 times and then increased to 1.3 times in SY 1994-1995and decreased to 1.21 times in SY 1995-1996 then increased again to 1.32 times inSY 1996-1997 and decreased again to 1.24 times in SY 1997-1998 and againincreased to 1.27 times in SY 1998-1999. However, from SY 1998-1999 to SY 2000-2001 it started to fall rapidly so that in period of SY 1993-1994 to SY 2000-2001, thegap in NEAT by private and public elementary school has been reduced considerably.For the NSAT the situation is better in the ways that although the private institutionhave higher average score, the disparities tend to be reduced upon the time, from 1.3times in 1994-1995 to 1.11 times in SY 2000-2001 (Table 16).
The situation of lower quality education provided by public schools compared to private schools can be also seen in the differences of cohort survival rate of both typesof schools. Cohort survival rate is an important indicator of education quality becauseit shows the internal efficiency of each type of education. Cohort survival rate of
private schools is sustainably higher than public schools in both elementary and
secondary education for the whole decade of 1990s, ranging from the highest of 1.44times in 1990-1991 to the lowest of 1.21 times in 199-2000 for elementary educationand from the highest of 1.21 times in 1997-98 to the lowest of 1.05 times in 1990-1991 for secondary education xviii .
Class size is another weakness of the public sector compared to the private sector.Average class size of 45 and 50 pupil respectively in primary and secondary publicschool is significantly higher than average student/teacher ratio 36 in both theelementary and the secondary levels in the school year 2000/2001.
The Filipino Report Card on Pro-poor service (WB 2001) also shows that theclient rating of public and private elementary schools reports the superior ranking to
private schools compared to public schools in terms of the quality of education, particularly class size, facilities and textbooks. However, this does not mean thatclients of private schools are fully satisfied with the service provided to them. Themain issues for unsatisfaction of clients of private elementary school is tuition fee andschool location.
An interesting observation by WB (1996) that across the regions of the country,the poorer the regions the larger the differences in cohort survival rate and test results
between public and private basic educational institutions, which reveals regionalquality differentials are larger among public than among private schools. In other words, the poor receives a lower quality basic education, not only because he attends

8/3/2019 HRD Poverty in the Philippines
http://slidepdf.com/reader/full/hrd-poverty-in-the-philippines 16/44
14
a public school but also because the quality of public school is comparatively lower inthe poorest regions.
Regional differences in quality of education is also evidences in differentiatedcohort survival rate, mean test scores at NEAT and NSAT as well as the education
poverty indicator according to regions where the richer regions tend to get better results and the poorer regions get the lower indicators. Cohort survival rate tend to below in poorest regions in Mindanao and it was lowest at 29.3% and 32.3% for elementary education in 1996-1997 and 1999-2000 in Muslim Mindanao, while therate was high in richer regions such as National Capital Regions, Ilocos and CentralLuzon.
The average mean percentage scores by regions 1998 show the same tendencywhere the poorest achievements found in poorest regions to Mindanao. EasternMindanao, central Mindanao and Muslim Mindanao took the last ranking of 14, 15and 16 among 16 regions for both NEAT and NSAT. While the highest achievementsfound in NCR and Eastern Visayas with the ranking of 1 and 3 for both NEAT and
NSAT xix.The phenomenon of quality gaps among regions and particularly among public
schools according to regions essentially related to the inequitable distribution of essential educational inputs, both qualitatively and quantitatively, among the variousregions and between rural and urban areas.
The way of government spending on education create some negative affects onquality of public education and have non-poor bias.
Thus the share of basic education in central government education expenditureslipped from an average of 81.3% in 1990 to an average of 78.4% in 1991-1996 andwithin the shift to universal access to secondary education, government spending on
primary education has decline and not most relevant to the poor. As shown in thesection 2, the poor tend to drop out more and early even before completion of grade 6,
but government spending declined to elementary education. This practice was verymuch contradictory with efficiency and equity consideration. Estimates of socialreturns on investment show that the return on elementary education is nearly doublethat of secondary or higher education.
Although there was an increase of the total government expenditure on educationand regain xx of the share of elementary education in total government expenditure oneducation after the decrease in early 1990-1996, some problems in governmentspending still have non-poor bias. It is the composition of government educationexpenditure that related to educational inputs has decreased such as maintenance andother operating expenditure (MOOE) and capital outlay. In period 1990-2001, theshare of MOOE in budget of Department of education (DepEd) has dropped from16.5% to 8.3% and capital outlay has dropped from 9.2% to 1.1%. Furthermore, per student MOOE in the DepEd (P475) in 2001 was just about half of level of 1990
(P876). This squeeze on MOOE has resulted in the short supply of key educationalinputs like textbook, teaching/instructional materials, science laboratory equipmentand supplies, school deck as well as for teacher training and school buildingmaintenance. Textbook situation is in a very much critical where average per pupilMath textbook ratio has reduced from 0.60 in early 1990s to 0.33 in 1999 or one book for three pupils xxi. The decrease in MOOE and capital outlay was due to an excessiveincrease in the payment for personal services related to increase in salary for teachersin public sectors xxii .

8/3/2019 HRD Poverty in the Philippines
http://slidepdf.com/reader/full/hrd-poverty-in-the-philippines 17/44
15
Government expenditure on education comprises of two elements: centralgovernment expenditure and local government unit (LGU) expenditure. While centralgovernment expenditure was pro-personal service at expense of MOOE and capitaloutlay, LGU expenditure tend to have some supplementary effects with the mainresponsibility for the construction and maintenance public schools according to LocalGovernment code 1991. In fact, LGU spending on basic education is more evenly
personal services, MOOE and capital outlays, which were 28%, 33.8% and 38% onaverage, respectively, in 1992-1995 xxiii
However, LGU expenditure depend on Special Education Fund (SEF) whichconsists of 1% tax on assessed values of real properties and is sensitive to the wealthystatus of each local unit. Real property values are typically higher in the moreurbanized areas and therefore SEF is higher in cities. Thus although cities account for only 25% of population, they contribute 64% of total LGU spending on education.Income of SEF across regions of the country is also different, where the SEF income
per resident pupil appears to be co-variant with average per capita household income,for example, ARMM, Western Mindanao, Bicol, Western Visayas and Cagayan Valeyregister the lowest SEF income per resident pupil in 2000. Thus the same regions arealso among those with lowest average household income in 2000 (Table 17).
All these mean that complimentary effects of LGU spending for centralgovernment may be apparent only in municipal settings and richer regions where SEFtend to get higher sources and it may low or ignorant in rural poorest regions. In turn,this point reveals that government spending negatively affect quality of educationmore severely in rural poorest regions and it support the above saying that the way of government spending has a non-poor bias.
4. SITUATION OF THE POOR IN LABOR MARKET4.1 . State of arts of Philippine labor markets
The Philippines labor market in 1985 to 2003 period is characterized by an
excessive labor supply, inadequate job generation and high unemployment andunderemployment.From supply perspectives, the Philippines labor market has recorded a relatively
high growth on both working age population and labor force participation comparedto other countries in the regions in period 1985 to 2003. The growth rate of workingage population was as high as 2.5%-2.7% in the 90s as a result of high populationgrowth rate. The Philippines has a high annual growth rate of labor force and labor
participation rate. Labor force participation rate of the Philippines, is although lower than her neighbors such as Thailand, has increased in period from 1985 to 2003, from63.9% to 67.1%, respectively. This positive change in the Philippines labor force
participation rate is due to the increase of female labor force participation from 1985to 2003, which is 47.9% in 1985 and 51.1% respectively xxiv .
Working age Filipinos are generally well educated. Data from Orbeta (2002)support the finding that among working age population, more than one third havecompleted high school or higher in 1995 and the average year of schooling haveincreased fast from 6.4 in 1980 to7.9 in 1995. At the same time the share of somecollege education and college graduate has grown considerably in the said periodfrom 16.2% in 1980 to 20.8% in 1995.
However, from the demand side, the situation is less brighter. The overallemployment in the country has a slow growth with average annual growth rate of

8/3/2019 HRD Poverty in the Philippines
http://slidepdf.com/reader/full/hrd-poverty-in-the-philippines 18/44
16
2.3% in the 90s as compared to that of 3.7% in the 80s. And this is also slowcompared to growth rate of labor force. This situation explains for highunemployment rate in the country, which has increased from 7.1% in 1985 to 10.1%in 2003 and is higher than that of most of her neighbors (Table 4).
Furthermore the slight growth of employment just is mainly attributed to lowvalue-added services. In between 1985-2003, the share of industry employment hasnot changed much while agricultural employment has declined considerably from49% to 37.1%. It is the service sector that has carried the burden of absorbing recententrants to the labor force and from the second half of 1990s, the service sector has
become the main source of employment for the country, providing 46.7% totalemployment (Table 18). However, the more disaggregate analysis on employment onservice sector has shown that the largest employment composition in service sectorsare community, social and personal services and the whole sale and retail trade, whichhave increased from 17.2% to 20.3% and 13.2% to 16.5% respectively in period1985-2000. Transport, storage and communication have also increased from 4.7% to7.3% during the same period. It is worthy noting that all the above three compositionsof the service sector are more likely the low values- added service. It is only a highvalue-added services sector - finance, insurance, real estate and business services havenot risen its employment as fast. What it means from the analysis is that, the growth inthe service sector employment in the Philippines for the last 15 years is more likely anindication of a growing informal sector induced by growing labor force that is unableto find adequate employment in agriculture and industry sector. It seems that lowquality of employment and underemployment are very common in the Philippinesservice sector.
Even proportion of labor with college education has high share among bothunemployment and underemployment. Among the unemployed, the proportion of college educated was as large as 39.5% in 1985. The rate has decreased to 31.55% in2000, which was still relatively high. Among underemployed, the proportion of highschool graduate has been increased from 13.1% in 1985 to 20.9% in 2000 while the
proportion of college graduate did not change much, hovered around 5% to 7%xxv
.Urban and rural labor markets are in an inverse relation towards unemployment
and underemployment. In general for the Philippines, while urban labors are moreheavily affected by unemployment phenomenon the rural counterparts areencountered mainly by problems of underemployment. In 2002 at July, theunemployment rate in the urban area was 13.2% compared to 7.3% in rural areas,while underemployment rate in urban areas was 13.4% compared to 20.2 % in ruralareas xxvi . In 2002, 62.8% of the unemployed were found in rural areas xxvii
Thus, the stagnant demand in the Philippine labor market in period of 1985 to2003 is very much due to the industrial structure and industrial and labor policies inthe country in the said period, which was geared toward escaping from labor-intensivedesign.
Since 1986, the Philippines economy is within the period of active tradeliberalization and globalization xxviii . However, it seems that globalization and tradeliberalization brought about capital-intensive industrial structure to the country.Within industrial structure, manufacturing, is commonly considered as the main
provider of employment with adequate quality has even decreasing importance in theeconomy, which has reduced its share from total output from 23.9% in period 1986-1989 to 22.2% in 2000 and 23.1% in 2003. The Philippine manufacturing sector contributes to a smaller share of only 21% of GDP compared to that of 25% in

8/3/2019 HRD Poverty in the Philippines
http://slidepdf.com/reader/full/hrd-poverty-in-the-philippines 19/44
17
Indonesia, 29% in Thailand and 34% in Malaysia in 1997 xxix . Furthermore,manufacturing employment is stagnated for the whole period, from around 9.7% in1985, rising slightly to about 10% in the 1990s and before it dropped again to 9.65%in 2003.
It should be noted that manufacturing structure in the Philippines is changingtoward a decline in share of labor intensive industries (food, textile, apparel, wood,
papers) from 56% in 1988 to 49% in 1994. Correspondingly, there is a rise inimportance of capital intensive industries such as chemicals, metals and machineryindustries, the share of which has increased from 43% in 1988 to 50% in 1994 xxx
Philippines labor policies are very much pro-employed with an expensivedismissal and wage practices. In difference to practice in other countries, wheredismissal is the agreed process between management and employees, in thePhilippines, dismissal decision can be made only with the permission of governmentin face of Department of Labor. As for wage issues, the Philippines practice requiresnot only minimum wage but also 13-month pay, which was made regular since1987 xxxi .
Thus expensive labor practice is one of a considerable reason leading to capital-
intensive industrial structure.In the absence of labor-intensive industrial structure, job generation by industries,
particularly manufacturing sector, which is commonly the expected destination for surplus agricultural labor during industrialization, is very limited. This situation isclearly evidenced in employment by sectors in the Philippines economy, where within
period 1985-2003, employment in industry has very small growth and that growth islargely due to the reduction of employment in 1985 rather than due to increase in later
period. Employment by industry in 2000 stood at the level of 1980 (Table 18).
4.2.Situation of poor in labor markets: low incomeIt is obvious that the low income situation makes people poor economically. And
it is sad to note that the poor have worse income situation, which can not help them toafford better quality of education and other needs. In the Philippines, there is a largegap in income between the poor and non-poor. The following analysis on averageincome and share of income deciles in the Philippines may provide some insights inthe income situation of the poor. Average in income of a family in lowest incomedecile was P. 6,273 in 1985 and increased to P. 24,309 in 2000. However, if one is tomake a comparison to the highest income decile, the gap has widened. As table 19shows, the ratio between the average income of the highest decile to the lowest decilewas 18.037 times in 1985. It has decreased to 17.745 time in 1988 before it increasedto 20.638 times in 1991. In 1994 it decreased to 18.9 times and decreased muchfurther down to 16.697 times in 1997. However, an increase was recorded in 2000 to arate of 22.757 times. Although in 1997, the gap in average income between the
poorest and richest income deciles has been narrowed, the share of the poorest incomedeciles was so low as 1.7% compared to 2% in 1985. At the same time the average
per capita income of the poor and non-poor also support the same tendency of largegaps in income between poor and non-poor. In 1998, average income per capital of
poor was approximately 5.5 times lower than that of the non-poor (Table 6).The relative worse off income situation of the Philippine poor is due to three
main factors. First , while the poor have mainly access to basic education, the labor market outcome show a low effect of basic education on income and wages. Second ,

8/3/2019 HRD Poverty in the Philippines
http://slidepdf.com/reader/full/hrd-poverty-in-the-philippines 20/44
18
while the poor have low access to higher and vocational education and tend to beunskilled labor, the labor market was gearing toward a degradation of situation of unskilled. Third , low quality of employment and underemployment is closelyassociated to the poor.
Low effect of basic education on income and wagesEffects of education on income and wage are usually seen through rate of return on education. Since the 1960s a large number of efforts have been done oncalculating social and private rate of return on education of various countries in theworld xxxii . As for basic education, a general pattern of estimates in the world is thatrate of return are higher for primary education compared to secondary and higher education especially for low income countries and rates of return tend to decreaseaccording to the level of development considering the diminishing return to humancapital formation by level of development.
As for the poor, they tend to benefit largely from higher private rate of return on basic education, particularly elementary education and from higher social rate of return on education in overall, considering higher positive flowing effects. This must
be also true for the Philippines case considering that the poor’s access to education ismainly associated to basic education, particularly elementary education.
However, the rate of return on education in the Philippines has exhibited anuncommon behavior, inducing relative worse off situation for the Philippines poor toone of other countries by having a comparable pattern to that of high income countriesalthough being classified as a middle income nation. What worthy noting here is thatrate of return on education of the Philippines, particularly that of basic education tendto be lower than other country of the same development stage. As can be seen in table20, Philippines have the social rates of return on education comparable to that of highincome country, which is very much lower than one of middle income countries. Asfor private rate of return on education, the Philippines even demonstrate lower rates
compared to high income countries, its picture look more similar to that of top highincome countries of OECD, which is lowest among all countries in the world. Intalking about rate of return on education, one may feel sensitive with problems of capturing “full” effects of education because it is a bottleneck of works on humancapital calculating, for example externalities effects in computing social rate of returnon education. However, this kind of capturing is more meaningful for considering therate of return itself, for comparison among countries, or even among education levels,it has little meaning because if there an underestimate, it is for all cases.
From the perspectives of rates of return on different levels of education, thesituation is also seems not towards pro-poor bias. Evidences from the Philippineshave shown that return to each year of education in the country is lowest for elementary schooling and highest for higher education. The wage and income gaps
between labor with different education level have increased along to education ladder.This situation is evidenced for both wage sectors and entrepreneurship sector. For thewage sector, rate of return to each year was 2.3% for elementary schooling, 3.5% for the secondary level and 6.4% at college level. The differences in wage betweenemployees who is elementary graduate and who has no schooling is 13.8%, betweenwho is high school graduate and elementary graduate is 14% and between who iscollege graduate and high school graduate is 25.4% compared to one withoutschooling. The wage differences become very large when compared the employee

8/3/2019 HRD Poverty in the Philippines
http://slidepdf.com/reader/full/hrd-poverty-in-the-philippines 21/44
19
with no schooling and with college graduation, that is as large as 53.4% (13.8% +14% + 25.4%) xxxiii .
Work of Schady (2001), computing rate of return on education for men in wagesector based on data from 1998 Annual Poverty Indicators Survey has also broughtthe similar results that show the wage premium is smallest for primary education,slightly larger for secondary education, and much larger for tertiary education.
For the entrepreneurship sector, the differences in income according to educationladder are even larger and the low educated labors who are more likely to be poor suffer worst experiences. Compared to household heads with 0 to 5 year of elementary schooling, income of family with household heads having elementarygraduation is 8% higher, income of family with household heads having uncompletedhigh school education is 13% higher income of family with household heads havinghigh school graduation is 23% higher, income of family with household heads havinguncompleted higher education is 42% higher and income of family with householdheads having college graduation is 81% higher xxxiv .
Another point negatively affecting the Philippines poor from the point of view of rate of return on education is that while Philippines poor tend to drop out of school
before completing the last school year of each education level, while evidences fromthe country show that the private rate of return on the years leading to completion of school tend to be much higher compared to years in uncompleted cycles.
Schady (2001) has shown that the completion year of school gives higher wage premium to wage male labor compared to years before completion by arguingsheepskin effects. Although, within three levels of education, sheepskin effect islowest for primary education and largest for tertiary education, in overall, sheepskineffects are significant for all educational level. The significance of sheepskin effectsmay imply the signaling hypothesis in hiring practice in labor markets where theemployer tend to employ and pay labor according to factors that give the signals of
being productive rather than to his or her real productivity. Although the author of thiswork has acknowledged that the data used for analysis is of 1998, the year of EastAsian crisis and El Nino and might not be a representative year to study therelationship between wage and education, it seems that the results are representative,considering that other work using other data sources brought to similar conclusions.
Similar conclusions on higher return on education of large year of giveneducational level is produced in Gerochi (2002), using data of 1988, 1990 and 1995.For primary education, private returns of each of two last years leading to graduationare much higher than each year in incomplete school cycles (4 years), which are10.75%, 11.3% and 12.7% respectively compared to 5.42%, 7.5% and 4.3%respectively. For secondary education, private rate of returns of each of two yearsleading to graduation were 10.3%, 15.1% and 12.55% respectively, significantlyhigher than private rate of return to each of two years in incomplete cycles that were
6.7%, 3.6% and 4.6%. For college educations the indicators are 8.6%, 10.25% and12.25% compared to 6.3%, 5.4% and 5.3% xxxv .
Deterioration of income situation of unskilled laborAs mentioned in section 3, the poor have inadequate access to basic education
due to early drop out and high dropout rate. However, the lack of access of the poor totertiary education is even more severe. There is a big gap in the participation rate intertiary education between poor and non-poor. In 1998, while the participation rate of

8/3/2019 HRD Poverty in the Philippines
http://slidepdf.com/reader/full/hrd-poverty-in-the-philippines 22/44
20
non poor was 30.54%, that of the poor was only 11.94%, just slightly more than onethird of the rate of the non-poor. The low participation rate of the poor is evident in
both components of tertiary education, such as vocational training and higher education (Table 6).This situation according to income deciles even become worse intime, when the participation rate gap between the richest and poorest deciles increasedfrom 17.4% in 1988 to 21.4% in 2000. While the urban - rural gaps in participation
rate to tertiary education has always existed where the urban areas are more in themore advantage position, the gap between poorest deciles in urban and rural areas onthe other hands has narrowed from 1988 to 2000. Moreover, it is worthy noting thatthe urban- rural gap has narrowed not because of the faster increase in the rural
participation rate, but much more due to the considerable decrease in participationrate of the poorest urban decile xxxvi .
There are several reason of the lack of the poor access to higher education. First itis an obvious outcome of inadequate access to basic education. Second, higher education in the Philippines is dominantly provided by private sector, which largelydepends on high tuition fees for financial resource. As a result tuition fees are sometime even unaffordable for non-poor not say about the poor. Third, although educationis highly valued by Filipino, rich and poor alike, there is a widespread and growing
perception that education no longer guarantees a job with decent wage. This perception of the reality in labor markets may create adjustment of the poor departfrom the thinking that education is a means to get a good job and just escape poverty.
With the poor access to skill and professional trainings, the outcomes of the poor in labor markets seem not very bright. Much of the poor belong to unskilled labor class in the labor markets.
The Philippine economy in late 1980’s and 1990s has been opened toglobalization. This has also opened some employment opportunities to someFilipinos. However, the gain is far from being fair considering the gains that resourceowners got and that of the labor force they hired. It seems that the unskilled labor force who came mostly from the poor sector benefited the least in the process.
Various studies have pointed out that the Philippine economy was doing well insecond half of 1980s and 1990s before the Asian crisis hits. It is that there was a slightreal wage increase and labor market become more tight with labor supply xxxvii .However, it seems that the positive trend of real wage rise has resulted no or littletrickened down benefits to poor, rather it produces cost for the economy by losingnational competiveness in the international markets in case of rising real wagecoupled with stagnant productivities.
Another study shows that with the improved situation of the Philippine economyin late 1980’s and 1990’s, every resource owner including owners of labor resourceshave gained but the gains are with great differences. Within labor resource owners,the differences are found according to education stock of wage earners. The analysis
by Leonardo A. Lazona, Jr. (2002), using industry panel data taken for period 1989-1995 in the Philippines show that globalization has caused an increase in the incomesof all resource owners, but the increase in the return to unskilled labor had been lower than the other factors. From the study it is also shown that there are significant wagedifferences between the highly educated and the poorly educated families, suggestingthat education is a crucial factors in the determining the rate of wages. Theimprovement from 1991 to 1995 when globalization was operative, was greater for the highly educated families than their the poor ones. Those poor groups that are

8/3/2019 HRD Poverty in the Philippines
http://slidepdf.com/reader/full/hrd-poverty-in-the-philippines 23/44
21
lucky enough to have a job in the formal sector can get their share of benefits but justrelatively low compared to better educated laborers.
Nevertheless, the analysis on the product of sub industry level in Leonardo(2002) shows the severe degradation for urban unskilled laborers compared to other groups. They really fall down of the working ladders. The research shows thatunskilled labor in the few agriculture-base industries obtained higher incomes than theother resource owners because of increased TFP, particularly since 1993. For manufacturing- based industries, however, capital and skills labor share haveincreased steadily while valued added of unskilled labor has decreased.
Underemployment and low quality of employmentIn contrast to common picture of developed countries where the poor may
associated to unemployment, the situation in the Philippines is that the poor do nothave high representation among non labor force and unemployed, rather the poor hasassociated strongly to low quality of employment and underemployment. Of almost16 million working-age people who were not in the labor force in 1998, 81 percentcame from the non-poor, while only 19 percent were poor. And of the 2.5 millionunemployed in the same year, only 17 percent came from poor household; the restwere not poor xxxviii . College students are an important example; they are not in thelabor force and also less likely to come from poor households. Upon graduation, theyactively seek work and make up a large portion of the openly unemployed. Besidescoming from mostly non-poor households, part of the reason those with higher education attainment tend to be unemployed . One point can be noted that the poor and non-poor classification used in PHDR 2002 is one by Balisacan (1999), based onconsumption poverty threshold. Although this classification may produce somedifferences in statistics compared to the classification based on income, but the gapmay not as large such can change the picture of non-poor dominance amongunemployed and non labor force.
Broadly for the whole country of Philippines, the quality of employmentopportunities seem to be low, as indicated by the share of manufacturing employmentto the total, which is lower than other ASEAN countries (Table 22). In 1985, the shareof manufacturing employment of the Philippines was almost the same level withIndonesia and higher than Thailand, 9.7% compared to 9.2% and 7.9% respectively.In 2003, the share of manufacturing employment of the Philippines stood at the samelevel to 1985, at 9.65%, while that of Indonesia was 12.0% and of Thailand was14.6%. The share of manufacturing employment can be used as a proxy for the formallabor market where wage and salary employment is norm. Income of owned-accountworkers and self-employed who are mostly in agriculture and service are lower thantheir wage counterparts largely because the farmers and street vendors who are ruraland urban poor have very little physical and financial resources. Marginalized people
coming from fishing, farming or any other poor house-holds lack of educationalopportunities and often enter the labor force at early age do not have adequate time,resource and human capital accumulation to compete with non-poor better educated
people for a limited number of well-paid jobs in the formal sector.The relative worse off situation of the poor can be seen in situations where the
poor have higher presentation among low paid class of workers and higher presentation in underemployment due to low educational stock.

8/3/2019 HRD Poverty in the Philippines
http://slidepdf.com/reader/full/hrd-poverty-in-the-philippines 24/44
22
The non-poor tend to associated with regular job with salary and wage while the poor tend to associate with self-employed and unpaid family workers. A larger proportion of the non-poor (51 percent versus 40 percent for the poor) is involved inregular jobs with wages and salaries. On the other hand, the poor are more likely to beemployed as unpaid family workers (19 percent versus 12 percent for the non-poor) or to become self-employed (41 percent versus 37 percent ) xxxix . One hardly needs to
note, that the meaning of “self-employed” varies greatly, as between a subsistencefarmer or itinerant vendor, on the one hand, and a plantation owner or a taipan, on theother.
While the poor have inadequate access to education as can be seen from previoussections, and therefore have limited education stock, the education capital is importantindicators of being underemployed in the Philippines labor markets.
Table 23 shows the average underemployment rate (the share of people wantmore works) in 2002 was 17.0%, all elementary undergraduate and graduate and highschool undergraduate have the higher than average underemployment rate, whichwere 21.3%, 19.7% and 19% respectively. Just only who have better educationalstock of high school graduation and college education have the lower than average
underemployment rate. However, it is also interesting to note that underemploymentrate is not as high among no grade as elementary education. It is more probably that people with no schooling tend to be poor and have no choice than work full or evenmore full time for meeting two ends
Contrasting poor and non-poor status, it is shown that among visiblyunderemployed (people who work less than 40 hour a week wanted additional hoursof works) was 17% of the poor and 11% for the non-poor xl
As shown in figure 3, there is a degree of correlation between poverty incidenceand underemployment when the two lines on poverty incidence and onunderemployment go up and down hand in hand with each other. In regions withlower poverty incidence, for example NCR – 11%, the underemployment rate tend to
be lower – 4%. In regions with higher poverty incidence, for instance region V- Bicol – 61.9%, the underemployment rate is also higher – 21.6%
Esguerra and Canlas (2001) as cited from De Dios (1999) show that the rise inunderemployment in recent years came from the services sector where many wageand salary workers as well as own-account workers expressed the desire to work morehours. Underemployment was also found to be quite significant among in agriculture.These findings tend to support the view that the increased shares of the services sector leave much to be desired in terms of quality. What worthy noting is that the poor tendto associate with this low value-added sectors which is sometime defined as informalsector.
The informal sector, which is analogous to ease of entry, low capital to labor ratio, limited access to credit, dominance of self-employment and production of low-
quality goods. One of very common feature of informal sector is underemploymentincluding both visible (work less than 40 hours a week and want additional hours toworks) and invisible underemployment (work 40 or more hours a week and wantmore works). More importantly underemployment tend to closely related to the poor,
particularly invisible underemployment.With the sustained growth of the informal sector, there is however, little evidence
that movement between the informal to the formal sector exists. This type of labor market segmentation may be due to the institutional factors such as the presence of minimum wages and labor unions, but more so of economic factors associated with

8/3/2019 HRD Poverty in the Philippines
http://slidepdf.com/reader/full/hrd-poverty-in-the-philippines 25/44
23
the “efficiency wage: thesis, such as greater efficiency from higher-killed workers,internal labor markets and stability of labor supply.
Lack of employment opportunity accompanying of high growth rate of labor supply is the main factor to create a large informal sector with low productivity. Slowgrowth of GDP accompanied to high population growth have created high pressurefor employment problems. There was high unemployment and underemployment andwidespread underutilization of labor resources of the country.
It is shown that the agriculture, service and transport sector, which providemajority of occupation for the poor in informal sector, provide lower wages than themean for all industries xli.
Analyzing the situation in the labor market during the so-called boom period1985- 1997, Khan (1995), as cited from Erlinda. M. Medalla (2002), attempted to givean explanation to a slight increase of real wage trend and stagnant labor productivityin period 1987-1994, by dividing the economy into urban formal and informal sector and rural formal and informal sector. After analysis he went to the saying that the risein urban formal sector could have spill over effects into rural formal sector in agenerally favorable political environment while wage/income in the vast informal
parts of urban and rural sector stagnated.Labor productivity is highly differentiated among sectors, while industry has very
high productivity, agriculture and service, despite being main providers of employment have lower than national average productivity. In 2001 and 2002, whilenational average productivity (as GDP per employed person) were P 33,900 and P34,400, that of agriculture was only P18,200 and P 18,400, just slightly more than ahalf of national average, that of services was although higher than agriculture but stilllower than national average with P 33,500 and P 33,600 respectively. At the sametime, we can see that industry has very high productivity that is more than twicehigher than national average with 71,400 and 74,600 respectively in 2001 and 2002.Underemployment rate 20.7% 2003 and 17.6% 2004 xlii
The justification for the high correlation between poverty and low quality of employment and underemployment in the Philippines is that in the circumstance of lacking an unemployment insurance scheme, the poor can not afford to beunemployed, they should take any job they can find and provide themselves despitelow quality
Thus the poor are commonly unskilled labor and in labor markets, the poor mainly have income opportunities related to unskilled jobs in the formal sector thattend to be relatively deteriorated with the time and low income entrepreneurshipworks or underemployment in informal sector and low productivities in the farmingsector.
5 GOVERNMENT POLICIES TOWARD POVERTY ALLEVIATIONWITH REGARDS TO EDUCATIONAL AND LABOR MARKET ISSUES
Efforts by different administrations ruling Philippines in period 1985 onwards to poverty alleviation were given in Reyes (2002), which can be shortly summarized asfollowed:
Although all administrations have made efforts toward poverty alleviation in thecountry, the focus was different. It is the Aquino administration in the first time hasset a target for poverty reduction and made efforts towards implementation of anemployment-oriented and rural-based development strategies. In addition,

8/3/2019 HRD Poverty in the Philippines
http://slidepdf.com/reader/full/hrd-poverty-in-the-philippines 26/44
24
Community Employment and Development Program (CEDP) has been launched togenerate one million jobs during the 18 months period beginning July 1986, focusingon construction of small scale and labor intensive infrastructure in rural areas. TheRamos administration’s focus was on people empowerment, while the Estradaadministration give priority to improve community-based interventions for the poor and the Arroyro promoted equitable growth through modernizing country.
With regards to education issues, main focus towards the poor in this period wason improving access of the poor to education and improving quality of publiceducation. With a large education reform programs have been promoted, Governmentis conscious about the equity issues facing the public education system. These issueshave been addressed though the President Task Force for the Fight against povertywith the participation of Department of education, culture and Sport (DECS), whichtargeting 20 poorest province xliii .
The efforts toward improving education of the poor have been done though mainfollowing policies plan:
• The full implementation of the new curriculum in elementary andsecondary education as parts of the Program for Decentralized Educational
Development and the Secondary Educational Development Program• Introduction of free public secondary education in 1988• Adoption of the Education for All Philippines Plan of Action.• Reducing the number of rural barangay without elementary school,
the number of incomplete elementary school and the number of municipalitieswithout any secondary school.
• Introduction of quality improvement measures by increasingnumbers of school days from 185 to 220. Increasing hours for English, maths, sciencesubjects.
• Increasing salary for teachers in public school to make sure the
public schools can compete with private school in employing qualified teachers• Review the adequacy, structure and responsiveness of the wholestretch of the basic education program to meet certain legal requirements of entrepreneurship and paid employment and ensuring better preparation of graduate for higher levels of learning
The implementation of the above policies in fact have large impacts on raisinghuman capital of the country in overall, particularly improving access to education of the poor throughout the period. As can be seen in table 11, participation rate in bothelementary and especially secondary education have been improved significantly with12.4% increase for elementary and 10.7% increase for secondary in period from SY1990-91 to SY 1999-2000. With regards to free secondary education policy, the poor even could benefit more than the rich. As we can see from table 12, the improvementin secondary school attendance in period from 1988 to 2000 was 5% for the lowestincome decile while it was 0.7% for the richest decile.
However, as we can see from the section 3, problems still exist with wide spreadof inequalities in access to good quality education. Even the programs promoted bygovernment towards the interest of the poor have been evaluated with inefficientimplementation.
Bagangay school construction in the effort to provide free basic education innationwide is a case. According to WB (1996) not every barangay need or can

8/3/2019 HRD Poverty in the Philippines
http://slidepdf.com/reader/full/hrd-poverty-in-the-philippines 27/44

8/3/2019 HRD Poverty in the Philippines
http://slidepdf.com/reader/full/hrd-poverty-in-the-philippines 28/44
26
With a lack of access to education with good quality, the poor seems to havedisadvantages in competition with non-poor in labor markets. Within wageemployed, they tend to be unskilled workers whose wage has relative deteriorationcompared to all other resource owners. Although, the quality of employment inthe country is low and deteriorated with stagnated manufacturing employment andfull- time employment and high growth rate of part-time employment, low quality
of employment tend to be the problems of the poor. The poor with low stock of education has higher representation among underemployed, unpaid familyworkers and self-employed. The worse outcomes in labor markets of the poor compared to non-poor can be seen in the lower domestic rate of return on eachyear of education in elementary compared to secondary and in secondarycompared to higher education. Furthermore, the poor tend to leave schools earlier than completion year that leads to higher rate of return in the Philippines labor markets. The pattern of rate of return on education in the Philippines has shownthat the Philippines poor is not only in worse situation compared to non-poor butalso compared to the poor in other developing countries, where the rate of returnon each year of primary education is higher than that of secondary education andhigher education.
The governments are aware of lack of access and low quality of education provided tothe poor. There were large government efforts to improve situation of the poor ineducation which created some positive effects on increase the access of the poor toeducation. However, it seems that opportunity costs and unfavorable outcome of the
poor in labor markets prevents further improvements of early and high drop out rateof the poor.
i ADB (2004), p26ii Orbeta A. C (2002)iii Consumption based measure of poverty is given in Balisacan (1999) and Self-rated poverty is definedthrough surveys made by Social Weather Station, Philippinesiv Balisacan (2001) P5v
Reyes C. (2002), p13vi For more look at WB (2001), p32, which cited Balisacan (1993) that the failure to take into accountof the “shifting of Physical areas” arising from reclassification would distort the overall picture on theactual performance of rural areas from late 1980s and early 1990s.vii Monsod 1999, p59.viii For more, Look at Orbeta A.(2002), table 24ix 10, 11, 12 , 13, Manasan (2001),p.12, 14, 16
xiv Philippine Star newspaper, 20 september 2004xv For more look Orbeta A. (2002), table 5xvi Tan (1999) bxvii
Manasan (2001) p19xviii Manasan (2001) 5xix Philippine Human Development report, p 13xx With adoption of free secondary education from 1988, the budget share of elementary education inthe total education budget has reduced from 60.2% in 1988 to 50.6% in 1990, but was able to regainand increase to 61.3% in 1998 before slipping to 56.0% in 2000 and 56.9% in 2001.xxi Philippine Human Development report, p21xxii Manasan (2002)xxiii Manasan 2002, 38.xxiv ADB (2004)xxv Orbeta (2002) table 17

8/3/2019 HRD Poverty in the Philippines
http://slidepdf.com/reader/full/hrd-poverty-in-the-philippines 29/44
27
xxvi Labor statistics 2003.xxvii Unemployment in the Philippines: Is it structural problems (2004) pxxviii Gwendoline Tecson 2000, 137.xxix For data of Philippines 1986- 1989 look Cororaton and Abdula 2002, 288, 2000, 2003 look at ADB2004, data for other countries look at Gwendoline Tecson 2000, 145xxx Gwendoline Tecson 2000, 150xxxi
Sicat 2004, 5.xxxii Psacharopolous 1981, 1994, Rate of return on education: A global updatexxxiii Philippine Human Development Report 2002xxxiv PHDR 2002,xxxvGeochi (2002) calculate rate of return on education for 1988, 1990 and 1995 with two versions of cost estimates, which produces different results on rate of return on education. With the purpose of emphasizing time series rather than cost estimate technics, this paper interprets only the results basedon direct education cost from Maglen and Manasan (1999).xxxvi Orbeta A. (2002), table 24xxxvii Erlinda. M. Medalla, 2002xxxviii Philippine Human Development Report 2002, p.5xxxix Calculation by Monsod and Ducanes (2001) from merged LFS and FIES, cited from PHDR 2002.xl PHDR 2002, 7xli Alba 1997,16xlii
Bles key labor statisticsxliii WB(1996) 4

8/3/2019 HRD Poverty in the Philippines
http://slidepdf.com/reader/full/hrd-poverty-in-the-philippines 30/44
Table 1. Poverty incidence and threshold in the PhilippineHead count (%) Family (%) Poverty threshold
(P)Total Urban Rural Total Urban Rural Urban Rural
1985 49.2 37.8 56.4 44.2 33.6 50.7 4365.0 2417.01988 45.4 34.2 52.3 40.0 30.1 46.3 5893.0 2830.0
1991 45.2 25.4 55.0 39.9 31.1 48.6 8327.0 4402.01994 40.6 28.0 53.1 35.5 24.0 47.0 9831.0 5569.01997 36.9 21.6 50.7 31.8 17.9 44.4 12577.0 7172.02000 39.5 24.4 54.0 33.7 19.9 46.9 15524.0 8448.02003Source: PIDS poverty statistics
Table 2. Poverty estimates, based on national and international poverty lines, urban- rural,Philippines and other countries, various years
International poverty measuresCountry National poverty rates$1 per day $ 2 per day
Year National
Urban Rural Year HCR (%)
Magnitute(000)
HCR (%)
Magnitute(000)
Philippines 2000 34.0 20.4 47.4 2000 15.5 12,136.3 47.5 37,224.3Indonesia 2002 18.2 14.5 21.1 2002 7.5 15,902.0 52.4 110,985.4Thailand 2002 9.8 4.0 12.6 2000 1.9 1,204.5 32.5 20,264.5Malaysia 1999 7.5 3.4 12.4 1997 0.2 36.8 9.3 2,004.5Vietnam 2002 28.9 6.6 35.6 2002 13.1 10,509.4 58.5 47,058.1Source: Key indicators 2004: Poverty in Asia: Measurement, estimates and Prospects
Table 3. Poverty incidence by regions1985 1988 1991 1994 1997 2000 2003
Philippines 49.2 45.4 45.2 40.6 36.9 39.5 NCR 27.1 25.1 16.6 10.4 8.5 11.5
CAR Cordilera 50.5 55.5 56.5 50.1 43.8I- Ilocos region 43.4 51.7 55.1 53.5 44.2 43.6II- Cagayan Valley 42.7 44.7 48.9 41.9 38 35III- Central Luzon 32 33.7 35.5 29.2 18.6 23IV- Southern Tagalog 45.7 46.6 43.1 35 30 31V-Bicol Region 67.5 61.3 61.2 60.8 57 61.9VI- Western Visayas 66.4 56.5 52.8 49.8 45.9 51.1VII- Central Visayas 61.9 52.1 46.7 37.4 39 43.8VIII- Eastern Visayas 65.1 54.7 47.1 44.6 48.5 51.1IX- WesternMindanao
59.9 43.8 54.2 50.5 45.5 53
X- Northern
Mindanao
56.6 50.1 57.4 54.2 52.7 52.2
XI- SouthernMindanao
49.6 48.8 51.5 45.4 44.3 45.1
XII- CentralMindanao
56.3 40.9 63 58.5 55.8 58.1
XIII- ARMM-Muslim Mindanao
56 65.5 62.5 71.3
Source: PIDS poverty statistics

8/3/2019 HRD Poverty in the Philippines
http://slidepdf.com/reader/full/hrd-poverty-in-the-philippines 31/44

8/3/2019 HRD Poverty in the Philippines
http://slidepdf.com/reader/full/hrd-poverty-in-the-philippines 32/44
Table 6: Access to education, water, sanitary toilets, strong housing by poor and non-poor, 1998All Poor Non-poor
Education participation rateElementary 88.71 85.97 92.46Secondary 63.78 53.46 74.15Tertiary 23.60 11.94 30.54
TVET 0.95 0.57 1.18Higher education 22.65 11.37 29.36
Water usePortable - 67.5 85.3
Non-portable - 32.7 14.7Sanitary toilet
Sanitary - 67.4 89.4Unsanitary - 32.6 10.7
ElectricityWith 72.3 50.2 87.4Without 27.7 49.8 12.6
Housing typesStrong 62.2 39.5 77.7Light 36.6 58.2 21.1Makeshift 1.7 2.3 1.2
Average per capita income Nominal - 7,420 40,577Real - 5,420 29,640
Average per capita expenditure Nominal - 8,105 30,566Real - 5,920 22,327
Source: Education from Manasan (2001), table 4; Water and sanitary Reyes (2001)
Table 7: Average size of poor and all families1985 1988 1991 1994 1997 2000
Poor population
26,674,645 25,388,315 28,554,247 27,372,971 26,768,596 30,850,262
Poor
families4,355,052 4,230,484 4,780,865 4,531,170 4,511,151 5,139,565
Average
size of
poor
families
6.12 6.00 5.97 6.04 5.93 6.00
Total
population
*
54,216,758.1 55,921,398.7 63,173,112.8 67,421,110.8 72,543,621.0 78,101,929.1
Total
families**9,853,058.82 10,523,592.0 11,982,117.8 12,763,859.2 14,186,009.0 15,250,934.7
Average
size of all
families
5.50 5.31 5.27 5.28 5.11
5.12
*Magnitude of poor population devide to poverty incidence by headcount** Magnitude of poor families decile to incidence of poor families

8/3/2019 HRD Poverty in the Philippines
http://slidepdf.com/reader/full/hrd-poverty-in-the-philippines 33/44
Table 8. Poverty incidence among families by the household head’s occupation, education andfamily sizes, 1985, 2000
Majoroccupationgroup
1985 2000 Highesteducationalattainment of
the householdheads
1985 2000 Family size 1985 2000
Total poor families
44.2 33.7 PovertyIncidence
44.2 33.7 Povertyincidence
44.2 33.7
Not specified 50.3 - No grade 55.9 60.5 1 19.0 9.8Professional,technical andrelated workers
9.6 5.9 Elementaryundergraduate
57.2 45.2 2 20.0 15.7
Administrative,Executive andmanagerialworkers
6.0 10.8 Elementarygraduate
51.6 26.0 3 26.6 18.6
Clerical &related workers
18.4 9.4 1 st- 3 rd highschool
46.5 11.9 4 36.4 23.8
Sale workers 31.4 17.0 High schoolgraduate
31.6 18.2 5 42.9 31.1
Service workers 40.1 18.2 CollegeUndergraduate
17.0 10.3 6 48.8 40.5
Agricultural, Animalhusbandry & forestryworkers, fishmen andhunters
57.0 55.5 At leastCollegeGraduate
6.5 2.5 7 55.3 48.7
Production &related workers,transport andequipment
operators
42.1 33.3 8 59.8 54.9
Other occupationnot clasifiable
59.7 26.5 9 or more 59.9 57.3
Armed forces 16.0 10.7 Non-gainfuloccupation
- 29.2
Unemployed 28.0 19.4Source: Reyes (2002), 10

8/3/2019 HRD Poverty in the Philippines
http://slidepdf.com/reader/full/hrd-poverty-in-the-philippines 34/44
Table 9. Percentage distribution of total family expenditure-by-expenditure group and incomesource and by poor and non-poor families: 1998
Ecpenditure Poor Non-poor Income Poor Non- poor
Total familyexpenditure
258,465,374
1,071,642,865
Wage and salariesAgriculture
Non-agriculture
41.2--
48.4--
Percent 100 100 Income from entrepreneurial activities 35.3 22.7Food 62.6 43.3 Other source of Income 23.5 28.7Fuel, light and water 6.2 6.0 Net share of crop 0.8 0.6Transportation andcommunication
3.0 5.4 Rental values of dwelling units for income
8.3 10.8
Education 3.0 5.4 Cash receipts, assistance fromdomestic sources
4.5 2.3
Medicare 2.2 3.2 Pension, retirement 0.9 2.8Clothing, footwear and other wear
2.3 2.4 Interest from bank deposit and loan toother household
0.0 0.4
Housing expenditureRent/rental of
occupied dwellingunit
Housemainternance
9.28.40.8
17.115.71.5
Rental from Non-agriculture land, building and other properties
0.2 1.2
Tax paid 0.2 1.6 Devidends and investment 0.0 0.2Other expenditure 11.3 15.2 Cash receipts, assistance from abroad 1.7 8.4
Income from family sustenanceactivities
5.0 0.6
Receipt as gifts 1.7 0.9Other income 0.4 0.5
Other expenditure include expenditure in alcohol, beverage, tobacco, household operation, recreation, purchase of durable and non-durable equipment, miscellaneous, personal effects and other expenses notincluded elsewhereSource: Reyes 2001, table 2c.4
Table 10 : Gross enrolment rates by sex, levels
Country Primary Secondary TertiaryYear Female Male Year Female Male Year Female Male
Philippines 2001 111 113 2001 86 78 2001 35 27Indonesia 2001 110 112 2001 58 58 2001 14 16Thailand 2001 96 100 2000 81 85 2001 38 35Malaysia 2001 95 95 2001 73 66 2000 28 26Vietnam 2001 100 107 2001 67 72 2001 9 11
Source : Source: Key indicators 2004: Poverty in Asia: Measurement, estimates and Prospects, pp 54-55

8/3/2019 HRD Poverty in the Philippines
http://slidepdf.com/reader/full/hrd-poverty-in-the-philippines 35/44
Table 11: Participation rate in elementary and secondary by regions
Elementary Secondary
1990-91 1996-97 1999-2000
1990-91 1996-97 1999-2000
Philippines 84.6 94.3 97.0 54.7 63.4 65.4 NCR 90.2 98.5 99.1 74.6 80.8 80.3CAR Cordilera 85.3 91.3 94.1 60.3 76.9 74.5I- Ilocos region 92.6 99.6 97.5 64.5 72.2 79.2II- Cagayan Valley 84.3 98.6 96.5 49.5 65.0 67.3III- Central Luzon 94.0 100.8 99.9 57.4 69.0 71.2IV- Southern Tagalog 89.2 100.2 99.9 59.6 66.5 71.7V-Bicol Region 85.8 97.5 95.8 46.3 61.3 65.5VI- Western Visayas 84.3 92.5 96.5 58.9 67.6 72.7VII- Central Visayas 80.1 93.8 100.0 48.3 60.6 65.6VIII- Eastern Visayas 78.3 91.1 95.6 40.7 53.7 52.4IX- Western Midanao 77.4 85.8 92.1 38.4 50.7 50.5X- Northern Mindanao 80.0 91.2 95.8 50.5 56.4 50.0XI- Southern Mindanao 79.5 88.4 92.4 52.4 55.4 50.9XII- Central Mindanao 79.0 80.3 93.1 46.1 58.1 58.8XIII- ARMM-MuslimMinanao
62.2 81.3 93.6 22.3 31.9
Cagara 85.3 92.7 50.4 49.5Sources: Import from Manasan 2002, 4

8/3/2019 HRD Poverty in the Philippines
http://slidepdf.com/reader/full/hrd-poverty-in-the-philippines 36/44

8/3/2019 HRD Poverty in the Philippines
http://slidepdf.com/reader/full/hrd-poverty-in-the-philippines 37/44
Table 12: School attendance of school-age population* by income decile and bylevel, urban/rural, 1988, 2000 .
Source : Cited from Orbeta (2002), table 24
1988 2000Income decileTotal Elementary Secondary Tertiary Total Elementary Secondary Tertiary
TotalLowest 60.6 90.7 65.9 23.4 64.5 90.1 70.8 24.42 60.0 93.1 67.0 23.5 65.0 92.9 76.4 26.43 58.5 95.9 72.3 21.2 63.3 94.8 80.1 26.54 57.7 94.1 74.8 23.6 66.2 96.5 83.8 32.65 60.9 95.9 79.7 27.4 64.2 97.5 84.5 32.86 58.2 95.7 83.0 28.1 66.3 95.4 91.2 34.97 58.1 98.5 85.4 30.2 66.3 97.2 89.5 39.78 59.4 97.9 83.7 34.9 64.3 97.5 93.4 38.29 63.6 97.2 85.1 41.4 68.5 97.9 93.0 47.6Highest 60.4 97.9 84.7 40.8 63.1 98.5 86.8 45.8Total 59.6 94.9 76.7 29.8 65.0 94.9 83.6 35.5
UrbanLowest 1 65.4 90.8 70.5 37.0 67.9 89.0 76.5 29.5
2 66.4 93.8 75.6 34.9 69.9 93.7 79.2 36.23 62.9 97.7 81.0 25.5 64.0 95.3 80.5 25.84 63.2 98.3 83.7 28.0 67.7 96.2 88.3 31.45 66.2 96.6 87.5 33.1 66.6 97.8 86.4 32.26 63.0 98.2 90.2 30.4 66.2 95.3 91.8 34.27 61.8 99.4 87.3 37.4 66.0 97.9 91.1 38.38 61.2 99.5 84.3 36.5 64.8 98.1 92.9 39.59 63.4 97.2 86.2 41.5 66.9 98.3 86.6 45.6Highest 59.6 98.4 83.3 41.4 62.8 98.2 88.2 45.6
RuralLowest 60.1 90.7 65.5 22.0 64.0 90.3 70.0 23.52 58.9 93.0 65.6 21.4 63.6 92.6 75.7 23.83 57.1 95.3 69.8 19.8 62.8 94.6 80.0 26.84 55.7 92.6 71.1 22.0 65.3 96.7 81.1 33.35 58.3 95.5 76.3 24.6 62.0 97.2 82.5 33.26 55.3 94.0 78.6 26.8 66.5 95.5 90.2 36.07 55.0 97.8 83.9 24.0 66.9 96.0 87.0 42.28 57.3 95.8 82.9 33.1 63.0 95.8 94.5 34.89 64.0 97.3 83.5 41.4 73.5 96.7 93.5 54.2Highest 62.5 96.8 88.0 39.2 64.5 100.0 87.5 46.7
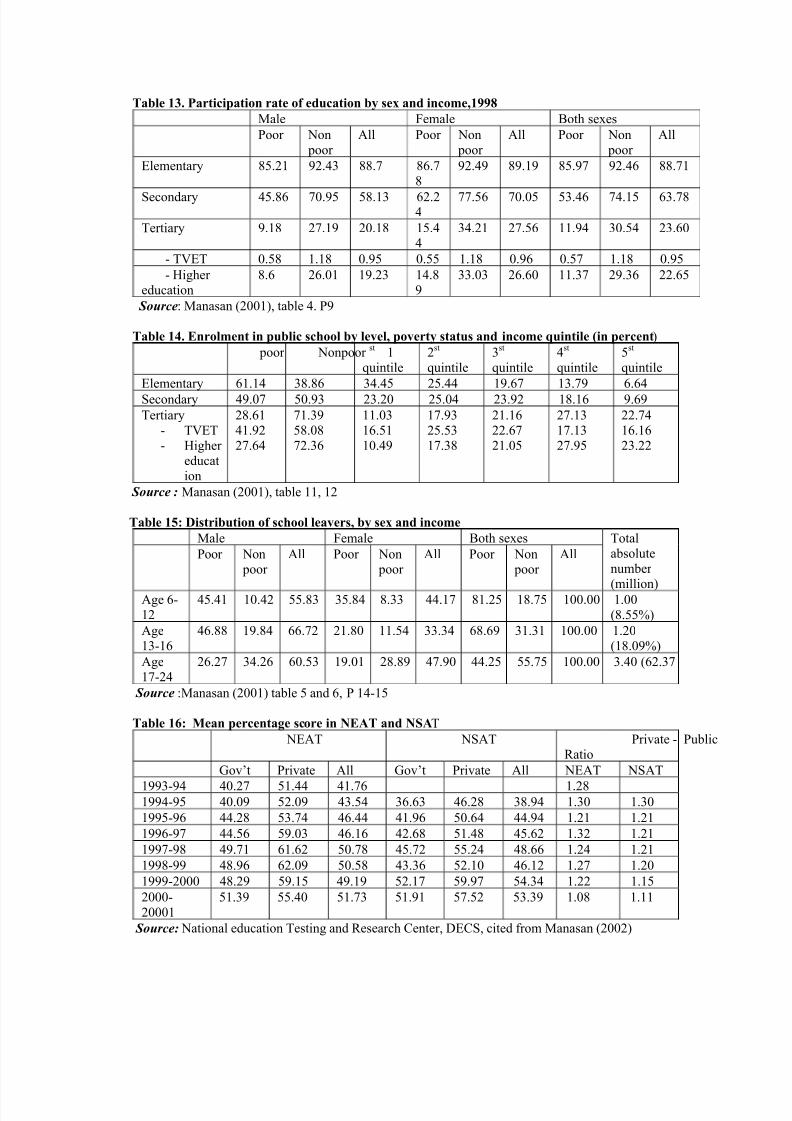
8/3/2019 HRD Poverty in the Philippines
http://slidepdf.com/reader/full/hrd-poverty-in-the-philippines 38/44
Table 13. Participation rate of education by sex and income,1998Male Female Both sexesPoor Non
poor All Poor Non
poor All Poor Non
poor All
Elementary 85.21 92.43 88.7 86.78
92.49 89.19 85.97 92.46 88.71
Secondary 45.86 70.95 58.13 62.24
77.56 70.05 53.46 74.15 63.78
Tertiary 9.18 27.19 20.18 15.44
34.21 27.56 11.94 30.54 23.60
- TVET 0.58 1.18 0.95 0.55 1.18 0.96 0.57 1.18 0.95- Higher
education8.6 26.01 19.23 14.8
933.03 26.60 11.37 29.36 22.65
Source : Manasan (2001), table 4. P9
Table 14. Enrolment in public school by level, poverty status and income quintile (in percent ) poor Nonpoor 1st
quintile2st quintile
3st quintile
4st quintile
5st quintile
Elementary 61.14 38.86 34.45 25.44 19.67 13.79 6.64Secondary 49.07 50.93 23.20 25.04 23.92 18.16 9.69Tertiary
- TVET- Higher
education
28.6141.9227.64
71.3958.0872.36
11.0316.5110.49
17.9325.5317.38
21.1622.6721.05
27.1317.1327.95
22.7416.1623.22
Source : Manasan (2001), table 11, 12
Table 15: Distribution of school leavers, by sex and incomeMale Female Both sexesPoor Non
poor All Poor Non
poor All Poor Non
poor All
Totalabsolutenumber
(million)Age 6-12
45.41 10.42 55.83 35.84 8.33 44.17 81.25 18.75 100.00 1.00(8.55%)
Age13-16
46.88 19.84 66.72 21.80 11.54 33.34 68.69 31.31 100.00 1.20(18.09%)
Age17-24
26.27 34.26 60.53 19.01 28.89 47.90 44.25 55.75 100.00 3.40 (62.37
Source :Manasan (2001) table 5 and 6, P 14-15
Table 16: Mean percentage score in NEAT and NSA T NEAT NSAT Private - Public
RatioGov’t Private All Gov’t Private All NEAT NSAT
1993-94 40.27 51.44 41.76 1.281994-95 40.09 52.09 43.54 36.63 46.28 38.94 1.30 1.301995-96 44.28 53.74 46.44 41.96 50.64 44.94 1.21 1.211996-97 44.56 59.03 46.16 42.68 51.48 45.62 1.32 1.211997-98 49.71 61.62 50.78 45.72 55.24 48.66 1.24 1.211998-99 48.96 62.09 50.58 43.36 52.10 46.12 1.27 1.201999-2000 48.29 59.15 49.19 52.17 59.97 54.34 1.22 1.152000-20001
51.39 55.40 51.73 51.91 57.52 53.39 1.08 1.11
Source: National education Testing and Research Center, DECS, cited from Manasan (2002)

8/3/2019 HRD Poverty in the Philippines
http://slidepdf.com/reader/full/hrd-poverty-in-the-philippines 39/44
Table 17: Per student SEF income, all LGU 2000Regions Per student SEF income*,
All LGU, 2000 (in pesos)Per capita household income (in
pesos) NCR Metro Manila 2,308 66,173CAR Cordillera 284 28,130I- Ilocos region 217 23,242
II- Cagayan Valley 131 21,842III- Central Luzon 444 28,609IV- Southern Tagalog 742 31,238V-Bicol Region 106 20,936VI- Western Visayas 269 21,390VII- Central Visayas 310 19,291VIII- Eastern Visayas 129 18,678IX- Western Mindanao 94 16,823X- Northern Mindanao 250 21,513XI- Southern Mindanao 302 22,337XII- Central Mindanao 190 17,973XIII- ARMM-Muslim
Mindanao
10 13,009
CARAGA 146 15,904* per capita excludes those with incomplete data
Source : Manasan (2002) Appendix table 15
Table 18. Employment share by sectors
Sector 1985 1990 1995 2000 2003Agriculture 49.0 44.9 44.1 37.1Industry 14.2 15.4 15.6 16.2Service 36.8 39.6 40.2 46.7
Transportation, storage& comm 4.7 5.0 5.8 7.3Whole sale & retail trade 13.2 14.0 14.6 16.5
Finance, ins, real estate & bus service 1.7 2.0 2.1 2.4Community social and personal service 17.2 18.7 17.7 20.3
Source : Statistical yearbook 2004, Orbeta (2002) and Esguerra & Canlas (2001)

8/3/2019 HRD Poverty in the Philippines
http://slidepdf.com/reader/full/hrd-poverty-in-the-philippines 40/44
Table 19.Family income-by-income deciles1985 1988 1991 1994 1997 2000Income
decile Average*(P)
Shar e of total(%)
Aver age*(P)
Shar e of total(%)
Aver age*(P)
Shar e of total(%)
Aver age*(P)
Shar e of total(%)
Aver age*(P)
Shar e of total(%)
Aver age*(P)
Shar e of total(%)
1 6,273 2.0 8,160
2.0 11,937
1.8 15,622
1.9 20,702
1.7 24,309
2.4
2 9,96 3.2 12,866
3.2 19,179
2.9 25,262
3.0 33,090
2.7 39,182
3.4
3 12,718 4.1 16,398
4.1 24,702
3.8 32,719
3.9 42,633
3.5 50,650
4.2
4 15,494 5.0 20,179
5.0 30,450
4.7 40,631
4.9 53,134
4.3 63,482
5.0
5 18,682 6.0 24,329
6.0 37,211
5.7 49,800
6.0 66,335
5.4 79,284
6.0
6 22,548 7.3 29,460
7.3 45,764
7.0 61,161
7.4 83,253
6.8 99,533
7.0
7 27,761 8.9 36,482
9.0 57,084
8.7 75,898
9.1 106,977
8.7 127,026
8.5
8 35,312 11.4 46,774
11.6 74,225
11.4 98,234
11.8 140,784
11.5 168,082
10.6
9 48,612 15.7 64,607
16.0 104,942
16.1 136,715
16.4 196,886
16.2 235,632
14.4
10 113,152
36.4 144,805
35.8 246,363
37.9 295,542
35.5 345,680
39.3 553,220
38.6
Tenth/First
18.0 17.7 20.6 18.9 16.6 22.7
Source: Family Income and expenditure surveys 1985-2000

8/3/2019 HRD Poverty in the Philippines
http://slidepdf.com/reader/full/hrd-poverty-in-the-philippines 41/44
Table 20. Comparative return to investment on education by level, full method (in %)
Social returns Private returnsCountry/regionPrimary Secondary Higher Primary Secondary Higher
Philippines (1988) 13.3 8.9 10.5 8.3 10.5 11.6Asia 16.2 11.1 11.0 20.0 15.8 18.2
Sub-Saharan Africa 25.4 18.4 11.3 37.6 24.6 27.8Europe/M. East/N.Africa
15.6 9.7 9.9 13.8 13.6 18.8
Low Income 21.3 15.7 11.2 25.8 19.9 26.0High Income 18.8 12.9 11.3 27.4 18.0 19.3Middle Income 13.4 10.3 9.5 25.6 12.2 12.4
Source:Geochi (2002)
Table 21. Effects of education on wages and income (in percent, 1994)Wage* Family income#
No schooling BaseEach year of elementary school 2.3
Incomplete elementary school BaseElementary school graduate 13.8 8.0Each year of high school 3.5Incomplete high school 13.0High school graduate 27.8 23.0Each year of college 6.4Incomplete college 42.0College graduate 53.4 82.0
*: Relative to wage of a person with no schooling, #: relative to a person with incomplete (0-5 years)elementary education.Source: Alba (2002) for wage differential; Dacuycuy (2002) for family income differentials, citedfrom PHDR 2002
Table 22. Share of Manufacturing in total employment and GDP, in selected countries,Southeast Asia
Share of Manufacturing employment Share of Manufacturingproduction
1985 1990 1995 2000 2003 1997Philippines 9.70 9.71 10.00 10.05 9.65 21Indonesia 9.28 10.14 12.64 12.95 12.03 25Thailand 7.99 10.15 13.43 14.49 14.66 29Malaysia 15.20 19.93 23.28 23.45 21.59 34
Source: Basic data from Key indicators 2003, Gwendolyn R. Tecson (2000)

8/3/2019 HRD Poverty in the Philippines
http://slidepdf.com/reader/full/hrd-poverty-in-the-philippines 42/44
Table 23. Underemployment rate by highest grade completed, 2002 average, in percentHighest gradecompleted
Both areas Urban Rural
Average 17.0 13.4 20.2 No grade completed 15.8 14.7 16.0Elementary 20.5 16.2 22.4
Undergraduate 21.3 17.4 22.6Graduate 19.7 15.3 22.1
High school 17.1 14.4 20.0Undergraduate 19.0 16.3 21.1Graduate 15.9 13.5 19.0
College 11.7 10.4 14.8Undergraduate 14.6 13.0 17.4Graduate 9.3 8.3 11.9
Source: Labor statistics yearbook, 2003,
Figure 3. Poverty incidence and underemployment by regions, 2000
01020304050607080
P h i l i p p
i n e s
N C R
C A R
C o r d i
l e r aI I I I I I I V V " V I V I I
V I I I I X X X I X I I A R
M M
C a g a r a
Visible underemployment rate by region poverty incidence

8/3/2019 HRD Poverty in the Philippines
http://slidepdf.com/reader/full/hrd-poverty-in-the-philippines 43/44
LIST OF REFERENCE
1. Balisacan, A. (1994) Poverty, urbanization and development policy: a Philippine perspective, University of the Philippine press.
2. Balisacan, A. (1999) reconstructing poverty profiles in the Philippine, Sept 1999, UP Discussion paper 1999-15.
3. Balisacan A. and Nobuhilo Fuwa (2001) Growth, Inequality and Poverty Reductionin the Philippine, UP Discussion paper 2001-09
4. Balisacan A. & E. Pernia (2002) Probing Beneath cross-National averages: Poverty,inequality and growth in the Philippine, ADB working paper
5. Das Gupta Ani (2003), "Urban poverty in East Asia: a review of Indonesia, thePhilippines and Vietnam", Working Paper No 11 , World Bank.
6. DOLE (2003) Labor statistics7. Erlinda. M. Medalla (2002) Trade and industrial Policy Beyond 2000: An assessment
of the Philippine Economy, chapter 3 in Yap J. (Ed) The Philippine beyond 2000: Aneconomic assessment of the Philippine Economy , PIDS pp 137-182.
8. Esguerra Emmanuel and Dante Canlas (2000) Raising the quality of life through theworkplace in the new millennium” in Socio-Economic Reform program in thePhilippines – Impacts and new directions, Ed by Dante Canlas and Yasuhiro Nimura,IDE, Chiba, Japan
9. Gwendoline Tecson (2000) Industrial development in the: issues and prospects for the21 century , in The Philippines economy: Alternative for the 21 century, DanteCanlas and Shigeaki Fujisaki (edited) IDE –UP series
10. Intal, Ponciano S. (1994) Understanding Poverty and Inequality in the Philippines .11. Jurado, G and Ma T. Sanches (1998) “ Philippine Employment and Industrial
Relations Policies: An assessment ” PIDS Discussion paper Series 98-1012. Khan (1995), The Philippine employment policies in the context of globalization and
liberalization, Manial, ILO, SEAPAT.13. Lazona, Leonardo A. Lazona, Jr. (2001) Analysis of globalization and wage
inequality in the Philippine: An application of the Stolper-Samuelson Theory, in TheFilipino in a global economy, Edited by Leonardo A, Lazona.
14. Manasan Rosario (2001) “Social and poverty assessment” Asian development bank Technical Report IS-1
15. Manasan Rosario (2002) Education financing and service delivery16. Manasan, R. (2002), Education financing and service delivery, Unpublished paper,
PIDS17. Monsod (1999) Inter and intra regional poverty comparisons of poverty in the
Philippines, in Balisacan A. & Shigeaki Fujisaki (1999) Causes of poverty: myth facts& policies: a Phuilippine Studies , University of the Philippine Press
18. Orbeta A. (2002) Education, Labor Market and Development: A review of the Trendsand issues in the Philippines for the past 25 years, PIDS, Discussion Paper Series N0.2002-19.

8/3/2019 HRD Poverty in the Philippines
http://slidepdf.com/reader/full/hrd-poverty-in-the-philippines 44/44
19. Reyes C. (2002) “The poverty fight: Have we made an Impact?” PIDS 25th anniversary Symposium Series on Perspective Papers
20.
Reyes C. De Vall, E. (1998) Poverty alleviation and Equity Promotion, PIDS in Yap(ed): Philippine beyond 2000 , 2002 .21. Reyes, C. (2000) Poverty profile, Philippines, MIMAP research paper No 5022. Ruperto P. AlonZo (1999) Local governance and Poverty alleviation in Balisacan A.
& Shigeaki Fujisaki (1999) Causes of poverty: myth facts & policies: a PhuilippineStudies , University of the Philippine Press
23. Schady Norbert R. (2003) "Convexity and Sheepskin Effects in the Human CapitalEarnings Function: Recent Evidence for Filipino Men." Oxford Bulletin of Economicsand Statistics 65 (2): 171-96, May 2003
24. Sicat Gerardo (2004) “Success and adjustments in the Philippine labor market”,www.econ.upd.ph , DP 0403
25. Tan E (1999 b) “ Measuring Poverty in Education ” in Causes of Poverty: Myths, factsand Policies , Ed by A. Balisacan & Shigeaki Fujisaki, 1999 University of thePhilippine Press Manila
26. Tan E (2002) Tuition hike, education strike, Development research news, PIDS, VolXX, No 5.
27. WB (2001), Philippine Poverty Assessment, WB, 2001/05/31, Report No.20498 Vol.1-2
28. WB( 1996) Philippines educational financing and equity: A reform agenda29. World Bank (2002) Philippine: an opportunity for renewed poverty production, A
World Bank Development policy review.30. Philippine Human Development Report 2000& 2002, UNDP & Philippine Human
Development Network