hrd-90-59fs job training partnership act: …- gao united states general accounting office fact...
TRANSCRIPT

- GAO United States General Accounting Office
Fact Sheet for the Chairman, Special Committee on Aging, U.S. Senate
January 1990 JOB TRAINING PARTNERSHIP ACT
Information on Set-Aside Fbnding for Assistance to Older Workers
- - --- (;AO/HRD-90-59FS
United States General Accounting Office Washington, D.C. 20648
Human Resources Division
B-215774
January 22. 1990
The Honorable David Pryor Chairman, Special Committee on Aging United States Senate
Dear Mr. Chairman:
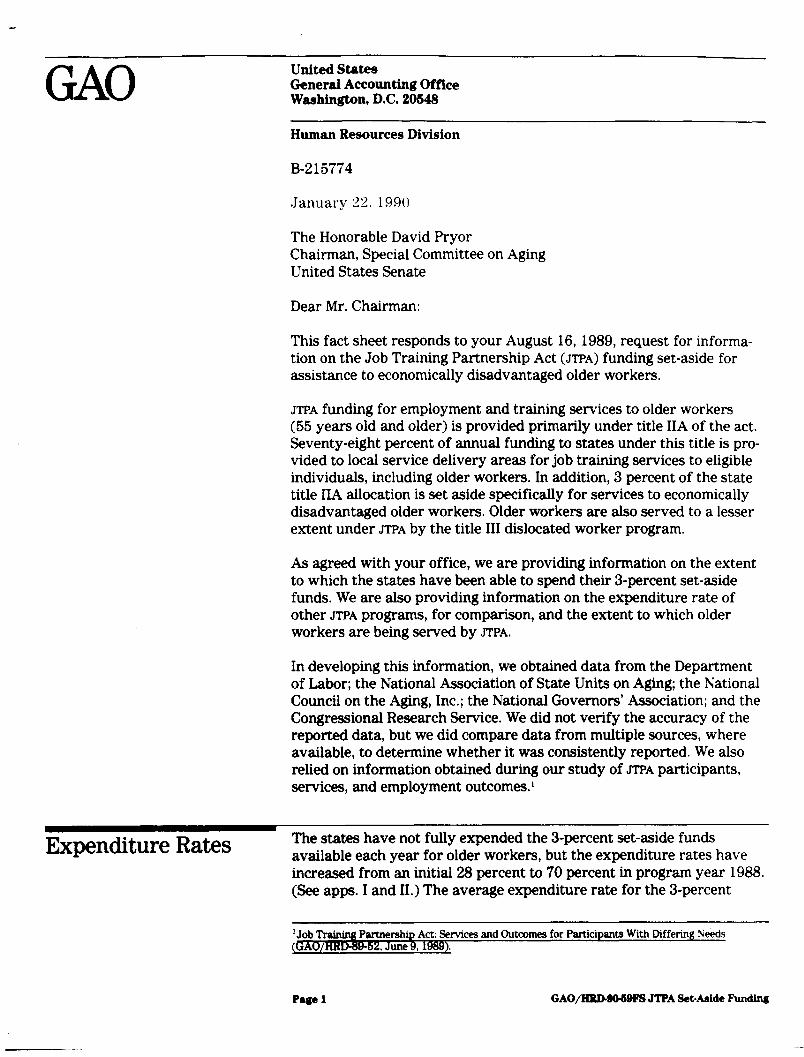
This fact sheet responds to your August 16,1989, request for informa- tion on the Job Training Partnership Act (JTPA) funding set-aside for assistance to economically disadvantaged older workers.
JTPA funding for employment and training services to older workers (55 years old and older) is provided primarily under title IIA of the act. Seventy-eight percent of annual funding to states under this title is pro- vided to local service delivery areas for job training services to eligible individuals, including older workers. In addition, 3 percent of the state title HA allocation is set aside specifically for services to economically disadvantaged older workers. Older workers are also served to a lesser extent under srp~ by the title III dislocated worker program.
As agreed with your office, we are providing information on the extent to which the states have been able to spend their 3-percent set-aside funds. We are also providing information on the expenditure rate of other JTPA programs, for comparison, and the extent to which older workers are being served by JTPA.
In developing this information, we obtained data from the Department of Labor; the National Association of State Units on Aging; the National Council on the Aging, Inc.; the National Governors’ Association; and the Congressional Research Service. We did not verify the accuracy of the reported data, but we did compare data from multiple sources, where available, to determine whether it was consistently reported. We also relied on information obtained during our study of JTPA participants, services, and employment outcomes1
available each year for older workers, but the expenditure rates have increased from an initial 28 percent to 70 percent in program year 1988. (See apps. I and II.) The average expenditure rate for the 3percent
SZ,June9, 1989). and Outcomes for Participants With Differing Needs
P8ge 1 GAO/HRDBlMSFS JTPA Set-Aside Funding

.
E215774
funds has been similar to the 51-percent rate for the title III program but substantially lower than the 73-percent rate for all title IIA funds.
The initial underexpenditure of 3-percent set-aside funds has been attributed to a slow start in developing services for older workers, This resulted in large carryover balances, which, in turn, contributed to the underspending problem in later years. However, expenditures have increased since the start of the program. For example, during transition year (TY) 1984,* about 28 percent of the older worker set-aside funds were spent. In program year (PY) 1988,3 the expenditure rate increased to about 70 percent of the total funds available (annual allocation plus carryover funds from previous years). (See fig. 1.) When one excludes the carryover funds from the amount available and looks only at the annual allocation of 3-percent funds provided to the states, recent expenditure rates are higher. For example, during program years 1986-88, the states expended 100 percent of the annual allocation of 3- percent funds, as well as a portion of funds carried over from prior years.
Pigun 1: Throo-Pwcmt Sot-Aaldo Fund cxpaldltw natea loo maaa
m
, n
wln4 mm PYnm Pwns PYlm7 PYlam PrqvnYrr
*The transition year refers to the initial g-month period of JTPA (Oct. 41983, to June 30,1984), which ia des@Wed TY 1984.
3A~yeafkeinsonJuly1MdendsonJune30ofthefollowingyear.Thus,PY 1988beganon July 1,19&W, and ended on June 3O,l!B9.
Page 2 GAO/l%MUMBH JTPA Set-tilde Fpndino
IS215774
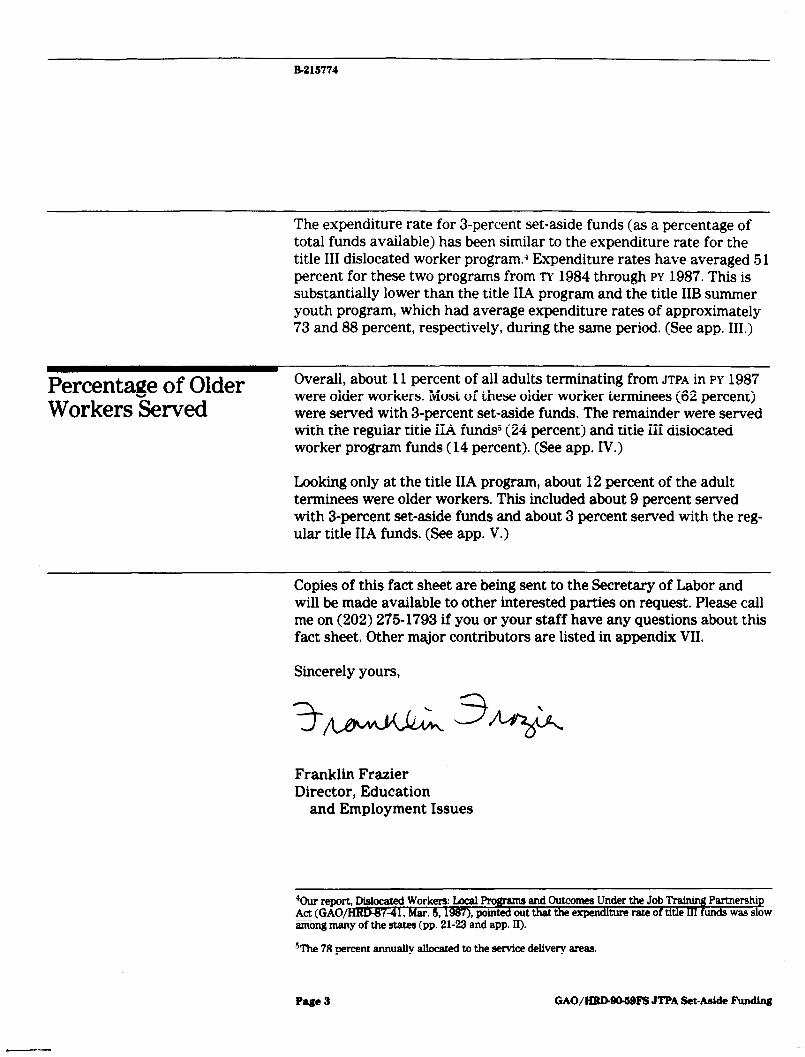
The expenditure rate for 3-percent set-aside funds (as a percentage of total funds available) has been similar to the expenditure rate for the title III dislocated worker program.’ Expenditure rates have averaged 5 1 percent for these two programs from TY 1984 through PY 1987. This is substantially lower than the title IIA program and the title IIB summer youth program, which had average expenditure rates of approximately 73 and 88 percent, respectively, during the same period. (See app. III,)
Percentage of Older Workers Served
Overall, about 11 percent of all adults terminating from JTPA in PY 1987 were older workers. Most of these older worker term&es (62 percent) were served with 3percent set-aside funds. The remainder were served with the regular title IL4 funds5 (24 percent) and title III dislocated worker program funds (14 percent). (See app. IV.)
Looking only at the title IIA program, about 12 percent of the adult terminees were older workers. This included about 9 percent served with 3-percent set-aside funds and about 3 percent served with the reg- ular title IIA funds. (See app. V.)
Copies of this fact sheet are being sent to the Secretary of Labor and will be made available to other interested parties on request. Please call me on (202) 275-1793 if you or your staff have any questions about this fact sheet. Other major contributors are listed in appendix VII.
Sincerely yours,
Franklin Frazier Director, Education
and Employment Issues
%ur report, Dislocated Workers: Local Program and Outcomes Under the Job Train@ Partnership Act (GAO--41 M 6 1987) ted out that the expenditure rate of title III funds was slow ximg many of the st&a;dp.‘Zl-23 A$tpp. II).
%te 78 percent annually abated to the service delivery areas.
Page 2 GAO/lZRLMO4BEs JTPA Set-Aside Funding
,--_

Contents
Letter
Appendix I Summary of State 3-Percent Set-Aside Expenditures as a Percentage of Total Funds Available
1
6
Appendix II State Allocations and Expenditures for 3-Percent Set-Aside Funds
8
Appendix III Comparison of Expenditure Rates by Funding Source
Appendix IV Total Older Workers Terminating From All JTPA Programs
Appendix V Older Workers Terminating From the Title IIA Program in Program Year 1987
22
P4e4 GAO/HEDSOWPS JTPA Set-Aaide PundSng

Contents
Appendix VI JTPA Title IIA Older Worker Terminees Served in Each State Using 3-Percent Funds
23
Appendix VII Major Contributors to This Fact Sheet
Tables Table II. 1: Transition Year 1984 8 Table 11.2: Program Year 1984 10 Table 11.3: Program Year 1985 12 Table 11.4: Program Year 1986 14 Table 11.5: Program Year 1987 16 Table 11.6: Program Year 1988 18 Table IV. 1: Program Year 1987 21 Table IV.2: Program Year 1986 21
Figure Figure 1: Three-Percent Set-Aside Fund Expenditure Rates
Abbreviations
JTPA Job Training Partnership Act PY program year TY transition year
GAO/HRDg@6BF?3 JTPA SetAside Funding

Appendix I
Summary of State 3-Percent Set-Aside . Expenditures as a Percentage of Total Funds Available
Figuresin percentages
stat. AL
E~~~nditun mte TY 1964 PY 1984 PY 198s PY 1988 PY 1987 PY 1988
15.9 56.5 73.6 67.5 71.8 848 AKa
24.;
. . . .
AZ 49.1 49.8 49.3 62.1 AR 77.1 82.0 83.5 94.4 95.1 85.6 CA 33.7 43.3 46.6 40.1 49.9 ii.5
co 32.0 28.7 34.8 53.5 56.9 58.1
CT 32.9 72.1 84.2 68.5 76.3 72.2 DE 75.2 62.5 49.8 44.0 49.8 54.7
DC 27.7 35.9 39.0 46.2 70.5 67.4
FL 3.5 53.2 62.8 55.7 49.1 49.5
GA 32.7 39.7 55.7 60.8 73.0 68.7
HI 2.5 46.6 87.5 66.1 74.5 89.6
ID 76.8 69.5 70.1 66.0 90.9 640 IL 41.5 55.3 56.9 71.0 78.5 75.1
IN 37.5 50.5 43.8 56.0 62.1 68.1 IA 24.9 35.4 46.7 80.7 81.7 74.5
KS 36.9 61.2 96.6 97.8 95.8 99.8 KY 2.7 10.0 8.6 41.0 71.6 69.0 LA 15.7 35.6 27.0 58.7 70.2 67.3 ME 46.9 66.8 85.8 66.7 81.4 71.1
MD 25.3 46.9 49.7 64.6 81.4 85.9
MA 0.0 30.6 54.6 61.9 75.4 61.3
MI 20.0 51.0 62.4 63.3 75.5 87.5
MN 57.7 51.8 42.6 63.7 64.7 63.3 MS 37.3 75.1 94.3 65.0 93.3 81.1
MO 25.1 77.7 74.6 65.8 85.3 91.6 MT 64.2 75.0 66.1 86.1 945 91.1
NE 29.2 75.6 64.3 96.9 93.3 91.4
NV 19.1 50.5 66.7 78.2 86.3 85.7 NH 0.0 58.0 56.9 22.5 43.2 37.0
NJ 28.7 42.4 52.8 55.5 77.7 66.4 NM' . . . . .
NY 23.6 46.6 70.8 72.1 64.1
NC 20.9 39.9 25.3 57.4 78.9 76.7
ND 7.9 50.4 67.1 74.1 71.9 75.4
OH 0.5 36.8 39.4 47.4 73.1 92.8
OK 13.8 40.4 52.6 56.6 55.9 56.4
OR 63.0 67.8 44.7 56.4 74.5 45.2
Page 6
(continued)
GAO/HpD9O458IT? JTPA Set-Aside F’unding

Appendix I Summary of State &Percent Set-bide Ehpendituree Y a PercentWe of Total Fbnde Available
stat. I-Y1984 PA 55.3 PA 85.1 RI 1.1 SC 9.9
SD 22.2 TN 3.6 TX 0.0 UT 37.4 VT 0.0 VA 31.0
WA 2.8 WV 20.6 WI 64.9
WY 6.8 Total 29.1
Exwnditure rat0 PY 1994 PY 198s PY 1986 PY 1987 PY 1999
53.9 54.1 57.5 66.2 69.0 91.8 87.6 84.2 995 109.6 60.7 80.2 79.4 61.3 555 23.7 46.0 53.0 71 2 76.1
17.5 la.5 39.2 38.0 42.9 30.0 49.1 49.0 63.4 65.7 34.1 46.1 56.7 66.9 62.8 48.5 51.2 62.5 90.6 75.8 33.1 57.5 76.6 83.1 90.3 53.3 82.5 85.2 80.3 77.5
50.1 63.4 63.3 58.5 50.2 17.5 46.9 62.0 67.3 95.1 52.0 63.0 91.1 80.8 72.4
27.9 41.7 30.7 34.3 58.8 47.2 54.0 50.6 68.5 69.6
%formatlon was not available from Alaska and New Mexico.
P4e 7 GAO/ERD8O.69~ JTPA Set-Aside FhdL4

Appendix II
State Allocations itnd Expenditures for 3-Percent Set-Aside F’unds
Tabk 11.1: Transition Year lW4
State AL AK 106 . .
AZ 492 119 242 AR 461 355 771
TY19S4 set aside
Funds Expmnditun expended rate
$1,005 $160 15.9<
CA 4,540 1.528 33.7
co 365 123 32.0 CT 425 140 32.9 DE 109 82 75.2 DC
IN
HI
FL
ID
GA
IL 1,152
146
131
432
41
3
277
37.5
2.5
1,484
176
52
135
3.5
76.8
659
2.242
261
931
32.7
41 5
IA 459 114 24.9 KS 239 88 36.9
KY 775 21 2.7 LA 664 135 15.7
ME 187 91 46.9
MD 682 172 25.3
MA 878 0 0
Ml 2,454 491 20.0
MN 562 324 577 MS 556 208 37.3
MO 601 201 25.1
MT 140 90 64.2
NE 150 44 29.2 NV 152 29 19.1
NH NJ NM
NY
115 1,237
247
3,012
0 355
.
717
0 28.7
.
23.8
NC 1,016 212 20.9 ND 106 a 7.9 .- OH
OK
OR
PA
2.326
267
572
2,212
12
40
475
1,222
0.5
13.8
83.0
55.3 (continued)
Page 8 GAO/llRBW6SPS JTPA S&Aside Funding

Appendix II State Allocations and Expenditure8 for %Percent Set-hide Fund6
State PR RI
SC SD
TN
TX UT
VT VA
WA
WV WI
WY
TOW
N 1984 Funds Expenditure set aside expended fate
1,488 1,267 85.1 168 2 11
659 65 99 106 23 22.2
961 35 3.6 1.864 0 0.0
203 76 37.4
106 0 0.0 728 226 31.0 910 25 2.8 411 85 20.6 a55 555 64.9 106 7 6.8
941,973 Sll,SOO 28.1%
aExcludes Alaska and New Mexico.
Page 8 GAO/EBDMMS~ JTPA Set-Aside Funding

Tablo 11.2: Program Year 1984
PY 1Bu Pnvku,
YW Funds Funds Exwtnditun state AL
sotrrkk C8ybVW avaihbk expanded w rate $1.372 $2.217 $1.253 565% ,---
AK 141 . . . .
~~ AZ 722 373 1,095 538 49 1
AR 556 106 662 543 62.0
CA 6,209 3,012 9,307 4.034 433 co 599 262 861 247 26.7 CT 510 206 795 573 72.1
DE 141 27 168 105 62.5 DC 185 107 292 105 35.9
FL 2,042 1,431 3,473 1,848 53.2
GA 1,101 578 1,679 666 39.7
HI 164 128 292 142 48.6 ID 237 41 278 193 69.5
IL 3,149 1,311 4,620 2,556 55.3
IN 1,405 720 2,125 1,073 50.5
IA 567 345 912 323 35.4 KS 357 151 608 311 61.2
KY 980 754 1,734 174 10.0
LA 1,139 725 1,864 667 35.8
ME 241 95 337 225 66.8
MD 819 510 1,328 650 48.9
MA 1,085 878 1,964 601 30.6 MI 3,118 1,963 5,081 2,594 51.0
MN 815 238 1,053 546 51.8 MS 729 350 1,078 810 75.1
MO 1,080 601 1,681 1,306 77.7
MT 180 50 231 175 75.8 NE 231 106 337 255 75.6
NV 224 123 347 175 50.5
NH 156 115 271 157 58.0 NJ 1,485 882 2,387 1,004 42.4 NM 342 247 . .
NY 3,704 2,295 5,999 2,914 48.;
NC 1,344 a04 2,147 856 39.9
ND 141 97 239 120 50.4
OH 3,081 2,314 4,607 1,697 36.8
OK 506 247 754 305 40.4 (contmued)
Page 10 GAo/HBD&M@Ps JTPA SctAstde Punding

Appe* II state 4illocatlons and Expenditares for Wetcent Set-hide Fund8
State
OR
Previous PY 1984 yew Fund8
set aside Fund8 Expenditure
carryover available expended rate 720 97 817 554 67 6 -. -
PA 3,085 990 4.075 2.196 539
PR 1,811 222 2,032 1,666 G
RI 234 166 400 243 607
SC 841 593 1.435 341 237 -- SD 141 82 '223 39 175
TN 1,318 946 2,265 679 30.0
TX 2,809 1,864 4,672 1,595 341
UT 277 127 405 196 48.5
VT 141 106 247 82 33.1
VA 970 502 1,471 704 53.3
WA 1,150 885 2,034 1,019 50.1
WV 643 326 969 169 175
WI 1,294
WY 141 Tow S&Ml
%xcludes Alaska and New Mexico.
300 1,595 829 52.0
99 240 67 27.9
$30,173 3sws3 $40,399 47.2%
Page 11 GA0/?IItD9069~ JTPA Set-Aside Funding

\ -*II state Auoatbnr and Ex.Pendilauw for 8Percent Set-A&it Fkmds
Table 11.3: Program Year 1985
State AL
AK
PnViOW PY 115 Fund,
set raid0 Y-f Funda Expenditure
carryover rvallabh exwnded rate $1,378 $983 $2,341 $1.723 7369
141 . . . .
AZ 650 557 1,207 601 49.6 AR 626 119 745 622 83.5 CA 6.026 6.221 12.247 5.709 46.6
co 539 .614 11153 401 348 CT 459 222 681 573 642 DE 141 63 204 102 49.6 oc 230 187 418 163 390
FL 2,058 1,625 3,683 2,312 62.6
GA 1,068 1,013 2,100 1,171 55.7
HI 173 150 323 283 87.5 ID 229 86 314 220 70.1
iL 3,105 2,179 5,284 3,112 58.9
IN 1,381 1,052 2.433 1,065 43.0
IA 645 589 1,134 530 46.7
KS 322 197 519 501 96.6
KY 1,093 1,560 2,653 234 8.8 IA 1,274 1,197 2,471 667 27.0
ME 256 112 370 317 65.8 MD 737 679 1,416 703 49.7
MA 977 1,382 2,339 1,278 546 Ml 3,034 2,487 5,521 3,444 62.4
MN 776 507 1,284 547 42.6
MS 811 269 1,080 1,018 943 MO 1,172 375 1,547 1,154 74.6
M-r 204 58 260 224 86.1
NE 208 82 290 245 64.3
NV 205 172 376 259 68.7
NH 141 114 255 150 58.9
NJ 139 1,383 2,732 1,443 52.8 NM 386 . . . . .._. --. NY 3.766 3.084 6,853 4.563 66.6
NC 1,238 1,291 2,529 639 25.3 ND 141 118 259 174 67.1
OH 2,966 3,764 6,733 2,650 39.4 OK 691 649 1,239 655 52.8
(continued)
Page 12 GAO/HRD#e@Rl JTPA Set-Aside Funding

b9e-n st8teAlloationeandExpenditara for 3-Perwnt set-A&e Funda
State OR
PA
PR
Al
Previous PY 1365 year Funds
set wide Funds Expenditure
carryover available expended rate 750 263 1,013 453 447
3,139 1,879 5,018 2,717 54 1
2,061 166 2,227 1,952 67 6
211 157 366 295 80.2 SC 757 1,094 1,851 652 46.0 SD 141 -- 184 325 60 18.5
TN 1,300 1,586 2,886 1,417 49.1
TX 2,968 3,077 6,046 2,907 46.1 UT 302 208 510 261 51.2
VT 141 165 308 176 57.5
VA 873 687 1,560 1,287 82.5 WA 1,205 1,015 2,220 1,407 63.4
WV 757 800 1,557 762 48.9
WI 1.165 766 1,931 1.602 03.0 WY
Tow
141 173 314 131 41.7
w&od7 $47,201 SlW12S 335,731 84.0%
aExcludes Alaska and New Mexico.
Page 13 GAO/ERDWS@PS JTPA Set-hide Funding
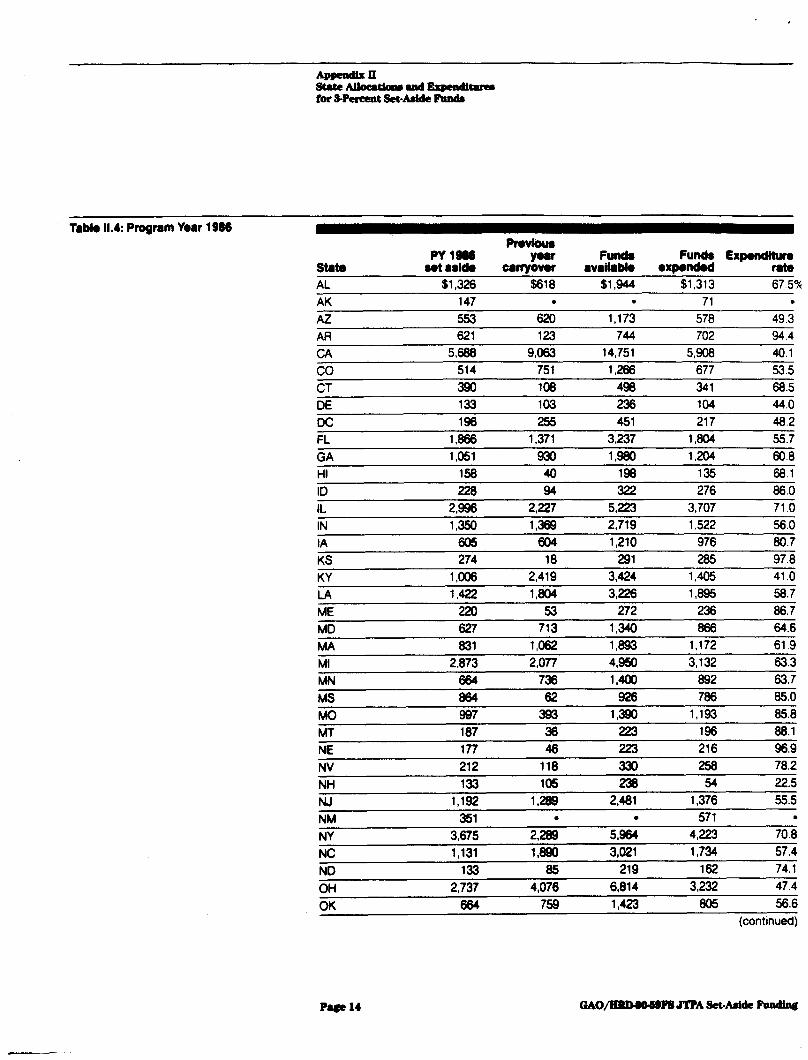
TabIe 1l.k Progmm Year 1886
SUtO AL AK
AZ AR
CA
co
CT DE
DC FL
pfwioua PY18.6 Y-r FIwrck Funds Expendiwe
set add. -rryovclr avaitable expended rate $1,326 $618 $1,944 $1,313 67.5%
147 . 71 .
553 62ci 1,173 578 49.3 621 123 744 702 94.4
5,688 9,063 14,751 5,906 40.1 514 751 1,266 677 53.5 390 108 498 341 68.5 133 103 238 104 44.0
196 255 451 217 48.2 1.886 1,371 3,237 1,804 55.7
GA 1,051 930 1,980 1,204 60.8 HI 158 40 198 135 68.1 ID 228 94 322 276 86.0 IL 2,996 2,227 5,223 3,707 71.0
IN 1,350 1,389 2,719 1,522 56.0 IA . 605 604
KS 274 -i8
1.210
'291
976 80.7
285 97.8
KY 1,008 2,419 3,424 1,405 41.0
LA 1,422 l,B04 3,226 1,895 58.7 ME 220 53 272 238 86.7 MD 627 713 1,340 888 64.6 MA 831 1,062 1,893 1,172 61.9 MI 2,873 2,077 4,960 3,132 63.3 MN 684 738 1.400 892 63.7 ._.. MS ii4 82 i28 786 85.0 MO 997 393 1,390 1,193 85.8 MT 187 38 223 196 88.1 NE 177 48 223 216 98.9 NV 212 118 330 256 78.2 NH 133 105 238 54 22.5 NJ 1,192 1289 2,481 1,376 55.5 NM 361 . . 571 . . _._. NY 3.675 2,289 70.8 NC 1,131 lit90
5,964 4,223 3,021 1,734 57.4
ND 133 85 219 162 74.1 OH 2,737 4,076 6,814 3232 47.4
OK 56.6 -. - 884 759 1,423 805
(continued)
Page 14 GAO/stuawmJTPAset-Aaide PlUMi&

state
OR PA
PR
RI SC
SD
TN
TX
Prewious PY1986 Y-r Funds Funds Expenditure
set asido cawyovor availabia expended rata 795 560 1,355 791 58 4
2,935 2,302 5,236 3,013 57 5
2,142 275 2,417 2,035 842
179 73 252 200 79 4 663 999 1,661 661 53.0
133 265 399 156 39.2
1,215 1,468 2,684 1,314 49.0
2.876 3,138 6,015 3.413 56.7
UT 276 249 525 328 62.5
VT 133 130 263 202 76.6
VA 790 273 1,063 906 85.2 WA 1,154 813 1.967 1,246 63.3 WV 743 796 1,539 954 62.0 WI 991 329 1,320 1,203 91.1
WY 133 163 316 97 30.7
Tow s62663 sso,lsa $103,011 660,320 56.6%
aExcludes Alaska and New Mexico.
Page 16 GAO~PS JTPA Set-Aside Funding
,-.-

Tablo 11.5: Program Year lW7
PY 1887 Prwlour
YOW Funds Funds Exrmnditum Strt. AL AK
sot l elda ccl+J6? available oxpmndad -c-------- -
rate $1,231 $631 $1,862 $1,338 71.8%
164 . . 54 .
AZ 631 616 1,247 804 644
AR 654 42 695 661 95.1
CA 5,633 8,843 14,476 7,226 49.9
co 612 569 1,201 708 58.9
CT 362 157 520 397 76.3
DE 138 132 270 134 49.8
DC 182 234 416 293 70.5
FL 1,811 1,432 3,244 1.594 49.1
GA 1,136 776 1,912 11395 73.0
HI 178 83 241 180 74.5
ID 285 45 310 282 90.9
IL 3,187 1,516 4,682 3,677 78.5
IN 1,254 1,196 2,450 1.523 62.1
IA 658 233 889 727 81.7 - KS 313 8 319 306 95.8
KY 1,187 2,019 3,207 2,297 71.6
LA 1,799 1,332 3,131 2,197 70.2
ME 204 38 240 196 81.4
MD 582 474 1,056 860 81.4
MA 772 721 1,493 1,125 75.4
MI 2,873 1,818 4,491 3,393 75.5
MN 713 508 1,221 790 64.7
MS 949 139 1,069 1,016 93.3
MO 926 1% 1,124 959 85.3
MT 208 26 236 223 94.5
NE 241 7 248 232 93.3
NV 215 72 287 248 86.3
NH 138 184 322 139 43.2
NJ 1,113 1,105 2,218 1,724 77.7 NM 439 . . 648 .
NY 3,604 1,951 5,555 4,005 72.1
NC 1,050 1,287 2,337 1,845 78.9
ND 138 57 194 140 71.9
OH 2,838 3,837 6,875 4,881 73.1
OK 759 617 1,376 769 55.9
(contmued)
P8ge 16 GAO/ERD&MBP8 JTPA Set-Aside F’unding

&we* n state Alloatlons and Expenditures for 3Percent Sethide Fund0
State OR
PA
Previous PY 1997 Funds Funds Expenditure
sot aside year
carryover available expended rate 760 564 1,32dr 986 74.5
2,726 2,224 4,949 3.274 66.2 PR 2,221 362 2,603 2,591 99.5 RI 167 52 218 134 61.3 SC 715 781 1,495 1,065 71.2 SD 138 243 380 144 380 TN 1,217 1,370 2,587 1,642 63.4 TX 4,003 2,602 6,605 4,417 66.9 UT 256 197 453 411 90.6 VT 138 62 199 166 83.1 VA 896 157 1,053 846 80.3 WA 1.072 721 1.793 1.049 58.5 WV 690 585 1,276 858 673 WI 980 117 1,098 866 80.8 WY 138 219 357 122 34.3 mar 954.451 942.177 997.628 999.971 59.5%
a&ludes Alaska and New Mexico.
Pye 17 GAO/lillDW6BEs JTPA !&et-Aside Funding

Trbh 11.6: Program Year 1988
PrOViOUa PY 19w YOW Fund8 Funds Expondltun
St8te set arid. carryover avaikbb ex6-ded rate AL 51,329 $525 $1,654 $1,572 84.8% AK 187 . . 120 .
AZ 749 444 1,192 741 62.1 AR 697 66 763 653 85.6 CA 5,433 7,250 12,683 6,532 51.5 co 866 493 1,359 789 58.1 CT 321 123 444 321 72.2 DE 135 135 271 148 54.7 DC 183 122 306 206 67.4 FL 1,840 1,650 3,490 1,728 49.5 GA 1.095 517 1.612 1.106 se.7 -. ,--- HI 157 71 &I 204 89.6 ID 291 28 320 269 84.0 IL 2,627 1,006 3,633 2,878 75.1 IN 1,110 928 2,038 1,387 66.1 IA 581 162 743 553 74.5 KS 315 14 328 328 99.8 KY 1,163 909 2,092 1,444 69.0 LA 1,975 934 2,908 1,956 67.3 ME 187 45 232 165 71.1 MD 535 285 800 687 85.9 MA 683 368 1,051 644 61.3 MI 2,463 1,099 3,562 3,115 87.5 MN 631 431 1.061 671 63.3 MS 1.051 73 1,123 911 81.1 MO -936 165 1,101 1,009 91.6 MT 218 13 229 208 91.1 NE 214 17 230 210 91.4 -- NV 191 43 233 200 85.7 NH 135 183 318 118 37.0 NJ 985 582 1,547 1,028 66.4 NM 473 . . 391 . _... NY 3.190 1,621 4,811 3,063 64.1 NC 932 492 1,424 1,092 76.7 ND 135 55 190 143 75.4 OH 2.636 474 3.110 2.865 92.8 -. . _.___ OK 869 608 1,478 833 56.4
(continued)
Pyc 18 GAO- JTPA Set-Aside F’unhg

State OR
PA
PR
Previous PYls88 year Funds Funds Expanditure
set asldo carfyover available expended rate
673 587 1,260 570 45.2
2,412 1,675 4,087 2,820 690
2,120 12 2,312 2,337 109.6
RI 147 85 232 129 55.5 SC 639 431 1,070 814 76.1
SD 135 236 371 159 42.9 TN 1,206 990 2,196 1,442 65.7
TX 4,926 2,166 7,113 4,469 62.8
UT 301 42 344 260 75.8
VT 135 34 169 152 90.3 VA 849 208 1,057 818 77.5
WA 1,163 776 1,939 973 50.2 WV 624 418 1,042 992 95.1
WI 935 211 1,146 830 72.4
WY 136 234
Tow 961,360 $3oAoa
aExcludes Alaska and New Mexico.
372 219 58.8
S81,3S3 $56,605 69.6%
Pye I@ GAO/EBDBMBR3 JTPA Set-A&de Funding

Ppe
*&~~~J%oII of Expenditure Ftates by mdingsource
Figures are percentages
Exoendlture rates FundIng source TYlg64 PYl664 PY 1666 PY 1966 PY 1667 Average Title IIA’ 67 70 72 76 78 73 Title IIW WA 86 85 90 91 88
Title Ill 39 48 48 64 58 51 3-oercent set-aside fundsC 28 47 54 59 69 51
aRepresents the expenditure rate for all title IlA funds, including 3-percent set-aside funds
&Title 118 funds are accounted for on a fiscal year rather than program year basis.
%ased on total funds available-annual Spercent albcation plus any carryover funds from pnor years
Page 20 GAO/liRDHMBFS JTPA SetAside Funding

Appendix IV
Total Older Workers Terminating From All JTFFA Progmms
Trble IV.1: Program Year 1667
Funding source Title HAa:
Older worker terminees Other adult Tot81 adult Number Percent terminees terminees
78-percent funds 16,226 24 431,305 447.531
3-percent funds 41,927 62 D 41.927
Title III 9,828 14 116.462 126.290
Total 67,661c 100 547,+674 615,746
Table 1V.z: Program Year 1666
Fundina source Older workor termlneer Other adult Total adult
Number Percent termlnees terminees Title IIA:
78-cwcent funds 14.304 22 419.214 433.518 I
3-percent funds 39,746 62 0 39.746 Title Ill 10,558 16 129,216 139,774
TOM 64&W 100 546,4306 613,036
Notes: Termrnees represent rndlvrduals whose partrcrpabon ended during the program year
Data on the number of older workers served with B-percent set-aside funds are not available
aSeventy-etght percent of these funds are for job training services to eligible mdivrduals. tncluding older workers, whereas 3 percent are speclfically set aside for older workers.
“AlI terminees served with 3-percent funds are assumed to be older workers
Qepresents 11 percent of total adult terminees.
%epresents 89 percent of total adult terminees
Page 21 GAO/liRlMMBPS JTPA Set-Aside Fbnding

Ppe
blzi Workers Termha- From the Title IIA Program in Program Yeax 1987
FundIng source
76-percent funds Z.-percent funds Tow
olduwor&or1~ Adult Poroent ot
twminoeo Numbu total 447,531 16,226 3 41,927 41,927= 9
499,499 99,192 12
“AlI terminees served with 3qercent funds are assumed to be older workers.
P8ge%? GAO/limMomPt3JTpA SetAdde Pundins

Appendix VI
JTPA Title IIA Older Worker Terminees Served in Each State Using 3-Percent Funds
stat0
AL
Number ot tormineos PY 19w PY 1987 PY 1999
1,363 1.326 1350
AK 60 140 82
AZ 287 539 669
AR 1,152 979 792
CA 2,765 2,986 3,090
co 623 1,293 1.003 CT 253 253 198 DE 87 104 92
DC 246 234 164
FL 1,239 1,190 1,303 GA 830 037 812 HI 114 111 132
IA 588 514 387
KS 503 409 486
KY 630 1.576 1.686
LA 714 1,139 859
ME 108 94 39 MD 410 327 335
MA 1,133 864 560
MI 1,759 1,563 1,863
MN 928 874 665
MS 1,069 1,087 867 MO 1,229 851 955
MT 102 102 90
NE 339 323 230 NV 152 156 155
NH 19 37 40 NJ 584 407 360 NM 265 254 201
NY 3,823 2,794 1,954
NC 1,582 1,832 1,249
ND 87 45 69
OH 1,464 2,051 2.002
OK 1,068 1,297 1,076
OR 365 467 340
PA 1,365 1,448 1,049
(contmued)
Pa@ es GAO/HRDBO-WFS JTPA Set-Aside Funding

JTPA Title M Older Worker Terndnew Served in Each State Usin &Percent Fun&
state Number of terminees
PY 1966. PY 1987 PY 1981 PR 484 1,014 72! RI 154 87 7; SC 501 721 63’
SD 42 135 114
TN 795 819 l.Ol! TX 2,966 3,083 3.19. UT 192 258 22r VT 156 147 15t VA 250 544 46: WA 683 590 53; WV 361 240 4oc WI 903 560 63C WY 33 46 6: lota tedneoa 40*187 42,292 28.221
Tow partio~bb 53,078 53,667 48,131
Qata on participation in the 3-percent set-aade program for older lndiwduals are not avallable for pert, ods before PY 1986.
bParticipants represent the number of individuals receiving services during a given program year. This number is higher than the number of terminaes due to the overlap of individual enrollments from one program year to another.
Pye 24 GAO/HRD-WWES JTPA Set-Aside Fundln

Appendix VII
Major Contibutors to This Fact Sheet
Human Resources Division,
Sigurd Nilsen, Assistant Director, (202) 52343701 Thomas N. Medvetz, Assignment Manager William J. Burrison, Evaluator
Washington, D.C.
(208142) Page 28 GAO,‘HRWMB8?3 XI’PA Set-Aside Pundhj


-. Requests for copies of GAO reports should be sent to:
--
I:.S. General Awounting Office Post Office Box 6015 Gaithersburg, Maryland 20877
The first five copies of each report arts free. Additional copies are $2.00 each.
There is a 25”~ discount on orders for 100 or more copies mailed to a singltb address.
Orders must be prepaid by cash or by check or monty order made
out to thtb Superintendent of Documrnts.