hpai risk analysis for west siberian lowlands/palearctic areas
TRANSCRIPT
HPAI Risk Analysis for West Siberian Lowlands/Palearctic Areas
-- Application of remote sensing with a focus on land surface temperature
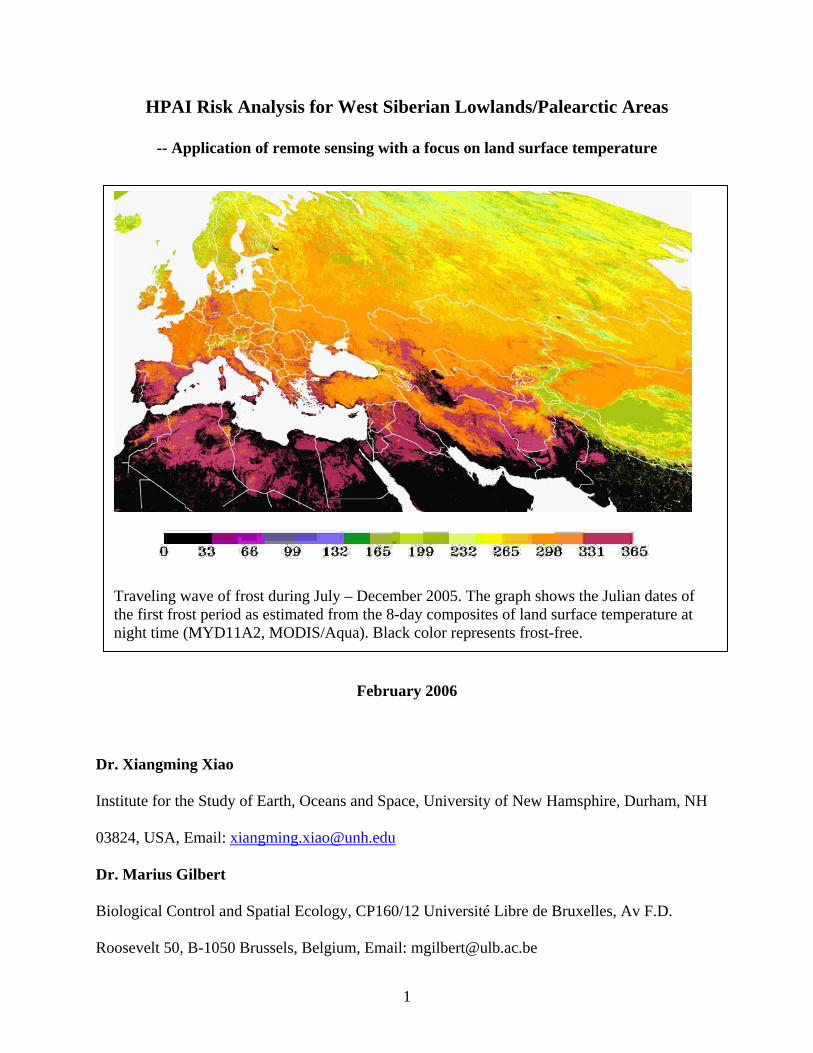
Traveling wave of frost during July – December 2005. The graph shows the Julian dates of the first frost period as estimated from the 8-day composites of land surface temperature at night time (MYD11A2, MODIS/Aqua). Black color represents frost-free.
February 2006
Dr. Xiangming Xiao
Institute for the Study of Earth, Oceans and Space, University of New Hamsphire, Durham, NH
03824, USA, Email: [email protected]
Dr. Marius Gilbert
Biological Control and Spatial Ecology, CP160/12 Université Libre de Bruxelles, Av F.D.
Roosevelt 50, B-1050 Brussels, Belgium, Email: [email protected]
1
Acknowledgement
We are grateful to Dr. Jan Slingenbergh (Animal Health Service, FAO) for his vision on the role
f remote sensing on studying of ecology of avian influenza virus. His critical thoughts, inputs
menech, J., Lubroth, J.,
artin, V., & Slingenbergh, J. (2006). HPAI spread from the western Siberian lowland to the
o
and thoughts are essential for the activities described in this report.
This report is linked with another report by Gilbert, M., Xiao, X., Do
M
eastern Mediterranean and beyond. Consultancy Report Prepared for FAO Animal Health
Division, Rome.
2
Table of Content
I. Term of References………………………………………………………………………….4
I. Introduction………………………………………………………………………………….5
II. MODIS-based estimates of land surface temperature……………………………………...7
III. Traveling wave of frost from nighttime land surface temperature………………………..9
IV. Traveling wave of heat from daytime land surface temperature…………………………11
V. Summary…………………………………………………………………………………..14
VI. Reference………………………………………………………………………………....16
VII. Appendix………………………………………………………………………………. .18
VII. Figures in the report……………………………………………………………………..19
3
Terms of Reference
Under the overall guidance of the Chief, Animal Health Service and in direct consultation and
collaboration with the Senior Officer responsible for environmental animal health, the contractor
will write a report on the application of Remote Sensing (RS) techniques for the clarification of
the role of surface temperature of the West Siberian Lowlands in the natural transmission cycle
of highly pathogenic avian influenza (HPAI) viruses in waterfowl. In particular, the incumbent
will:
-Provide a composite picture of and collate in a GIS environment the data contained in the West
Siberian Lowland (WSL) Peatland GIS Data Collection, relevant satellite imagery, in particular
decadal measures of land surface temperature of the WSL area, long term climatic data sets, fly
routes of waterfowl, and other environmental variables, as pertinent to addressing the following:
-traveling waves of temperature, respectively for zero, five and ten degrees Celsius from
the arctic circle down to Tropic of Cancer, stepwise depicting the subsequent decades running
from mid-July to mid-January;
- establish traveling waves of virus survival in water as per above area on a year-round
basis;
- produce raster layers on year-round HPAI virus survival in water (e.g. in each pixel the
number of consecutive days with temperature >13 degrees, 20 degrees and 30 degrees
respectively);
- carry out a sensitivity analysis assuming: i) cold-tolerance variability among viruses;
and ii) climate change predicted increase in ambient/surface temperatures;
- Produce electronic (2x) and hardcopy versions (2x) of all material produced, text and
GIS layers and maps, and submit to FAO Rome not later than 31 January 2006.
4
I. Introduction
Since late 2003 several East and Southeast Asia countries have experienced outbreaks of Highly
Pathogenic Avian Influenza (HPAI), or bird flu. Direct impacts in the affected countries include
the death of people infected by the H5N1 virus, mortality in poultry and birds culled for disease
control, and local and international trade of poultry and poultry products. HPAI outbreaks in
Southeast Asia have resulted in the death of 76 people (as of 10 January 2006) and nearly 140
million domestic poultry (WHO, 2005). In mid- to late 2005 HPAI outbreaks were also reported
in Russia and central Europe (Turkey), which raises the great concern for further spread into
Western Europe, Africa and North America.
The spatial patterns and temporal dynamics of HPAI outbreaks (Figure 1) in 2003-2005 pose a
great challenge to the epidemiological community, policy-makers, and the pubic. The
epidemiological community is at very early stage for understanding the ecology of HPAI, and
there is very limited information about the ecological relationships between HPAI and biological
and environmental factors, including wild birds, agriculture and domestic poultry production
systems.
Among many driving factors relevant to the HPAI transmission and persistence, land surface
temperature (LST) is one important environmental variable that affects migration pathways and
timing of wild waterfowls. It is well known that wild birds are a reservoir of low pathogenic
avian influenza (LPAI) (Alexander, 2000; Stallknecht & Shane, 1988). Recent studies suggested
that migratory wild birds may also carry HPAI virus (Liu et al., 2005), and thus spread HPAI
over long distance along their migratory pathways. Information on migration pathways and
5
timing of wild waterfowls will determine when and where wild waterfowls might interact with
domestic poultry, which potentially results in AI virus transmission between them. In addition,
land surface temperature also affect survival rate of AI virus. The time-span AI virus remains
infectious in water and faeces would affect probability of AI virus transmission in contaminated
water and land to domestic poultry.
In many earlier studies for such infectious diseases as malaria, thermal bands of the NOAA
AVHRR sensors have been used to estimate LST and the resultant LST data were then used for
studying ecology of infectious disease, risk assessment and early warning (Hay, Randolph &
Rogers, 2000; Rogers, Randolph, Snow & Hay, 2002). In 1999 NASA Earth Observing System
(EOS) launched the Terra satellite that carries the Moderate Resolution Imaging
Spectroradiometer (MODIS) sensor and other advanced optical sensors (MISR and ASTER). In
comparison to AVHRR sensors, the MODIS sensor offers improved capacity to estimate land
surface temperature for the globe (Wan, 1999; Wan, Zhang, Zhang & Li, 2004; Wan & Li, 1997;
Wan, Zhang, Zhang & Li, 2002).
The objective of this study is twofold: (1) to explore the spatial patterns and temporal dynamics
of MODIS-based land surface temperature, and (2) to assess the potential of MODIS-based land
surface temperature data for understanding ecology of HPAI and risk assessment of HPAI in
western Palearctic ecoregion, with a focus on how it might affect wild bird migration and AI
virus survival. The results of this study is linked to another FAO report that examined spatial
associations among HPAI outbreaks, traveling wave of frost and wild bird migration pathways
(Gilbert et al., 2006).
6
II. Description of MODIS-based land surface temperature data
II.1. MODIS sensor
MODIS is a key instrument aboard the Terra (EOS AM) and Aqua (EOS PM) satellites, as part
of the National Aeronautics and Space Administration (NASA) Earth Observing System (EOS).
MODIS sensor has 36 spectral bands ranging from 0.4 µm to 14.4 µm. Two spectral bands are
imaged at a nominal resolution of 250 m at nadir, with five bands at 500 m, and the remaining 29
bands at 1-km. MODIS/Terra and MODIS/Aqua acquire images for the entire globe every 1 to 2
days. MODIS/Terra satellite was launched on December 18, 1999, and for its orbit around the
Earth, Terra passes from north to south across the equator in the morning (around 10:30am) and
the evening (about 10:30pm). MODIS/Aqua satellite was launched on May 4, 2002, and Aqua
passes from south to north across the equator in the early afternoon (around 1:30pm) and the
evening (1:30am). Therefore both MODIS/Terra and MODIS/Aqua provide daytime and
nighttime observations of the Earth.
Both MODIS/Terra and MODIS/Aqua systems provide unprecedented data for improving our
understanding of land, oceans and the atmosphere. To facilitate the wide-use of MODIS data,
NASA Earth Observing System (EOS) set up four MODIS science discipline teams (atmosphere,
land, ocean and calibration). The land science team provides a suite of standard products to
users, including Land Surface Temperature (LST) product (Wan & Li, 1997), and Land Cover
product (Friedl et al., 2002). Detailed information about the science teams and data processing
procedure are described well at http://modis.gsfc.nasa.gov/ website.
7
II.2. LST algorithm
MODIS land Surface Temperature product is based on a generalized split-window LST
algorithm (Wan, 1999; Wan & Li, 1997). A pairs of MODIS daytime and nighttime
observations are used to generate daytime and nighttime LST, using a day/night LST algorithm.
The method yields 1 K accuracy for materials with known emissivities. The view angle
information is included in each LST product. The algorithm uses MODIS data (seven thermal
infrared bands) as input, including geo-location, radiance, cloud masking, atmospheric
temperature, water vapor, snow and land cover. In the Version 4 LST processing, LST retrieval
is made for lake and river pixels at clear-sky condition with a 66% and higher confidence defined
in cloud-mask MOD35 and for other land pixels in clear-sky at a 99% conference, in order to
improve the consistency between the spatial LST distribution over lakes and their surrounding
lands (Wan, 1999).
II.3. LST data used in this study
MODIS Land Science Team provides daily LST product (MOD11A1 for Terra and MYD11A1
for Aqua) and 8-day LST product (MOD11A2 for Terra, and MYD11A2 for Aqua). The 8-day
LST product is generated by averaging from two to eight days of the daily LST product,
dependent upon number of days with clear-sky condition. For each year, there are forty-six 8-
day LST composite products. MODIS daily and 8-day LST products are organized in tile
format, and each tile covers an area of ~1100 x 1100 km, with a spatial resolution of ~1 km
(actually 0.93 km). The data are in sinusoidal projection, and HDF-EOS format, and available
from USGS EROS Data Center (http://edcdaac.usgs.gov/dataproducts.asp)
8
The Palearctic ecoregion is the largest ecoregion in the world. In order to cover the entire
western Palearctic area as defined in this study (from 20oN to 70oN), we downloaded MODS 8-
day LST data (MODIS Version 4 Land Product, MOD11A2 and MYD11A2) from the USGS
EROS Data Center, for 9 by 5 tiles ranging from H17V02 to H25V06. We acquired LST data in
2004 and 2005, and ingested them at the http://remotesensing.unh.edu website.
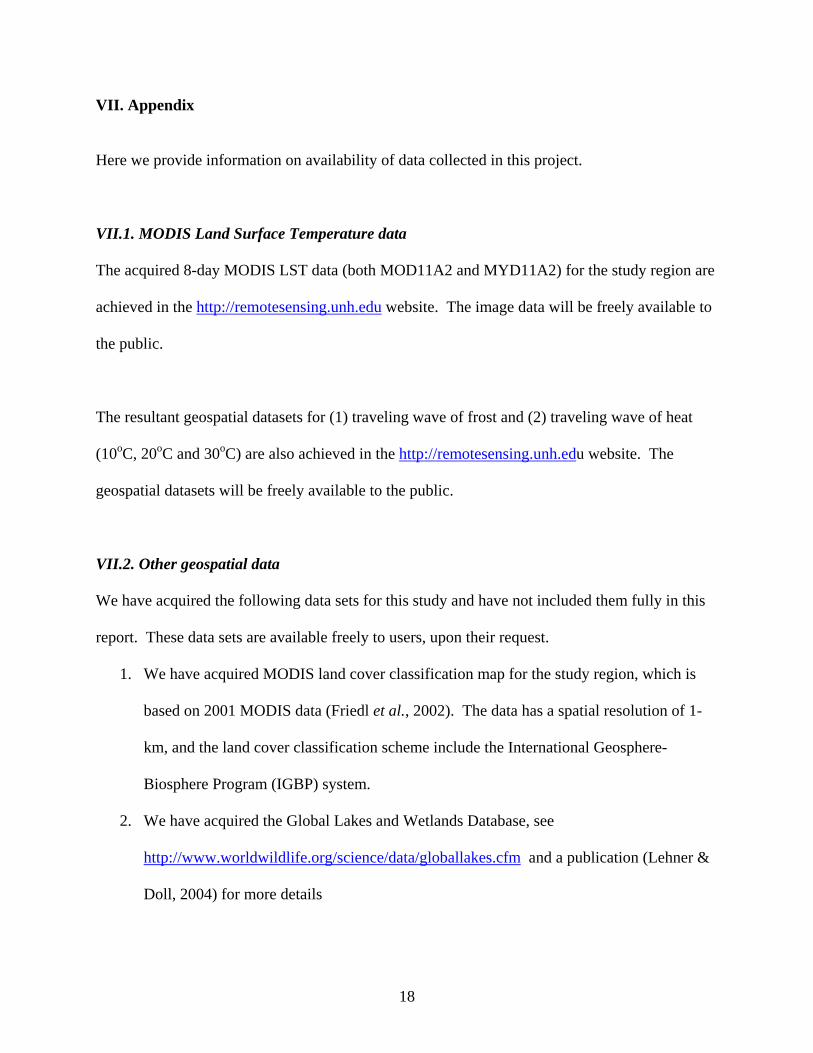
We first examined data quality of time series LST data for individual pixels in a year. Figure 2
shows temporal dynamic of daytime and nighttime LST in 2004 for a water pixel in Lake Baikal,
Siberia, Russia, which is the largest freshwater lake in Eurasia and world’s deepest lake, with a
maximum known depth of 1,742.2m. For the 8-day LST datasets many pixels still have poor-
quality observations (e.g., due to continuous cloud cover within one 8-day period) within a year,
therefore, we conducted gap-filling for those observations that are identified as poor-quality,
using an interpolation method with spline. The gap-filled LST data were used in the analysis of
LST spatial patterns and temporal dynamics in this study.
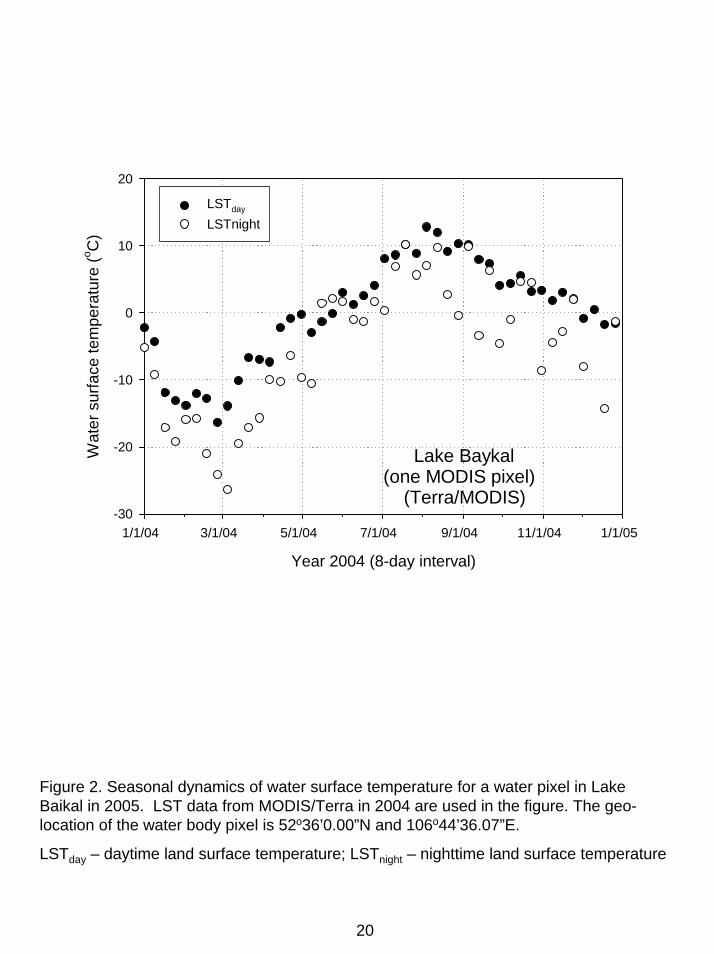
III. Traveling wave of frost from nighttime land surface temperature
As shown in Figure 2, consecutive frost period in fall season occurred in early September when
using nighttime (~10:30pm) LST data from MODIS/Terra, in December when using daytime
(~10:30am) LST data from MODIS/Terra, which suggests that one should use nighttime LST
data to characterize traveling wave of frost. In addition, note that temperature has a diurnal cycle
and the lowest temperature usually occurs in the morning before sun rises. The overpass time of
MODIS/Aqua in the night (about 1:30am) is later than the overpass time of MODIS/Terra in the
9

night (about 10:30pm), and therefore, it is better to use nighttime LST data from MODIS/Aqua
to characterize traveling wave of frost, if clear-sky condition exist.
In the fall season, traveling wave of the first frost (8-day period) in the western Palearctic
ecoregion shows a distinct spatial gradient from the western Siberian lowlands to the
Mediterranean (Figure 3a, 4a). Population of wild waterfowls is composed of individuals with
different ages, who are likely to have different capacities for tolerance of cold temperature and
thus different response strategies to frost. Part of Western Siberian Lowland experienced frost in
July, which triggers initiation of north to south migration of young wild birds to their moulting
sites to the south of Western Siberia Lowland. By late September to early October, most of
Western Siberia Lowland experienced the first frost over one 8-day period, and it is likely that
most migratory waterfowl there may start to move out their breeding sites and begin its long
journey to wintering sites in the south. In another related consultancy report to FAO (Gilbert et
al., 2006), geo-locations of HPAI outbreaks in 2005 were overlaid over the traveling wave of
frost in the fall season, and the resultant maps show that to large degree the spatial distribution
and timing of HPAI track well with the traveling wave of frost in the fall season.
In the spring season, traveling wave of the last frost (8-day period) in the western Palearctic
ecoregion also shows a distinct spatial gradient from the Mediterranean region to the western
Siberian lowland (Figure 3b, 4b). Rapid retreat of the frost line during April and May suggest
that this is the spring migration season for large number of wild birds moving towards the
Western Siberia Lowland. By late May to early June, the Western Siberia Lowland is mostly
frost-free and serves as major breeding sites for millions of wild birds. Spring migration may
10
potentially result in replenishment and transmission of AI virus at breeding sites. For example,
Lake Qinghai in China is one of the most important breeding sites for migratory birds that over-
winter in Southeast Asia, Tibet and India. A few birds were found dead on May 4, 2005 and by
the end of June more than a thousand birds were affected in the Lake Qinghai area (Liu et al.,
2005).
As wild birds start to migrate from south to north in the coming spring and summer, it would be
of interest to provide near-real-time LST data to users (including bird watchers) through internet.
LST information could then be used to study the spatial and temporal associations among LST,
migration of wild waterfowls and possibly HPAI in the spring/summer seasons.
IV. Traveling wave of heat from daytime land surface temperature
Surface temperature is important variable for the survival rate of AI virus. In another related
FAO consultancy report, Gilbert et al. presented a review on the literature data that related the
survival rate of AI virus in water and faeces to temperature (Gilbert et al., 2006). There are only
a few studies available that examined the effect of temperature in determining the survival of AI
virus. The limited number of studies showed that survival rate of AI virus in water and faeces is
affected by temperature (Stallknecht, Kearney, Shane & Zwank, 1990). The limited data
suggested that AI virus in (1) rice field water and (2) faeces and manure could survive about 5-
days or less when temperature is >30oC, and 10-days or less when temperature is >20oC (Gilbert
et al., 2006). However, AI virus in distillate water could survive from 125 to 207 days when
water temperature is at 17oC (Stallknecht, Shane, Kearney & Zwank, 1990). Several empirical
negative exponential models were developed based on the limited data to describe the
11
relationship between temperature and AI virus persistence (number of days), using the literature
data (Gilbert et al., 2006).
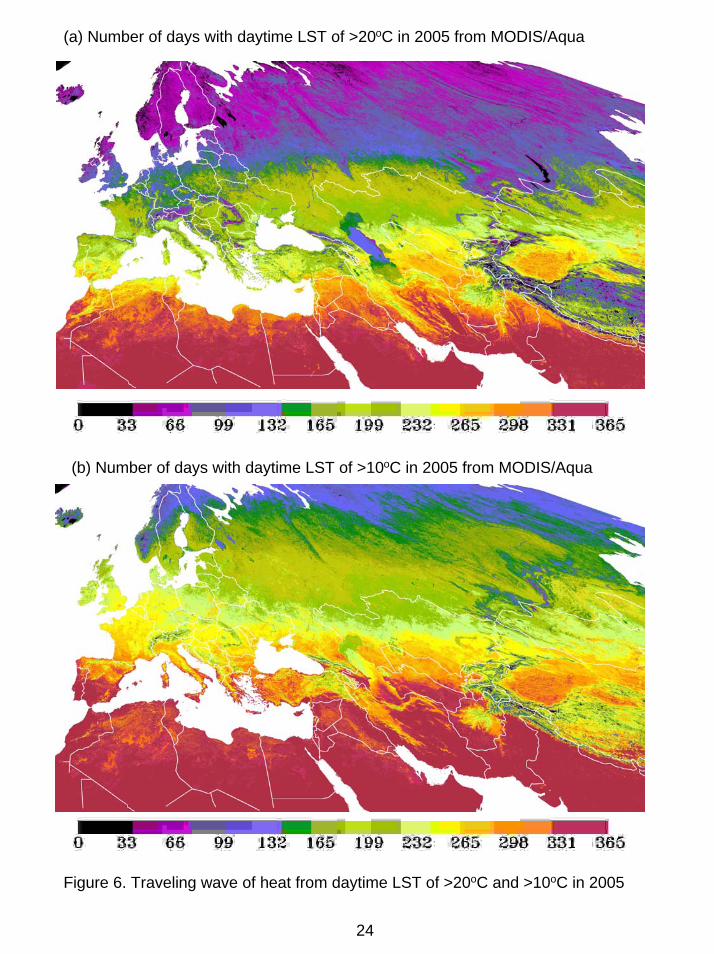
Using daytime LST data in 2005, we calculated number of days with LST >10oC, >20oC and
>30oC in a year for individual pixels (1-km resolution). Figure 5 shows spatial patterns of
traveling wave of heat (defined as the number of days with daytime LST >30oC) from
MODIS/Terra and MODIS/Aqua. The Western Siberian Lowland has very short-duration (~0 to
16 days) with daytime LST of >30oC (Figure 5), but much longer durations with daytime LST
>20oC (~90 to 120 days) and LST > 10oC (~150 to 180 days) (Figure 6). Note that the Western
Siberia Lowland is mainly characterized by swamps and forests as well as tundra in the north.
Water bodies (mostly in swamps) in the Western Siberian Lowland are generally clean with good
visibility (due to less mud). If the persistence of AI virus in distillate water (125-207 days at
17oC) is used, AI virus in the Western Siberia Lowland could probably survive over a year. In
comparison, to the south of Western Siberia Lowland, number of days with daytime LST > 30oC
in 2005 increased substantially, well above 100 days for most of the region (Figure 5), thus one
may assume that AI virus is likely to have short-period persistence (days) there. Countries
neighboring Turkey (it experienced multiple HPAI outbreaks in fall/winter 2005) in the south
and east (Iraq, Iran, Syria) generally have even longer periods with daytime LST of >30oC
(Figure 5), except the Tiger river basin where HPAI outbreaks were reported in January 2006. It
is interesting to note that HPAI outbreaks in July and August of 2005 (Russia and Kazakhstan)
were mostly located just south from the Western Siberia Lowland, where the number of days
with daytime LST of >30oC is over 100 days (see Figure 5, and Figure 1). One possible
explanation is the AI virus replenishment by migratory birds in later summer over the moulting
12
sites, and detailed discussion on migration flyways, breeding sites, moulting sites and over-
wintering sites of wild migratory waterfowls is presented in another FAO consultancy report
(Gilbert et al., 2006).
Surface temperature has a strong diurnal cycle, and highest temperature in a day usually occurs
in early afternoon (about 2-3pm). The overpass time of MODIS/Aqua in the day time is around
1:30pm, and the overpass time of MODIS/Terra in the day time is around 10:30am. The
comparison of Figure 5a and 5b shows that there are some differences in traveling wave of heat
between MODIS/Aqua and MODIS/Terra, therefore, it is better to use MODIS/Aqua images, if
clear-sky condition exists. In addition, the availability of both MODIS/Terra (10:30am,
10:30pm) and MODIS/Aqua (1:30am, 1:30pm) also opens the opportunity to better construct
diurnal dynamic of temperature, in combination with weather station data and reanalysis data
from climate models, which may further help the effort that explores the role of temperature in
migration and AI virus persistence.
It would be an interesting numeric exercise to run the empirical models described in the FAO
report (Gilbert et al., 2006) for large spatial regions. However, the literature review shows that
there are a large knowledge gap and uncertainty about the quantitative relationship between
temperature and AI virus (Gilbert et al., 2006). We felt that at this stage it is still premature to
directly employ LST data and a temperature-AI virus survival model to generate spatial maps of
AI virus survival rate, and report them in this FAO report. Further studies in AI epidemiology
are needed to address the relationship between LST and AI virus survival in a variety of complex
environmental settings.
13
V. Summary
This report highlights that land surface temperature in the western Palearctic ecoregion has
distinct spatial patterns and pronounced temporal dynamics in 2005. It clearly demonstrate the
improved capacity and potential of MODIS-based LST data for delineating traveling wave of
temperature, including both (1) frost events that might trigger migration timing of wild birds and
(2) heat wave (number of days with daytime LST of >30oC) that affects survival rate of AI virus
in the environment. As MODIS-based LST are available freely to the public, it is possible to
include LST data for near-real-time risk assessment and early warning of HPAI. This report,
together with another FAO report (Gilbert et al., 2006) demonstrates the potential of
incorporating LST (e.g., traveling wave of frost) to help understand the spread of HPAI in 2005
over the western Palearctic ecoregion.
HPAI outbreaks took place over large spatial domains (at present, Eurasia continent) but at
scattered specific locations and times (Figure 1). This suggests that one needs to characterize
local landscape and collect data for relevant ecological and environmental variables in near-real-
time and in a comprehensive (holistic) way, in order to explain why HPAI outbreaks occurred at
specific location and time. In addition to natural wetlands and migratory wild waterfowls, it is
necessary to map agricultural systems, as individual farmers are the decision-makers that manage
complex patterns and dynamics of agro-ecological landscapes, which might provide additional
habitats for wild birds and interact with wild birds. We are fortunate to live in the time that
substantial progress has recently been made in remote sensing and application of remote sensing
at moderate spatial resolution could provide updated geospatial datasets for a variety of
ecological and environmental variables at appropriate spatial/temporal scales that HPAI
14
transmission may operate. Such geospatial datasets are potentially useful for better
understanding ecology of HPAI. For example, it is now possible to map and monitor land cover
types, e.g., paddy rice agriculture, wetlands and land cover types, at temporal resolution that are
relevant to HPAI ecology (Friedl et al., 2002; Xiao et al., 2006; Xiao et al., 2005).
The future study for remote sensing application in risk assessment of HPAI should aim to
develop an integrated mapping and monitoring system that could simultaneously map seasonal
dynamic of croplands, wetlands, and land surface temperature at moderate spatial resolution and
at daily to weekly temporal resolution. Such satellite-based monitoring system should be further
linked with epidemiological models and decision support tools for near-real-time risk assessment
and identifying potential “hot spots (location-varying risk)” and “hot times (time-varying risk)”
of HPAI.
15
VI. Reference
Alexander, D.J. (2000). A review of avian influenza in different bird species. Veterinary
Microbiology, 74, 3-13.
Friedl, M.A., McIver, D.K., Hodges, J.C.F., Zhang, X.Y., Muchoney, D., Strahler, A.H.,
Woodcock, C.E., Gopal, S., Schneider, A., Cooper, A., Baccini, A., Gao, F., & Schaaf, C.
(2002). Global land cover mapping from MODIS: algorithms and early results. Remote
Sensing of Environment, 83, 287-302.
Gilbert, M., Xiao, X., Domenech, J., Lubroth, J., Martin, V., & Slingenbergh, J. (2006). HPAI
spread from the western Siberian lowland to the eastern Mediterranean and beyond.
Consultancy report for the Animal Health Division, Food and Agriculture Organization
of the United Nations, Rome, Italy.
Hay, S.I., Randolph, S.E., & Rogers, D.J. (2000) Remote Sensing and Geographical Information
Systems in Epidemiology Acadmic Press, Amsterdam, Boston.
Lehner, B. & Doll, P. (2004). Development and validation of a global database of lakes,
reservoirs and wetlands. Journal of Hydrology, 296, 1-22.
Liu, J., Xiao, H., Lei, F., Zhu, Q., Qin, K., Zhang, X.W., Zhang, X.L., Zhao, D., Wang, G., Feng,
Y., Ma, J., Liu, W., Wang, J., & Gao, G.F. (2005). Highly pathogenic H5N1 influenza
virus infection in migratory birds. Science, 309, 1206-1206.
Rogers, D.J., Randolph, S.E., Snow, R.W., & Hay, S.I. (2002). Satellite imagery in the study and
forecast of malaria. Nature, 415, 710-715.
Stallknecht, D.E., Kearney, M.T., Shane, S.M., & Zwank, P.J. (1990). Effects of Ph,
Temperature, and Salinity on Persistence of Avian Influenza-Viruses in Water. Avian
Diseases, 34, 412-418.
16
Stallknecht, D.E. & Shane, S.M. (1988). Host Range of Avian Influenza-Virus in Free-Living
Birds. Veterinary Research Communications, 12, 125-141.
Stallknecht, D.E., Shane, S.M., Kearney, M.T., & Zwank, P.J. (1990). Persistence of Avian
Influenza-Viruses in Water. Avian Diseases, 34, 406-411.
Wan, Z. (1999). MODIS Land-Surface Temperature Algorithm Theoretical Basis Document
(LST ATBD) Version 3.3. Institute for Computational Earth System Science, University
of California, Santa Barbara.
Wan, Z., Zhang, Y., Zhang, Q., & Li, Z.L. (2004). Quality assessment and validation of the
MODIS global land surface temperature. International Journal of Remote Sensing, 25,
261-274.
Wan, Z.M. & Li, Z.L. (1997). A physics-based algorithm for retrieving land-surface emissivity
and temperature from EOS/MODIS data. IEEE Transactions on Geoscience and Remote
Sensing, 35, 980-996.
Wan, Z.M., Zhang, Y.L., Zhang, Q.C., & Li, Z.L. (2002). Validation of the land-surface
temperature products retrieved from Terra Moderate Resolution Imaging
Spectroradiometer data. Remote Sensing of Environment, 83, 163-180.
WHO (2005). Avian Influenza: Assessing the pandemic threat. World Health Organization.
Xiao, X., Boles, S., Frolking, S., Li, C., Babu, Y.J., Salas, W., & Moore, B.I. (2006). Mapping
paddy rice agriculture in South and Southeast Asia using multi-temporal MODIS images.
Remote Sensing of Environment, 100, 95-113.
Xiao, X., Boles, S., Liu, J.Y., Zhuang, D.F., Frolking, S., Li, C.S., Salas, W., & Moore, B.
(2005). Mapping paddy rice agriculture in southern China using multi-temporal MODIS
images. Remote Sensing of Environment, 95, 480-492.
17
VII. Appendix
Here we provide information on availability of data collected in this project.
VII.1. MODIS Land Surface Temperature data
The acquired 8-day MODIS LST data (both MOD11A2 and MYD11A2) for the study region are
achieved in the http://remotesensing.unh.edu website. The image data will be freely available to
the public.
The resultant geospatial datasets for (1) traveling wave of frost and (2) traveling wave of heat
(10oC, 20oC and 30oC) are also achieved in the http://remotesensing.unh.edu website. The
geospatial datasets will be freely available to the public.
VII.2. Other geospatial data
We have acquired the following data sets for this study and have not included them fully in this
report. These data sets are available freely to users, upon their request.
1. We have acquired MODIS land cover classification map for the study region, which is
based on 2001 MODIS data (Friedl et al., 2002). The data has a spatial resolution of 1-
km, and the land cover classification scheme include the International Geosphere-
Biosphere Program (IGBP) system.
2. We have acquired the Global Lakes and Wetlands Database, see
http://www.worldwildlife.org/science/data/globallakes.cfm and a publication (Lehner &
Doll, 2004) for more details
18

Figure 1. The global distribution of HPAI outbreaks from 2003 to Jan. 2006 (from
GoogleEarth and Nature, see http://www.nature.com/nature/googleearth/avianflu1.kml)
19
Lake Baykal (one MODIS pixel) (Terra/MODIS)
Year 2004 (8-day interval)
1/1/04 3/1/04 5/1/04 7/1/04 9/1/04 11/1/04 1/1/05
Wat
er s
urfa
ce te
mpe
ratu
re (o C
)
-30
-20
-10
0
10
20
LSTday
LSTnight
Figure 2. Seasonal dynamics of water surface temperature for a water pixel in Lake Baikal in 2005. LST data from MODIS/Terra in 2004 are used in the figure. The geo-location of the water body pixel is 52o36’0.00”N and 106o44’36.07”E.
LSTday – daytime land surface temperature; LSTnight – nighttime land surface temperature
20

(a) Frost traveling wave - nighttime LST from MODIS/Terra in July – Dec. 2005
(b) Frost traveling wave – nighttime LST from MODIS/Terra in Jan – June 2005
Figure 3. Traveling wave of frost from nighttime LST in 2005 (MODIS/Terra). (a) the date of the first 8-day frost in July – December. (b) the date of the last 8-day frost in January – June
21
(a) Frost traveling wave- nighttime LST from MODIS/Aqua in July – Dec. 2005
b) Frost traveling wave - nighttime LST from MODIS/Aqua in Jan – June 2005
Figure 4. Traveling wave of frost from nighttime LST in 2005 (MODIS/Aqua), (a) the date of the first 8-day frost in July – December. (b) the date of the last 8-day frost in January – June.
22
(a) Number of days with daytime LST of >30oC in 2005 from MODIS/Terra
(b) Number of days with daytime LST of >30oC in 2005 from MODIS/Aqua
Figure 5. Traveling wave of heat from daytime LST of >30oC in 2005
23
(a) Number of days with daytime LST of >20oC in 2005 from MODIS/Aqua
(b) Number of days with daytime LST of >10oC in 2005 from MODIS/Aqua
Figure 6. Traveling wave of heat from daytime LST of >20oC and >10oC in 2005
24