hp storageworks enterprise virtual array eva – a tactical ... · hp storageworks enterprise...
TRANSCRIPT

HP StorageWorks Enterprise Virtual Array EVA – A tactical approach to performance problem diagnosis.
1

Overview..................................................................................................................... 3 The Tools .................................................................................................................... 4 Performance objects and possible bottlenecks............................................................ 4 Some Rules of the Road and discussion ..................................................................... 5 EVAperf commands.................................................................................................... 6 Friendly Names........................................................................................................... 6 Let’s get started........................................................................................................... 6 HP StorageWorks Enterprise Virtual Array – Using evaperf hps to identify elevated latency and investigate load balancing ....................................................................... 7 HP StorageWorks Enterprise Virtual Array – Using Command View EVAperf Controller Statistics (cs) to investigate controller load and balance........................... 9 HP StorageWorks Enterprise Virtual Array - Using evaperf vd to determine virtual disk to managing controller load balance. .................................................................. 9 HP StorageWorks Enterprise Virtual Array - Using Command View EVAperf Virtual Disk Group statistics (vdg) to determine which disk group is reporting elevated latency......................................................................................................... 10 HP StorageWorks Enterprise Virtual Array – Using evaperf pdg output to investigate possible disk group oversubscription. .................................................... 11 The Visualizer and Formatter ................................................................................... 12 StorageWorks Command View EVA – Using evaperf-tlviz-format.exe to prepare raw evaperf output for analysis................................................................................. 13 HP StorageWorks Enterprise Virtual Array – Using TLVIZ to analyze host port statistics..................................................................................................................... 15 HP StorageWorks Enterprise Virtual Array – Using TLViz to analyze controller statistics..................................................................................................................... 19 HP StorageWorks Enterprise Virtual Array – Using TLVIZ to analyze Virtual Disk Group Statistics......................................................................................................... 20 HP StorageWorks Enterprise Virtual Array – Using TLViz to analyze Physical Disk Group Statistics......................................................................................................... 24 HP StorageWorks Enterprise Virtual Array – Using TLViz to analyze Virtual Disk Statistics .................................................................................................................... 25
2
Overview Troubleshooting performance problems on Enterprise Virtual Arrays (EVA) can be a complex task. However, most performance problems are the result of several common conditions. These conditions, in no particular order are; proper sizing of disk groups; load or resource imbalances either internal or external to the EVA, and host access irregularities such as the use of non-optimal paths for access to EVA virtual disks. Performance is the result of work placed on the storage system and the resources available within the storage system to do that work. The work is expressed as Request per Second (req/s) or Mega Bytes per second (MB/s). Throughout this document ‘work’ will be referred to as Load. The response times are expressed as Latency in Milliseconds (ms), Latencies are reported by nearly every subsystem, physical and virtual, within the EVA storage system. Response times will be referenced as Latency. There are three methodologies or processes that meet different needs. Real time observations can be made using available tools interactively to determine immediately whether or not the storage system is reporting elevated latencies. Collecting, formatting and graphical display for analysis of performance data is more in depth and valuable for correlating loads and latencies as you traverse the storage system object counters. And Database analysis which is valuable for identifying and sorting loads and latencies for reference. This can be particularly useful when investigating the source of a load. The actions described in this document are intended to guide EVA storage managers through the applicable performance objects from the host ports, to the controllers, to the virtual disk group(s), virtual disks, physical disk group(s) and physical disks. Working from the host ports ‘back’ toward the physical components will help you first identify whether or not the storage system is reporting elevated latencies. And then aid in the discovery of which subsystem in particular is contributing to or reporting the latencies. The author’s experience is once a familiarity with the tools is established, experienced storage managers, using the available tools and reference material, can become proficient in the analysis of EVA performance data. And identify and solve most issues themselves. This guide is intended to establish that familiarity through the practical analysis of a single performance problem.
3

The Tools The publicly available tools are: Command View EVA EVAperf, Command View EVA tlviz-format.exe, TLVIZ.exe and evadata.mdb. Command View EVA EVAperf – ‘evaperf’ is a command line utility that can be invoked to monitor EVA performance objects interactively or capture output to files for formatting and analysis. EVAperf CLI commands are executed from the C:\Program Files\Hewlett-Packard\EVA Performance Monitor> directory, specific commands will be described later in this document. EVAperf-tlviz-format.exe – ‘the formatter’ is used to process the output of evaperf commands and create performance object specific files (TLVIZ-object.csv) that are graphically viewable using TLVIZ.exe. The formatter can also be used to further process evaperf output files by populating evadata.mdb for use within Microsoft Access TM.
The Visualizer is publicly available. There are two versions. From http://h71000.www7.hp.com/openvms/products/t4/ download TLViz v1.6-09 kit plus the TLViz v1.6-14 update. Install the v1.6-09 kit first then apply the v1.6-14 update. The v1.6-14 update has additional features that will be utilized in every example.
EVADATA.mdb – ‘the database’ is copied to the default EVA Performance Monitor directory when Command View EVA EVAPerf is installed on a management station or other system. This data is base populated by the formatter and is complete with preformed queries. Make a copy of this file and save it. Use of EVADATA.mdb is dependant on the installation of Microsoft access and will not be covered in detail.
Performance objects and possible bottlenecks Each component in any storage system has its limits. Those limits will be addressed in greater detail as the subsystems are examined. Within the EVA the major components that can become oversubscribed and contribute to performance problems are: Host Ports; Controllers; Interconnects; Disk Groups and Physical Disks. Reference Material: HP StorageWorks Command View EVA Users Guide – Chapter entitled Monitoring Array Performance HP StorageWorks Enterprise Virtual Array Configuration Best Practices specific to your array type. http://h71000.www7.hp.com/openvms/products/t4/ T4 and Friends TLVIZ downloads Performance analysis of the HP StorageWorks Enterprise Virtual Array storage systems using HP StorageWorks Command View EVAPerf ftp://ftp.compaq.com/pub/products/storageworks/whitepapers/5983-1674EN.pdf please download this document and keep it handy. To manage the size of this guide screenshots and definitions are kept to a minimum. It will be necessary to reference the content within often.
4

Some Rules of the Road and discussion Latencies – typically an array should be configured to provide 15ms read response times and under 5ms write response times. Writes are retired faster since by architecture in write back cache mode, the host is informed a write is complete once the write data is copied to the partner controller’s mirrored cache. Sustained latencies well in excess of these values may cause host applications to respond slow, report delays or time out. Sustained elevated latencies require analysis to determine the cause. When latency is mentioned throughout this document that term will refer to “sustained elevated latencies” Thou shall not chase spikes. Some reporting anomalies are possible. Spending too much time trying to identify the source of a single sample transient event (spike) is generally not productive and rarely leads to the isolation of a specific problem. Latency should be within goals 95% of the time (95th Percentile) for most applications. Always keep in mind even though the connection is fiber channel, it’s a virtual SCSI bus. The normal handshaking between the host and storage system conforms to SCSI protocol. Interference in the infrastructure between the host and storage can affect that processing and drive up the latencies reported by the EVA. It’s all about Loads and Latencies, work and the resources available to do the work. Load is the work, that work is expressed as Requests (Req/s) or MegaBytes per second (MB/sec). Loads are reported by Host Ports, Controllers, Virtual Disk Groups, Virtual Disks, Physical Disk Groups and Physical Disks. Latencies are the response times. Latencies are reported by the Host Ports, Virtual Disk Groups, Virtual Disks, Physical Disk Groups and Physical Disks as latency in milliseconds (/ms). Identifying when the work exceeds the resources is the goal of performance troubleshooting. Load balancing is KEY and applies throughout the storage system. A large percentage of performance problems are resolved by identifying and resolving load imbalances. Loads should be balanced at the host ports. I.E all available FP ports should share in the work inbound to the array. Load balancing within the array refers to the share of work directed to each controller. Balance the arrays internally such that near equal numbers of virtual disks are managed by each controller. An imbalance of virtual disks is a typical source of performance issues. You will be reminded to consider load balancing when specific objects are introduced. Practice and experiment with the tools.
5

EVAperf commands. There are many options available with the evaperf CLI. Experiment and utilize the help files. The author finds the following the most useful to identify and troubleshoot performance problems. Be sure the problem is evident when collecting evaperf output unless you are establishing a baseline or practicing.
Friendly Names Friendly names improve the readability of performance data. When fnames.conf is available, evaperf replaces UUID or internal object identifier with the Command View EVA Human readable object names within the output. It is especially useful when an excessive load is detected on a specific virtual disk. To create fnames.conf issue the following commands. Refer to the Command View EVA users guide specific to your version. prompt> evaperf fnh localhost username@localhost password: ****** prompt> evaperf fn Make sure the array is being actively managed by the management server on which you execute the evaperf fn commands. Create the fnames.conf file before you get started.
Let’s get started Some evaperf command output can be valuable when viewed interactively; these include Host Ports Statistics (hps), Controller Statistics (cs), Virtual Disk Group Statistics (vdg), Virtual Disk Statistics (vd) and Physical disk Group Statistics (pdg). This will be covered in the upcoming sections. After reviewing the interactive displays, the following questions should have answers. Is the EVA a contributing factor in the application performance problem? Is incoming load balanced across all available host ports? Are the latencies reported by all or a subset of host ports? Are the virtual disks balanced between the two controllers? Are the latencies confined to a specific disk group?
6

HP StorageWorks Enterprise Virtual Array – Using evaperf hps to identify elevated latency and investigate load balancing While the application issue is evident to the system owners you can quickly check whether or not the Host Port Statistics are reporting elevated latencies. This can be done interactively and may quickly help determine whether or not the storage system is the source of the problem. Enter prompt> evaperf hps –sz 5005-08B4-00B4-8990 –cont <CR>
The screen will refresh every second with the host port statistics. The output will display columns for: Name – the specific FP Port Reference Read Req/s – Load Read MB/s – Load Read Latency <ms> - Latency Write Req/s - Load Write Latency<ms> - Latency Av. Queue Depth – Reference Port WWN- this is the World Wide Port Name of the specified FP port, this is the address that is displayed on the switch port to which this Controller FP port is connected - Reference
7

Ctlr - this is the four digits of each controllers UUID (A or B/1 or 2) and is visible from Command View EVA - Reference Node – this is the friendly name of the array or WWNN of the array - Reference Questions to ask yourself as you observe the hps output: Are sustained elevated latencies evident in the display (Read Latency >15 ms or Write Latency > 5ms)? If not, the storage subsystem is not likely a source of the application slowness Are elevated sustained latencies reported on all host ports or a subset? Most EVAs are configured such that EVEN fabric ports connect to one fabric and ODD fabric ports connect to the other fabric. If only EVEN or ODD ports are reporting latencies check whether or not that subset of ports is the only ports reporting Load. If load latency is present on all host ports the source of the latencies is not likely host port related. If the load is balanced and the latencies are apparent from a subset of host ports connected to a single fabric, check the error counters on the switch ports with EVA and affected Host connections. If the affected hosts are on another switch pay particular attention to any ISL between the affected hosts and the storage system. Check whether or not the host ports reporting latencies are attached to one controller or the other. Refer to the Ctlr column in the output. If a single controller’s host ports are reporting elevated latency, that controller may be oversubscribed. If only EVEN or ODD ports are reporting load it is possible most or all IO load is inbound from a single fabric. Check that host systems are connected to both fabrics and host load balancing settings are configured to utilize both HBA. Consult operating system specific documentation for references to MPIO settings Are the sustained elevated latencies reported on reads or write? No conclusions can be drawn from this observation alone, but it will be important during more in depth analysis. Is the load, MB/sec within the capacity of the host port (180MB/sec 2Gb/sec or 360MB/sec for 4Gb). The host port itself has limits, make sure the host ports reporting latency are not oversubscribed. Do some quick mental math and add Read MB/sec and Write MB/sec for any given host port. If a host port is in use by Continuous Access EVA additional load not reported by hps is possible. This will be covered in the DRT review.
8

After reviewing the host port statistics you should have an understanding of host port loads and latencies and whether or not a pattern is evident. Keep any pattern in mind as you explore further. If elevated latencies are present and no obvious load balancing issues or port oversubscription is evident the Controller Statistics can be monitored.
HP StorageWorks Enterprise Virtual Array – Using Command View EVAperf Controller Statistics (cs) to investigate controller load and balance The output of this command is self explanatory. prompt> evaperf cs –cont –sz 5005-08B4-00B4-8990 The output is simple. Compare the CPU Percentage of the two controllers to determine if one controller reports obviously higher percentage. If there is an imbalance in CPU percentage, investigate the load balancing of virtual disks relative to the managing controller. See HP StorageWorks Enterprise Virtual array - Using evaperf vd to determine virtual disk managing controller
HP StorageWorks Enterprise Virtual Array - Using evaperf vd to determine virtual disk to managing controller load balance. Command view EVA can be used to determine the managing controller for any given virtual disk by examining the Presentation Tab. But on larger storage systems this task can be time consuming. Command view EVA evaperf vd output can be used to quickly determine the balance. The command output can be redirected to an output file and searched using simple dos commands. prompt> evaperf vd –sz 5005-08B4-00B4-8990 -csv > vdisk_online.txt prompt> find /c “A,Yes” vdisk_online.txt ---------- VDISK_ONLINE.TXT: 40 prompt> find /c “B,Yes” vdisk_online.txt ---------- VDISK_ONLINE.TXT: 24 Since both controllers report virtual disk statistics, each virtual disk is counted twice. So one half of the total reported is the actual number of virtual disks online to each controller.
9
Are the virtual disks evenly balanced? Further analysis of this static file in not useful. If a good balance is apparent determine whether or not the elevated latencies are specific to a single disk group using HP StorageWorks Enterprise Virtual Array - UsingCommand View EVAperf Virtual Disk Group statistics (vdg) to determine which disk group is reporting elevated latency.
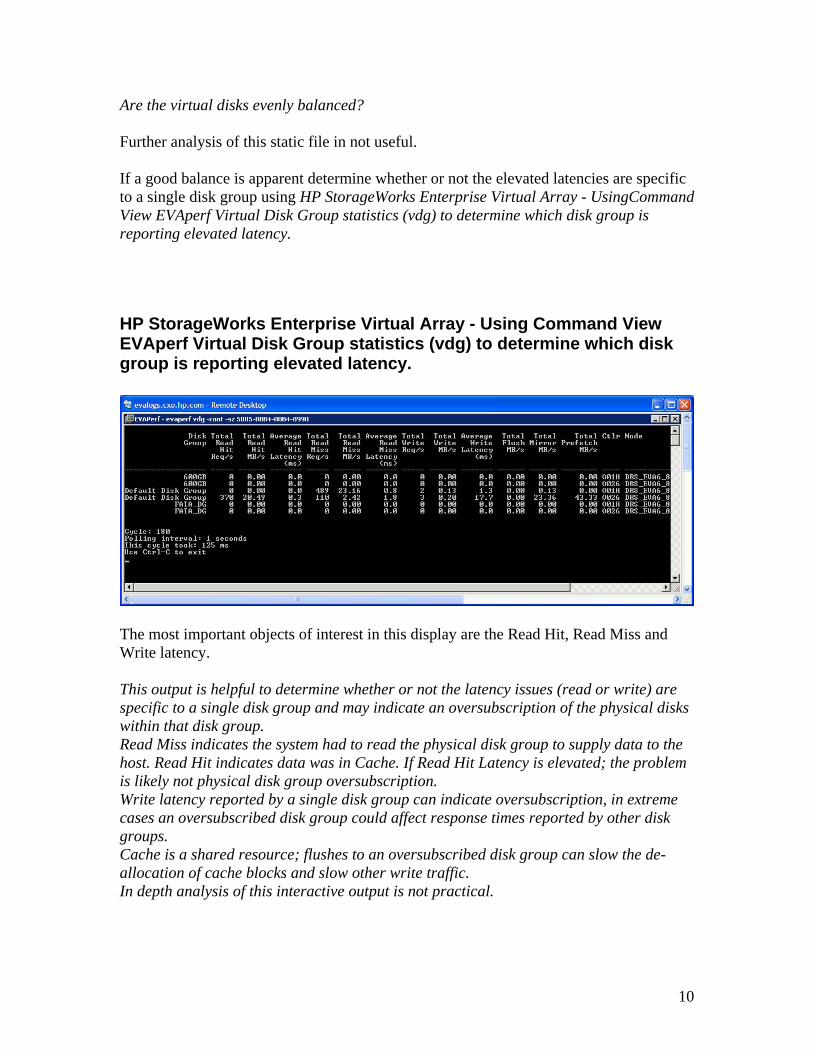
HP StorageWorks Enterprise Virtual Array - Using Command View EVAperf Virtual Disk Group statistics (vdg) to determine which disk group is reporting elevated latency.
The most important objects of interest in this display are the Read Hit, Read Miss and Write latency. This output is helpful to determine whether or not the latency issues (read or write) are specific to a single disk group and may indicate an oversubscription of the physical disks within that disk group. Read Miss indicates the system had to read the physical disk group to supply data to the host. Read Hit indicates data was in Cache. If Read Hit Latency is elevated; the problem is likely not physical disk group oversubscription. Write latency reported by a single disk group can indicate oversubscription, in extreme cases an oversubscribed disk group could affect response times reported by other disk groups. Cache is a shared resource; flushes to an oversubscribed disk group can slow the de-allocation of cache blocks and slow other write traffic. In depth analysis of this interactive output is not practical.
10

HP StorageWorks Enterprise Virtual Array – Using evaperf pdg output to investigate possible disk group oversubscription. While the application issue is evident use the following command to observe the statistics reported by the physical disk groups. prompt> evaperf –pdg –cont –sz 5005-08B4-00B4-8990
The output of this command is the averages of the individual physical disks in the various disk groups. Each controller will report statistics for each disk group. The key indicator of disk group over subscription is a sustained queue depth (the first column) above 2. If the display toggles between 2 and 3, the group is not necessarily oversubscribed. If it is consistently above 3 toggling to higher values more in depth investigation may be required. Pay attention to the controller reporting elevated queue depths; it can be a load balancing indicator. The rotational speeds of physical disks affect performance. A 15K RPM drive performs roughly 30% better than a 10K RPM drive. Some mental math is possible add both controllers read and write loads (req/s or MB/sec) together to get an idea of the average load on the spindles. It is not practical to come to firm conclusions using this data interactively. By now, using just the interactive commands you should be able to answer the following questions: Is the EVA a contributing factor in the application performance problem? Is incoming load balanced across all available host ports? Are the latencies reported by all or a subset of host ports? Are the virtual disks balanced between the two controllers? Are the latencies confined to a specific disk group? Is there evidence of oversubscription of a specific disk group?
11

The Visualizer and Formatter As described on the T4 and friends web site. TLViz is a time-saving interactive application that runs on Microsoft Windows systems. TLViz accepts T4-style formatted CSV files as input. With TLViz you can look at complex performance time-series histories containing hundreds or even thousands of variables. TLViz lets you look at individual metrics one at a time in rapid succession, or quickly look at the relationship between two or more metrics. TLViz also includes special built-in capabilities for comparing before-and-after behaviors. This guide will introduce you to the most common methods useful when analyzing EVA performance data. The EVA reports on what can appear to be an overwhelming number of statistics. But most analysis requires only a portion of those statistics be visible. Can you guess? That’s right Loads and Latencies. The most frequently used functions within TLViz will be introduced. Those functions allow you to remove objects from the current view and create your own objects. The mechanics of the tools can hinder the flow of analysis until practice raises your comfort level with the tools. The following process is a suggested path until you become more proficient. I will guide through the most useful views and suggest you snap an image of the screen, paste it into a document and move on to the next object and repeat the process. This way you can get through the mechanics and get some mechanical practice. Then review the screens in the same order we reviewed the interactive data from the host ports back toward the physical disks to determine which subsystems are or are not reporting latency and determine why those subsystems are reporting latency. To continue with in depth analysis the following commands can be used to collect the data in a form the formatter accepts. prompt> evaperf rc WWN-Of-The-Array – this command clears misleading cumulative counters prompt> evaperf all –cont –dur 3600 –ts2 –csv –sz WWNN > filename.txt. The command above will collect all evaperf counters once a second for 1 hour and log the output to filename.txt.
12

StorageWorks Command View EVA – Using evaperf-tlviz-format.exe to prepare raw evaperf output for analysis The formatter is installed as part of the Command View EVA installation process. Launch the formatter (C:\Program Files\Hewlett-Packard\EVA Performance Monitor\evaperf-tlviz.format.exe) by double-clicking on the program name or invoking it from the command prompt> evaperf-tlviz-format. A simple graphical interface opens. Use the browse button and select the evaperf output file, select the file and click open.
13
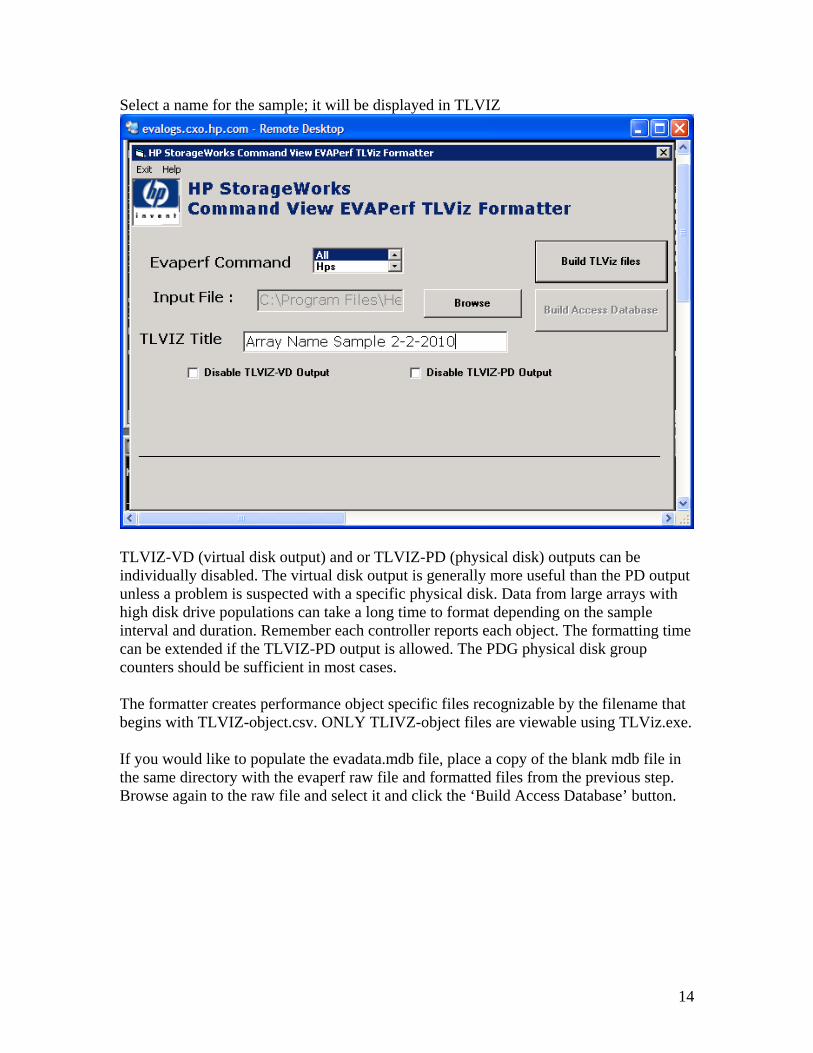
Select a name for the sample; it will be displayed in TLVIZ
TLVIZ-VD (virtual disk output) and or TLVIZ-PD (physical disk) outputs can be individually disabled. The virtual disk output is generally more useful than the PD output unless a problem is suspected with a specific physical disk. Data from large arrays with high disk drive populations can take a long time to format depending on the sample interval and duration. Remember each controller reports each object. The formatting time can be extended if the TLVIZ-PD output is allowed. The PDG physical disk group counters should be sufficient in most cases. The formatter creates performance object specific files recognizable by the filename that begins with TLVIZ-object.csv. ONLY TLIVZ-object files are viewable using TLViz.exe. If you would like to populate the evadata.mdb file, place a copy of the blank mdb file in the same directory with the evaperf raw file and formatted files from the previous step. Browse again to the raw file and select it and click the ‘Build Access Database’ button.
14

HP StorageWorks Enterprise Virtual Array – Using TLVIZ to analyze host port statistics. Click on or open via CLI tlviz.exe. Under file Open, select the object file of choice. For this example we will use TLVIZ-HPS.CSV.
15

TLViz will display what appears at first to be an impossible number of objects on the left hand side of the Display. The list of objects can be easily reduced to only the items of interest using the Modify Item List dropdown menu. This drop down can be used to: Remove Items with Zero Values* used nearly always Remove Selected Item(s) Remove Item(s) Not Selected Remove Item(s) containing string* (disk groups, ctrl, vdisks) filter OUT objects of Remove Item(s) NOT containing string* (used to drill down TO loads, latency) Sort in Alphabetical Order List Items in Original Order Revert to Previous Item List* (take a step back from the last filter) *Denotes regularly used functions get used to them. The Modify Item list is useful to filter the sample to gain a specific view of objects of interest, keep in mind Loads (MB/s and Req/s) and Latencies; you have to be tired of hearing this by now. The up and down arrows on your keyboard can be used to scan the object list. The Shift key can be used to select a range of consecutive objects.
16

The Ctrl key, when held down, allows selection of multiple nonconsecutive objects. When multiple items are selected, the STACK button in the user interface will SUM the selected counters. The checkboxes displayed next to the object names below the graphs can be used to remove and re-add a given object to the display. This is useful to determine the aggregate load on a resource such as an FP port. Select Read MB/sec and Write MB/sec for a given port and click stack to see the total MB/sec traversing that host port. Be sure to UNSTACK when you change objects!
17

Next Remove Item(s) Not Containing String [latency] to inspect the latency both read and write for each represented object.
Keep in mind to look for patterns. Are the latencies evenly distributed across all host ports, even or odd ports or perhaps single controller? If latencies are evident and there are no apparent causes specific to the host port loads a review of the virtual disk group statistics is necessary. Note in this example some counters are missing because those objects had Zero Values. (In this example, the elevated latencies happened to be Write Latency) Next use the Modify Item List to Revert to Previous Item list which will restore the list to all of the non-zero objects. Then use the Modify Item List to Remove Item(s) not containing [MB or Req] to view the LOADS on each host port. Look for patterns. Is the load balanced across the FP ports evenly? Do any ports appear to be oversubscribed? If there is no obvious imbalance or oversubscription is visible, a review of the Virtual Disk Group statistics is necessary. In this sample we know there are sustained write latencies between ~10:55 and 11:05am. The latencies are not specific to a single host port or processor.
18

Filter to and capture screenshots of all host port: Read MB/sec, Write MB/sec, Read Latency and Write Latency for reference and Close the TLVIZ-hps.csv Close TLVIZ-HPS.CSV Unless you explicitly close the object file, TLVIZ will try to reopen it even if you select another object file.
HP StorageWorks Enterprise Virtual Array – Using TLViz to analyze controller statistics. Open the TLVIZ-cs.csv file. Snap a screenshot. Usually a quick glance at Percent CPU for each controller will tell you all you need to know. If there is a significant imbalance in CPU percentage, investigate the load balancing of virtual disks relative to the managing controller. See HP StorageWorks Enterprise Virtual array - Using evaperf vd to determine virtual disk managing controller. Close TLVIZ-cs.csv
19

HP StorageWorks Enterprise Virtual Array – Using TLVIZ to analyze Virtual Disk Group Statistics Open the TLVIZ-vdg.csv file. Use the modify list items menu to remove Items with Zero Values Use the modify list items menu to remove Items NOT containing [latency] Use the arrow keys, Ctrl+Shift or Ctrl+click navigate the output
Are elevated latencies apparent in the graphs? Are the elevated latencies Read, ReadMiss or Write? Are the elevated latencies specific to a single disk group? Review TotBackEndReq this is the total of the work sent to the physical disks. Start thinking about does the work parallel the latencies? Snap a screenshot of any latencies of interest and copy it to your document. Revert to Previous Item List From the Modify Item List, Remove Items NOT containing [Req] Other approaches: Modify Item List, Remove Items NOT containing [name of disk group] With this view, the Loads AND Latencies for a given disk group of interest are visible.
20
Does the selected disk group report latencies? Do those latencies correlate to loads reported by the selected disk group? Pay particular attention to TotBackEndReq this is the total of the work sent to the physical disks Snap screenshots of any views of interest and save them in your document
Important note: Use the HP StorageWorks Enterprise Virtual Array storage systems using HP StorageWorks Command View EVAPerf software tool for definitions of all the objects in this data set. ________________________________________________________________________ This output is helpful to determine whether or not the latency issues (read or write) are specific to a single disk group and may indicate an oversubscription of the physical disks within that disk group. Read Miss indicates the system had to read the physical disk group to supply data to the host. Read Hit indicates data was in Cache. Write latency is the time it takes the array to both caches and Acknowledge the host write. Cache is a shared resource; flushes to an oversubscribed disk group can slow the deallocation of write cache blocks and slow other write traffic. The Virtual disk group statistics is a good place to introduce Add New Item to List Box feature of TLVIZ. Like the Stack Button, it can be used to sum selected objects. The graphical view is more viewer friendly than the Stack view. We’ll use TotBackEndReq as an example. From the Options menu select Add New Item To List box. Click on TotBackEndReq for the first controller (o01H) and Select Source item #1 Selected the Add Operator Click on TotBackEndReq for the first controller (o026) and Select Source item #2 Create a Name for the New Item Click Do it. The New Item will be displayed in the Item List and can be viewed like any other object.
21
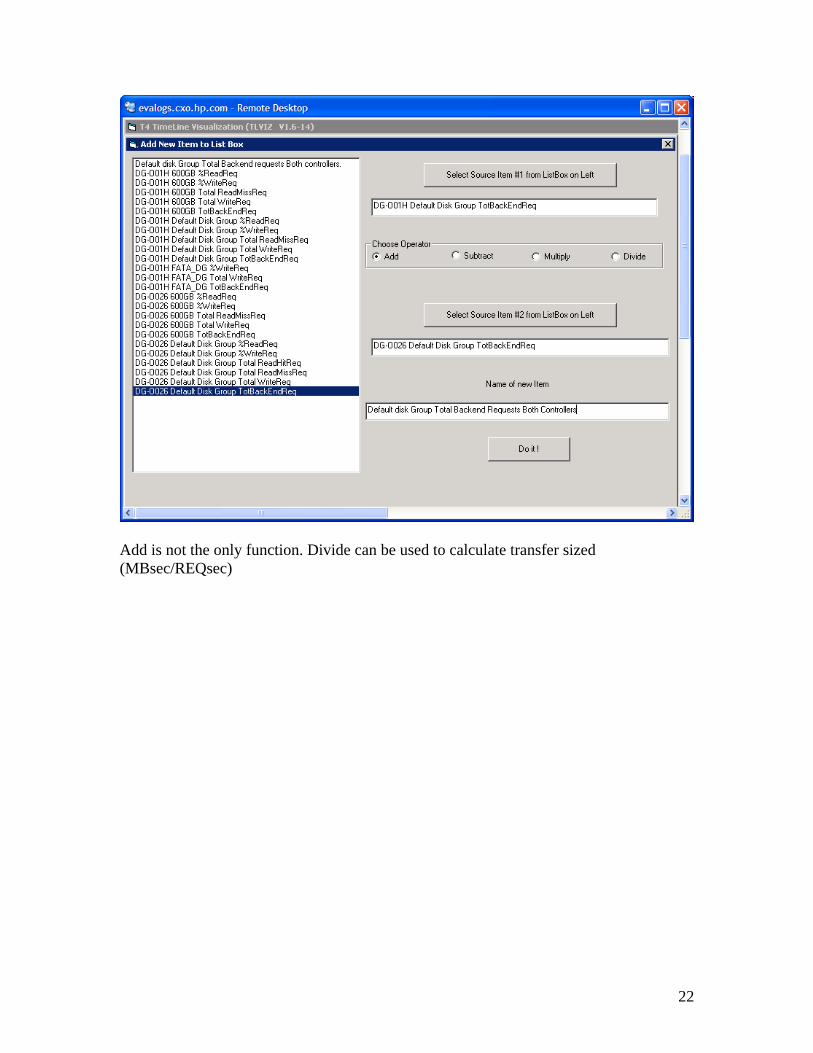
Add is not the only function. Divide can be used to calculate transfer sized (MBsec/REQsec)
22
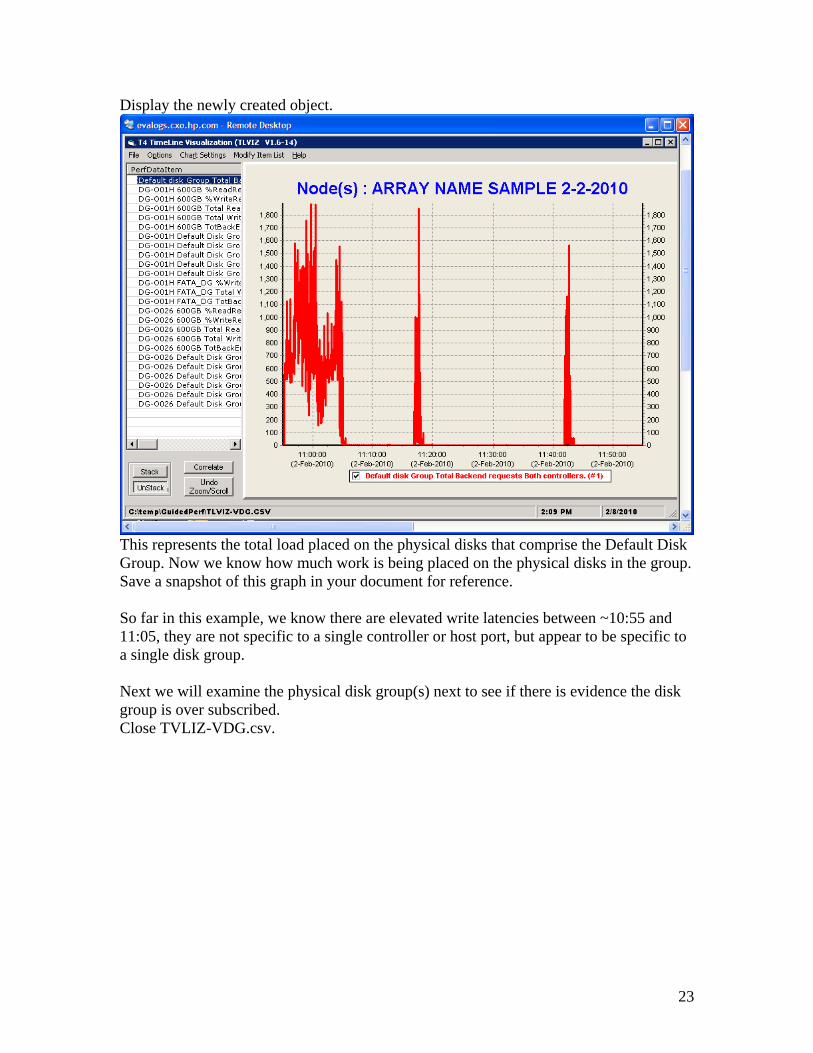
Display the newly created object.
This represents the total load placed on the physical disks that comprise the Default Disk Group. Now we know how much work is being placed on the physical disks in the group. Save a snapshot of this graph in your document for reference. So far in this example, we know there are elevated write latencies between ~10:55 and 11:05, they are not specific to a single controller or host port, but appear to be specific to a single disk group. Next we will examine the physical disk group(s) next to see if there is evidence the disk group is over subscribed. Close TVLIZ-VDG.csv.
23

HP StorageWorks Enterprise Virtual Array – Using TLViz to analyze Physical Disk Group Statistics Open TLVIZ-PDG.csv Remove Items with Zero values Remove items not contain [queue]
Remember the discussion about queue depths on physical disks? They need to be kept under 2 in order for the array to deliver satisfactory response time. This sample reflects sustained queue depths above 2, with some very obvious spikes. The spikes skew the sustained queue depths between 10:55 and 11:05, but it is easy to tell the stay above 2. This is a good place to become familiar with some more settings. Experiment with the chart settings; Primary Line Width, this example used a line width of one for image clarity), 2D/3D if you want to spruce up your reports. Now we know there are sustained write latencies, they are not specific to a single host port or controller, they are specific to a single disk group and that disk group appears to be oversubscribed. So in a nutshell we have a load that appears to be contributing to the latency. The next question is “who is responsible for this load?” Snap any screenshots of your data that might be useful. Close TLVIZ-PDG.CSV.
24

HP StorageWorks Enterprise Virtual Array – Using TLViz to analyze Virtual Disk Statistics TLVIZ has limits as to how much data can be displayed. If the objects exceed the program’s ability to display the entire sample, the formatter divides the file into manageable parts. This will be evident by a dash –n filename. The parts will span different portions of the sample relative to time. This condition is normally limited to Virtual and Physical disk statistics. Open TLVIZ-VD-1.CSV Remove Items with Zero Values Remove Items NOT containing [?] what do you think? We are chasing Write latencies in the default Disk Group which appears to be over subscribed. Your sample will vary. But in this exercise we will filter Items Not containing [Default] and [Write] as well. At this point in the analysis we want to know which virtual disk is responsible for the load. So we look for MB/sec and Req/sec in the display.
This is the answer we were looking for the load on this Virtual Disk is the source of this problem. In this case only the targeted disk group suffered. The array does not report Host specific IO statistics, but knowing which virtual disk exhibits the load will lead to the system and application.
25

Other practice ideas: Open the TLVIZ-PD-1.csv file and filter to a specific group. Check the Loads on the individual disks. Remember both controllers report each object, so there are four possible Req or MB per spindle. Each disk within a group should have similar loads, but not exact. Open TLVIZ-DRT.csv and find WriteOutMB (source) WriteInMB(destination)these represent normal replication traffic. See CopyInMB and CopyOutMB
Open TLVIZ-HC.csv to view queue depths and busies specific to Host bus adapters If Microsoft Access is installed, experiment with the built in queries of EVADATA.mbd Collect performance data and establish a baseline and then collect data during a backup whether the arrays is the source or the target of the backup.
26

The Blocks and applicable TVLIZ files
27

Object files and counters
EVA Storage Array (as) − Total Host MB/s − Total Host Req/s − Total Mirror MB/s
EVA Storage Controller (cs) − % Data Transfer Time − % Processor Time
EVA Host Port Statistics (hps) − Average Queue Depth − Read Req/s, MB/s, Latency − Write Req/s, MB/s, Latency − Transfer Req/s, MB/s **
EVA Port Status (ps) − Loss of Signal, Bad Rx Char, − Loss of Synch, Link Fail, RxEOFa, − Discard Frames, Bad CRC, Proto Err
EVA Vdisk (vd) − Read Hit Req/s, KB/s, Latency − Read Miss Req/s, KB/s, Latency − Write Req/s, MB/s, Latency − Flush, Mirror, Prefetch MB/s − Group ID, Online to, Mirr, Wr Mode − Read /write latency histogram/graph* − Transfer size histogram/graph*
EVA VDisk Group (vdg) − Read Hit Req/s, KB/s, Latency − Read Miss Req/s, KB/s, Latency − Write Req/s, MB/s, Latency − Flush, Mirror, Prefetch MB/s − Group ID, Online to, Mirr, Wr Mode
EVA Physical Disk (pd) − Read Hit Req/s, MB/s, Latency − Read Miss Req/s, MB/s, Latency − Write Req/s, MB/s, Latency − Flush, Mirror, Prefetch MB/s
EVA Physical Disk Group (pdg) − Drive Latency (ms), Queue Depth − Read Req/s, KB/s, Latency (ms) − Write Req/s, KB/s, Latency (ms) − Enc, Bay, Grp
EVA Host Connection (hc) − Queue Depth − Busies (queue full)
EVA DRM (CA) Tunnels (drt) − Round Trip Delay (ms) − Copy In MB/s, Out MB/s, Retries − Write MB/s, Out MB/s, Retries − Copy/Write/Command Buffers
28

The populated data base view.
29