how we measure quality of jira deployments to cloud?
TRANSCRIPT


• Involved in development of core Atlassian products
• Commercial, Open-Source add-ons, customisations
• Developers, Product Managers, Designers, QAs, Agile Team Leads
• QA for Quality Assistance
Partner
• 1 QA per 10 developers
• Testing in hands of developers (both manual and automatic)
• Teaching/coaching to become great testers
Quality Assistance

• Process improvement • Test tools, test environments • Customer insight • Prevention, data-driven
decisions • Defect analysis, continuous
improvement
Those other things

Agenda1. Metrics’ principles2. Context of JIRA Cloud3. Measuring quality4. Learning from measurements
5. Takeaways
Metrics’ principles

Software QualityMeasurements
Theory
SW Quality Metrics

Software Qualityis the degree to which software possesses a
desired combination of attributes (e.g. reliability, interoperability) [IEEE 1061].
refers to two distinct notions: - software functional quality
- software structural quality [wikipedia]
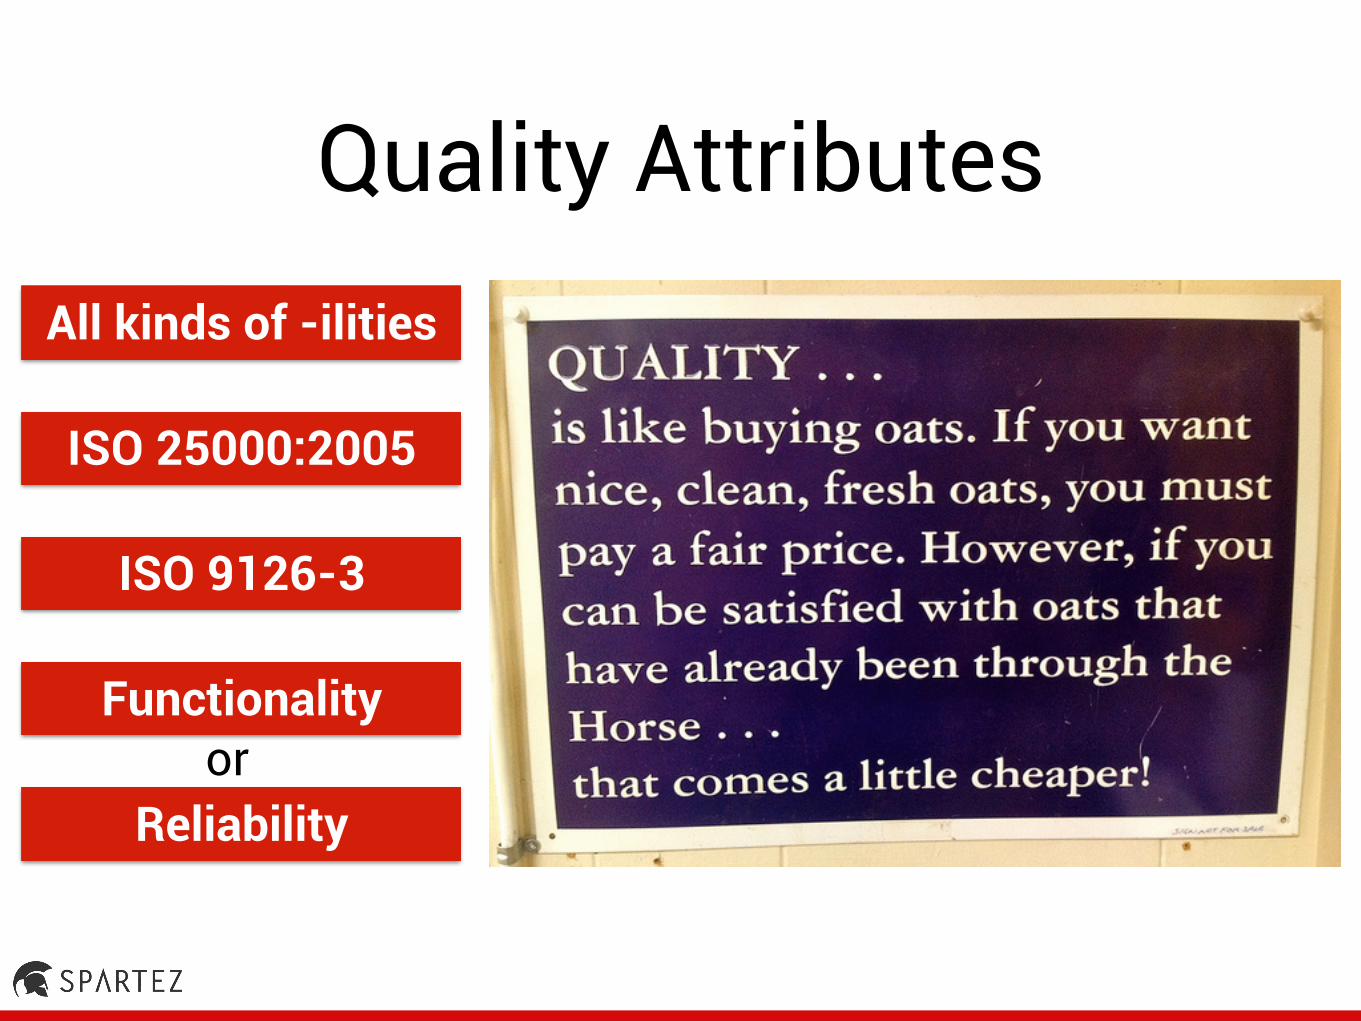
Quality AttributesAll kinds of -ilities
ISO 9126-3
ISO 25000:2005
Functionality
Reliabilityor

Measurements
• It’s not about counting things
• It’s about estimating the value of something
http://kaner.com/pdfs/SoftwareRelatedMeasurements.pdf
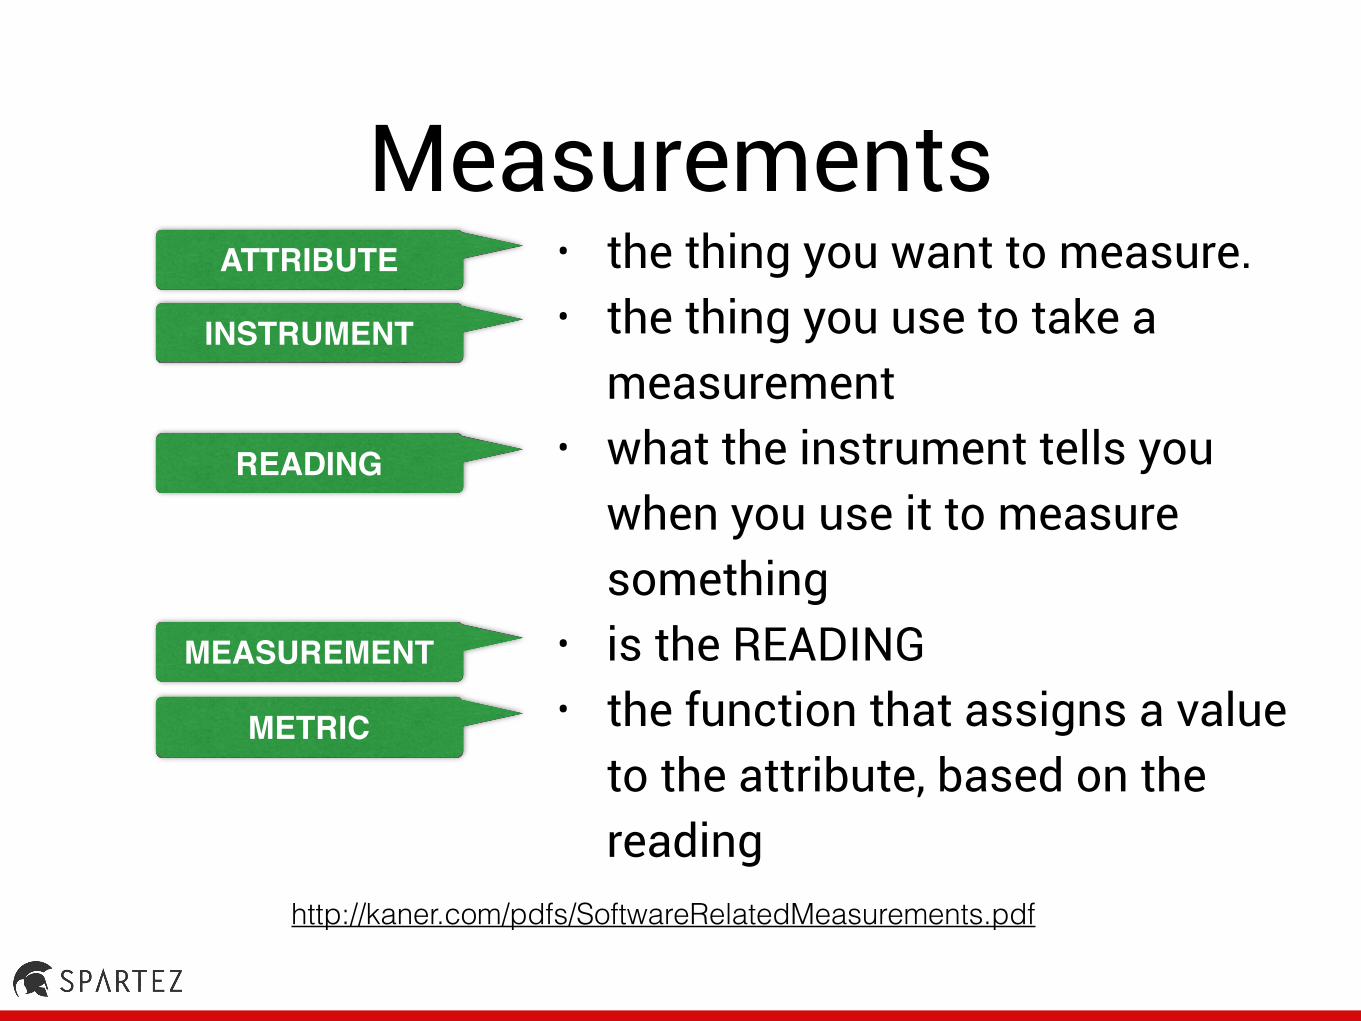
Measurements• the thing you want to measure. • the thing you use to take a
measurement • what the instrument tells you
when you use it to measure something
• is the READING • the function that assigns a value
to the attribute, based on the reading
http://kaner.com/pdfs/SoftwareRelatedMeasurements.pdf
ATTRIBUTE
INSTRUMENT
READING
MEASUREMENT
METRIC

Metrics Classification
Improvement MetricsIdentification Metrics
• Goal: Gaining full/real picture for topic • Driven by: worrying signals, gossips,
misinformation, curiosity, duty, process, standards
• Goal: Change in process/product/people • Driven by: Results of Improvement metrics

Principles

Start with questions you need answers for
Principles

Collecting metric is not the goal
Principles

Buy in for the goal and the metric
Principles

Metrics will not be perfect
Principles

Drive the decisions
Principles

Do not be afraid to throw them away
Principles

Example - Story Rejection Rate
0%
25%
50%
75%
100%
2009 2011 2013 2013 2014
4%7%15%
30%
100%
“Quality at Speed” video: https://www.youtube.com/watch?v=yRP29wFqu20

Context of JIRA Cloud
JIRA Cloud

JIRA Cloud contd.
• Incident management process
• Regressions with the biggest impact
• Thousands of issues reported in official Bug
tracker per year

Challenges for quality
My story
BTCYS

Measuring Quality

Start with questions you need answers for
• What is the quality of our releases to JIRA
Cloud? (Functional + Perceived by customers)
• What bugs are we letting through?
• What is their severity?
• What are the root causes of those
bugs?
• How can we prevent them?
Principles in action

• Goal: Being able to provide facts about
quality of releases to JIRA Cloud
• Goal: Being able to take further decisions
Collecting metric is not the goal Principles in action
Identification Metrics!

Metrics/MeasuresNumber of incidents per
each release
Average number of Support
Cases per incident for each
release
Metric:
Metric:
Incident = Every failure causing more than 4 Support
Cases

Customer feedback
Support JIRA instance Official bugtracker
BUG-12345SUPPORT-7893
Customer
Problem report
Problem report
Incident instance
!!!Incident!
Bug report
Incident management process
DEV, SOPS

Why?
• Why incidents?
• Why based on Support Cases?

Measurement system - part 1
Support JIRA instance Official bugtrackerIncident instance
DB
Get all links and store number of Support Cases for every bug

Measurement system - part 2
Support JIRA instance Official bugtrackerIncident instance
DB
Get all links and store number of Support Cases for every bug
Internal JIRA instance Defect
analysis scripts

Measurement system - part 2
Get all issues
reported in bug tracker yesterday
Check support cases
number in DB
More than 2 support
cases?
Create or update issue
in internal JIRA
Repeat process for issues
created 3, 7 and 14 days ago
X

Defect information
Automatic
Manual

Defect Analysis Dashboard

• Some incidents do not have Support
Cases
• Is not normalised against number of
customers
• Difficulty in driving severity imagination
• Influenced by time of fixing (good or bad?)
Metrics will not be perfect!Principles in action

Do we have problem with quality?
It is less than 0.2 % of
customers
You cannot prevent all
bugs
It is significant number
Even 1 Support Case is too much
0.2% reported, how many could not
work?

Learning from measurements

• Improve Post Incident Review process
• Create Tech Debt team
• Kick off several initiatives/projects for
better prevention
Drive the decisions Principles in action
• Improve Post Incident Review process
• Ticket
• Severity
• Document Owner
• Report Status
• Executive Summary
• Do we know the root cause?
• Has the root cause been mitigated?
• Root Cause
• Outage Description
• Was this a repeat of a previous incident?
• Affected users
• Start Date/Time (UTC)
• End Date/Time (UTC)
• Duration
• Time to Detection
• Time to Recovery
• What went well?
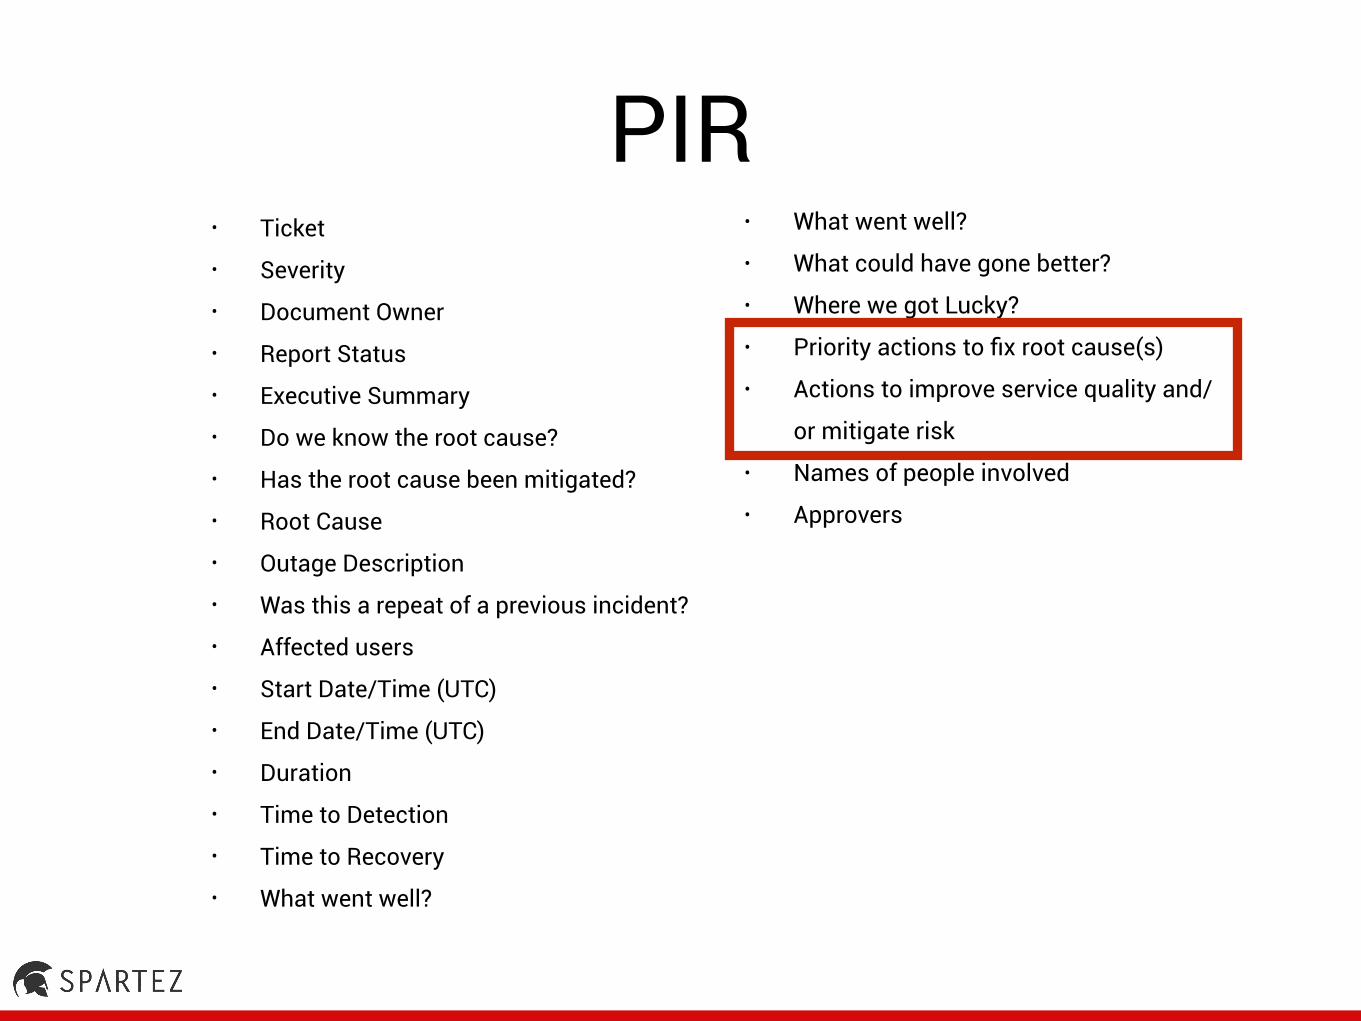
PIR• What went well?
• What could have gone better?
• Where we got Lucky?
• Priority actions to fix root cause(s)
• Actions to improve service quality and/
or mitigate risk
• Names of people involved
• Approvers

PIR Improvements
• Focus on prevention action items
• Created in team’s backlogs
• Measurable and Trackable
• SLA for development teams to fix those
issues

Action Items
• Do not fix the
root cause only
• Try to prevent
whole class of
issues

Projects/initiatives for better prevention
• Knowledge sharing tool
• Better integration testing on system level
• JS errors on WD tests
• Test Coverage week
• …

So what’s next?

Improvement metrics
• % of completed action items
• Number of incidents and support cases per
release
• Number of incidents and support cases per
released change
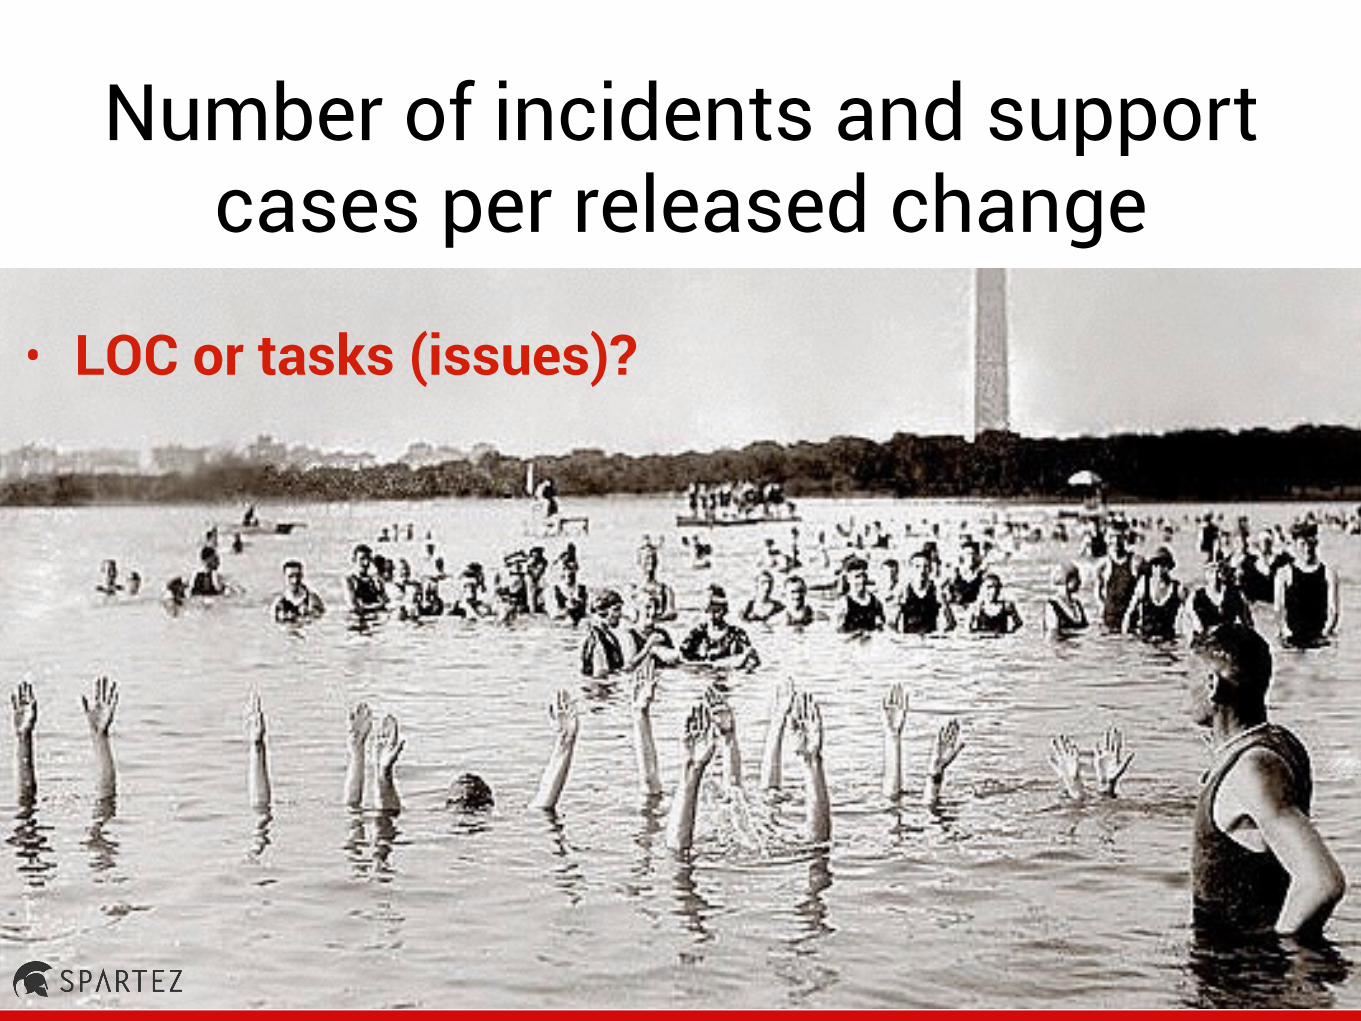
Number of incidents and support cases per released change
• LOC or tasks (issues)?
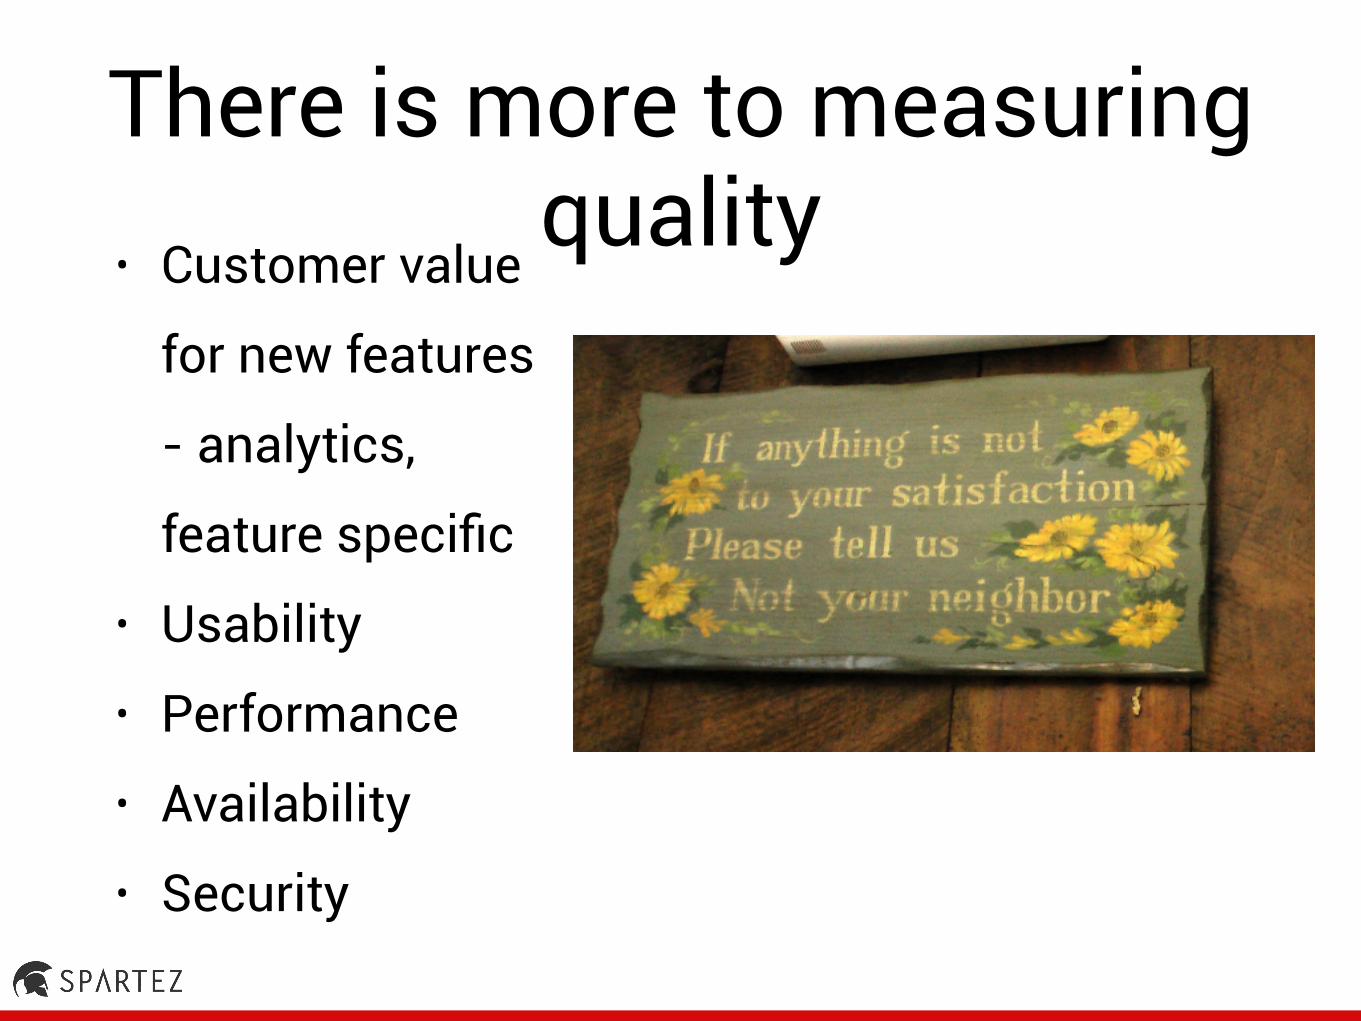
There is more to measuring quality
• Customer value
for new features
- analytics,
feature specific
• Usability
• Performance
• Availability
• Security

Takeaways

Metrics’ principles• Start with questions you need
answers for
• Collecting metric is not the goal
• Buy in for goals and metrics
• Metrics will not be perfect
• Drive the decisions
• Do not be afraid to throw them
away

Measurement system
• You need facts
• Not easy to build but
this is not an excuse
• Use your opportunities
• Automate

Learning from defects• Focus on follow-up items
not descriptions
• Do not fix the root cause
only, try to prevent
classes of issues
• Stating: We need to be
better in … next time - will
not work

QA Role• Yes, it belongs to
you!
• Drive
• Do not be afraid to
question existing
metrics

Thank you !
Images - credits• Żuraw in Gdańsk - by JM_GD - CC BY 2.0
• Chess - by DGlodowska - CC0 Public Domain
• Land Rover Wolf XD - by Bob Bob - CC BY 2.0
• Cress keyboard - by wetwebwork - cc-by-sa-2.0
• definition - by PDPics - CC0 Public Domain
• ‘Quality ... is like buying oats. signage’ by antefixus U.E. - CC BY-NC-ND 2.0
• ‘Customers Needed NO Experience Required’ - Matthew Burpee - CC BY-NC-SA 2.0
• Eintracht hooligans - by Heptagon - CC BY-SA 3.0
• ‘iceland sources’ - by Barthwo - CC0 Public Domain
• Countryliner - by Arriva436 - CC BY-SA 3.0
• ‘McRae Fire. Low-Severity Fire.’ - Kaibab National Forest - by CC BY-SA 2.0
• The slug in the water - by Daniel Mietchen - CC BY-SA 2.0
• TasmanianDevil 1888 - by Mike Switzerland - CC BY-SA 3.0
• ‘Typhoid Dragon, Slain by Prevention’ - by VCU Tompkins-McCaw Library Special Collections - CC BY-NC 2.0
• Raise_your_hand_if_you_can’t_swim - by National Photo Company - CC0 1.0
• ‘Signs of the Times: If Anything is Not to your Satisfaction.... (pingnews)’ - by pingnews.com - CC BY-SA 2.0
• Crowd - by James Cridland - CC BY 2.0
• whole world in my hands - by sewingstars - CC BY-NC-ND 3.0
• ShippingContainerSFBay - by Mgunn - CC0 Public Domain
• Anger Controlls Him - Jessica Flavin - CC BY 2.0
• houses - by OpenClipartVectors - CC0 Public Domain
• Under Floor Cable Runs Ell - by Robert.Harker - CC BY-SA 3.0
• Angry... ? - by Navaneeth KN - CC BY 2.0