how we fail to protect freshwater
TRANSCRIPT

How We Fail to Protect Freshwater
Dr Mike Joy: IGPS Victoria University Wellington [email protected]

• What are the water issues in NZ?
• What are the drivers of the issues?
• NPS-FM Nitrate toxicity scam?
• What is water quality anyway?
• Dams?
• Where to next?

- 74% of freshwater fish threatened
- + crayfish and kakahi too - gone by 2050
- no protection under law for native freshwater fish
All sites
1970s 1980s 1990s 2000s
IBI s
co
re
26
28
30
32
34
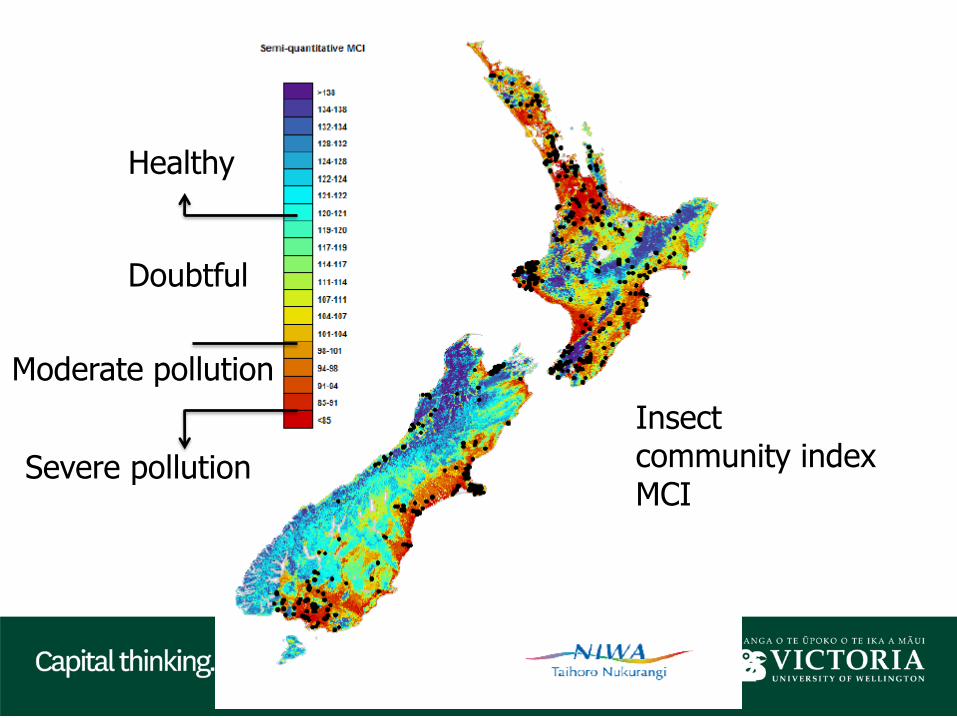
Healthy
Doubtful
Moderate pollution
Severe pollution
Insect community index MCI

Abell et al. (2010): Ecosystems
Waikatolowland lakes
The two worlds: the best and the worst

Global comparisons

Where we are
Where we should be Physical Indicator
New Zealand's world ranking Per capita out of 158 countries (158 is
worst)
Phosphorus 145
Ecological Footprint 133
Land-Use Change 120
Material Footprint 119
Nitrogen 118
CO2 Emissions 107
Blue Water 99

Graphic from Susan WalkerLandcare NZ
What are the main drivers of our freshwater crisis?


wetland
Pre European
Dymond & Aussiel Landcare
“in no other kind of ecosystem has the elimination of indigenous biodiversity been so comprehensive” Geoff Park, Nga Uruoa.
“although for Maori they were priceless assets – rich, self-renewing sources of food and fibre, to Pakeha they were something useless to turn into excellent farmland” (Ikawai, R M McDowall)
$8 billion loss of ecosystem services, lost 74,000 tonnes of eels
What are the main drivers of our freshwater crisis?


Red is bad, blue is good - See a pattern here?
Multiple issues (e.g. + GHG) same cause
ammonia
Ecosystem health
Nitrate Total N
Pathogens
What are the main drivers of our freshwater crisis?

The response from government (MfE) to these issues the NPS-FM:
• 20 years (too) late
• The drivers of the problem not addressed
• Allowed more intensification (worsening)
• Science was lost from policy, attributes cherry picked to allow business as usual

The issues:
• Deposited sediment
• Nutrients
• Pathogens
• Abstraction
• Habitat loss
What we measure:
• Deposited sediment
• Nutrients*
• Pathogens*
• Abstraction
• Habitat loss
* = partially with big issues
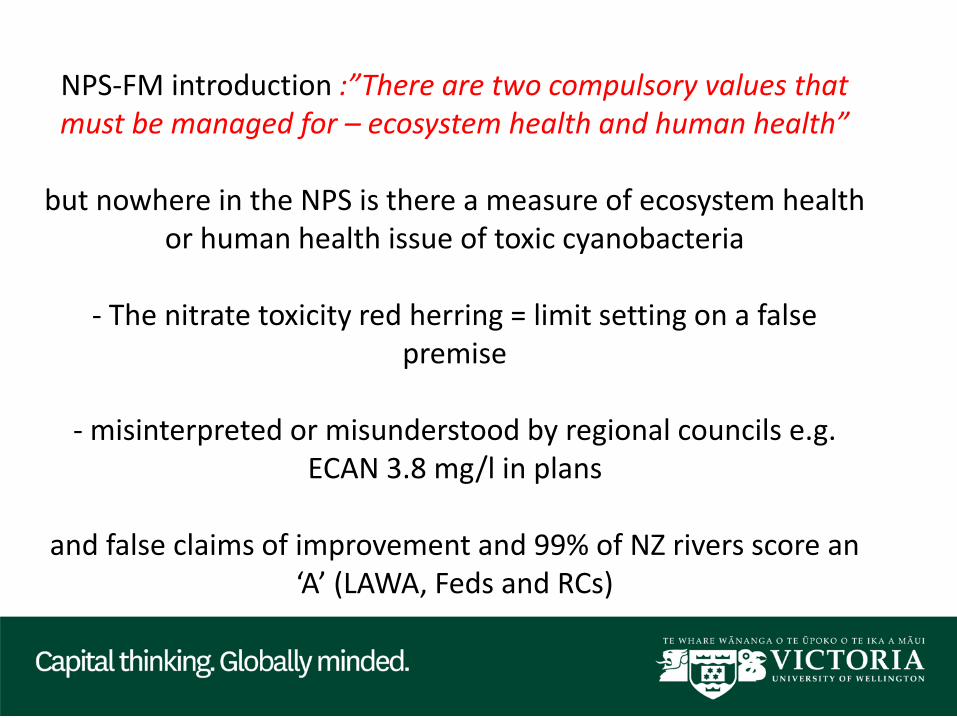
NPS-FM introduction :”There are two compulsory values that must be managed for – ecosystem health and human health”
but nowhere in the NPS is there a measure of ecosystem health or human health issue of toxic cyanobacteria
- The nitrate toxicity red herring = limit setting on a false premise
- misinterpreted or misunderstood by regional councils e.g. ECAN 3.8 mg/l in plans
and false claims of improvement and 99% of NZ rivers score an ‘A’ (LAWA, Feds and RCs)

Why nitrate toxicity is not an issue
Excess nitrate periphyton growth O2 variability O2 extremes
40
60
80
100
120
140
160
180
1 5711
316
922
528
133
739
344
950
556
161
767
372
978
584
189
795
310
0910
6511
2111
7712
3312
8913
4514
0114
5715
1315
6916
2516
8117
3717
9318
4919
0519
6120
1720
7321
2921
8522
4122
9723
5324
0924
6525
2125
7726
3326
8927
4528
0128
5729
1329
6930
2530
8131
3731
9332
4933
0533
6134
1734
7335
2935
8536
4136
9737
5338
0938
6539
2139
7740
3340
8941
4542
0142
5743
1343
6944
2544
8145
3745
9346
4947
0547
6148
1748
7349
2949
8550
4150
9751
5352
0952
6553
2153
7754
3354
8955
4556
0156
5757
1357
6958
2558
8159
3759
9360
4961
0561
6162
1762
7363
2963
8564
4164
9765
5366
0966
6567
2167
7768
3368
8969
4570
0170
5771
1371
6972
2572
8173
3773
9374
4975
0575
6176
1776
7377
2977
8578
4178
9779
5380
0980
6581
2181
7782
3382
8983
4584
0184
5785
1385
6986
2586
8187
37
Summer Winter Summer
% dissolved oxygen Hopelands Road Manawatu River Feb 2017 - Feb 2018
Note median 0.64 mg/l nitrate

ANZECC guideline limit for nuisance algal growth
Manawatu River at Hopelands Road (lethal low O2)
NPS/NOF bottom line (20% dead toxicity)
WHO human health limit (blue baby)
Dead no oxygen
Nit
rate
-nit
roge
n m
g/l
A
B
C
40
90
140
1 98 195
292
389
486
583
680
777
874
971
1068
1165
1262
1359
1456
1553
1650
1747
1844
1941
2038
2135
2232
2329
2426
2523
2620
2717
2814
2911
3008
3105
3202
3299
3396
3493
3590
3687
3784
3881
3978
4075
4172
4269
4366
4463
4560
4657
4754
4851
4948
5045
5142
5239
5336
5433
5530
5627
5724
5821
5918
6015
6112
6209
6306
6403
6500
6597
6694
6791
6888
6985
7082
7179
7276
7373
7470
7567
7664
7761
7858
7955
8052
8149
8246
8343
8440
8537
8634
8731
Hopelands Road
Dead toxic N
Why nitrate toxicity is not an issue

ANZECC guideline limit for nuisance algal growth
NPS/NOF bottom line (20% dead toxicity)
WHO human health limit (blue baby)
Dead no oxygen
Dead toxicity
Nit
rate
-nit
roge
n m
g/l
A
B
C The Yangtze & Mississippi rivers
40
90
140
1 98 195
292
389
486
583
680
777
874
971
1068
1165
1262
1359
1456
1553
1650
1747
1844
1941
2038
2135
2232
2329
2426
2523
2620
2717
2814
2911
3008
3105
3202
3299
3396
3493
3590
3687
3784
3881
3978
4075
4172
4269
4366
4463
4560
4657
4754
4851
4948
5045
5142
5239
5336
5433
5530
5627
5724
5821
5918
6015
6112
6209
6306
6403
6500
6597
6694
6791
6888
6985
7082
7179
7276
7373
7470
7567
7664
7761
7858
7955
8052
8149
8246
8343
8440
8537
8634
8731
Why nitrate toxicity is not an issue

Nitrogen toxicity scam
ANZECC guideline limit for nuisance algal growth
NPS/NOF bottom line (20% dead toxicity)
WHO human health limit (blue baby)
Dead no oxygen
Dead toxicity
Nit
rate
-nit
roge
n m
g/l
A
B
C Human colorectal cancer trigger drinking water (15% probability)
40
90
140
1 98 195
292
389
486
583
680
777
874
971
1068
1165
1262
1359
1456
1553
1650
1747
1844
1941
2038
2135
2232
2329
2426
2523
2620
2717
2814
2911
3008
3105
3202
3299
3396
3493
3590
3687
3784
3881
3978
4075
4172
4269
4366
4463
4560
4657
4754
4851
4948
5045
5142
5239
5336
5433
5530
5627
5724
5821
5918
6015
6112
6209
6306
6403
6500
6597
6694
6791
6888
6985
7082
7179
7276
7373
7470
7567
7664
7761
7858
7955
8052
8149
8246
8343
8440
8537
8634
8731

“A fresh start for freshwater” NPS-fm objectives 2014: (making the problem disappear)
A B C
Before After
All red areas exceed the ANZECC guideline to protect ecosystem health

Primary contact (health ministry level)
Secondary contact (safe in a boat?)
From 260 cfu/l to 1000 cfu/l
The government response to the crisis– shifting goalposts“A fresh start for freshwater” NPS-fm objectives 2014: (making the problem disappear)
After
Before
All red areas exceed MOH and ANZECC contact recreation limit

80% swimmable by 2030 & 90% swimmable by 2040
BUT: 1. Only applies to lakes > 1.5km diameter (25% of lakes) 2. Only applies to >4th order waterways and that is ~12% of length if NZ
waterways, 70% of them already swimmable so goal is actually 20% of 12 % 3. Limits shifted of 76 NWRQN sites number of sites swimmable under original
NPS 42%, under Clean Water 83% (NB, USEPA 49%)

Canterbury case study
1. Regional Plan Policy: Inequity of grand parenting.
2. Declining Water Quality: Nitrate load upward, Aquifers, Spring fed streams
3. Wrong Limits 3.8 mg/l
4. Human disease: high rates zoonotic disease (via water?)
5. Biodiversity Loss waterways and terrestrial
6. Over reliance on Models. Overseer etc.
7. Legal: Drinking Water Degradation
8. Fair representation: Zone Meetings, GMPs and FEPs….
9. Ethics: Worsening Water Quality in just 10 years.
10. Debt Burden: Land values anchored to polluting systems

https://theconversation.com/drinking-water-study-raises-health-concerns-for-new-zealanders-108510

0
1
2
3
4
5
6
7
8
9
10
1 6
11
16
21
26
31
36
41
46
51
56
61
66
71
76
81
86
91
96
10
1
10
6
11
1
Drinking water rural Canterbury 113 samples
0
1
2
3
4
5
6
7
8
9
10
1
18
35
52
69
86
10
3
12
0
13
7
15
4
17
1
18
8
20
5
22
2
23
9
25
6
27
3
29
0
30
7
32
4
34
1
35
8
37
5
39
2
CCC drinking water data 2015 393 samples
15% risk
Significant risk
Christchurch City and rural Canterbury drinking water and colo-rectal cancer trigger levels


state trend
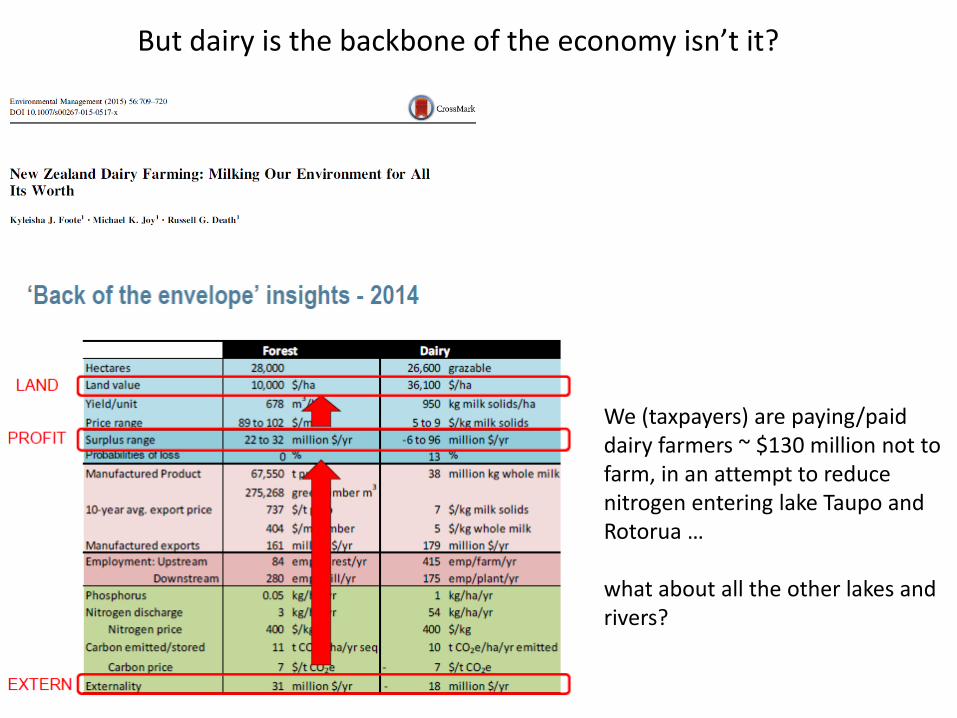
But dairy is the backbone of the economy isn’t it?
We (taxpayers) are paying/paid dairy farmers ~ $130 million not to farm, in an attempt to reduce nitrogen entering lake Taupo and Rotorua …
what about all the other lakes and rivers?

1. big issues with “water quality” what is it? & the way we do it (monthly snapshots)
2. NPS-fm flawed. Fails to meet any of its objectives a legacy of government failure over decades e.g. two sites on the Manawatu River a site can have the worst ecosystem respiration and GPP rates ever measured, have lethal low oxygen levels and still score an “A” for all NPS measures
3. Huge issues with old and failing wastewater infrastructure in urban areas ($2 billion just to meet B grade)
4. Regional authorities impossible dilemma of being charged with looking after short term economics and long term economics then measuring environmental state and then reporting on themselves

• We need a dam to save our overallocated imperilled river
• Dams will improve water ecology of rivers and will not mean worse water quality
• We need dams for climate change mitigation
• Dams are good for the local/regional economy
• Community collaboration is the answer
• Its unrealistic to want to have pristine waterways
• We cant feed the world without irrigation
Irrigation myth busting

Opuha Dam

Flood valley above
DAM
Increased GHG
emissions from
reservoir
People houses
heritage
Native flora and
fauna
Altered geomorphology
braids etc.
Ag. intensification
Altered sediment
movementImpact
freshwater biodiversity
Altered O2
variability
Increased GHG from
cows
Loss of terrestrial
biodiversity
Increased slime
accrual time
Flattened hydrograph
Increased evaporation
Depleted O2
slugs Decreased
swimmability
Fish migration impacts dam and
coast

Sustainable resilient alternatives to dams:
• Match land use to the land and climate
• Small on farm storage and water retention schemes, water efficiency –Doug Avery approach
• Wastewater recycling/irrigation
• Cover crops
• Bunds
• Drainage control
• Furrow dykes
• Swales
• No-spray buffers
• Move urgently away from animal based agriculture >50% of all green
house gas emissions come from animal agriculture
• Farm for profit not production – add value not volume

Dams
The future:
• Match land use to the land and climate
• Small on farm storage and water retention schemes, water efficiency – Doug Avery approachWastewater recycling/irrigation
• Cover crops
• Bunds
• Drainage control
• Furrow dykes
• Swales
• No-spray buffers
• Move urgently away from animal based agriculture >50% of all green house gas
emissions come from animal agriculture
• Farm for profit not production – add value not volume

Ripple, W.J., Wolf, C., Newsome, T.M., Galetti, M., Alamgir, M., Crist, E., Mahmoud, M.I., and Laurance, W.F. (2017) World Scientists’ Warning to Humanity: A Second Notice. BioScience 67(12), 1026-1028.
Multiple threats coming climate change, overpopulation, peak everything ..

Food production NZ and globally – the threats to a liveable planet
Threats to the current food production model:
• The Nitrogen bomb
• Greenhouse gas emissions CO2 nitrous oxide & methane
• Peak phosphorus
• Antibiotic resistance
• Animal health and welfare & now mycobacterium bovis
• Human health pathogens & disease
• Freshwater availability
• Freshwater pollution rivers, lakes and groundwater's
• Pollution of estuaries and oceans
• The dominance of the human-animal food system

Wild mammals 2%


The future of food - how will this look for NZ?
Plus EROI?Ethical score?

With wilful blindness, delusion, ignorance, and refusal to see nature
as a community and instead regarding it all as a resource without
limits we keep using up natures capital.
But nature is calling in her debt.
Few are willing to face the truth
Brian Turner poet and environmentalist (September 14, 2014)

Doing nothing will not make you immune to the consequences
www.waterqualitynz.info
Activism is my rent for living on this planet (Alice Walker)
Thanks to:Victoria University IGPS,Freshwater activist friends students & colleagues all over New Zealand