how unpredictable aid influences service delivery:...
TRANSCRIPT

How Unpredictable Aid Influences Service Delivery: Insight from the Aggregate Level and Health Sector
Uganda Case Study
Final Version, March 2010
Geoff Handley, Diana Kizza and Albert Musisi
This study has been supported by funding from the Knowledge for Change Program, a multi-donor programmatic trust fund managed by the Development Economics Vice Presidency of the World Bank.
Disclaimer: The views presented in this paper are those of the authors and
do not necessarily represent the views of the World Bank or of the Knowledge for Change Program donors
Overseas Development Institute 111 Westminster Bridge Road
London SE1 7JD UK
Tel: +44 (0)20 7922 0300 Fax: +44 (0)20 7922 0399
www.odi.org.uk

How Unpredictable Aid Influences Service Delivery
ii
Acknowledgments The authors would like to thank all those in government, civil society organizations and donor agencies who provided information and generously gave their time. The authors are grateful for in-depth comments provided by: peer reviewers—Stephen Knack and Dino Leonardo Merotto; the project team—Punam Chuhan-Pole, Vera Wilhelm, and Linda Lee; and other reviewers—Logan Brenzel, Fiona Davies, Martin Brownbridge and Tim Williamson. Responsibility for the views expressed and for any errors of fact or judgement remains with the authors.

Uganda Country Case Study
iii
Contents
Acknowledgments ............................................................................................................. ii Contents ............................................................................................................................ iii Executive summary ........................................................................................................ viii 1. Introduction ................................................................................................................. 1
2. Country Context .......................................................................................................... 4 2.1 Macro situation ................................................................................................................. 4 2.2 National aid Environment .................................................................................................. 6 2.3 Sector aid environment ................................................................................................... 10 2.4 Trends in health sector service delivery .......................................................................... 11
3. Aid predictability and its influence at the aggregate level .................................... 14 3.1 Planning and budgeting at national level ......................................................................... 14 3.2 Predictability of aid flows at aggregate level .................................................................... 19 3.3 Influence of and government response to unpredictable aid ........................................... 24
4. Aid predictability and its influence at the sector level ........................................... 28 4.1 Planning and budgeting in the health sector ................................................................... 28 4.2 Planning and budgeting at sub-national level .................................................................. 31 4.3 Predictability of health sector resource flows .................................................................. 32 4.4 Influence of and sector response to unpredictable aid .................................................... 46
5. Influence of Unpredictable Aid on Health Sector Service Delivery ....................... 50 5.1 Overview of other factors influencing Health Service Delivery ......................................... 50 5.2 Impact of unpredictable aid on health sector service delivery .......................................... 51
6. Conclusions & Recommendations .......................................................................... 55 6.1 Conclusions .................................................................................................................... 55 6.2 Recommendations .......................................................................................................... 59
References ....................................................................................................................... 61 List of Persons Met .......................................................................................................... 64

How Unpredictable Aid Influences Service Delivery
iv
List of Tables Table 1: Trends in Selected Fiscal Aggregates ............................................................................... 5 Table 2: How much aid for the government sectors uses country systems? .................................. 10 Table 3: Trends of PEAP Indicators 199/00 - 2007/08 .................................................................. 12 Table 4: Health Key Performance Indicators (1999/00 - 2007/08) ................................................. 12 Table 5: Health Service Delivery Outcome Indicators by Region ................................................... 13 Table 6: Performance of Northern Uganda Districts Using Selected HSSPII Indicators (2007/08) 13 Table 7: Organisational Units Within MFPED with Responsibility for Aid Management ................. 17 Table 8: Relative size of shortfalls and windfalls (% of total budgeted resources)* ........................ 23 Table 9: Budget Execution (2001/02 – 2007/08), outturn as a % of original budget ....................... 25 Table 10: Composition of Annual Budget Outturns (2001/02 – 2007/08) ....................................... 26 Table 11: Structure of Public Sector Health Care Delivery Facilities.............................................. 28 Table 12: Trends in On-Budget Public Expenditure Outturns on Health ........................................ 35 Table 13: Trends in Health Sector Budget Execution FY 2004/05 – 2007/08 ................................ 35 Table 14: Essential Medicines & Health Supplies (EMHS) Budget Performance for the Regular & Credit-line Budget ......................................................................................................................... 36 Table 15: Very Approximate ―waste‖ Estimates, 2005/06 .............................................................. 38 Table 16: GAVI funds disbursed in Uganda (2000 – 2009) ........................................................... 43 Table 17: Status of Global Fund Grants to Uganda as of 4 March 2009 ........................................ 46 Table 18: Factors (Other than Unpredictable Aid) Influencing Health Sector Service Delivery ...... 50 Table 19: Impact of unpredictable aid on service delivery ............................................................. 52 Table 20: Implications of Aid Instrument Design for Management of Unpredictability .................... 57
List of Figures Figure 1: On-Budget Aid as a Share of GDP and Total Public Expenditure (1999/00 – 2008/09) .... 6 Figure 2: Volatility in on-budget aid and tax revenue (deviation from trend) .................................... 7 Figure 3: On-Budget Aid (expected) and Outturns (1999/00 – 2008/09), ......................................... 7 Figure 4: Captured Project Aid and Direct Budget Support Outturns (2000/01 – 2008/09), UGX Billions ............................................................................................................................................ 8 Figure 5: Health Sector Funding Captured on Budget/MTEF ........................................................ 11 Figure 6: Medium-Term Predictability at the Time of the 2006/07 Budget (Division of Labour Financial Data Tool, GoU MTEF and Economist Group), 2006/07 – 2009/10 ................................ 19 Figure 7: Medium-term predictability of General Budget Support (GBS) ....................................... 20 Figure 8: Short-Term Predictability of Domestic Resources .......................................................... 21 Figure 9: Short-Term Predictability of Total On-Budget Aid ........................................................... 21 Figure 10: Short-Term Predictability of Direct Budget Support ...................................................... 22 Figure 11: Short-Term Predictability of Project Aid ........................................................................ 22 Figure 12: In-year predictability of General Budget Support .......................................................... 24 Figure 13: Stylised Overview of Flow of Funds in the Health Sector.............................................. 34 Figure 14: In-Year Predictability in Health: Timing of Releases from Consolidated Fund Account to Districts for Primary Health Care (UGX ‗000s), 2005/06 – 2008/09 ............................................... 37 Figure 15: Short-term predictability of donor funds for health in Uganda, US$ millions ................. 39 Figure 16: Comparison of Data on Health Sector Aid by Donor (UGX ‗000s), 2006/07 ................. 39 Figure 17: GAVI-ISS Funding Flows and Expenditures (2001 – 2007), USD ................................. 43 Figure 18: Global Fund Financial Disbursements (2003 – 2009), US$ millions ............................. 45

Uganda Country Case Study
v
List of Boxes Box 1: Definitions of Key Study Terms ............................................................................................ 2 Box 2: Excerpts from the GoU ‗Partnership Principles‘ Document ................................................... 9 Box 3: A Guide to Planning Processes in Uganda......................................................................... 14 Box 4: Increasing emphasis on service delivery outputs in planning, budgeting and reporting ...... 15 Box 5: Grant Aid as a Contingent Liability ..................................................................................... 26 Box 6: Description of Health SWAp Structures .............................................................................. 30 Box 7: Conditional Grants as Unpredictable Resource Flows for Service Delivery ........................ 31 Box 8: Sector Budget Ceilings and Perverse Incentives for Aid Reporting .................................... 33 Box 9: In-Year Predictability in the Health Sector: Findings from a Value for Money Audit in 14 Districts ......................................................................................................................................... 38 Box 10: Northern Uganda Case Study .......................................................................................... 40 Box 11: PEPFAR Predictability and Speed of Disbursement ......................................................... 42 Box 12: GAVI‘s Immunisation Service Support (ISS) Funding Mechanism .................................... 42 Box 13: The GAVI-ISS Fund Suspension ...................................................................................... 44 Box 14: Global Fund Governance Arrangements .......................................................................... 45 Box 15: Suspension of Global Fund Grants .................................................................................. 46 Box 16: LTIA Financing Mechanisms ............................................................................................ 48

How Unpredictable Aid Influences Service Delivery
vi
List of Acronyms ACT Artemisinin-Based Combination Therapy AHSPR Annual Health Sector Performance Report AIDS Aquired Immuno Defficiency Syndrome ALD Aid Liaison Department (MFPED) ANC Ante Natal Clinic ART Anti Retroviral Treatment ATM AIDS, Tuberculosis & Malaria BFP Budget Framework Paper BMAU Budget Monitoring and Accountability Unit Bn Billion BoU Bank of Uganda CAO Chief Administrative Officer [district level] CAPE Centre for Aid and Public Expenditure CCM Country Coordinating Mechanism (for GFATM) CoA Chart of Accounts DHO District Health Officer DMS Development Management System DQA Data Quality Audit DTP3 Diptheria, Tetanus, Portfolio 3rd Dose EAC East African Community EMHS Essential Medicines & Health Supplies FMIS Financial Management Information System GAVI Global Alliance for Vaccines and Immunisation GDP Gross Domestic Product GFATM Global Fund for Aids, Tuberculosis and Malaria GHI Global Health Initiatives GoU Government of Uganda HIPC Heavily Indebted Poor Countries‘ Initiative HIV Human Immuno Virus HMIS Health Management Information System HSSP Health Sector Strategic Plan IGG Inspector General of Government IMF International Monetary Fund IMR Infant Mortality Rate JMS Joint Medical Stores LFA Local Fund Agent [GFATM] LHS Left Hand Side LHS Left Hand Side LRA Lord‘s Resistance Army LTIA Long Term Institutional Arrangments MDAs Ministries, Departments and Agencies
MFPED Ministry of Finance, Planning and Economic Development MoH Ministry of Health MoH Ministry of Health MoU Memorandum of Understanding MTEF Medium-Term Expenditure Framework NDP National Development Plan NHA National Health Accounts NHP National Health Plan NMS National Medical Stores NPA National Planning Authority ODI Overseas Development Institute

Uganda Country Case Study
vii
OPD Out Patient Department OPM Office of the Prime Minister PAF Poverty Action Fund PEAP Poverty Eradication Action Plan PEPFAR President's Emergency Plan for AIDS Relief [USA] PER Public Expenditure Review PETS Public Expenditure Tracking Survey PFP private-for-profit PHC Primary Health Care PHPs private health practitioners PMU Program Management Unit [Ministry of Health] PNFP private-not-for-profit PNFPs private not for profit organisations PR Principal Recipient [GFATM] PRSC Poverty Reduction Support Credit PSI Policy Support Instrument RHS Right Hand Side RHS Right Hand Side Shs Shillings SWAP Sector Wide Approach SWG Sector Working Group TB Tuberculosis TCMPs traditional and complementary medicine practitioners TPPA Third party procurement agent [GFATM] TRP Technical Review Panel TWG Technical Working Group [health sector] UBOS Uganda Bureau of Statistics UCMB Uganda Catholic Medical Bureau Ug Uganda UMMB Uganda Muslim Medical Bureau UNEPI Uganda National Expanded Programme on Immunization UNOPS United Nations Office for Project Services UOMB Uganda Orthodox Medical Bureau

How Unpredictable Aid Influences Service Delivery
viii
Executive summary
Study purpose and audience This case study aims to examine how unpredictable aid influences service delivery. More specifically, the overall aim of the case study is to assess the extent of aid unpredictability in Uganda at both aggregate and health sector level, to understand the strategies adopted by the Government of Uganda (GoU) in order to mitigate the effects of any unpredictability and to try to gauge the influence it ultimately exerts upon service delivery. The study conclusions and recommendations are primarily targeted at two audiences: i) officials in ministries of finance and planning seeking to learn from Ugandan experience in mitigating the unpredictability of aid to protect service delivery, and; ii) donor agency officials at country office level seeking to design and implement aid instruments that support rather than inhibit service delivery (including both economists and sector specialists). The study also has conclusions and recommendations that are relevant to central banks, line ministries seeking to manage service delivery with unpredictable aid and staff in headquarters of donor agencies and global vertical programmes.
Study methodology The case study methodology (ODI, 2009) seeks to trace linkages between aid predictability and service delivery by drawing plausible associations between observed patterns of aid flows, observed allocations of public finance through the budget process (both formal and informal) and observed patterns in terms of service delivery, as measured by GoU health sector outputs. The study sought to distinguish between four different types of unpredictability: i) long-term fiscal sustainability, examining the vulnerability of the GoU budget to a substantial and sustained shock to aid flows; ii) medium-term predictability, measuring by how far ahead donors are able to provide firm financing commitments; iii) short-term predictability, measuring how annual disbursements correspond to annual commitments, and; iv) in-year predictability, measuring how quarterly or monthly disbursements correspond to quarterly or monthly commitments.1 It was also hypothesised from the outset that the detail of aid instrument design would be materially important to the Government‘s ability to mitigate unpredictability. In particular, whether aid is channelled ‗on-system‘ or ‗off-system‘ was considered important, with a distinction made between three ‗Channels‘ of aid delivery: Channel 1, through governments own normal procedures (via the treasury); Channel 2, whereby funds are provided direct to ministries, departments and agencies (MDAs) and managed through special accounts outside of the regular government system, and; Channel 3, where expenditures are undertaken directly by a donor agency or by non-governmental organisations (NGOs) on its behalf. The study is based upon interviews with current and former GoU and donor officials and advisors, GoU financial and monitoring data as well as background documentation (government plans, budgets and reports and secondary sources such as donor commissioned reports including PFM diagnostics). The study methodology set out from the premise that the aid unpredictability problem is inherently strategic. That is, the government has a ‗reaction function‘ to respond to unpredictable aid and this will differ at aggregate (ministry of finance and central bank) and sector level. The case study seeks to document the strategies adopted by the central agencies and health sector institutions to mitigate episodes of unpredictability. At health sector level, the methodology sought to illustrate these mitigation strategies by identifying and examining specific episodes of unpredictability involving either a large windfall (surge) or shortfall in aid. It seeks to trace particular impact of those instances on the variables considered in this study, namely: the institutional
1 Data on in-year predictability proved particularly hard to come by in practice – medium- and short-term
predictability issues therefore receive more attention in the case study.

Uganda Country Case Study
ix
arrangements for budget planning and management; the level and composition of planned and executed expenditure; the reliability and predictability of resource flows to service delivery units, and; the measures of service delivery and performance.
Conclusions Aid to Uganda over the study period has been highly unpredictable – far more unpredictable than domestic resources. The average shortfall or windfall for domestic resources (i.e. tax and non-tax revenues) using absolute values was 2.0% of the total budgeted figure for 2000/01 – 2008/09 compared to 15.6% for total on-budget aid. The available evidence suggests that aid unpredictability is high across all definitions used here: medium-term, short-term and in-year. It also suggests that all the aid instruments examined – budget support, project aid and the GHIs – are highly unpredictable across these dimensions. However, the implications of this unpredictability for service delivery vary by aid modality and by whether or not aid is on-budget or not. Aggregate aid predictability issues The risk to the long-term fiscal sustainability of the GoU budget posed by a substantial and sustained shock to aid flows has reduced dramatically due to the strategies adopted by MFPED and BoU. To implement the budget, the MFPED effectively follows a fiscal rule which ensures that GoU recurrent expenditures (i.e. excluding domestically and externally financed development projects) can be wholly financed by domestic revenues, thereby insulating GoU recurrent expenditures almost completely from sustained shocks to aid flows (including shocks to direct budget support). Basic services such as primary health care comprise expenditures that are predominantly recurrent in nature (e.g. doctors‘ and nurses‘ salaries and drugs). GoU has therefore established a position whereby domestic revenues are always sufficient to finance the recurrent (i.e. operational) elements of such basic services.2 This strategy was made possible by consistently high economic growth rates over the last decade (averaging 7.6%), which have allowed GoU to significantly increase domestic revenues and, by limiting expenditure growth to below revenue growth, to reduce the fiscal deficit before grants. Although this policy was not solely motivated by aid unpredictability concerns – it was primarily seen as a prudent macroeconomic policy – it has had the effect of dramatically reducing the risk to long-term fiscal sustainability posed by a shock to aid flows. The extent to which domestically financed development projects are dependent on aid has also reduced, although not entirely. The hypothetical scenario of a sustained reduction or cessation of on-treasury aid (e.g. direct budget support) would therefore not have much of an impact on GoU recurrent spending, though there may be some limited impact if domestically financed development projects are prioritised at the expense of some non-essential discretionary recurrent spending. Over the medium-term, predictability of aid flows is very low, as donors have a tendency to overestimate aid commitments in the short-term and to underestimate their likely contributions in the medium-term. This undermines the reliability of the annual budget and, to an even greater extent, the outer years of the MTEF resource envelope. MFPED attempts to correct for these effects by applying differing discount factors on budget support and project aid in the short-term and by projecting an (unrealistic) increase in Net Credit to Government from BoU in the outer years of the Macro Framework, to ‗compensate‘ for the decline in project support projections. This strategy has primarily helped to improve the realism of the monetary programme (i.e. the mix between the use of international reserves and government securities) because it enabled a more realistic forecast of likely foreign exchange inflows from donor aid by forecasting predictable shortfalls.
2 This strategy has already been identified by Brownbridge and Tumusiime-Mutebile (2007) for Uganda.
Penrose (2009) discusses some of the implications of such fiscal rules for budget support programmes.

How Unpredictable Aid Influences Service Delivery
x
As part of its macroeconomic management, MFPED has attempted to impose sectoral ceilings through the MTEF process which include project aid, thereby asserting GoU‘s prerogative to undertake strategic resource allocation and clearly limiting the additionality of project aid to recipient sectors. This in turn has created perverse incentives for aid reporting at sector level and is likely to have increased the proportion of aid which is not captured within the MTEF and annual budget. This has not been helped by the lack of a single comprehensive system for collation of data on aid inflows – GoU and donors were commencing the development of an Aid Information Management System (AIMS) at time of writing which may go some way to addressing this.
Direct budget support (both general and sector budget support) is highly unpredictable, with an average shortfall or windfall (using absolute values) of 30% over 2000/01 – 2008/09. However, MFPED‘s adherence to an IMF programme totally insulates GoU from this unpredictability3. Under the programme shortfalls in budget support inflows are automatically offset by domestic borrowing and windfalls are automatically saved, thereby lowering the GoU‘s ‗Net Credit to Government‘ position with BoU and enabling a greater borrowing in future years if required. This is a strategy commonly adopted in countries operating IMF programmes, whereby the programme targets for government domestic borrowing are ―adjusted‖ for deviations in external budget resources and external debt service from what is budgeted. The ability of the MFPED to insulate the GoU budget from budget support shortfalls in this way requires that international reserves are large enough to absorb a shortfall without falling to levels regarded as inadequate – budget support unpredictability is therefore a much greater problem in countries with low levels of international reserves. In Uganda, service delivery is unaffected by high short-term unpredictability of budget support, despite the fact that donors have failed to make it into a stable and predictable form of budgetary finance. MFPED has also adopted a strategy of discounting donor aid commitments in the budget by 20% or so. Even without this strategy, the IMF programme would afford MFPED protection so long as the shortfalls were not persistent. Discounting therefore effectively serves to increase the realism of the GoU monetary programme. As with the policy of imposing sectoral expenditure ceilings which included aid flows, the risk mitigation strategies pursued by MoFEP (discounting, expenditure smoothing and deficit reduction) have at times been highly controversial with certain donors, who object to reductions in pro-poor spending that supposedly result from these practices. This allegation only applies strongly to MFPED‘s policy of pursuing a policy of fiscal deficit reduction (before grants). While this is in part a subjective question, donors in favour of a more expansionary macroeconomic policy severely undermined their case by providing such highly unpredictable aid flows. Expenditure releases by MFPED for expenditures within the Poverty Action Fund (PAF) are particularly reliable. GoU has made a political commitment to guarantee the predictable release of up to 95% of these funds to line ministries and districts. MFPED has been able to sustain this commitment by using the above-mentioned mitigation strategies that protect in-year cash flows despite a high degree of (both expected and unexpected) unpredictability in budget support and by prioritising PAF releases in the cash management process. The availability and coverage of budget data for budget support flows is relatively good, partly as a result of the introduction of a spreadsheet-based reporting system for commitments by MFPED‘s Macro Department which donor country office economists complete and return, and partly because budget support is by definition ‗on-treasury‘ and ‗on-account‘. The picture is less clear for project aid. Partly due to a widespread assumption within MFPED that budget support would comprise an increasingly large portion of total aid flows in recent years (a
3 Note that the government‘s budget is vulnerable to systematic or structural reductions in donor support,
despite this protection from short-run variations.

Uganda Country Case Study
xi
trend that has failed to materialise), aid financed projects have not been the subject of as much comprehensive attention as budget support within MFPED. Attention has focused more on trying to encourage donors to move towards budget support than on compiling data on projects and encouraging them to be moved on-system. While there is a similar spreadsheet based system to that used for budget support in operation for collation of project aid commitments, far less emphasis has been placed on systematically recording aid financed project execution data. While the progress made in increasing the number of project aid accounts held centrally at BoU has helped in assessing total aid flows, this does not provide sufficiently disaggregated data for budget execution reporting at Vote Function level. There is therefore a far lower quality of data available for project aid than budget support. Moreover, there are still a large number of projects that are on-budget but that do not have bank accounts in BoU. Recent reforms to the preparation of the Budget Framework Paper (BFP) and the annual budget designed to give budget documents a more programmatic and output-focused structure have revealed to GoU managers the fact that there is no comprehensive budget execution data for aid-financed projects at Vote Function level present. This makes assessing the predictability of project aid very difficult. Available evidence at the aggregate level suggests that the unpredictability of project aid is very high. Reasons for unpredictability of project aid are often highly idiosyncratic to specific projects, relating for example to the reliability of GoU counterpart payments, completion of agreed ‗prior actions‘ by GoU. However, managing the unpredictability of project aid has proved more difficult. MFPED does adopt the discounting approach applied to budget support for project aid, but the high degree of unpredictability of project aid continues to affect the in-year execution of externally financed projects in the development portion of the budget. Since the unpredictability of budget support is in part mitigated by in-year changes to domestically financed projects, the overall result is that unpredictable aid is more damaging to the development portion of the budget. One factor that mitigates partially the disproportionate negative effect on public investment is the cash flow protection afforded to the development budget allocations for the PAF and for core service delivery infrastructure (for example, main roads). Specific findings in the health sector Evidence from the health sector suggests that the extent to which aid unpredictability influences service delivery depends upon the detailed design of the aid instrument. The key area where aid unpredictability has the strongest adverse influence on service delivery is where aid is: i) channelled outside of national systems to some extent (either through Channel 2 or Channel 3); and ii) tightly earmarked to specific recurrent activities (e.g. provision of expensive in-kind drugs such as pentavalent vaccines, ACT anti-malarial drugs and ARVs). Highly discretionary aid flows such as budget support are less damaging because many more strategies are available to GoU managers (i.e. in MFPED and MoH) to mitigate the effects of their unpredictability. Although it does not capture all the variables at play, these differences are summarised in the following Table. Broad earmarking Tight earmarking
Channel 1 Aid instrument examples: GBS, Some SBS Some SBS, Some aid projects, GAVI ISS Funds
Influence of unpredictability on service delivery:
None. MFPED and BoU totally mitigate through IMF programme.
High, sector can make in-year budget transfers, request supplementary.
Channel 2 Aid instrument examples: No examples found Health Basket, Some aid projects, GFATM, GAVI, PEPFAR
Influence of unpredictability on service delivery:
N/A. Very High sector uses unorthodox strategies (e.g. borrowing drugs from Kenya), GoU ultimately increased own resources to reduce reliance on aid

How Unpredictable Aid Influences Service Delivery
xii
Channel 3 Aid instrument examples: No examples found PEPFAR, Some aid projects Influence of unpredictability on service delivery:
N/A Not primary study focus. Likely to be very high.
Nowhere have these effects been more pronounced than in the case of the ‗vertical‘ global health initiatives – GAVI and the Global Fund in particular. Both funds promised to channel millions of dollars to pre-defined operational/recurrent activities within the health sector, and both refused at first to fully use national PFM systems (contrary to requests from MFPED). Both initiatives were also subject to diversion and abuse that led to the suspension of disbursements, partly as a result of being off budget and hence not subject to full GoU accountability processes, based on a somewhat naive assessment of health sector political economy at the design stage. It is only recently that they have come more comprehensively ‗on-system‘ as MFPED had initially requested following damaging suspensions in both cases. Again, GoU sought to adopt strategies to mitigate the unpredictability of global health initiatives, such as providing supplementary budgets for health and the MoH borrowing drugs from neighbouring countries. Despite the attempts to mitigate the large shortfalls, there was a large reported adverse influence on service delivery, as illustrated within the immunisation programme where there was a marked fall in DPT3 coverage following the suspension of GAVI-ISS funding. In the longer-term, the health sector has gone about mitigating the adverse effects of the unpredictability of GHIs by negotiating ‗Long Term Institutional Arrangements‘ (LTIA) that are broadly acceptable to the GHIs and, to some extent, by reinvigorating the role of the SWAp in health sector management.
As a result of the vertical funds‘ entry into the health sector there has been an unravelling of gains in donor coordination and a re-fragmentation of sectoral funding. In particular, sector dialogue has come to focus disproportionately on GHI procedures (disbursement triggers, audits etc.) rather than national health system itself. This is an indirect effect of the high unpredictability of these funds, and has transferred MoH officials‘ and sector donors‘ attention away from strengthening sector systems for service delivery and onto how to resuscitate and manage the flow of vertical funding. The GHI approach also raises substantial challenges regarding the long-term sustainability of health sector service delivery, as they are tightly earmarked to specific drugs which have tripled the cost of immunisation and malaria prophylaxis for example. It is expected that GoU will ultimately take on the burden of financing these more expensive treatments, but the high medium-term, short-term and in-year unpredictability of the aid flows delivering them to date suggests that a smooth transition to GoU provision is likely to be very difficult to manage. From managing unpredictability to improving service delivery It should be noted that at sector and district levels the link between aid predictability and service delivery immediately becomes more complicated. At this level the regularity of resource flows between levels of government becomes important. Often regular releases from MFPED to line ministries and districts do not translate into regular disbursements to frontline service delivery units, and there is evidence of significant leakage, waste and inefficiency in health sector spending. Thus it is more difficult to attribute resource unpredictability to aid unpredictability as we move down the service delivery chain. However, by using these systems to channel aid and by focusing dialogue and capacity building on their strengthening, more ‗on-system‘ and discretionary aid modalities such as budget support offer a means of addressing this systemic unpredictability, while approaches that hive off service delivery through parallel systems tend to draw sector attention away from strengthening of core GoU systems as dialogue becomes fixated on the instruments themselves and how to address their flaws.

Uganda Country Case Study
xiii
Designing aid instruments that make the inherent unpredictability of aid flows more manageable for recipients is a necessary but not sufficient condition for improved government service delivery. Going beyond this rather narrow ‗do no harm‘ agenda and actually getting to grips with the substantive barriers to service delivery in government systems will – as Williamson et al. (2010) observe – take donor officials and their counterparts out of their comfort zones and consequently will require a substantial policy drive from donor HQs, especially in the light of the general move away from sector specialists in donor country office staffing. It will also require a more nuanced interpretation of ‗national ownership‘, seeing it not simply an excuse for the scaling back of donor engagement with sector problems. Genuine country-level engagement in the strengthening of sector systems for service delivery – including a robust dialogue over bottlenecks – will require a substantial shift in donor policy. This is a distant prospect however. Evidence from Uganda‘s health sector suggests that there is some way to go before the ‗do no harm‘ agenda is adequately addressed, let alone the genuine problems of health sector service delivery.


Uganda Country Case Study
1
1. Introduction 1. The Overseas Development Institute (ODI) has been contracted by the World Bank to undertake a study into how unpredictable aid influences service delivery. This involves: i) a desk-based literature and data review (ODI, 2009); ii) the development of a methodology for in-depth country case studies (ODI, 2009a); iii) undertaking a first ‗Pilot‘ country case study in Uganda; iv) helping to quality assure a second country case study in Ghana; v) undertaking a third country case study in Tanzania, and; vi) writing a synthesis report covering the findings of the desk-review and country case studies. 2. This report covers stage iii) of this process - the ‗Pilot‘ country case study in Uganda. The overall aim of the case study is to assess the extent of aid unpredictability in Uganda at both aggregate and sector level, to understand the strategies adopted by the Government of Uganda (GoU) in order to mitigate the effects of any unpredictability and to try to gauge the influence it ultimately exerts upon service delivery (insofar as it is possible to do so within the study‘s time and resource constraints). The analysis has been informed by the desk-based literature and data review (ODI, 2009) and has been compiled through and application of the draft methodology (ODI, 2009a), which will in turn be revised as a result of the experience of drafting this ‗Pilot‘ country case study. 3. The case study methodology (ODI, 2009) does not constitute a formal evaluation according to OECD-DAC criteria, nor does it try to make hard statements regarding the impact of unpredictable aid on outcomes. Instead, it seeks to draw plausible associations between observed patterns of aid flows, observed allocations of public finance through the budget process (both formal and informal) and observed patterns in terms of service delivery, as measured by GoU controlled outputs in the health sector. The study is based upon interviews with GoU and donor officials, GoU financial and monitoring data as well as background documentation. 4. The case study seeks to trace linkages between aid predictability and service delivery by drawing plausible associations between observed patterns of aid flows, observed allocations of public finance through the budget process (both formal and informal) and observed patterns in terms of service delivery, as measured by GoU health sector outputs. The study sought to distinguish between four different types of unpredictability: i) long-term fiscal sustainability; ii) medium-term predictability; iii) short-term predictability, and; iv) in-year predictability. It was also hypothesised from the outset that the detail of aid instrument design would be materially important to the Government‘s ability to mitigate unpredictability. In particular, whether aid is channelled ‗on-system‘ or ‗off-system‘ was considered important, with a distinction made between three ‗Channels‘ of aid delivery (key definitions used in the case study are summarised in Box 1). 5. Background documentation reviewed comprised government plans, budgets and reports and secondary sources such as donor commissioned reports including PFM diagnostics (see References for a full list of documents consulted). Interviews were undertaken with key officials from government and aid agencies. Government interviews focused on the Ministry of Finance, Planning and Economic Development (MFPED), the Ministry of Health (MoH), and officials in Mbale District. The study attempted to cover the period from 1999 to 2009, insofar as data and documentation were available and interviewees were able to cover authoritatively that range. In many cases data availability has restricted the analysis to more recent years. 6. The remainder of the report is structured as follows: Section 2 provides an overview of country context, presenting major trends and issues in macroeconomic management, the national aid environment and service delivery; Section 3 examines aid predictability at the aggregate level, how this influences aggregate resource allocation and what strategies GoU uses to address this; Section 4 considers how unpredictable aid – and resource flows more generally – are at the sector level, how this influences sector resource allocation, what strategies sector managers are able to

How Unpredictable Aid Influences Service Delivery
2
use to address this and what, if any, discernible effects unpredictable resource flows have had at frontline service delivery level, and the extent to which aid unpredictability drove this; Section 7 draws conclusions and identifies recommendations regarding areas of donor and GoU practice that are of general significance, both as positive examples to follow and potential mistakes to be avoided.
Box 1: Definitions of Key Study Terms Volatility refers to deviations between disbursed amounts from year to year. While we will address this dimension, it is not a primary focus of the study. Unpredictability is the primary focus of the study. Following Andrews and Wilhelm (2008) it has two constituent parts: reliability and expectation:
Reliability refers to the extent to which aid commitments are a reliable indicator of aid disbursements. Note for example that if disbursements are consistently the same proportion below commitments then they could still be regarded as reliable.
Expectations, and particular the notion of unexpected aid, refer to the understanding by recipients about how much aid they will receive, at which times and over which periods. Such expectations may be based on the credibility of commitment schedules or on other mechanisms for projecting aid flows (e.g. systematic adjustments based on experience).
We can also distinguish between four measures of (un)predictability:
Long-term fiscal sustainability: examining the vulnerability of the GoU budget to a substantial and sustained drop in aid flows at the aggregate level.
In-year predictability: typically measures how quarterly disbursements correspond to quarterly commitments.
Short-term predictability: how annual disbursements correspond to annual commitments.
Medium-term predictability: measures by how far ahead donors are able to provide firm financing commitments.
Aid windfalls and shortfalls: When disbursements are higher than commitments (as reflected in the budget) there is said to have been an aid windfall. Aid shortfalls occur when aid disbursements are lower than commitments. On-system: The distinction between on-system and off-system aid is used here to indicate whether external resources are captured on some or all elements of the public financial management system. Following Mokoro (2008), the main dimensions of ‗on-system‘ are:
On plan: Programme and project aid spending is integrated into spending agencies' strategic planning and supporting documentation for policy intentions behind the budget submissions.
On budget documents: External financing, including programme and project financing, and its intended use are reported in the budget documentation.
On parliament: External financing is included in the revenue and appropriations approved by parliament.
On procurement: External financing follows government‘s standard procurement procedures.
On treasury: External financing is disbursed into the main revenue funds of government and managed through government‘s systems.
On accounting: External financing is recorded and accounted for in the government‘s accounting system, in line with the government‘s classification system.
On audit: External financing is audited by the government‘s auditing system.
On report: External financing is included in ex post reports by government. Channel of aid delivery: We follow Mokoro (2008) in focusing on the Channel of aid delivery:
Channel 1: the normal channel for government‘s own-funded expenditures. Aid is disbursed to government‘s finance ministry (or ―treasury‖). Funds may or may not be earmarked.
Channel 2: funds are provided direct to ministries, departments and agencies (MDAs) and managed through special accounts outside of the regular government system. These funds are therefore held by a government body but do not follow normal government procedures.
Channel 3: expenditures are undertaken directly by a donor agency or by non-governmental organisations (NGOs) on its behalf. Government may receive assets or services in-kind but does not handle the funds itself.

Uganda Country Case Study
3
Aid modality: The term ‗aid modality‘ refers to the type of mechanism by which aid is delivered such as projects, common funds, sector budget support and general budget support. Prominent aid modalities in Uganda include:
Project aid: An individual development intervention designed to achieve specific objectives within specified resources and implementation schedules, often within the framework of a broader programme.
Direct budget support: Funds that are channelled directly to partner governments using their own allocation, procurement and accounting systems, and are not linked to specific project activities. All types of budget support include a lump sum transfer of foreign exchange; differences then arise on the extent of earmarking and on the levels and focus of the policy dialogue and conditionality.
Direct budget support in turn comprises both general budget support (GBS) and sector budget support (SBS), with the primary distinction being the nature of the dialogue. As OECD (2006) explains, the case of GBS, the dialogue between donors and partner governments focuses on overall policy and budget priorities, whereas for SBS the focus is on sector-specific concerns. However, as SPA (2005) makes clear, this distinction is not reflected in donor practice. It is more realistic to describe budget support as a spectrum. At one extreme is GBS with dialogue and conditions focused only on macro and cross-sectoral issues. At the other extreme is SBS focused only on sector-specific issues.
Additionality (of aid): The extent to which aid funding for a particular expenditure leads to the availability of additional budgetary resources for the budgetary unit receiving the aid (e.g. the entire government sector, a specific sector or sub-sector). Additionality is intended to address the issue of fungibility. However even if the aid is all allocated as additional resources to the intended expenditure in full, additional revenues from government‘s own (tax) resources that might have been allocated to that expenditure may be subsequently allocated elsewhere so that spending on the intended area does not increase by the full amount of the aid (Morrisey, 2005). Earmarking: This involves the justification of the provision of aid against certain public expenditures. Earmarking can be broad or narrow. Broad earmarking typically involves justification of aid against overall sector expenditures, or the development budget for that sector. Specific earmarking involves the justification of aid against specific budget lines such as text book procurement or grants for classroom construction or specific projects.
Source: Study Methodology (ODI, 2009).

How Unpredictable Aid Influences Service Delivery
4
2. Country Context
2.1 Macro situation
7. Between being granted independence from Britain in 1962 until 1986, and in part as a legacy of policies pursued by the colonial administration, successive governments did little to diminish and at times actively promoted ethnic and religious divisions and conflicts. The social conditions that drove conflict included social inequality, ethnic and religious factionalism and poor conflict resolution mechanisms (see Moncrieffe (2004) for a more detailed overview). In particular, the south of the country, especially the large area of the former Kingdom of Buganda that surrounds Kampala, was relatively prosperous economically in comparison with the North. This economic division, further compounded by cultural differences, created political divisions which have persisted into the present (Barkan, 2004). 8. The National Resistance Movement (NRM) assumed power in 1986 following five years of fighting between the National Resistance Army (NRA) and government forces. President Yoweri Museveni and the NRM have governed Uganda through to the present day. The first multi-party elections were held in 2006. That marked the end of government through a no-party political system (known as ‗the Movement‘). According to Moncrieffe (2004; p. 7): ‗The Movement [was] defined as a broad based, inclusive and non-partisan political system, in which anyone [could] present himself for election, and in which decisions [were] based on merit rather than political affiliation.‘ Political parties were allowed to operate, albeit under a legislative framework that proscribed both the nomination of candidates and campaigning for their election. The Movement has been and continues to be dominated by President Museveni and has a strongly clientelistic character (Barkan, 2004). 9. After initial economic instability, the Museveni government began to pursue much stronger fiscal discipline, thereby bringing down inflation and stimulating growth (OPM, 2008; p. iii).4 A new constitution was passed by an elected constitutional assembly in 1995 and was followed by elections for the new unicameral parliament and the presidency in 1996; Museveni won the latter with 76% of the vote. Under Museveni there have also been substantial public sector reforms, including extensive privatisation of state owned entities and an ongoing programme of administrative and political decentralization. 10. In recent years, Uganda has enjoyed some of the highest GDP growth rates in Africa, with real GDP growth averaging at about 7.6% per year over the last decade. In 2008/09 financial year, real GDP grew by 7%, substantially higher than the Sub-Saharan average of 2.4%. There has been a significant restructuring of the country‘s economy, with service sector output now exceeding agricultural production, although the majority of the population still depend on subsistence farming. The major explanatory factors for this good economic performance are improved domestic policies, political stability and significant external assistance. Internal conflict has remained a persistent problem: a long civil war in the northern part of the country has only recently shown signs of abating after a significant weakening of the Lord‘s Resistance Army (LRA), the rebel group that has been fighting the Government. An opportunity has thus arisen for the north to both contribute to and benefit from economic growth and for the inequalities between the north and other parts of the country begin to be bridged. 11. Steady economic growth has contributed to the reduction of the proportion of people living below the poverty line. In 1997, 44% of the population lived below the poverty line compared to
4 Emmanuel Tumusiime-Mutebile, former Permanent Secretary/Secretary to the Treasury at MFPED (1992 -
2001) and now BoU Governor (2001 - ) was particularly influential in promoting this policy of fiscal rectitude and macroeconomic stability. He was also a central figure in the consolidation of GoU finance and planning functions in a single ministry (which coincided with his appointment to head the new Minstry in 1992) and helping to build (and was subsequently aided by) a ‗developmental elite‘ within MFPED.

Uganda Country Case Study
5
31% in 2005/06. Per capita incomes increased by about 41% between 1999 and 2008 despite a very high population growth rate of 3.2% a year on average. However, poverty reduction has been highest among households employed in the formal sector and involved in off-farm activities, while income inequality between the rural and urban areas and between regions remains high5. Northern Uganda, which has endured prolonged insecurity, has the highest rate of poverty at 61%. Moreover, the gap between the North and the national poverty headcount widened from 17% in 1992 to 30% in 2005/06; poverty in the North fell by less than any other region since the early 1990s (Regional Forecasts, 2007). 12. Since 1992, the country has had a track record of strong macroeconomic management. This has involved good macroeconomic stability and discipline, a flexible exchange rate regime and keeping inflation low, although inflationary pressures have occurred more recently due to the global financial crisis. Political stability, improved domestic policies, and the commitment to the maintenance of fiscal discipline and macroeconomic stability have made Uganda stand out as an African ‗success story‘, attracting aid donors and in turn facilitating a rapid expansion in aid flows to Uganda, particularly between the years 1992 and 2000. 13. Increases in aid – notably budget support and debt relief – allowed both the build-up of foreign exchange reserves (as some aid is saved as foreign exchange by the Bank of Uganda) and higher levels of government expenditure. Government expenditures rose far more rapidly than domestic revenues resulting in the overall deficit, excluding grants, widening from about 6.3% of GDP in 1997/98 to 12.1% of GDP in 2001/02, before declining to 8.3 % in 2008/09 (see Table 1). The gradual reduction in the size of the fiscal deficit has been primarily driven by concerns within the Bank of Uganda (BoU) and Ministry of Finance and Economic Planning (MoFPED) regarding the possible adverse macroeconomic consequences and fiscal sustainability of such aid financed deficits. On the macroeconomic side, there were worries regarding the impact on private sector credit, interest rates and the structure of relative prices. As regards the sustainability of public finances, aid comprises about 50% of total resources, and this makes GoU vulnerable to fiscal shocks since these are resources over which GoU had no direct control (Brownbridge, 2003; Brownbridge and Tumusiime-Mutebile, 2007).6 14. Despite the rise in public expenditures, monetary and fiscal discipline has been maintained by inter alia sterilisation of aid flows – i.e. ‗mopping up‘ the excess domestic liquidity created by aid inflows in order to maintain control of monetary aggregates and hence inflation. The BoU has two instruments with which to achieve this: the issuing of domestic debt instruments such as Treasury Bills or the sale of foreign exchange. Both were used as aid financed deficits increased in the late 90s, with fourfold rise in the BoU‘s programmed foreign exchange sales between 1998/9 and 2001/2 and a sixfold increase in net sales of domestic securities from Shs 42 billion in 1997/8 to Shs 266 billion in 2001/2 (Brownbridge and Tumusiime-Mutebile, 2007; pp. 198 - 199).
Table 1: Trends in Selected Fiscal Aggregates 1999/0
0 2000/ 01
2001/ 02
2002/ 03
2003/ 04
2004/ 05
2005/ 06
2006/ 07
2007/ 08
2008/ 09
Domestic Revenue % GDP 10.9 10.8 11.6 11.7 12.1 12.0 12.9 12.4 13.8 12.9
Government Expenditure % GDP 20.0 20.8 23.7 22.3 22.6 20.5 20.9 19.4 18.4 20.6
Fiscal Deficit % GDP -9.1 -10.0 -12.1 -10.5 -10.5 -8.5 -8.0 -7.0 -4.6 -7.8
Domestic Interest Payments %Total Government Expenditure
1.6 2.7 3.5 4.3 6.1 5.3 4.9 4.8 6.0 5.0
Source: Author's calculations from various Annual Budget Performance Reports
5 The Gini coefficient marginally declined from 0.43 in 2002/03 to 0.41 in 2005/06.
6 Reductions in donor aid (unless purely temporary) would result in either (i) disruptive cuts to public
expenditures, to avoid increases in domestic bank borrowing which would fuel inflation and/or (ii) crowd out the private sector from credit markets if GoU resorted to borrowing.

How Unpredictable Aid Influences Service Delivery
6
2.2 National aid Environment
15. Uganda is highly aid-dependent. According to Government of Uganda statistics, on-budget donor aid averaged 9.6% of GDP between 1999/00 and 2008/09 and was as high as 12.3% of GDP in 2001/02.7 Data on off-budget donor aid is scarce, but recorded information from the Ministry of Finance indicates that it is quite substantial, at about 3.8% of GDP in 2007/08. During the same period, on-budget donor aid as a percentage of total government expenditure averaged about 45.4%, although it was as high as 56.5% in 2000/01 (see Figure 1).
Figure 1: On-Budget Aid as a Share of GDP and Total Public Expenditure (1999/00 – 2008/09)
Source: Author's calculations from various Annual Budget Performance Reports. 16. The significant dependency on aid means that aid volatility and unpredictability can pose serious challenges to proper planning and delivery of services. In Uganda‘s case, aid is both volatile and unpredictable. As shown in Figure 2 below, aid is more volatile than tax revenues (where volatility is measured as the deviation of observed flows from the constant shilling trend of on-budget aid).
7 The term ‗on-budget aid‘ is used here to refer to aid reflected in the Annual Budget document as
appropriated by Parliament. Where on-budget is used more broadly to refer to inclusion of aid other dimensions of the budget cycle this is clearly specified.
0
10
20
30
40
50
60
0
2
4
6
8
10
12
14
% GDP [LHS] %Total Public Expenditure [RHS]

Uganda Country Case Study
7
Figure 2: Volatility in on-budget aid and tax revenue (deviation from trend)
Source: Author's calculations from various Annual Budget Performance Reports. 17. For the period 1999/00 – 2008/09, outturns are in most of the years either higher or less than the budgeted level. On average, about 92.8% of the expected donor aid was disbursed over the period. However there are wide variations, with as little as 73% and 62% disbursed in 2005/06 and 2007/08 respectively, compared to 124% in 2008/09 (see Figure 3 below).
Figure 3: On-Budget Aid (expected) and Outturns (1999/00 – 2008/09), Billions of Shillings
Source: Author's calculations from various Annual Budget Performance Reports.
0
20
40
60
80
100
120
140
0.00
500.00
1,000.00
1,500.00
2,000.00
2,500.00
3,000.00
2000/01 2001/02 2002/03 2003/04 2004/05 2005/06 2006/07 2007/08 2008/09
Budget (expected) [LHS] Outturn [LHS] Disbursement (%) [RHS]

How Unpredictable Aid Influences Service Delivery
8
18. As regards the composition of aid, Uganda has received amongst the highest sustained flows of direct budget support (both general and sectoral) of any developing country. However, contrary to the expectations of GoU – expressed in its Partnership Principles document (see Box 2) – that an increasing proportion of aid would be channelled via direct budget support, projects remain a major source of funding and there has been no marked trend of increases in budget support as a proportion of total aid (see Figure 4 below). This has had significant implications for aid management, as discussed in Section 3.1 below. Figure 4: Captured Project Aid and Direct Budget Support Outturns (2000/01 – 2008/09), UGX Billions
Note: Provisional outturn only for 2008/09. Source: Annual Budget Performance Reports.
19. MFPED‘s strong preference for direct budget support over other aid modalities means that sector budget support – as opposed to common (or basket) funds which are common in other aid dependent countries and entail much weaker integration of aid flows with national systems – represent the main pooled funding arrangements at sector level.8 Humanitarian aid remains important in Northern Uganda, and is second only to Central Government transfers as a source of finance (Regional Forecasts, 2007). Overall though, the majority of aid is provided in the form of financial transfers to GoU. The aid environment is highly congested with over 40 donors operating in Uganda. 20. An important and related issue is the extent to which aid uses national PFM systems. This has received considerable attention since its adoption as a key measure of aid effectiveness under the Paris Declaration framework. Data on the extent to which aid uses country systems is by definition scarce since much ―off-budget‖ is simply unreported. Nonetheless the Paris Declaration surveys do provide an indication, broken down by donor and summarised in Table 2 below. Overall, the proportion of aid to GoU using country systems (budget execution, financial reporting and auditing) has declined from 60% in 2005 to 57% in 2007 and the proportion of aid to GoU using national procurement systems has also declined from 54% to 37% over the same period.9
8 While in practice the boundaries between SBS and common or basket funds are blurred, broadly speaking,
common or basket funds differ from SBS in that they use separate PFM systems and procedures to those of government (e.g. derogations for audit, procurement, treasury). These differences are materially important for the development of national systems as Handley (2009) illustrates. 9 It is important to note that the Paris Declaration survey results for all countries for 2005 (including Uganda)
should be viewed with some caution. Significant improvements were subsequently made in the study

Uganda Country Case Study
9
Box 2: Excerpts from the GoU „Partnership Principles‟ Document
General Principles
The Poverty Eradication Action Plan (PEAP) identifies the development objectives for Government and its development partners. Effectively linking donor support with the PEAP is the main rationale for setting out these Partnership Principles. The delivery of financial assistance (aid) by development partners must be fully compatible with the national budget process and with Government ownership of the budget. Government‟s Preferred Modalities of Support from Development Partners The modalities of donor support are important because different aid modalities are not equally compatible with efficient budget planning and management and national ownership of the budget. The Government‘s ranking of donor support modalities, in descending order of preference, is as follows: (i) General budget support; (ii) Budget support earmarked to the Poverty Action Fund; (iii) Sector budget support, and; (iv) Project aid. Government cannot guarantee that sector budget support will increase the relevant sector‘s expenditure ceiling above what would have been otherwise provided in the Medium Term Expenditure Framework (MTEF). The level of any sector‘s expenditure ceiling cannot be determined by the amount of sector budget support promised to that sector. Government must control aggregate spending by the Government, and if one sector ceiling is increased owing to the receipt of sector budget support this will inevitably mean that cuts must be made to the spending ceilings of other sectors. This in turn can lead to a sectoral composition of expenditure which is not optimal from the Government‘s point of view, nor indeed from the point of view of the majority of donors. Project aid or technical assistance can provide benefits such as the transfer of skills and capacity development. Additionally it can be an important source of support to meet critical humanitarian needs. To maximise the benefits of this support, development partners will ensure that their support is integrated within the sector wide approaches where these exist and will work with the MFPED to ensure that their support is integrated into the MTEF. The Government is determined to reduce its dependence on donor aid over time. Accordingly, it is committed to increase domestic revenue mobilization through systematic enforcement of tax legislation, improved tax administration and collection, new revenue measures as appropriate, and expenditure restraint. Reflecting Development Assistance in the Budget All development assistance to Central Government should be included in the budget estimates and MTEF. Data on development assistance for each fiscal year should be provided to the Ministry of Finance by October of the preceding fiscal year. As far as is possible, development partners should provide three year rolling projections of all budget and project support. Development partners should also assist the Ministry of Finance to compile accurate and timely budget outturn data by reporting to the Ministry of Finance the disbursements to each project that they are funding on a quarterly basis. Sectors will have to budget within an overall ceiling set by the Government which will include all donor projects. This will be a hard budget ceiling, implying that an increased level of project support expenditures will have to be matched by lower GoU budget expenditures. Global Funds Any financial assistance received from Global Funds will be utilised as sector budget support or project aid and integrated into the budget in line with the principles set out [in the rest of the document].
Source: MFPED, 2003.
21. By contrast, the overall quality of GoU PFM systems (as rated by the PEFA methodology) has broadly improved over the same period (GoU, 2009). The use of country systems varies
methodology which make the 2007 data much more reliable though still not perfect. Data for 2005 and changes between 2005 and 2007 should therefore be seen as broadly indicative, not precise.

How Unpredictable Aid Influences Service Delivery
10
substantially by aid modality: all budget support uses country systems by definition, while project aid can vary in the extent to which it uses country systems (on-budget document, on-report, on-audit, on-procurement etc.). It is estimated that the average use of government procedures in project aid is around 10% (GoU, 2009). As noted in Figure 4 above, there has been no marked change in the composition of aid flows in favour of budget support over 2000/01 – 2008/09.
Table 2: How much aid for the government sectors uses country systems?
Aid
disbursed by donors for
government sector
(USD m) a
Budget execution (USD m)
b
Financial reporting (USD m)
c
Auditing (USD m)
d
2005 (for ref.)
2007 avg
(b,c,d)/a
Procurement Systems (USD m)
e
2005 (for ref.)
2007 e / a
AfDB 86 86 19 19 0% 48% 19 0% 22%
Austria 6 4 4 4 60% 74% 4 95% 74%
Belgium 5 5 5 5 56% 100% 5 84% 100%
Denmark 50 18 18 18 40% 35% 18 40% 35%
EC 144 49 49 49 40% 34% 5 40% 3%
France -- -- -- -- 29% -- -- 100% --
GAVI -- -- -- -- 33% -- -- 0% --
Germany -- 5 5 5 11% -- 20 69% --
Global Fund 60 60 -- -- 0% -- -- 0% --
Ireland 44 36 40 43 97% 90% 39 97% 88%
Italy 7 -- -- -- 68% -- -- 68% --
Japan 18 -- -- -- 0% -- -- 0% --
Netherlands 45 43 43 43 95% 96% 43 60% 96%
Norway 30 -- 10 10 93% -- 22 100% 72%
Sweden 28 19 21 23 47% 74% 15 62% 54%
UK 81 81 81 81 82% 100% 81 82% 100%
UN 132 15 13 33 11% 15% 12 0% 9%
US -- -- -- -- -- -- -- -- --
World Bank 399 135 372 372 86% 73% 135 65% 34%
Total 1,135 557 679 706 60% 57% 419 54% 37%
Source: OECD (2008).
2.3 Sector aid environment
Health Sector 22. The Ugandan health sector receives considerable development assistance, with aid flows for health having increased markedly over the past few years, most notably with the introduction of funding from global health initiatives (GHIs). On-budget external assistance as a proportion of total sector spending averaged approximately 43% over the period 2000/01 – 2008/09 (see Figure 5 and Table 12 below). Despite the volume of development assistance, most health sector external funds are earmarked, limiting the flexibility of funding both in terms of initial allocations and scope for reallocation within the sector. In addition, the additional aid to the sector over the past ten years has been driven by the Global Health Initiatives (GHIs) and has been very specific as a result, focusing on HIV & AIDS, Malaria, tuberculosis (TB) and immunisation programmes. The sector‘s heavy reliance on external assistance to finance necessary but expensive health interventions (in particular antiretroviral drugs and new vaccines) also poses a risk regarding the fiscal sustainability of these activities, which are primarily operational (i.e. recurrent) in nature.
Figure 5 23. Unlike on-budget aid, which has remained relatively stable over the study period, off-budget spending in the health sector has increased rapidly as a result of the introduction of GHIs. In particular, the President's Emergency Plan for AIDS Relief (PEPFAR) alone provided USD 575

Uganda Country Case Study
11
million for HIV & AIDS over the period 2006/07 – 2008/09. Expressed as a proportion of all off-budget spending, off-budget health spending increased from 9% in 2005-06 to 12% in 2006-07 and was projected at 14% in 2007-08 (World Bank, 2009; p. 40). 24. Despite the volume of development assistance, most health sector external funds are earmarked, limiting the flexibility of funding both in terms of initial allocations and scope for reallocation within the sector. In addition, the additional aid to the sector over the past ten years has been driven by the Global Health Initiatives (GHIs) and has been very specific as a result, focusing on HIV & AIDS, Malaria, tuberculosis (TB) and immunisation programmes. The sector‘s heavy reliance on external assistance to finance necessary but expensive health interventions (in particular antiretroviral drugs and new vaccines) also poses a risk regarding the fiscal sustainability of these activities, which are primarily operational (i.e. recurrent) in nature.10
Figure 5: Health Sector Funding Captured on Budget/MTEF
Source: AHSPR 2007/08, PER 2005/06.
25. In a bid to improve the harmonisation of donor interventions with one another as well as their alignment with GoU priorities and systems, various coordination mechanisms have been developed. Most notably, the Ministry of Health – with the encouragement of MFPED – sought to manage development cooperation through the introduction of a Sector Wide Approach (SWAp). The development of the health SWAP began in 1998, when health sector donors were invited to participate in the elaboration of the National Health Policy (NHP) and Health Sector Strategic Plan (HSSP), with a view to engaging in discussions to adopt a SWAp for the implementation of the new Policy and Strategy. Coordination among SWAp members improved dramatically, with partners involvement and participation in the planning, implementation and reporting improving more so with the implementation of HSSPI. It is important to note that the development of the SWAp preceded the advent of large funding flows through the GHIs, which were planned and channelled outside the SWAp, thereby undermining the extent to which it was genuinely ‗sector wide‘.
2.4 Trends in health sector service delivery
26. Numerous reforms have been implemented in the health sector since the early 1990s, with significant impact on the sector, contributing to significant improvements in health outcomes, specifically over the period 1999/00 – 2003/04, after which the indices tend to either stagnate or improve at a decreasing rate. Between 1990 and 2000 the infant mortality rate (IMR), which 10
Uganda FS Health, World Bank 2009

How Unpredictable Aid Influences Service Delivery
12
measures the number of children who die before their first birthday per 1,000 live births, reduced from 122 to 88 deaths per 1,000 live births, while the maternal mortality rate (MMR), which measures the number of maternal deaths per 100,000 live births, reduced to 505 from 527 within the same period. 27. Uganda has one of the highest population growth rates in the world (3.2% per annum), which presents a challenge to efforts to improve per capita health service delivery, as this seldom meets the pace of population growth. The leading causes of morbidity and mortality according to the 2007/08 Annual Health Sector Performance Report (GoU, 2008) are malaria, acute respiratory tract infections, diarrheal diseases, malnutrition, prenatal and maternal conditions, HIV/AIDS and tuberculosis. In a bid to effectively address these diseases, the MoH is promoting the Uganda National Minimum Health Care Package (UNMHCP), a framework for delivering services that target maternal and child health (MCH), prevention and control of communicable and non-communicable diseases, and health promotion.
Table 3: Trends of PEAP Indicators 199/00 - 2007/08
Indicator 1990 1995 2001 2006 PEAP Target 09
MDG Target (2015)
Infant Mortality Rate (deaths per 1000 live births)
122 81 89 75 68 Reduce IMR by 2/3 = 41
Under 5 Mortality Rate (deaths per 100,000 live births)
180 156 158 137 103 Reduce U5MR by 2/3 = 60
Maternal Mortality Rate (deaths per 100,000 live births)
- 527 505 435 354 Reduce MMR by 3/4 = 131
Stunting (Chronic Malnutrition)
38 38 38.5 28 Reduce people suffering from malnutrition by 1/2 = 19%
Total Fertility Rate 6.9 6.9 6.5 5.4
Source: HSSP Mid-Term Review 2008.
28. Other health sector performance indicators suggest some improvements in health service delivery over the study period. As Table 4 illustrates, outpatient department utilisation and DPT3 vaccine coverage both doubled from 1999/00 to 2007/08 while the proportion of deliveries in health facilities and the proportion of approved posts filled with trained health workers also increased.
Table 4: Health Key Performance Indicators (1999/00 - 2007/08) 99/00 00/01 01/02 02/03 03/04 04/05 05/06 06/07 07/08
Outpatient Department (OPD) Utilisation in Government and PNFP Health Units
0.4 0.43 0.6 0.72 0.79 0.9 0.9 0.9 0.8
DPT3 Vaccine Coverage (%) 41 48 63 84 83 89 89 90 82
Deliveries in Health Facilities (%) 25.2 22.6 19.0 20.3 24.4 25 29 32 33
Approved posts filled with trained health workers (%) 33 40 42 66 68 68 Na 38.4 51
National average HIV Sero-Prevalence at Ante-Natal Clinic (ANC) Surveillance Sites (%)
6.8 6.1 6.5 6.2 na 6.1 na na 7
Health facilities without stock-out of 5 tracer medicines and supplies (%)
35 27 35 28
Households with a pit latrine (%) 57 58 58.5 63
Couple Years of Protection (CYP in ‗000s)* 234.2 309.7 325.4 361.1
Note: *CYP is a measure representing the total number of years of contraceptive protection provided and is calculated by taking the number of units of contraceptives distributed and dividing that number by a factor representing the number of units needed to protect a couple for one year. Source: Selected AHSPRs.

Uganda Country Case Study
13
29. Focusing on aggregated national level data masks significant regional variation in health outcomes. In particular, health service delivery indicators at output and outcome level are significantly weaker in the ‗wider North‘ (comprising the Acholi, Lango, West Nile, Teso and Karamoja Regions). As Table 5 illustrates, the North fares poorly relative to other areas of the country across a number of key health outcome indicators, in particular regarding infant mortality and child nutrition.
Table 5: Health Service Delivery Outcome Indicators by Region
Region
Delivery – access Delivery - quality
Outcome
Distance to nearest health
facility (% > 5km, 2002)
Distance to nearest
Government Health Facility
(% > 5km, 2004)
Availability of Antibiotics in health clinics
(1999/00)
Infant mortality
(deaths per 1,000 live
births, 2000)
Underweight children (2000)
Central 22% 28% 91% 72 19.9%
East 25% 24% 79% 89 22.5%
North 34% 25% 75% 106 25.0%
West 28% 28% 85% 98 23.7%
National 27% 26% 83% - -
Source: Regional Forecasts (2007).
30. The poor performance of the northern region in terms of health outcomes is matched by very poor relative performance against service delivery indicators. Table 6 shows performance on selected HSSP II indicators in selected Northern districts. Most districts in the Acholi/Lango and Karamoja regions fare worse than the national average on a majority of the indicators selected. Furthermore, even within the North, Karamoja region is particularly deprived, with some of the lowest ranked districts in the country on health output indicators.
Table 6: Performance of Northern Uganda Districts Using Selected HSSPII Indicators (2007/08)
District OPD
Attendance DPT 3
Coverage Deliveries IPT2
Coverage Latrine
Coverage Ranking
Acholi/Lango Region
Apac 0.7 38% 16% 28% 53% 59
Amuru 1 87% 23% 40% 34% 32
Dokolo 0.7 89% 16% 39% 49% 62
Gulu 1.4 95% 37% 40% 42% 11
Kitgum 1.3 59% 35% 48% 19% 45
Pader 1.1 96% 32% 48% 38% 33
Amolatar 0.7 120% 22% 39% 49% 14
Oyam 0.5 71% 19% 72% 53% 54 Karamoja Region
Moroto 0.5 75% 13% 63% 10% 71
Nakapiripit 0.1 60% 4% 90% 3% 79
Abim 2.2 124% 38% 50% 2% 65
Kotido 0.8 80% 12% 44% 2 66
Kaabong 0.7 46% 4% 30% 2% 77 National Average 0.8 82% 22% 62% 63% -
Note: Shaded areas represent indicators below the national average. Source: Annual Health Sector Performance Report 2007/08.

How Unpredictable Aid Influences Service Delivery
14
3. Aid predictability and its influence at the aggregate level
3.1 Planning and budgeting at national level
Linkages between policy priorities, plans and budgets 31. Until the mid 2000s medium-term planning was centred around the Poverty Eradication Action Plan (PEAP), first formulated in 1997 for the period 1997/98 – 1999/2000 and revised in 2000 (for 2000/01 – 2002/03) and again in 2004 (for 2004/05 – 2007/08). The PEAP is Uganda‘s Poverty Reduction Strategy (PRS), and established poverty eradication as the government‘s fundamental formal policy objective. The PEAP process was initially characterised by an unusually high degree of national ‗ownership‘, with strong political backing and leadership from MFPED. In its early years, the PEAP was the single overall national planning document, influencing priorities for spending not only among but within sectors. The influence of the PEAP has waned in recent years, although it is nominally still the overall guiding plan. The PEAP/PRS is due to be replaced with a 5-year National Development Plan (NDP) starting in 2010/11, which is being developed by the National Planning Authority, a body established in 2003. MFPED remains responsible for overseeing the national planning, budgeting and accounting processes as well as aid management. 32. While the PEAP remains the single overall national planning document, there are many other national plans and policy documents. These include medium-term sector plans, and district plans. Strong linkages between the PEAP, other national planning documents and the annual budget are clearly crucial in order to ensure that plans are tied to national budget allocations. Indeed, the PEAP has relatively strong links with the budget process by comparison with other African countries (Williamson, 2006). Box 3 describes key GoU planning instruments and processes in more detail.
Box 3: A Guide to Planning Processes in Uganda
PEAP: The national planning framework on which more detailed sector strategies are based. The PEAP will be replaced with a 5-year National Development Plan (NDP) from 2010/11. Sector Planning: Provides technical specifications of sector priorities, disciplined by hard budget constraints. A Sector in Uganda is made up of those Ministries, Departments and Agencies (MDAs) and Local Governments or elements of those MDAs involved in a certain function of government (e.g. health or transport). Representatives of sector MDAs come together in Sector Working Groups (SWGs) between October and April to prepare the sector budget framework paper (BFP), which set out the medium-term budget strategy for the sector. These sector plans are then consolidated into an overall national BFP, which is presented by the MFPED to and approved by the Cabinet and since 2002 subsequently forwarded to Parliament for comment. District Planning: Implementation plans for sector strategies based on local priorities and needs. The BFP process is replicated at the level of local governments (Districts), which also prepare BFPs. Districts are responsible for preparing and approving their own budgets, but earmarked conditional grants controlled by MFPED limit their autonomy over resource allocations. Expenditure Frameworks: The Medium-Term Expenditure Framework (MTEF) is a rolling 3 year (now 5-year) expenditure planning, setting out the medium-term expenditure priorities and hard budget constraints against which sector plans can be developed and refined. It guides resource allocation in the annual budget, including on-budget donor aid inflows, and is embodied in the national BFP. The national BFP/MTEF is discussed and approved by the cabinet, before being commented upon by Parliament. Annual Budget and Ministerial Policy Statements: Following the preparation of sector BFPs, MDAs prepare their annual budget estimates which are reviewed and compiled by the MFPED into the annual government budget which is presented to Parliament in June. MDAs also prepare Ministerial Policy Statements which set out the annual budget in detail and are ready by the end of June. Parliament is required to approve the estimates within three months of their being presented for discussion.

Uganda Country Case Study
15
Source: MFPED (2000) and Williamson (2008), modified by the Authors.
Box 4: Increasing emphasis on service delivery outputs in planning, budgeting and reporting
A number of recent reforms have increased the output orientation of the upstream planning and budgeting process and downstream reporting and accounting process. On the upstream side, Uganda has introduced a form of programme based budgeting (termed Vote Functions), beginning with the changes to the structure of the 2007/08 Annual Budget Performance Report and a newly introduced Output Budget for 2008/09, which was published alongside the traditional Approved Budget Estimates. The new structure was also used in the preparation of sector and national BFPs for 2008/09, and the annual Ministerial Policy Statements prepared by spending agencies for discussion by parliament. A Vote Function represents the services or outputs which a spending agency is responsible for (such as primary healthcare or main roads construction). For central government institutions, the budget for a Vote Function is made up of the allocations to the relevant departments and projects while for local governments it is made up of the respective grants. The new approach merges development and recurrent/operational portions of the budget into one (a distinction that had anyway lost much of its meaning), putting programmes and projects alongside one another as defined by their outputs. Political commitment has been crucial to the success of the reforms. Civil servants in spending agencies took the preparation of Ministerial Policy Statements far more seriously than BFPs because ministers have to present the former to Parliament. Further, the level of effort employed by civil servants was directly proportional to the seriousness with which the respective ministers took this exercise. In parliament, the budget committee expressed their appreciation of the new and more transparent presentation of budget statements which for the first time provided a systematic and consistent presentation across ministries. At technical level, the process has forced spending agencies to engage with heads of department and projects in budget formulation more actively than previously. Moreover, there is a growing realisation within MFPED that for output-based reforms to work, there needs to be an improvement in the predictability of the annual budget for spending agencies, as well as a relaxing of input controls (e.g. restrictions on in-year reallocations). The process has also highlighted the fact that there is currently no systematic GoU collection of budget execution data for aid financed projects. This lacuna has been highlighted by the new output oriented budget structure and has spurred efforts within MFPED to collect this data more systematically. In the second iteration of the new process (preparing the budget and plans for 2009/10), sectoral ownership of the process increased, with progress made in improving the quality of Vote Functions and associated outputs. The introduction by MFPED of a database tool to guide the process forced participants to use a common framework and logic to generate the BFP, which also ensured consistency with the Chart of Accounts (CoA), which will be amended in 2009/10 to help generate improved budget execution data against Vote Function outputs. Crucially, the annual budget itself for 2009/10 was presented using the Vote Function format. The new output orientation is not confined to planning and budgeting however. It is also evident further ‗downstream‘ in reporting. The Budget Monitoring and Accountability Unit (BMAU) within MFPED was established in July 2008, essentially as a watchdog to ensure that government programmes are being implemented effectively. BMAU monitoring is initially focused on agriculture, education, energy, health, industrial parks, roads, and water and sanitation. The Accounting Officers in these sectors are required to sign ‗Performance Forms‘ which set out target outputs (must be consistent with the BFP and the Ministerial Policy Statement) for the coming year, and link those outputs to the approved budget. BMAU staff regularly undertake unannounced field visits to gauge performance against these targets (and to verify the reliability of MDA reporting). The thread that links both the upstream and downstream planning and budget reforms is the degree of national ownership, particularly at the political level, and the simultaneous lack of significant donor involvement. This follows a period in which many observers perceived the political impetus for the planning and budgeting reforms of the late 90s and early 00s to be waning. Since around early 2008 a window of opportunity for reform has opened, seemingly related to the forthcoming national elections in 2011 and elite realisation that rapid economic growth has not been translated into sufficient improvements in service delivery. This has created space for a number of senior managers within MFPED, who are increasingly seeing the potential benefits of output orientation, to implement reform.

How Unpredictable Aid Influences Service Delivery
16
Source: Interviews and Williamson (2009).
33. In theory, the MTEF and Budget Framework Paper (BFP), are the instruments through which PEAP goals and objectives are implemented over the medium-term, within a given budget constraint. While in practice this is not always the case, the link between national priorities as set out in the PEAP and the MTEF and the annual budget has certainly been strengthened by the Poverty Action Fund (PAF), a mechanism used to channel resources to PEAP priority expenditures in the MTEF. Initially the PAF was designed to assure donors regarding the targeting and additionality of their funds, with GoU committing to ensuring that increases to sector and PAF budget support resulted in equivalent increases in the PAF budget. However, GoU now only commits to maintaining the PAF budget as a share of the total GoU budget. Crucially, GoU guarantees greater predictability in budget execution for PAF funds, with a commitment to ensure that PAF budget disbursements are at least 95% of budgeted amounts for PAF programmes. The funding sources are not tracked to specific expenditure lines, making it a ‗notional‘ or ‗virtual‘ fund which many donors consider their budget support to finance.
34. Although the PEAP and the MTEF are envisaged as working within one unified strategy, a number of factors have undermined the linkage between them over time. First, as noted in the independent Evaluation of the PEAP (OPM, 2008), political ownership of the PEAP has waned, with the consequence of an increase in non-PEAP originated initiatives. The close congruence of donor and domestic political priorities has reduced as the latter has shifted towards productive sectors and secondary education. This has weakened the link between plans and budgets and the policy alignment of Uganda‘s aid donors. Second, the MFPED and the Macroeconomic Policy Department in particular sets expenditure ceilings to ensure that the MTEF is consistent with the levels of donor support projected over the medium-term, projections of domestic revenue mobilization and domestic bank borrowing which is consistent with monetary policy objectives. A major weakness in projections of the total resource envelope is the unreliability of donor aid projections. With the exception of a few agencies, donors are unable to provide firm medium-term commitments of aid flows, thereby making projections of outer years less credible. 35. While the PEAP is now less relevant to government priorities and resource allocations, there have been some positive developments in planning, budgeting and reporting since 2008. A more recent initiative has seen a much greater output focus to budgeting and reporting, with sector performance indicators and targets introduced into sector and ministry BFPs since 2008/09 and included in the Annual Budget itself for 2009/10. Underlying this, BFPs are now being prepared using a common database tool which attempts to establish a stronger link between inputs and outputs. There have also been related changes to budget classification. As Williamson (2006) observed, the extent to which the MTEF and budget can be linked explicitly to PEAP and sector strategy objectives has been limited by the use of an administrative budget classification. The recent introduction of activity-based budget formulation and reporting (as part of the greater output orientation of BFPs and the budget) has helped to overcome this barrier, and has also made the budget a more transparent and intelligible statement of GoU plans. Box 4 provides more detail on the increased emphasis on service delivery outputs in planning, budgeting and reporting in central government. Aid management and integration in the planning and budget process 36. Since aid comprises such a large proportion of budgetary resources, it is important to understand how donor aid flows are integrated into the planning and budgeting process. The legal framework for aid management is provided by the 2003 Public Finance Accountability Act. The Act brought all aid to government, including project support, formally within the government‘s budgeting and accounting systems and stipulates that all loans and grants should be received by the Minister of Finance and paid into the consolidated fund or a special fund approved by Parliament. The Minister of Finance is required to incorporate the amount to be raised in Loans and Grants, and the costs of servicing loans, in the annual budget estimates and the Government

Uganda Country Case Study
17
is required to report information on the utilisation of grants to parliament on an annual basis. Therefore, by Law, all aid to GoU should be captured in the budget as approved by Parliament (on-budget documents), accounted for (on-account) and subject to audit (on-audit) (Williamson, 2007). 37. MFPED is the primary institution responsible for aid management. Within MFPED, four organisational units have direct aid management responsibilities: the Aid Liaison Department (ALD), the Macroeconomic Policy Department and the Budget Directorate. Their roles are summarised in Table 7 below. In 2004 MFPED required that all project aid accounts be transferred from commercial banks to the BoU. This has substantially improved the availability of information on project aid inflows and BoU‘s macroeconomic management of them. By June 2006 UGS 235bn (up from 57bn in 2005) was deposited in 467 project accounts in the Bank of Uganda (Williamson, 2007). These accounts fall under the supervision of the Accountant General, and are managed by the respective government spending agencies. Spending agencies are required to forward requests for disbursement of funds to the Accountant General who forwards the request to donors. Although most major donors and projects observe this system, some projects still do not hold central accounts, thereby distorting GoU fiscal deficit calculations. Further, while the move to BoU accounts does allow tracking of outturn data on project spending at the aggregate level, BoU project information cannot be used to track project expenditures at the Vote Function level. In fact, there is no comprehensive system for tracking project expenditure data at this level and budget execution reports routinely cite ‗N/A‘ for donor financed project outturn data (GoU, 2008c). Even measuring the short-term predictability of projects is therefore very difficult below a very aggregated level.
38. At time of writing, GoU and donors were commencing the development of an Aid Information Management System (AIMS) for Uganda which would explicitly incorporate the GoU Chart of Accounts (thereby making the information more relevant to the budget process) and, if well implemented and maintained, would considerably improve the quality of aid information available to GoU and donors.
Table 7: Organisational Units Within MFPED with Responsibility for Aid Management
MFPED Organisational Unit
Responsibilities Aid Information System?
Aid Liaison Department (ALD)
Liaison with individual donors, negotiating agreements, maintaining aid data, and managing interactions with national aid coordination mechanisms.
Development Management System (DMS)
Macroeconomic Policy Department
Collects aid data directly from donors for the purpose of macroeconomic planning and management purposes.
Spreadsheet based system for reporting committed and pipeline aid, both direct budget support and project aid
Budget Directorate Manages aid in the context of the planning and budget cycle. Sector desk officers have a significant role with respect to aid management at the sector level.
Budget Documents
Treasury Department
Line ministries channel their requests for aid disbursements via the Treasury, who then forward these requests to the relevant donors.
FMIS
Source: Interviews and adapted from Williamson (2007). 39. Sector Working Groups are central to aid management as well as budgeting at the sector level, as are Planning Departments in line ministries. More than half the sectors in the MTEF have established Sector Wide Approaches (SWAps) and including Annual Sector Review processes, which are used for agreeing to conditions relating to sector and general budget support and for reviewing their implementation and the implementation of donor funded projects and programmes. The quality of aid management at the sector levels depends very much on the pro-activeness of

How Unpredictable Aid Influences Service Delivery
18
the sector working group and in particular of the sector ministry planning department, the MFPED desk officers, and the donors themselves. 40. The recent ‗Vote Function‘ programme budget exercise revealed a significant weakness in aid management. That is, when it came to reporting budget execution data against donor projects, there is no systematic budget execution data within the financial management information system (FMIS) for project aid at present. Such project specific budget execution data was only available for the domestic component of development projects and donor project aid is largely ‗off-report‘. Interviewees suggested that this was because the initial surge in budget support as a proportion of total aid created an expectation within MFPED (formally expressed in the Partnership Principles of 2003) that the proportion of aid as budget support would continue to rise and, as a result, MFPED neglected to maintain and improve systems for integrating project aid into planning, budgeting and reporting processes. Monitoring and Evaluation 41. The monitoring and evaluation framework for the PEAP is fairly advanced in comparison to other African countries. The progress in the country‘s M&E system is in regard to the innovative data collection methods (including, at the national level, by the Uganda Bureau of Statistics, UBOS), influence on policy and improvements in aid alignment. UBOS produces censuses and household surveys of a relatively high quality by international standards. Household survey data is used to prepare estimates of trends in poverty and can be used to analyze trends and determinants of service delivery, particularly among the poor. However there are a number of limitations, including:
Dependency on donor funds generates instability and short planning horizons because the availability funds is not always assured.
Survey data is not collected on an annual basis and tends to focus on outcomes, and not outputs. It is therefore two or three steps removed from the input-output relationship at the nexus of service delivery. It is also highly aggregated, limiting demand and utilization by districts. The costs associated with survey data preclude regular
42. The MFPED carries out participatory work which sheds light on different aspects of poverty in Uganda. This work has influenced budgetary allocations. The Poverty Monitoring and Analysis Unit (PMAU), now the Budget Monitoring and Accountability Unit (BMAU) of the MFPED tracks the implementation of selected government programs/projects and observes how values of different indicators against stated goals and targets change over time (MFPED, 2008). A major limitation is that the quality of administrative routine data is poor, is not consolidated or utilized and there is lack of harmonized indicators as well as definitions and shared understanding of indicators. 43. The M&E system involves a large number of institutions including the Budget Monitoring and Accountability Unit (BMAU) in the MFPED, the Uganda Bureau of Statistics (UBOS), the National Planning Authority (NPA) and the Office of the Prime Minister (OPM). However there are weak M&E coordination arrangements. In 2003, a National Integrated M&E Strategy (NIMES) was prepared and put under the responsibility the Office of the Prime Minister (OPM) with the objective of improving the coordination of all monitoring activities. However the success of NIMES in this venture has been minimal. Parallel M&E systems in Government institutions and by donors continue to exist resulting in duplication of efforts. 44. As argued earlier, recent reforms in budgeting in which Budget Framework Papers (BFPs) are being prepared using a common database tool, may facilitate harmonization and improvements in quality of performance indicators. Coupled with effective budget monitoring by the BMAU of the MFPED, this has laid the groundwork for a more effective link between monitoring and decision making to be established.

Uganda Country Case Study
19

How Unpredictable Aid Influences Service Delivery
20
3.2 Predictability of aid flows at aggregate level
Medium-term predictability 45. Medium-term predictability as defined in this study relates to how far ahead donors are able to provide firm financing commitments. A recent exercise to comprehensively map aid information in Uganda has illustrated how aid information alters over the medium term (ODI, 2007). The aid information mapping exercise‘s financial data tool (FDT) generated a more comprehensive data set than the other two most comprehensive regularly compiled data sets: the GoU MTEF and the (undiscounted) Economist Group data compiled by the MFPED Macroeconomic Department. This data clearly illustrates how donor aid projections tend to focus on confirmed short-term commitments, with increasing uncertainty regarding projected aid flows in future years. Thus in the short-term aggregate aid data projections tend to be over-optimistic (since not all commitments are actually disbursed) while in the outer years, projections are unduly pessimistic as commitments tail off. MFPED attempts to correct for these effects by applying differing discount factors on budget support and project aid in the short-term and by projecting an (unrealistic) increase in Net Credit to Government from BoU in the outer years of the Macro Framework, to ‗compensate‘ for the decline in project support projections. This keeps the overall trend of the overall resource envelope realistic (Davies, 2009). However, the poor quality of donor aid projections inevitably makes these corrections a very rough and ready exercise, thereby undermining the reliability of medium-term plans and budgets (Williamson, 2007). Figure 6: Medium-Term Predictability at the Time of the 2006/07 Budget (Division of Labour
Financial Data Tool, GoU MTEF and Economist Group), 2006/07 – 2009/1011
Source: ODI (2007) and cited in Williamson (2007). 46. Evidence regarding the medium-term predictability of general budget support (GBS) in Uganda is available through the Strategic Partnership with Africa‘s budget support survey. It suggests that in 2006/07 donors disbursed US$249 million in GBS, but could only commit US$117 million for 2007/08, and US$18 million for 2008/09.
11 Note: FDT data includes information from the USA (not covered comprehensively by GoU or Economist Group data) but does not include data on Global Fund, China and BADEA (which are reflected in the Economist Group data).

Uganda Country Case Study
21
Figure 7: Medium-term predictability of General Budget Support (GBS)
Note: *Actual reported disbursement by GBS donors. Source: 2007 SPA Budget Support Survey, data available at www.spasurvey.info
Short-term predictability 47. As regards short-term predictability (i.e. correspondence of annual disbursements to annual commitments), domestic resources (i.e. tax and non-tax revenues) have been fairly predictable in comparison to total aid flows in recent years. The average shortfall or windfall (using absolute values) for domestic resources was 2.0% of the total budgeted figure over the period 2000/01 – 2008/09 (see Figure 8) while the equivalent figure for total aid was 15.6% of the total budgeted figure over the same period (see Figure 9).12 48. Budget support – both general and sectoral – has been highly unpredictable, as is illustrated in Figure 10, with both windfalls and shortfalls (these figures include both budget support loans and grants). Aid financed projects are also subject to substantial short-term predictability in the aggregate, although this has tended to be in the form of shortfalls (see Figure 11). The common causes cited by GoU for the under-performance of externally financed projects are low absorption and delay by government to fulfil pre-conditions that trigger disbursements. The average shortfall or windfall (using absolute values) for budget support was 30.3% of the total budgeted figure over the period 2000/01 – 2008/09 (see Figure 10) while the equivalent figure for project aid was 15.8% of the total budgeted figure over the same period (see Figure 11). Both figures are considerably higher than for domestic resources (2.0%).
12
Note that it is important to base average unpredictability on absolute values to avoid an effect whereby shortfalls cancel out windfalls in the aggregate, masking unpredictability.

How Unpredictable Aid Influences Service Delivery
22
Figure 8: Short-Term Predictability of Domestic Resources (% over/under disbursement of budgeted funds), 2000/01 – 2008/09
Note: *Provisional outturn. Source: Annual Budget Performance Reports.
Figure 9: Short-Term Predictability of Total On-Budget Aid
(% over/under disbursement of budgeted funds), 2000/01 – 2008/09
Note: *Provisional outturn. Source: Annual Budget Performance Reports.
49. The unpredictability of budget support is particularly pronounced for budget support loans, as opposed to budget support grants. Budget support loans have an average shortfall or windfall
-2.3%
-5.6%
0.1%
-2.0%
0.6%
1.5%
-0.2%
1.6%
-3.9%
-6.0%
-5.0%
-4.0%
-3.0%
-2.0%
-1.0%
0.0%
1.0%
2.0%
2000/01 2001/02 2002/03 2003/04 2004/05 2005/06 2006/07 2007/08 2008/09*
-3.0%
-2.5%
-2.0%
-1.5%
-1.0%
-0.5%
0.0%
0.5%
1.0%
1.5%
% Over/under disbursement (as a proportion of budgeted amount) [LHS]
Relative size of shortfall/windfall (% of total budgdted resources) [RHS]
-6.4%
-26.1%
12.0%
-5.1%
-26.6%
0.6%
-38.5%
24.3%
1.0%
-50.0%
-40.0%
-30.0%
-20.0%
-10.0%
0.0%
10.0%
20.0%
30.0%
2000/01 2001/02 2002/03 2003/04 2004/05 2005/06 2006/07 2007/08 2008/09*
-20.0%
-15.0%
-10.0%
-5.0%
0.0%
5.0%
10.0%
% Over/under disbursement (as a proportion of budgeted amount) [LHS]
Relative size of shortfall/windfall (% of total budgdted resources) [RHS]

Uganda Country Case Study
23
(using absolute values) of 70.7% over 2001/02 – 2008/09, compared to 27.7% for budget support grants. The higher cost of loans has not provided improved predictability. Grants have formed the majority of all budget support: budget support loans averaged 34.8% of all budget support commitments captured in the budget over the period. The budget support loans largely comprise the World Bank Poverty Reduction Support Credit (PRSC).13
Figure 10: Short-Term Predictability of Direct Budget Support
(% over/under disbursement of budgeted funds), 2000/01 – 2008/09
Note: *Provisional outturn. Source: Annual Budget Performance Reports.
Figure 11: Short-Term Predictability of Project Aid
(% over/under disbursement of budgeted funds), 2000/01 – 2008/09
13
Note that PRSC support often switched from loan to grant, depending on IDA allocations and performance. However, the budget support data presented here captures both loans and grants, so this switching has no impact on the findings regarding the unpredictability of PRSC budget support.
-19.8%
-36.7%
2.4%
25.4%21.4%
-33.4%
40.4%
-32.6%
60.6%
-60.0%
-40.0%
-20.0%
0.0%
20.0%
40.0%
60.0%
80.0%
2000/01 2001/02 2002/03 2003/04 2004/05 2005/06 2006/07 2007/08 2008/09*
-15.0%
-10.0%
-5.0%
0.0%
5.0%
10.0%
% Over/under disbursement (as a proportion of budgeted amount) [LHS]
Relative size of shortfall/windfall (% of total budgdted resources) [RHS]

How Unpredictable Aid Influences Service Delivery
24
Note: *Provisional outturn Source: Annual Budget Performance Reports.
50. This finding was echoed in a recent PEFA assessment, which concluded that there had been a real deterioration in the predictability of amount and timing of budget support between the previous assessment (June 2006) and the more recent one (November 2008). Budget support predictability declined from the third lowest possible PEFA score (C+) to the lowest possible score (D). The assessment also noted that there is no projected breakdown of budget support by quarter (Government of Uganda, 2009). 51. The unpredictability of total aid, budget support and aid financed projects, is quite large as a proportion of total budgeted expenditure, as is illustrated in Table 8 below. There have been on-budget aid shortfalls equivalent to over 10% of total budgeted resources in three years over the period 2000/01 – 2008/09 (in 2001/02, 2005/06 and 2007/08).
Table 8: Relative size of shortfalls and windfalls (% of total budgeted resources)*
2000/0
1 2001/0
2 2002/0
3 2003/0
4 2004/0
5 2005/0
6 2006/0
7 2007/0
8 2008/09
*
Domestic resources -1.1% -2.4% 0.0% -1.1% 0.3% 0.8% -0.1% 1.0% -2.6%
Total On-Budget Aid -3.4% -15.1% 0.5% 5.6% -2.4% -11.9% 0.3% -14.0% 8.1%
Of which:
Budget support -5.6% -13.6% 0.7% 5.5% 4.2% -6.7% 7.6% -4.4% 6.8%
Aid financed projects
2.2% -1.5% -0.2% 0.1% -6.5% -5.1% -7.4% -9.6% 1.3%
Note: The data summarised in this table is the same as the data plotted on the Right Hand Side [RHS] axes of Figure 9, Figure 10 and Figure 11 Source: Annual Budget Performance Reports.
In-year predictability 52. Data on in-year predictability of GBS is available through the Strategic Partnership with Africa‘s budget support survey. Data from three consecutive years of survey data is summarised in Figure 12 below. The data represents a slightly distorted picture of the true record of in-year GBS predictability, because only donors that actually produced in-year disbursement schedules are captured – GBS donors that did not use quarterly disbursement schedules are omitted. Nonetheless it still suggests quite a high degree of in-year unpredictability of GBS in 2004/05 and
8.7%
-7.1%
0.2%
-24.6%-21.0%
-32.0%
-42.0%
5.9%
-0.8%
-50.0%
-40.0%
-30.0%
-20.0%
-10.0%
0.0%
10.0%
20.0%
2000/01 2001/02 2002/03 2003/04 2004/05 2005/06 2006/07 2007/08 2008/09*
-12.0%
-10.0%
-8.0%
-6.0%
-4.0%
-2.0%
0.0%
2.0%
4.0%
% Over/under disbursement (as a proportion of budgeted amount) [LHS]
Relative size of shortfall/windfall (% of total budgdted resources) [RHS]

Uganda Country Case Study
25
2005/06, with large disbursements delayed until the fourth quarter, followed by a strong improvement in in-year predictability in 2006/07.
Figure 12: In-year predictability of General Budget Support
Source: 2005, 2006 & 2007 SPA Budget Support Surveys, data available at www.spasurvey.info
3.3 Influence of and government response to unpredictable aid
53. GoU has been relatively successful at mitigating the effects of budget support unpredictability on the predictability of releases from MFPED to line ministries and districts, in particular in protecting PAF releases and upholding the 95% release target. Two strategies in particular have proved particularly successful at mitigating the impact of short-term unpredictability on budget execution. First, under the IMF programme, shortfalls in budget support inflows are automatically offset by domestic borrowing. The BoU then has a mixed sterilisation programme, which determines how much of this government borrowing is offset by lower international reserves and how much by increased issuance of government securities. The converse applies to windfalls of budget support, which are automatically saved under the IMF programme, thereby lowering the GoU‘s ‗Net Credit to Government‘ position with BoU and enabling a greater borrowing in future years if required. This is a strategy commonly adopted in countries operating IMF programmes, whereby the programme targets for government domestic borrowing are ―adjusted‖ for deviations in external budget resources and external debt service from what is budgeted. As a result the GoU budget is entirely insulated from the short-term unpredictability of budget support. The ability of the MFPED to insulate the GoU budget from budget support shortfalls requires that the BoU‘s international reserves are large enough to absorb a shortfall without falling to levels regarded as inadequate – budget support unpredictability is therefore a much greater problem in countries with low levels of international reserves (Brownbridge, 2009; Davies, 2009). 54. Second, in response to high short-term unpredictability of project aid and budget support disbursements, MFPED initiated the practice of discounting of donor budget support pledges in 2002/03 (Brownbridge and Tumusiime-Mutebile, 2007). Thus, the amounts of direct budget support pledged by donors were discounted before inclusion in the annual budget by a factor of 10%, increased further to 30% in 2003/04 and 2004/05 (Lister et al, 2006). Had discounting not been used the observed unpredictability of budget support would have been substantially higher: the figures presented above are based on the annual budget and therefore are already discounted. However, it is important to note that the IMF programme mechanism described above would still have fully insulated the GoU budget from this unpredictability. The introduction of a discount factor in effect simply helped to improve the realism of the monetary programme (i.e. the mix between the use of international reserves and government securities) because it enabled a more realistic

How Unpredictable Aid Influences Service Delivery
26
forecast of likely foreign exchange inflows from donor aid by forecasting predictable shortfalls (Davies, 2009). It should also be noted that there are routine cut backs to the execution of the development portion of the annual budget. All on-budget aid financed projects are captured in the development component of the budget, as well as a number of domestically financed capital intensive investment projects.14 As Table 9 illustrates, while execution of recurrent expenditures never fell below 100% over the period 2001/02 – 2007/08 despite fluctuations in both domestic revenues and aid, development expenditures routinely fell short of their budgeted levels. It is very difficult to disentangle the different drivers of this under execution. For externally financed projects and GoU counterpart contributions, interviewees attributed shortfalls to low absorptive capacity and GoU failure to meet disbursement triggers. Shortfalls in spending on domestically financed projects were attributed to demands for supplementary recurrent expenditures and occasional revenue shortfalls. Making cutbacks in domestically financed projects was not cited as a strategy to mitigate budget support shortfalls. 55. There are other concerns beyond short-term unpredictability and volatility of aid in Uganda. As Brownbridge and Tumusiime-Muteblie (2007; p. 208) note, ‗The key problem for fiscal vulnerability is not short-term volatility, but the danger that the large increase in aid flows to Uganda which occurred after 1998/9 will not prove sustainable: i.e. they will not represent a permanent budget resource.‘ Therefore, relying on aid flows to finance a large proportion of the budget builds in a high degree of fiscal vulnerability.
Table 9: Budget Execution (2001/02 – 2007/08), outturn as a % of original budget
2001/02 2002/03 2003/04 2004/05 2005/06 2006/07 2007/08
Total Revenue 92 98 108 111 94 106 93
Domestic resources 94 100 98 101 102 100 102
Total Aid 74 101 112 95 73 101 61
Direct budget support 63 102 125 121 67 140 67
Project Aid 93 99 100 75 79 68 58
Recurrent Expenditures 102 103 107 103 104 103 105
Development Expenditures 89 101 89 85 86 93 108
External 91 108 94 80 81 77 111
Domestic 87 94 82 95 96 120 100
Source: Annual Budget Performance Reports.
56. In fact, the data indicates that GoU‘s fiscal vulnerability – i.e. the risk that aid increases do not prove permanent – has declined in recent years. Examining the composition of the GoU budget (by economic classification) over time, it is clear that there has in fact been a change in its composition, with a decrease in reliance on aid to finance recurrent expenditure. As the first line of Table 10 illustrates, over the period 2001/02 – 2007/08 the recurrent budget went from being only 88% financed by domestic revenues to being entirely financed by domestic revenues (114%). As the second line of the table illustrates, when we include domestically financed development expenditures in the calculation GoU has not yet reached full independence – it still relies on budget support to finance a portion of domestic development spending, although this dependence has also reduced over the period. This change has been primarily driven by an increase in domestic revenues, which have averaged 17% annual growth over the period, while grant expenditures have averaged 2% annual growth rates and recurrent expenditures have averaged 12% annual growth.
14
Since many of the aid financed projects in the development portion of the budget are recurrent in nature (financing the purchase of school text books or project staff salaries for example), it should not be regarded purely as an ‗investment‘ budget. Nonetheless, these recurrent expenditures do not assume the same level of budgetary priority as those in the recurrent portion of the budget such as interest payments and civil servants‘ salaries.

Uganda Country Case Study
27
In turn, the stable ratio of domestic revenues to GDP (see last line of Table 10) indicates that revenue growth has been primarily driven by strong GDP growth.
Table 10: Composition of Annual Budget Outturns (2001/02 – 2007/08)
2001/02 2002/03 2003/04 2004/05 2005/06 2006/07 2007/08
Dom. Revenue as % Recurrent Expenditure 87.9 90.4 88.3 96.4 103.6 111.5 113.7 Dom. Revenue as % Rec. Exp. & Dom. financed development projects 62.1 63.2 63.2 70.1 75.8 83.9 77.6 Dom. Revenue as % Total Revenue (inc. grants) 62.3 63.6 56.9 60.4 71.9 71.5 83.3 Recurrent Expenditure as % Total Expenditure 55.6 57.3 60.3 60.6 61.5 58.0 56.4 Dom Revenue as % GDP 12.7 12.3 12.6 12.6 13.3 13.0 13.1
Source: Annual Budget Performance Reports.
57. One result of this change has been a complete removal of GoU dependence on budget support for the financing of the recurrent portion of the budget, and a partial reduction in its reliance on budget support to finance domestically financed development projects. GoU is no longer reliant on donor funding to meet its recurrent obligations. MFPED is effectively following a fiscal rule which links GoU expenditures (primarily recurrent in nature, with some domestically financed development spending) only with domestic revenues, thereby insulating GoU recurrent expenditures from long-term reductions in aid flows and ensuring a high degree of fiscal sustainability (with the caveat that if there were a sustained reduction in budget support, GoU may choose to finance some domestic development projects over recurrent spending). 58. While the development budget comprises many activities that are fundamentally recurrent in nature, they can reasonably be said to be more ‗discretionary‘ than the non-discretionary elements within the recurrent budget such as debt service payments and civil servants‘ salaries. Indeed, interviewees suggested that MFPED has been consciously trying to ensure that expenditure which is genuinely recurrent in nature should be under the recurrent portion of the budget in recent years. The distinction between the recurrent and the development budget remains important for fiscal planning, but it is weakened by the existence of contingent liabilities.
Box 5: Grant Aid as a Contingent Liability
Contingent liabilities (of the government) are obligations triggered by a discrete but uncertain event. They are therefore possible obligations whose existence will be confirmed only by the occurrence of one or more uncertain future events not wholly within the government's control (this should be contrasted with direct liabilities, which are predictable obligations that will arise in any event). There is a second useful distinction to be made between explicit liabilities defined by law or contract that the government is legally obliged to settle when due and implicit liabilities which the government may be obliged to meet owing to public expectations and political pressures (Polackova, 1998). Aid financed projects can be a form of (implicit) contingent liability, especially where they finance activities that are recurrent in nature and create political constituencies with expectations of indefinite resource flows (for example aid financed projects for social protection may do this). Where domestic revenues are insufficient to finance the recurrent portion of the annual budget, budget support is by implication relied upon. Where domestic revenues are sufficient to cover the recurrent portion of the budget however, budget support is effectively financing the development budget (Penrose, 2008). Uganda has made the transition from the former to the latter situation over the study period.

How Unpredictable Aid Influences Service Delivery
28
59. While grants and loans tied to specific projects are explicitly linked to activities in the development portion of the budget, direct budget support (both grants and loans) can in theory be used to finance both the recurrent portion of the budget and the ‗domestic‘ component of development projects. The greater the GoU‘s dependence on budget support to finance the recurrent portion of the budget, the greater the contingent liability GoU faces due to the risk that it may be scaled back for some unforeseen reason (see Box 5). Thus, as a result of strong GDP growth and a macroeconomic policy stance that has sought to reduce the fiscal deficit before grants, domestic revenues have grown faster than the recurrent portion of the budget. This has had the effect of reducing the vulnerability of the recurrent portion of the budget to aid unpredictability. 60. Overall, at the aggregate level, GoU has faced a high degree of short-term unpredictability in both budget support and project aid inflows. In response, MFPED has developed a sensible strategy of managing both short-term and longer-term aid unpredictability, particularly that arising from budget support, despite the fact that donors have failed to make it into a stable and predictable form of budgetary finance. This strategy has involved adherence to an IMF programme that totally insulates the GoU budget from the short-term unpredictability of budget support and discounting of donor commitments in the budget that has the result of improving the realism of the monetary programme. 61. In addition, strong GDP growth coupled with a strong macroeconomic policy stance has enabled domestic revenues to grow faster than recurrent expenditures and ultimately meant that the recurrent portion of the budget is entirely financed by domestic revenues. MFPED is effectively following a fiscal rule that matches domestic spending to domestic revenues. As well as reducing the impact of short-term unpredictability, this has helped to reduce the longer-term fiscal vulnerability of the budget, since aid is a far less permanent source of budget finance than domestic revenue. 62. Interviewees noted that the practices of saving budget support windfalls, discounting of aid forecasts and a macroeconomic policy stance that has sought to reduce the fiscal deficit before grants pursued by MoFEP have at times been highly controversial with certain donors, who object to perceived reductions in pro-poor spending as a result. In the case of discounting, some donors failed to understand that the policy had no material impact on total spending, instead simply serving to improve the realism of the monetary programme. In the case of saving of budget support windfalls some donors were hostile to the idea of smoothing of spending over time embodied in the IMF programme. Finally, there has been a passionate debate regarding the trade-offs involved in pursuing a policy of fiscal deficit reduction before grants. While this is in part a subjective question, donors in favour of a more expansionary macroeconomic policy severely undermined their case by providing such highly unpredictable aid flows, suggesting that MoFEP‘s approach was very prudent. 63. However, managing the unpredictability of project aid has proved more difficult. The high degree of unpredictability of project aid continues to affect the in-year execution of externally financed projects in the development portion of the budget. Since the unpredictability of budget support is in part mitigated by in-year reductions in domestically financed projects, the overall result is that unpredictable aid is much more damaging to the development portion of the budget, thereby disproportionately undermining public investment. This results in particular in the dragging out of investment projects over longer periods in practice than necessary, thereby reducing overall project returns. Finally, as noted in Section 3.1 above, GoU does not yet have systematic budget execution data for donor projects at the Vote Function level, thereby making simple measurement of short-term unpredictability of externally financed projects below the aggregate level very difficult.

Uganda Country Case Study
29
4. Aid predictability and its influence at the sector level
4.1 Planning and budgeting in the health sector
Structure of Health service delivery system 64. The Ugandan public health system is based on an integrated primary health care approach and built around a three-tier structure: National, Regional and District. The system is run under the stewardship of the MoH with the support of national level institutions, including in particular the National Medical Stores and National Drug Authority.15 The three tiers of the system are in turn sub-divided into seven Health Centres, numbered from I (village level) to VII (national level), with service delivery units classified by Health Centre (as summarised in Table 11 below).
Table 11: Structure of Public Sector Health Care Delivery Facilities
Level Health Centre
Population (approx.)
Services Provided
District
Health Sub-
District
I Village - 1,000 Community-based preventive and promotive health services. Village Health Committee or similar status.
II Parish - 5,000 Preventive, promotive and out-patient curative health services, and outreach care.
III Sub-county - 20,000
Preventive, promotive, out-patient curative, maternity and in-patient health services and laboratory services.
IV County - 100,000 Preventive, promotive, out-patient curative, maternity, in-patient health services, emergency surgery, blood transfusion and laboratory services.
V General Hospital - 500,000
In addition to services offered at health centre level IV, other general services are provided including in-service training, consultation and research for community-based health care programmes.
Regional VI Regional Referral Hospital (RRH) - 2,000,000
In addition to services offered at the general hospital, specialist services are offered, such as psychiatry, Ear, Nose and Throat (ENT), ophthalmology, dentistry, intensive care, radiology, pathology, higher level surgical and medical services.
National VII National Referral Hospital (NRH) - 24,700,000
These provide comprehensive specialist services and are also involved in teaching and research
Source: Yates et al. (2006; p. 27).
65. Uganda‘s health system is managed both at the central MoH level, and at the District level. MoH headquarters (i.e. central level) plays the role of system coordinator, with responsibility for policy development, standards and guidelines, monitoring and evaluation, supervision of Regional and National Referral Facilities and resource mobilisation. In turn, the Districts are responsible for direct service provision; ownership of public health facilities below regional level was transferred to districts as part of public sector decentralisation introduced by the Local Government Act of 1997 (see Section 4.2 below for more detail on sub-national planning and budgteing). 66. Provision of health services is distributed between public and private health care providers. According to the 2006 health inventory, there are 3,237 health facilities in the country including private-not-for-profit (PNFP) entities such as NGOs and private-for-profit (PFP) facilities. The national and regional referral facilities provide a comprehensive health care package, and receive funds under the central MoH budget, while the district hospitals and health centres provide the basic health care package, and receive government funds under the Primary Health Care (PHC)
15
Other national level support institutions include the Uganda Virus Research Centre, the Uganda Cancer Institute, the National Blood Transfusion Service, the National Public Health Laboratories and the Uganda Natural Chemotherapeutic Research Laboratory.

How Unpredictable Aid Influences Service Delivery
30
PAF funds directly from MFPED through the District systems. PNFP health facilities account for 41% of the hospitals and 20% of the lower level facilities and are more prevalent in rural areas. PNFPs also manage 42% of the health training institutions with financial support and subsidisation from the government. 75% of the PNFPs exist under four umbrella organisations, namely; the Uganda Catholic Medical Bureau (UCMB), the Uganda Protestant Medical Bureau (UPMB), the Uganda Orthodox Medical Bureau (UOMB) and the Uganda Muslim Medical Bureau (UMMB). In addition, PNFPs receive donations and also charge user fees. Planning and budgeting 67. In addition to the PEAP, the guiding policy documents for the sector are the National Health Policy (NHP), the Health Sector Strategic Plan (HSSP), and National Programmes Strategic Plans. It is within the boundaries of these documents that Annual Work Plans are prepared and implemented. Medium-term sector planning instruments cover synchronised timeframes, ending in 2008/09, and are currently being reviewed and updated. These include the new NHP (2009/10 – 13/14) and the HSSP III (2009/10 – 13/14). The HSSP aims to set the strategic vision for the sector, including prioritised, effective and evidence-based interventions, key performance indicators and cost estimates for implementation to achieve set objectives. While health sector priorities and policies are specified in the HSSP, these are reviewed and prioritized on an annual basis by health sector stakeholders during the National Health Assembly and Joint Review Mission. 68. As well as engaging in the national planning and budget process outlined in Section 3.1 above, there are a number of planning activities specific to the health sector. The annual planning process at health sector level is led by the MoH Planning Department, through Technical Working Group (TWG) discussions. In total there are 11 TWGs that meet frequently to monitor sub-sector activities and offer guidance and additional support as the need arises. The TWGs comprise both GoU and donor officials. 69. The Joint Review Meeting held annually is attended by all players in the health sector including district health officers, health facility medical personnel, donors, CSOs, and government officials. During these meetings the performance of the sector is reviewed, drawing on monitoring data to inform participant of the trends and to inform future plans. The Joint Review also involves formal presentation of the annual MoH District League Table, which ranks district performance measured by a weighted average of multiple output indicators. 70. There are however numerous projects and funds that are not covered within this process, namely off-plan and off-budget projects and development assistance, that are implemented directly at the health facility level or through sub-contracted local and international NGOs. Capturing off- budget development assistance within the sector system remains a challenge. While the MoH is able to collect data on commitments and disbursements from the SWAp partners, there are partners that are not reporting through the existing structures. Donor coordination mechanisms: 71. The key document in the health Sector-Wide Approach (SWAp) is a Memorandum of Understanding between the 25 health sector development partner members and the Ministry of Health (Government of Uganda, 2005). there are a series of structures that were put in place to improve development partner coordination, as highlighted in Box 6. 72. The health SWAp was initially seen as quite successful, providing impetus for key policies and strategies under HSSP I and a shift in aid modality among development partners towards SBS, which in turn allowed GoU to increase allocations to priority programmes (World Bank, 2009). 73. However, in recent years the SWAp has been undermined by a number of new initiatives in the health sector. Four major new funding initiatives have in particular become increasingly important: the GAVI Alliance, GFATM, PEPFAR and the President‘s Malaria Initiative (PMI). These

Uganda Country Case Study
31
initiatives – typically implemented through project support – are structured in a way that clashes with the comprehensive approach to policy and planning embodied in the SWAp and associated HSSP framework. They have consequently been described as ‗destabilising‘ to the SWAp (Cruz et al, 2006). As Örtendahl (2007; p. 3) observes, ‗Duplication of ministerial efforts and an increased administrative burden for districts with weak district managerial capacity is an unavoidable consequence of this myriad of new parallel initiatives.‘ Partly as a result of this fragmentation, the rate of reform of the national health system in the sector has slowed as the SWAp – the natural vehicle for system wide reform – has been marginalised in favour of large yet heavily earmarked funding flows.
Box 6: Description of Health SWAp Structures The Health Policy Advisory Committee (HPAC) is the main coordination and advisory organ for the sector partnership. The Joint Review Mission (JRM) is a biannual forum to monitor progress against implementation, agree on priorities and budget allocations for the next fiscal year and reset targets and undertakings for the sector. The April JRM has since been replaced by the Technical Review Meeting (TRM) with similar functions and mainly local representation. The National Health Assembly (NHA) is an annual forum of the wider partnership for the development of broad consensus on policy, strategies and priorities, for high level advocacy, and for general endorsement of the strategic plan for the coming financial year. The NHA effectively replaced the National Health Review Committee. The Health Sector Working Group (HSWG) is a technical group of stakeholders with clear terms of reference. The functions of this group include: overseeing the planning and budgeting process and preparing of the sector BFP; review and approval of all new projects before submission to the Development Committee; and generally was working as the technical arm of the HPAC. The 11 Technical Working Groups (TWG) include: Health Systems; Integrated Service Delivery (formerly Basic Package); Human Resources for Health; Finance and Procurement; Health Infrastructure; Drugs Procurement and Management (or Essential Medicines and other supplies); Public/Private Partnership for Health; Supervision and Monitoring; and, Health Research and Development.
Source: HealthNet Consult (2007; p.23). Monitoring and Evaluation 74. MoH undertakes M&E primarily through the Health Management Information System (HMIS). The HMIS has been through a number of revisions; the current format was introduced in October 2005. District officials are requested to submit monthly reports to the MoH charting progress against a number of indicators. Each health facility reports on out-patient and in-patient activity according to standardised questionnaires. 75. The data compiled within the different iterations of the HMIS has not been reconciled to provide a single consistent time series. Analysis of trends prior to 2005 is therefore only possible with reference to parallel M&E systems maintained by vertical programmes within MoH. Officials have therefore tended to rely primarily on the programmes for accurate data, thereby undermining the reliance on and use of the HMIS. In addition, the latest versions of questionnaires for the HMIS included new variables and eliminated variables that were deemed irrelevant, to try and keep the form short and simple. Comparison across time – even after 2005 – therefore requires care. Further, reporting quality is patchy across districts and health facilities. Some facilities are able to submit soft copies while others submit manual copies to the central level HMIS desk at the Ministry of Health, where there are not enough staff to manually enter data resulting in inaccuracies and backlogs.

How Unpredictable Aid Influences Service Delivery
32
76. As with the planning and budgeting process, the extent to which the M&E process provides a whole of sector overview is hampered by aid financed projects delivered outside the GoU health system through private-for-profit (PFP) and private-not-for-profit private (PNFP) health care providers. The HMIS therefore only provides a partial picture of health sector service delivery trends over time.
4.2 Planning and budgeting at sub-national level
77. Uganda‘s decentralization policy devolves the responsibility for planning, resource management and service delivery in key sectors (education, roads, gender, health, rural water and agriculture) to districts, with further administrative units at the county, sub-county, parish and village levels. As illustrated earlier, the PEAP and the sector plans provide the framework for the preparation of district plans. However local authorities determine the implementation plan for sector programmes based on local priorities. Attempts have also been made to involve communities in the planning framework to enhance community-level participatory planning and monitoring. 78. Although the PEAP sets the framework for other plans, the relationship between the PEAP and sector plans, between sector and district plans, and district and lower local council plans is iterative (MFPED, 2000). There are inevitably tensions between the different tiers of government. Interviewees suggested that disagreements sometimes occur in regard to the way sector programmes are planned to be implemented vis-à-vis the priorities of local government authorities – for example with regard to the location of health service delivery units. It was also apparent that districts can only ―advise‖ lower tiers of government in regard to planning. 79. While local governments are legally autonomous, they remain heavily dependent on central government funding, which in reality substantially limits their autonomy. Local governments depend on the central government for around 95% of their budgetary resources, which are transferred through three types of grants: conditional, unconditional and equalization grants. Conditional grants – comprising 90% of all grants – are earmarked for recurrent and development expenditure on particular programmes, with detailed controls over the types of expenditures allowed and require central authority approval for any reallocations in excess of 10% of resources. Unconditional grants (which include Poverty Action Funds from HIPC debt relief are) comprise around 9% of all grants and equalization grants make up the remaining 1%. The latter are intended to equalize the level of service delivery across all local governments, are based on level of development and reflect the degree to which a local government lags behind the national average standard for a particular service (Government of Uganda, 2009). The unpredictability of conditional grants is a major issue (see Box 7). This is compounded by the fact that, in the health sector, Districts themselves have not adopted a coherent, logical and transparent formula for onward allocation of funds to lower health centres (Office of the Auditor General, 2006). This is a serious impediment to service delivery and it consequently complicates any assessment of the influence of aid unpredictability on service delivery.
Box 7: Conditional Grants as Unpredictable Resource Flows for Service Delivery
Except for the unconditional grant, the local governments cannot calculate the grants they will receive because of several intervening variables: the vertical allocation by each sectoral ministry is not predictable; there is political interference in the allocations; uneven adjustment for donor interventions in particular local governments; intersectoral shifts due to policy changes during the year; shortfalls in resources causing cutbacks (except on Poverty Action Funds); and changes in the underlying factors determining the grants (such as poverty indices, illiteracy data) and the weights assigned to them. The Budget Circular for 2008/09 refers to concerns that actual allocations to local governments are not in line with the formulae for each conditional grant. In addition, local governments are not provided information on grants from central MDAs for essential medicines, instructional materials, and district roads.
Source: Government of Uganda (2009; p. 20).

Uganda Country Case Study
33
80. Central government is also responsible for appointing the accounting officer in districts and municipalities. The Ministry of Local Government (MLG) supervises their performance and functions as a coordinator of policy and central support while the Local Government Finance Commission (LGFC) monitors their budgets to ensure their alignment with PEAP priorities. 81. Apart from central government resources, some districts receive aid directly from donors and NGOs, both in cash and in-kind. Information on the size and extent of these aid flows is very scarce. Interviews indicated that such flows are particularly unpredictable and characterised by insufficient provision of information within the district planning and budgeting cycle. Because these flows are not included in the MTEF, they create potential problems for service delivery and sustainability in case of shortfalls.
4.3 Predictability of health sector resource flows
Overview of the sources of public health funds 82. The health system is funded through three major sources, namely: public funds, private funds and donor aid.16 Since private contributions largely contribute to private service provision, we focus here on the public and donor sources available. External aid forms a substantial share of the public health resources for Uganda (see Table 12 below), and therefore the degree of predictability of this development assistance greatly influences the planning, budgeting and implementation procedures and in turn affects implementation of public health services at the health care facilities. 83. There are two major sources of public health funds: ‗domestic‘ financing (comprising GoU domestic revenues and budget support) and ‗external‘ financing (comprising donor support to projects, PNFP facilities and global health initiatives).17 A sizeable proportion of external financing for health is off-budget: from a total health spend of approximately UGX930 billion, around UGX400 billion is off-budget and 140 billion is on-budget financing for donor projects (World Bank, 2009). While MFPED has sought to promote the inclusion of aid on-budget, the incentives at sector level are not always well aligned with this objective, particularly as a result of MFPED‘s (entirely valid) insistence on including aid within total sector resource ceilings (see Box 8). 84. The principal aid modalities used by donors in the health sector have been basket funding, sector budget support (SBS), project support through both GoU and PNFP service providers (by far largest of which remains PEPFAR) and the latest global initiatives of GAVI, and GFATM. 85. Figure 13 below provides a stylised illustration of the flow of public funds across the health system. It is necessarily a simplified representation of the major funding channels. GFATM and GAVI funding is deliberately omitted as their respective delivery mechanisms have changed over the study period. Nonetheless, it provides an indication of the sheer complexity of funding channels for service provision in the health sector. This is exacerbated by a relatively high degree of earmarking of funding to specific activities and programmes, limiting the extent to which resources can be wired from channel to channel in response to shortfalls or windfalls. Clearly, even with high short- and medium-term predictability of resource flows, planning, budgeting and delivering services in the sector would be challenging. As this Section illustrates however, resource flows are in reality unpredictable, and the degree of unpredictability varies across the different channels both in proportionate and absolute terms.
16
NHA is an internationally recognized methodology for tracking all financial resource flows in the health care system of a given entity. Actual expenditures, rather than budget data, are used to fill a series of tables that document resource flows from sources, through programs, to the final providers and uses of health finances. In plain terms, NHA is a set of tables presenting a nation‘s health expenditures. 17
PER 2003/04 -05/06, Healthnet Consultants, Uganda.

How Unpredictable Aid Influences Service Delivery
34
Box 8: Sector Budget Ceilings and Perverse Incentives for Aid Reporting Since 2003, MFPED has insisted that project aid be integrated into sector budget ceilings. This has created perverse incentives (i.e. a reduction in the incentives in the health sector for comprehensive on-budget capture of aid flows) that have arguably undermined the realism of aid data in both the MTEF and the annual budget. This integration not only means that the level of project aid is presented in the MTEF and budget, but also any increases in project aid would result in a reduction in domestic budget allocations for a sector to remain within the ceiling. The rationale, which is sound, is to improve allocative efficiency, by encouraging budgetary decisions on the basis of overall resources to the sector, and an examination of how sectors should be financed (i.e. the balance between domestic resources and projects). However, in order to avoid the risk of reduced GoU domestic budget funding, sectors have faced perverse incentives: both not to disclose all donor funded projects for which they are receiving funds, and to under-estimate the level of this donor project funding (prior to 2003 sectors had tended to overstate project aid in order to leverage additional counterpart funding). This is exacerbated by the fact that the budget processes, and the Development Management System (DMS), rely on aid data generated by sector ministries themselves, and not from donors directly (unlike the data compiled by the Macroeconomics Department, which relies on data supplied directly by the donor Economists Group).
Source: Williamson (2008).

Uganda Country Case Study
35
Figure 13: Stylised Overview of Flow of Funds in the Health Sector
Source: Authors.

How Unpredictable Aid Influences Service Delivery
36
Table 12: Trends in On-Budget Public Expenditure Outturns on Health
Fiscal Year (FY)
GoU Funding (Bn UGX)
Donor Funding (Projects
and Global Initiatives) (Bn UGX)
Total Public Health
Expenditure (Bn UGX)
Proportion of Donor Health
Funding On Budget/ MTEF
(%)
Proportion of Total GoU
Expenditure on Health
(%)
Per Capita Expenditure
(UGX)
Per Capita Expenditure
(USD)
00/01 124.23 114.77 239.00 48.0% 7.5% 10,349 5.9
HS
SP
I
01/02 169.79 144.07 313.86 45.9% 8.9% 13,128 7.5
02/03 195.96 141.96 337.92 42.0% 9.4% 13,654 7.3
03/04 207.8 175.27 383.07 45.8% 9.6% 14,969 7.7
04/05 219.56 146.74 366.30 40.1% 9.7% 13,813 8.0
05/06 229.86 268.38 498.24 53.9% 8.9% 18,218 9.98 HS
SP
II
06/07 242.63 139.23 381.86 36.5% 9.6% 13,518 7.84
07/08 277.36 141.12 418.48 33.7% 9.6% 13,949 8.2
08/09 375.46 253.00 628.46 40.3% 8.3% 20,948 12.7
Source: AHSPR 2007/08, PER 2005/06.
86. Table 12 above summarises trends in public and on-budget external finance flows to the sector, looking at the two HSSP periods, and comparing development assistance expenditures as a proportion of government expenditures. It shows that since 2000/01 there have been annual (nominal) increases in the total public health budget, though these increases were at a decreasing rate. The slow upward trend continued until 2005/06, when there was a substantial nominal increase of 36% in total public health expenditure of which 82% was attributed to increased donor funding. There was then a substantial fall in FY 2006/07 and FY 07/08 bringing the total public health figures to an amount comparatively similar to the pre global initiative year. 87. From 2004/05 to 2005/06, there was due to the huge increase in donor funding through projects, and specifically on increased funding through Global Health Initiatives, particularly GFATM and PEPFAR (HealthNet Consult, 2007). In turn, the decrease in 2006/07 was due to a reduction in funding from global initiatives following their suspension after misappropriation and mismanagement of funds was demonstrated (see Box 13 and Box 15). It is also noteworthy that between 2005/06 and 2006/07, the proportion of government expenditure on health over the total GoU budget, increased from 8.9% to 9.6%. Predictability of government resource flows (including budget support) 88. Annual data shows the short-term predictability of government financing to the health sector to be (seemingly) relatively predictable, with budget execution rates ranging from 90% – 100% reported in releases of funds from the treasury to the sectors and districts respectively. As Table 13 illustrates, annual shortfalls are mainly focused in the execution of the development budget, reflecting the pattern highlighted above in the aggregate budget execution data.
Table 13: Trends in Health Sector Budget Execution FY 2004/05 – 2007/08
Budget Classification 2004/05 2005/06 2006/07 2007/08
Wage 85% 92% 98% 90.6%
Non wage 101% 100% 97% 102.7%
Development 88% 97% 92% 71.3%
Total 92% 96% 98% 93%
Source: AHSPR 2006/07, 2007/08.
89. A particularly important part of the health budget for service delivery is public medicines funding, which is provided through three major channels (as summarised in MoH, 2008):

Uganda Country Case Study
37
The Regular Budget, comprising allocations provided to unit managers in the recurrent non wage budget, i.e. PHC conditional grants (of which 50% must be spent on medicines) and non wage budgets at National and Regional Referral Hospitals;
Credit-line Budget backed by centrally held funds at the MoH in the Essential Medicines Account, with no scope for reallocation of these earmarked resources to other activities, and;
Donor Project and Global Health Initiatives used for purchase of particular items like ARVs, ITNs, vaccines, condoms and contraceptives by various donors.
90. On average over the period 2003/04 – 2007/08, 54% of the regular budget was spent on Essential Medicines and Health Supplies (EMHS) at National Medical Stores (NMS) and Joint Medical Stores (JMS) – see Table 14 – while it is estimated from district financial reports that another 27% of the regular budget is spent in the private sector.18 The increase in the credit line budget in 2007/08 is discussed in Section 4.4 below.
Table 14: Essential Medicines & Health Supplies (EMHS) Budget Performance for the Regular & Credit-line Budget
Regular Budget = EMHS grants CREDIT LINE
Medicines Budget in Ug. Shs billions
Purchases (NMS/JMS) in
Ug. Shs billions
% Spent at JMS and/or
NMS
Budget (NMS) in Ug. Shs billions
Purchases (NMS) in Ug. Shs billions
% Spent at NMS
Dis
tric
ts
FY 07-08 11.0 6.0 54% 12.3 9.6 77%
FY 06-07 11.4 6.4 58% 7.2 7.5 104%
FY 05-06 9.9 5.9 60% 7.2 7.1 99%
FY 04-05 11.2 5.7 51% 7.2 6.4 89%
FY 03-04 9.5 4.6 48% 7.2 7.6 106%
Gen
era
l H
osp
itals
FY 07-08 4.2 2.4 57% 3.4 3.4 100%
FY 06-07 4.2 2.3 55% 3.6 4.1 115%
FY 05-06 4.1 2.0 48% 3.6 4.0 111%
FY 04-05 4.1 2.0 49% 3.6 2.9 79%
FY 03-04 4.1 1.9 47% 3.6 2.7 75%
Reg
ion
al R
efe
rral
Ho
sp
itals
FY 07-08 3.9 1.9 49% 1.7 1.8 105%
FY 06-07 2.9 1.1 38% 1.8 1.9 104%
FY 05-06 2.5 1.2 48% 1.8 1.7 93%
FY 04-05 2.9 1.3 45% 1.8 1.7 94%
FY 03-04 2.4 1.0 44% 1.8 1.7 95%
Source: MoH 2008 and 2008a.
91. MoH uses a ‗pull‘ system to supply drugs, where money is allocated to order the drugs, but retained centrally. The chain of supply for drugs begins with requests at health facility level via the District Health Officer to the NMS, which distributes drugs every quarter. When NMS cannot provide requested medicines, a certificate of non-availability is issued before the concerned district can obtain the drugs from JMS and, failing that, from the open market. The public distribution
18
The NMS is a semi-autonomous medical supply agency serving the public sector which can realise economies of scale by buying supplies in bulk. Similarly, faith-based organisations running the many PNFP health facilities can benefit from economies of scale through the JMS.

How Unpredictable Aid Influences Service Delivery
38
system for medicines operates with little spare capacity, so shortfalls in supply cannot be easily rectified in the short run. Stock-outs of essential medicines remain a common problem in many districts. In 2007/08, only 40% of surveyed health units did not report a stock-out over the 6 month survey period. 92. The annual budget execution data illustrated in Table 13 masks considerable in-year unpredictability however. In-year predictability concerns the predictability of quarterly disbursements. For domestic financing to the health sector (domestic revenues and budget support), MFPED releases funds to sectors and districts through the treasury on a quarterly basis (the first quarter runs from July – September). Cash releases are only made if financial reporting requirements have been met by the recipient sector or district. All spending entities are expected to submit reports on how the previous quarter‘s funds were spent, attaching quarterly work plans, budget requests, and accounts for expenditures. Despite relatively good short-term (i.e. annual) predictability, the in-year flow of funds is much more unpredictable. Both delays and shortfalls in disbursement are routine, although funds are almost always forthcoming eventually. As Figure 14 illustrates, GoU funding is particularly unpredictable at district level, for reasons discussed in Box 7 above, and also in part due to a structural issue regarding the timing of the appropriation of the annual budget (see Box 9).
Figure 14: In-Year Predictability in Health: Timing of Releases from Consolidated Fund Account to Districts for Primary Health Care (UGX „000s), 2005/06 – 2008/09
2008/09
2007/08
2006/07
2005/06
Note: Comprehensive in-year data on wage releases was unavailable Source: FMIS.

Uganda Country Case Study
39
Box 9: In-Year Predictability in the Health Sector: Findings from a Value for Money Audit in 14 Districts
MOFPED is required to release funds to districts on a quarterly basis without delay to match the districts‘ quarterly plans. It was generally noted that MOFPED delays release of funds at the beginning of every FY. The delay is because MOFPED operates on Vote on Account before the Appropriation Act is passed by Parliament in the first quarter. Therefore, the releases to districts in the 1
st and 2
nd Quarters of each FY by
MOFPED do not match expenditure projections in the Quarters. The poor budget performances in the 1st and 2nd Quarters are later compensated in the 3
rd and 4th quarters. For example during FY2003/04 only
59% and 82% of Quarter 1 and 2 funds were released compared to 103% and 111% of Quarter 3 and 4 nationally.
Source: Office of the Auditor General (2006).
93. Systematic information regarding the predictability of the flow of funds from districts to service delivery units is very limited. Anecdotal evidence suggests that releases of funds from the district or municipality grant collection account are routinely delayed – sometimes deliberately – thereby introducing a further degree of unpredictability to the flow of funds. It should also be noted that there are significant resource ‗leakages‘ as funds and drugs flow down the service delivery chain to service delivery units. Two recent World Bank studies attempt to estimate the proportion of resources that fail to reach their intended recipients. Estimates of the extent of ‗leakage‘ or ‗waste‘ range from 13% in 2005/06 (World Bank, 2009) to 42% in 2006/07 (World Bank, Forthcoming). Table 15 summarises the component parts of the former estimate.
Table 15: Very Approximate “waste” Estimates, 2005/06
Problem area: Source Ug Shs Bn
PHC Non-Wage Grant leakages PETS 3.0
NGO PHC Grant leakages PETS 3.0
Questionable Expenditures Auditor General's Reports
2.4
Ghost Workers Payroll Clean-up Exercises
1.0
Health Worker Absenteeism Chaudury et al 26.0
Drug Leakages NMS (Expiry) 1.3
Total waste 36.7
Percent of health expenditure wasted 13%
Source: World Bank (2009). Predictability of health sector aid flows 94. Aggregate data for the health sector from the OECD suggests a high degree of short-term aid unpredictability in Uganda, as Figure 15 indicates. This data provides the only comprehensive overview of aggregate aid commitments and disbursements to the Ugandan health sector. However, it should be strongly qualified by two observations: first, the OECD data set is a partial one missing many large donors, and; second, the data is for aid to the health sector as a whole and not solely those flows channelled to GoU. Nonetheless, it is suggestive of a high degree of short-term unpredictability, with an average shortfall or windfall (using absolute values) of 70.2% from 2002 – 2007. 95. The task of obtaining a more accurate picture of aid predictability in the health sector is complicated by the sheer amount of development assistance and the variation among the mechanisms used by donors to project, disburse, and report. In order to obtain more comprehensive data than was available through the BFP/MTEF figures (and in part due to the incentive problems created by ceilings discussed in Box 8) the MoH Planning Department began the practice of compiling parallel data on aid to the health sector, directly approaching the health development partners for expenditure data through annual surveys.

How Unpredictable Aid Influences Service Delivery
40
Figure 15: Short-term predictability of donor funds for health in Uganda, US$ millions
Source: OECD DAC Creditor Reporting System (CRS).
Figure 16: Comparison of Data on Health Sector Aid by Donor (UGX „000s), 2006/07
Source: Annual Health Sector Performance Report 2006/07.
96. The findings of these surveys point to the partial coverage of health sector external development assistance data in the BFP/MTEF. In 2005/06 for instance, the MTEF indicated a 35% increment in public health expenditure compared to the MoH survey data a 55% increase is reported. Further, even the budget data collected through the donor survey is a very poor guide to total sectoral expenditure, with very high short-term unpredictability in the sector (see Figure 16) that is not fully observable from GoU budget execution data produced by MFPED as a result of the high proportion of off-budget funding. As the MoH notes, ‗This recurring issue of unpredictability of development assistance continues to pose a challenge to comprehensive planning within the sector and ensuring harmonisation and alignment of development assistance. To further compound all this, a great deal of development assistance continues to remain off budget
0
20
40
60
80
100
120
140
160
180
200
2002 2003 2004 2005 2006 2007
Commitment Disbursement

Uganda Country Case Study
41
(especially from the US government) that is largely spent though the private sector and districts.‘ (AHSPR 2007/08, p. 100). 97. Experience in Northern Uganda provides an interesting regional case study of aid predictability in the health sector. As noted in Section 2.1 above, Northern Uganda has endured prolonged insecurity and has the highest regional poverty rate in Uganda at 61%. It also fares particularly poorly on health output and outcome indicators. The high levels of insecurity in the north have attracted large flows of donor funding, and in particular humanitarian assistance. Many of the problems highlighted for the health sector as a whole – high short-term unpredictability exacerbated by a large proportion of off-budget funding – are particularly pronounced in Northern Uganda, where health funds are a disproportionately large share of all off-budget spending. Box 10 highlights some of the specific problems encountered in the North which were illustrated by a recent Public Expenditure Review (Regional Forecasts, 2007). In particular, off-budget health projects were found to be a significant impediment to planning for health service delivery in the North.
Box 10: Northern Uganda Case Study
In a public expenditure review of Northern Uganda, Regional Forecasts (2007) found that off-budget donor funding to the North, in particular in the health sector, has been increasing, exacerbating the unpredictability of donor funding and undermining planning:
Off-budget donor projects have been rising steadily in recent years from US$15m in 2003/04 (Shs 30bn) to US$58m in 2006/07 (Shs 109bn). There has been a noticeable rise in off-budget health projects (mainly funded by USAID) and bilateral donor humanitarian support. The share of donor off-budget project expenditures to the wider North region is also increasing from roughly 10% of the total to 35% roughly two-thirds of donor off-budget projects are in the health and humanitarian sectors. There are also off-budget projects in unclassified sectors. These include peace-building initiatives and civil society projects.
Predictable funding is a key element in all successful planning and implementation and probably even more so in humanitarian situations. Short donor time frames lead to unpredictability and therefore poor planning.
Donor funding at Local Government level is unpredictable (especially compared to Central Government transfers), funding cycles are not synchronised and lack of information from donors undermines the ability of Local Government to plan and execute budgets.
However, unpredictability of donor funding is only one factor among many adversely influencing service delivery in Northern Uganda. Amongst other contributory factors, the authors highlight a:
Mismatch between wage and non-wage recurrent conditional transfers – the wider North, like other regions, has experienced a mismatch in the growth of wage and non-wage recurrent conditional transfers. For example, conditional transfers for primary health salaries have increased by 20% pa on average but transfers for primary health care non-wage have remained roughly flat. This is believed to undermine service delivery with the scale of service delivery increasing but little growth in operational funding.
While the authors do conclude that some donor expenditures may, of necessity, be off budget, this does not include development assistance to the health sector. As they explain:
If the programme is implemented through a Government institution and/ or is classified as a development (as opposed to an emergency) programme, we suggest it remains on-budget and within MTEF ceilings. In an ideal world the advantages of on-budget financing (coordination, alignment, forward-looking, sustainability and value for money) outweigh its disadvantages and the advantages of off-budget financing (not subject to budget ceilings and flexibility). Of course this view pre-supposes that on-budget resources are used efficiently and for the intended purposes. GoU generally has a good record on this count, as evidenced by the increasing donor budget support in recent years.
This leaves emergency programmes implemented through non-Government institutions as more acceptable for off-budget financing. While in an ideal situation all programmes would be on-budget, there are certain types of programmes that are one-off in nature and do not fit easily into one of Government’s 11 MTEF sectors.
Source: Regional Forecasts (2007).

How Unpredictable Aid Influences Service Delivery
42
Mix of health sector aid modalities 98. The composition of external financial flows to the health sector is diverse, with multiple aid modalities used. The health development partners supporting health through sector budget support (SBS) include Belgium, Denmark, Norway, France, Ireland, Italy and Sweden. These partners are all signatories of the SWAp and, while the details of the SBS aid instruments used vary, they have agreed on using existing financial management structures. These partners are key participants in the coordination groups including the HPAC, JRM and NHA as detailed in Box 6. 99. Basket Funding is used to refer to cases where various donors contribute resources towards the funding of a common pre-determined programme, over a given period of time, while retaining a high degree of traceability of funding. The health sector has a small basket referred to as the Partnership Fund used for expenses incurred to support the SWAp mechanism, for example funds from this basket are used to organise the Joint Review mission and joint missions agreed upon by the SWAp members. 100. Many donors participating in the SWAp have maintained projects alongside the provision of sector budget support whilst others agreed to phase them out. According to the MFPED Macro Department, donors contributing project support to the health sector in 2007/08 included Danida, UNICEF, China, Japan, Italy, GAVI, GFATM, WHO, WFP, Germany, Belgium, Netherlands, Sweden, UNFPA and AfDB. A number of donors also provide project support to HIV/AIDS, including the UK, Ireland, UNDP, Norway and Sweden. 101. Over the past few years, a number of Global Health Initiatives have started to provide large development assistance flows to Uganda‘s health sector, in particular the Global Fund, GAVI, the President‘s Malaria Initiative (PMI) and PEPFAR. As Figure 16 illustrates, the latter two initiatives (both under the US Government) are very large indeed, accounting for around 47% of external assistance to health in 2006/07. Since they have primarily focused on service delivery through PNFP health facilities (albeit with some support to GoU), and due to a simple lack of available data, they are not examined in great detail in this report. By contrast, GAVI (4% of MoH external assistance figures in 2006/07) and GFATM (25% in 2006/07) have been much more heavily focused on delivery through GoU. Further, these funds were repeatedly cited by interviewees within GoU as the most unpredictable resource flows available to the sector, both in terms of short- and medium-term predictability. They are discussed in more detail in the following Sections. 102. One feature common to all of the GHIs is the provision of very large resources tightly earmarked to the provision of specific medicines which have tended to be much more expensive than those being supplied by MoH before their introduction. GAVI has promoted the adoption of DPT-HepB+Hib Pentavalent vaccine which has tripled the cost of vaccine procurement compared to the vaccine previously referred to as DPT3 , while artemisinin-based combination therapy (ACT) is more than three times more costly than treatment with CQ/SP combination known as Homapak that was previously used. The added expense of pentavalent vaccines does protect children against more diseases than DPT3, and full cost/benefit comparisons should be made relative to the reduction in the overall burden of disease. However, the bottom line remains: as World Bank (2009) makes very clear, Uganda faces a major challenge in sustaining the financing for these new and highly expensive health interventions which it will ultimately be expected to pay for from domestic resources. PEPFAR and PMI 103. PEPFAR and PMI are wholly off-budget and off-MTEF, are unable to make firm commitments of future support beyond one-year and are not aligned with the GoU planning
processes. Uganda has a unique arrangement for PEPFAR, having established a board which includes GoU and civil society representatives to approve PEPFAR‘s Country Operational Plan. The MoH is a recipient of PEPFAR funding for capacity building (e.g. strengthening of the HMIS), but all funds channelled to GoU follow PEPFAR-specific accounting and reporting requirements. Information on expenditures by PEPFAR and PMI are not available to the public
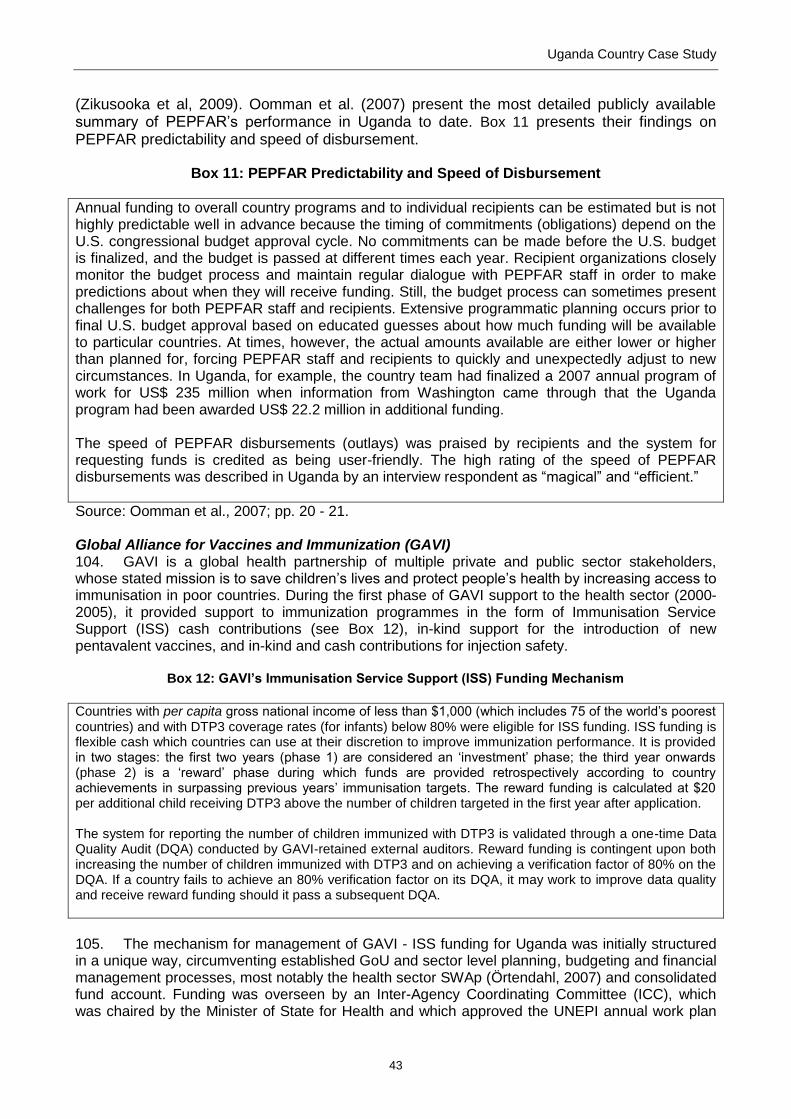
Uganda Country Case Study
43
(Zikusooka et al, 2009). Oomman et al. (2007) present the most detailed publicly available summary of PEPFAR‘s performance in Uganda to date. Box 11 presents their findings on PEPFAR predictability and speed of disbursement.
Box 11: PEPFAR Predictability and Speed of Disbursement
Annual funding to overall country programs and to individual recipients can be estimated but is not highly predictable well in advance because the timing of commitments (obligations) depend on the U.S. congressional budget approval cycle. No commitments can be made before the U.S. budget is finalized, and the budget is passed at different times each year. Recipient organizations closely monitor the budget process and maintain regular dialogue with PEPFAR staff in order to make predictions about when they will receive funding. Still, the budget process can sometimes present challenges for both PEPFAR staff and recipients. Extensive programmatic planning occurs prior to final U.S. budget approval based on educated guesses about how much funding will be available to particular countries. At times, however, the actual amounts available are either lower or higher than planned for, forcing PEPFAR staff and recipients to quickly and unexpectedly adjust to new circumstances. In Uganda, for example, the country team had finalized a 2007 annual program of work for US$ 235 million when information from Washington came through that the Uganda program had been awarded US$ 22.2 million in additional funding. The speed of PEPFAR disbursements (outlays) was praised by recipients and the system for requesting funds is credited as being user-friendly. The high rating of the speed of PEPFAR disbursements was described in Uganda by an interview respondent as ―magical‖ and ―efficient.‖
Source: Oomman et al., 2007; pp. 20 - 21. Global Alliance for Vaccines and Immunization (GAVI) 104. GAVI is a global health partnership of multiple private and public sector stakeholders, whose stated mission is to save children‘s lives and protect people‘s health by increasing access to immunisation in poor countries. During the first phase of GAVI support to the health sector (2000-2005), it provided support to immunization programmes in the form of Immunisation Service Support (ISS) cash contributions (see Box 12), in-kind support for the introduction of new pentavalent vaccines, and in-kind and cash contributions for injection safety.
Box 12: GAVI‟s Immunisation Service Support (ISS) Funding Mechanism
Countries with per capita gross national income of less than $1,000 (which includes 75 of the world‘s poorest countries) and with DTP3 coverage rates (for infants) below 80% were eligible for ISS funding. ISS funding is flexible cash which countries can use at their discretion to improve immunization performance. It is provided in two stages: the first two years (phase 1) are considered an ‗investment‘ phase; the third year onwards (phase 2) is a ‗reward‘ phase during which funds are provided retrospectively according to country achievements in surpassing previous years‘ immunisation targets. The reward funding is calculated at $20 per additional child receiving DTP3 above the number of children targeted in the first year after application. The system for reporting the number of children immunized with DTP3 is validated through a one-time Data Quality Audit (DQA) conducted by GAVI-retained external auditors. Reward funding is contingent upon both increasing the number of children immunized with DTP3 and on achieving a verification factor of 80% on the DQA. If a country fails to achieve an 80% verification factor on its DQA, it may work to improve data quality and receive reward funding should it pass a subsequent DQA.
105. The mechanism for management of GAVI - ISS funding for Uganda was initially structured in a unique way, circumventing established GoU and sector level planning, budgeting and financial management processes, most notably the health sector SWAp (Örtendahl, 2007) and consolidated fund account. Funding was overseen by an Inter-Agency Coordinating Committee (ICC), which was chaired by the Minister of State for Health and which approved the UNEPI annual work plan

How Unpredictable Aid Influences Service Delivery
44
and budget each year. UNEPI would request the Permanent Secretary of the MoH to authorise release of government and GAVI funds for specific activities as the need arose. The requests would then be reviewed by the MoH internal and GoU external auditors. A cheque would be prepared for release of funds according to government regulations, with GAVI funds paid into a separate account from the MOH/UNEPI account. The signatories to this separate account were the Permanent Secretary – MOH, Principal Accountant – MOH and the UNEPI Programme Manager. Approved funds for the districts were sent by bank drafts to the district health accounts through the district accounting officers (CAOs). Funds released at district level were subjected to similar auditing procedures prior to the releases. At the national and district levels, the government auditors would certify expenditure and accountability after completion of the activity, with the MOH – as opposed to MFPED – responsible for the overall accountability of funds (GoU, 2007).
Table 16: GAVI funds disbursed in Uganda (2000 – 2009)
Purpose Amount (US$) Disbursement Period
Immunisation Services Support (ISS) 6,581,000 June 2001 - August 2006 Pentavalent (DTP-HepB+Hib) vaccine procurement
79,729,148 Ongoing since December 2007
Injection Safety Support 1,207,299 2002 – 2005 (time limited programme - completed)
Source: GAVI Alliance and Fund Board Meeting 25-26 June 2008 Doc # AF.14 -Report on Uganda ISS Case.
106. Between 2000 and June 2008, Uganda had received GAVI support totalling around US$ 87 million. Table 16 provides a highly aggregated summary of these inflows. Demonstrating more accurately the total annual committed and realised disbursements to GoU is much harder owing to the lack of comprehensive data on GAVI fund flows. GoU reporting to the GAVI Alliance in Annual Progress Reports (APRs) is denominated in US$ and arranged according to the GAVI calendar year and presents only partial data. It is possible to construct the flow of ISS funds from Annual Progress Reports however, and these are summarised in Figure 17.
Figure 17: GAVI-ISS Funding Flows and Expenditures (2001 – 2007), USD
Source: GoU Annual Progress Reports to GAVI Alliance.

Uganda Country Case Study
45
107. In August 2006 all cash transfers to Uganda were immediately suspended following allegations of mismanagement of ISS funds by the Ministry of Health (while vaccine supplies continued). It was decided by the Fund Board that GoU would need to reimburse the missing funds (US$500,000) and establish measures to avoid such misappropriations in future before resumption of ISS funds could be considered. Health Systems Strengthening (HSS) financial support committed in November 2007 was also put on hold pending agreement between the Alliance, Fund Board and GoU on future cash funding arrangements (GAVI Alliance, 2008). More details of the circumstances surrounding the suspension of funding are supplied in Box 13. At the time of suspension, ISS funds did not comprise a substantial portion of total funding for immunisation, at only around 3.3% in 2006 (GoU, 2007). However, the other major inflows for immunisation (GAVI, UNICEF, WHO, JICA and USAID) were primarily in-kind or heavily earmarked with limited fungibility, leaving GoU funding as the most viable option for covering the shortfall when funding was suspended.
Box 13: The GAVI-ISS Fund Suspension No ISS funds were released to Uganda during 2007. GAVI suspended release of ISS funds [in August 2006] following the alleged mismanagement of previous funds. Investigations into the alleged mismanagement of ISS funds are still on going. In 2006, the President of Uganda directed the Inspector General of Government (IGG) to conduct an investigation into the alleged mismanagement. The IGG report on the GAVI ISS Inquiry was handed to the President of Uganda on April 23 2007 and the report was sent to the Minister of Health on 7 May 2007 with instructions to the Permanent Secretary to write to all persons implicated to refund the money within sixty (60) days of the date of the report. So far, three of the individuals implicated have paid back the money in full (total of US$ 69,047.30); two have requested rescheduled payments; and two submitted satisfactory accountabilities. Five people have denied culpability including the two former Ministers whose matter is in court. In May 2007, three former Ministers of Health and an official from the State House implicated in the GAVI ISS funds mismanagement were arrested and the court proceedings are ongoing.
19
Source: GoU, 2008.
Global Fund (GFATM) 108. The Global Fund is an independent public-private partnership that was designed to attract and disburse additional resources for the prevention and treatment of HIV/AIDS, tuberculosis and malaria. In Uganda, the fund was introduced in 2003 with the signature of a Programme Grant Agreement in June (Global Fund, 2003) committing to provide US$36 million within the first two years of the grant. As with GAVI, the procedures adopted for Global Fund operations deviated substantially from established GoU planning, budgeting and financial management procedures, relying heavily on sector level accountability processes with MFPED playing a weaker role than it would in the management of domestic resources (see Box 14). 109. The Global Fund, contrary to the policy of MFPED, insisted on inserting an additionality clause into the Programme Grant Agreement, stating that: ‗‗The Global Fund has awarded the Grant to the Principal Recipient on the condition that the Grant is in addition to the normal and expected resources that the host Country usually receives or budgets from external or domestic sources. In the event such other resources are reduced to the extent that it appears, in the sole judgement of the Global Fund, that the Grant is being used to substitute for such other resources, the Global Fund may terminate this Agreement in whole or in part.‘ (Global Fund, 2003).‘ This explicitly overrode the MFPED‘s ceiling based approach to aid management, thereby undermining both MFPED macroeconomic management and GoU preferences regarding public resource allocation.
19 See Hillary Nsambu, ‗Muhwezi Blocks His Arrest Over Funds‘, The New Vision, Tuesday, 8th May, 2007 available at
http://www.newvision.co.ug/D/8/12/564037.

How Unpredictable Aid Influences Service Delivery
46
Box 14: Global Fund Governance Arrangements
At country level, the Country Coordinating Mechanism (CCM) is a partnership composed of all key stakeholders in a country‘s response to the three diseases. The CCM does not handle Global Fund financing itself, but is responsible for submitting proposals to the Global Fund, nominating the entities accountable for administering the funding, and overseeing grant implementation. The CCM should preferably be an already-existing body, but a country can instead decide to create a new entity to serve as CCM. The Global Fund signs a legal grant agreement with a Principal Recipient (PR), which is designated by the CCM – in Uganda the MFPED was designated as PR. MFPED then passed funds to the Ministry of Health and, finally, to the Project Management Unit (PMU) which sat within the health ministry. The PR also makes regular requests for additional disbursements from the Global Fund based on demonstrated progress towards the intended results. Since the Global Fund does not have staff at country level, it contracts firms to act as ―Local Fund Agents‖ (LFAs) to monitor implementation. LFAs are responsible for providing recommendations to the Secretariat on the capacity of the entities chosen to manage Global Fund financing and on the soundness of regular requests for the disbursement of funds and result reports submitted by PRs.
Source: Global Fund website (www.theglobalfund.org/).
110. The Global Fund has disbursed US$164 million over the period 2003 – 2009, of which 47% has been earmarked for HIV/AIDS related activities, 49% for malaria and 4% for tuberculosis. Figure 18 shows the size and frequency of disbursements within the GoU financial year (which runs from July - June) while Table 17 provides more detail on specific issues delaying individual Gloabal Fund grants to Uganda at present. It is clear that disbursements have borne little systematic relation to the GoU budget cycle and are instead driven by internal Global Fund procedural and fiduciary requirements.
Figure 18: Global Fund Financial Disbursements (2003 – 2009), US$ millions
Source: Global Fund website (www.theglobalfund.org/).
111. Spending of Global Fund grants has been very slow. As Bernstein & Sessions (2007) observe, twenty months into the two year grant period, the government had spent only $9.4 million, or 26%, of the total grant amount; delays were attributed by the Global Fund to

Uganda Country Case Study
47
‗procurement bottlenecks‘ and a weak project management unit (PMU) within the MoH. The Global Fund has been beset by disbursement delays between principal recipient (MFPED) and sub-recipients and these have adversely impacted on service delivery (Zikusooka et al, 2009). 112. In August 2005, the Global Fund suspended all grants to Uganda after the country's Local Fund Agent discovered financial irregularities within the Ministry of Health's special Programme Management Unit (PMU). GoU was forced to disband the PMU as a condition of re-commencement of funding and brought in an accounting and auditing firm as an interim arrangement to oversee grant administration (see Box 15 for more detail).
Table 17: Status of Global Fund Grants to Uganda as of 4 March 2009
Grant Start Date End Date Disbursed (US$)
Undisbursed (US$)
Status
Round 3 01 June 2005 31 Dec 2008 46,362,091 36,223,966 Continuity of Service Application submitted to PR and LFA, Internal GF Panel to make recommendation to GF board.
Round 4 (Malaria)
01 Dec 2005 Yet to be signed 59,071,374 71,034,989 Risk assessment underway by GF in house team. PR requested to prepare disbursement request in advance of grant signing
Round 6 (TB)
01 March 2008
28 Feb 2010 901,385 7,201,721 Delays due to change from project/CMF mode to LTIA. Disbursement request for anti TB drugs of usd1.683.719 awaits clearance at GF. Funds expected 9 March
Round 7 (HIV)
TBD – grant signed on 08
July 2008
To be Determined (TBD)
0 70,277,726 Disbursements awaiting the appointment of third party procurement agent (TPPA), a condition precedent to disbursement for health commodities as well as evidence that PR has approved work plans and budgets for sub recipients
Round7 (Malaria)
TBD – grant signed on 06
Aug 2008
To be Determined (TBD)
0 51,422,198 Disbursements are awaiting appointment of TPPA. This involves purchase of 17million nets and hence TPPA essential
Source: MoH.
Box 15: Suspension of Global Fund Grants
In August 2005, the Global Fund Secretariat suspended Uganda‘s funding of five grants (US$ 367 million) subsequent to a PricewaterhouseCoopers audit report, following a country evaluation, that exposed gross mismanagement in the Project Management Unit (PMU). The mismanagement was evidenced by inadequate monitoring and accounting of grant expenditures; inappropriate, unexplained and/or improperly documented expenses; and lack of adherence to set criteria (such as for vetting of sub-recipients) resulting in entities being funded without evidence of their legal status. The possible causes of mismanagement were considered to be (1) lack of capacity to manage the funds and undertake planned programme activities; (2) low levels of civil society participation; (3) unclear roles and responsibilities of the CCMs, principal recipient and the project implementation unit, which led to the sidelining of the CCM (i.e. instead of reporting to the CCM, the PMU was reporting to the Ministry of Health); and (4) poor communication between the members of the CCMs (for example lack of advance notice about meetings, late circulation of project proposal documents for review, and lack of, or failure to disseminate, guidelines such as the Project Implementation Manual which should provide guidance on how the PMU should select recipients for funds, disburse money and verify accountability).
Source: Kapiriri & Martin (2006).
4.4 Influence of and sector response to unpredictable aid
113. This Section seeks to examine some of the strategies adopted by the health sector in response to the problems of aid unpredictability identified above.

How Unpredictable Aid Influences Service Delivery
48
Short Term Influence of and Sector Response to Unpredictability: GAVI 114. From 2002/03 onwards, the UNEPI operational budget was largely dependent on GAVI ISS funds which have displaced GoU funds, to the extent that, in 2007/08 UNEPI was allocated only 4% of its operational budget on the assumption that GAVI ISS funding would still be available. However, when GAVI ISS funds were suspended, there was only very limited funding within the MoH budget line to fund UNEPI operations. The most heavily effected activities were: (i) procurement of the gas used by over 70% of the fridges that store vaccines, thereby undermining cold chain maintenance; (ii) distribution of vaccines and other immunization logistics with over 50% of the districts experiencing stock outs, and; (iii) support supervision including cold chain repair and maintenance (GoU, 2008). 115. The Health Sector Annual Performance Reports for 2006/07 and 2007/08 show a decline in the percentage of children under 12 months of age receiving 3 doses of DPT/pentavalent vaccines (an indicator used as a proxy for overall immunisation performance) from 90% to 82%. The MoH stated that: ‗This was mainly due to stock out of vaccines at district and health facility levels due to lack of gas which provides power to over 80% of the EPI refrigerators. The programme suffered from frequent interruptions in gas supply due to delays in payments to Shell, the major supplier of gas.‘ (MoH, 2008). That is, the decline in DPT3 coverage was attributable to the shortfall in GAVI-ISS funding. 116. GoU and health sector development partners pursued a number of strategies to address the shortfall in operational funding. During 2007 the HPAC later advised MoH to reallocate funds to UNEPI for operational activities. Measures were also undertaken by MoH to enhance efficiency, including tracking gas utilization in districts and re-negotiating with clearing agents the charging rates for clearing vaccines, fridges and injection materials. In addition, MoH reviewed its gas supply contracts with Shell and Chevron and procured 1,000 additional gas cylinders with support from WHO and UNICEF (MoH, 2008). Short Term Influence of and Sector Response to Unpredictability: Global Fund
117. As Zikusooka et al (2009; p. 34) note, ‗Uganda depends a lot on GHIs for ATM [Aids Tuberculosis and Malaria] funding. In instances where such resources are earmarked for the purchase of lifesaving medicines (e.g. ACTs and ARVs) it has been demonstrated that unreliable resource flows result in major challenges for service provision. For example, the lack of disbursements of GFATM resources in 2006 and 2007 resulted in a crisis where there were severe shortages of ARVs and ACTs.‘ 118. The Annual Health Sector Performance Report for 2007/08 illustrates the strategy adopted in response to the unpredictability of Global Fund resources (MoH, 2008). GoU made a budgetary allocation of UGX 8 billion (around US$ 5 million) for the procurement of antiretrovirals (ARVs) and artemisinin combination therapy (ACTs) anti-malaria drugs. In addition, GoU increased the credit line budget from UGX 7.2 billion to UGX 12.3 billion for the year to support provision of EMHS to PHC facilities through the credit line (Table 14 above shows this credit line increase for 2007/08). Nonetheless, promised Global Fund medicines for the treatment of tuberculosis were not forthcoming leading to a well publicised stock-out in late 2008 and early 2009 in many districts.20 Interviewees and media reports suggested sector managers resorted to a series of ad hoc strategies to address this. At district level managers borrowed drugs from health facilities with spare drugs, while at national level the National Tuberculosis and Leprosy Programme obtained an emergency loan of drugs from the Kenyan government and MoH submitted a supplementary budget request to MFPED.21
20
See Kakaire A. Kirunda, ‗Uganda in TB Drugs Shortage‘, Daily Monitor, March 17th 2009 available at
http://www.monitor.co.ug/artman/publish/news/Uganda_in_TB_drugs_shortage_81681.shtml 21
In a separate shortfall episode, Mbale district did not receive planned mosquito nets under the Global Fund and resorted to calling on its Health Links partnership with the Welsh local government of Pontypridd to source nets to meet some of the shortfall.

Uganda Country Case Study
49
119. In the longer-term, the MoH is seeking to build improved mechanisms for financing and procurement of EMHS, including the harmonization of procurements through the Rolling 3-Year Medicines and Health Supplies Procurement Plan. However, this remains a work in progress as – according to the MoH – a lack of transparency and openness on procurements of EMHS and their deliveries (―pipeline information‖) is undermining the predictability of the availability of key EMHS and hampering MoH from taking necessary procurement decisions in time (MoH, 2008). As the Ministry observed, ‗Uninterrupted availability of essential medicines like ARVs and ACTs continue to elude the system. Most important causative factors include the delayed resolution of the issues of concern between the GoU and the GFATM on the one hand and the preferred channel and management of the supply system‘ (MoH, 2008).
Long Term Institutional Arrangements (LTIA) 120. One of the principal sector responses to the fundamental problems of aid management proposed by the entry of global health initiatives has been the negotiation and implementation of the Long-Term Institutional Arrangements (LTIA). This is primarily an agreement between the Global Fund and GoU, approved by the Global Fund Secretariat in June 2007, towards better aligning aid from global health initiatives with GoU processes of planning, budgeting, reporting and accountability. That is, using established GoU systems rather than parallel MoH ones (see Box 16) as MFPED had originally requested when the GHIs first arrived in Uganda. GAVI has also agreed in principle that harmonizing and aligning its arrangements with the LTIA is the preferred approach for future cash funding, although it has insisted that this should include a GAVI technical assistance project based in the MoH (which had yet to be implemented at time of writing). However, both the Global Fund and GAVI have insisted on retaining their respective additionality clauses within the LTIA. Nonetheless, the acceptance of the LTIA by the Global Fund and (in the near future) GAVI represents a belated recognition that establishing parallel structures can actually increase the vulnerability of funds to abuse (and hence make them more unpredictable), and that use of country systems is not only good for long-term systemic strengthening, but the best means of safeguarding funds in the short-term and hence reducing vulnerability to the shocks witnessed in recent years. Where such funds are financing recurrent basic health care costs such as immunisation or courses of anti-retrovirals, this is doubly important.
Box 16: LTIA Financing Mechanisms
The LTIA funding mechanisms aim at channelling all health funds in line with Government of Uganda preferred modalities, consistent with sound national macroeconomic management. Therefore, under LTIA; I. Budget Support financing, which could be earmarked or general shall be adopted for all Global Health Grants for Public Sector interventions as it represents the most adept financing mechanism to ensure alignment with national systems for planning, budgeting, implementation and monitoring
II. Funding to programs shall be ring-fenced in the Poverty Action Fund (PAF) mode following the PAF guidelines in order to protect the funds from budgetary pressures and allow rigorous monitoring and assessment procedures to be used. III. Provision of funding through the project mode reflected in the MTEF remains an alternative but as an interim measure, and even then it should be targeted support. This however should be subject to alignment with the strategic frameworks, consultative and participatory project proposal/plan development, review by the Sector budget working group to ensure alignment and rationalize resource allocation and approval by the projects development committee of Ministry of Finance, Planning and Economic Development (MoFPED). IV. The MoFPED remains the Principal Recipient for all Global Health Grants raised or received for the purpose of, or on behalf of, or in trust for the people of Uganda. Selection of a second Principal Recipient for Civil Society Organizations (CSOs) may be considered at a later date.
Source: GoU (2008b; p. 6)

How Unpredictable Aid Influences Service Delivery
50
121. The agreement of the LTIA has also, to some extent, revitalised the health SWAp. According to the HHSP II Mid-Term Review, the Health Policy Advisory Committee (HPAC) has undergone restructuring as part of the implementation of the LTIA and as a result it has met regularly and consistently and is perceived by most to be an effective forum for stakeholder consultation (MoH, 2008).

Uganda Country Case Study
51
5. Influence of Unpredictable Aid on Health Sector Service Delivery
5.1 Overview of other factors influencing Health Service Delivery
122. During the study period (1999 – 2008), there have been a number contextual factors impacting on the health sector in Uganda. These factors must first be taken into account before making judgements regarding the overall likely impact of unpredictable aid on health sector service delivery. Factors are grouped into two broad categories: first, the overall environment in which health services are delivered (a very general category covering factors both within and beyond the control of GoU) and, second, the specific changes to the GoU Health system over the period. Factors are also characterised according to whether they have had a broadly positive or broadly negative impact, or whether they may have both positive and negative effects. Table 18: Factors (Other than Unpredictable Aid) Influencing Health Sector Service Delivery
Domain Specific Factors Which Have Influenced Service Delivery
Broader Health
Environment
Broadly negative Political environment creating pressures for diversion of funds at sector level. Decline in extent to which PEAP is a statement of GoU political priorities. Decline in the proportion of donor funding using country systems despite improvements
in their quality. Increase in the number of districts. High population growth driving up costs of a given level of service provision. Lack of trained public sector health workers compounded by loss of trained public
sector health workers to PNFP sector. Stagnation of non wage recurrent grants to districts. Planning, short-term and in-year unpredictability of conditional grants at district and
Health Centre level. Lack of a single comprehensive system for tracking aid flows. Evidence of significant waste and inefficiency in health sector spending. In-year budget reallocations (or virements) within the health sector which undermine
delivery of key programmes Broadly positive Strong and sustained economic growth within a stable macroeconomic environment
bringing increases in domestic revenues as a predictable source of financing for recurrent activities
Improved national strategic planning and donor coordination through the Poverty Reduction Strategy Paper (PEAP).
Introduction of the Poverty Action Fund (PAF) to provide assurances to donors and generally improved predictability of budget releases from MFPED for priority votes.
Sustained and independently verified improvements in the quality of GoU public finance management systems.
Donor dialogue and associated inputs around budget support focus on the strengthening of national systems (e.g. support to development of FMIS), thereby improving the flow of resources to service delivery units.
Very recent increase in emphasis on service delivery outputs within MFPED and the budget process as a whole.
Strong nominal and real growth in GoU health spending. Processes to increase decentralization of funding flows to local governments.
Broadly negative
Health Systems
Replacement of the political, administrative and technical leadership of MoH. Unravelling of gains in donor coordination with entry of new funds and re-fragmentation
of sectoral funding (in particular, sector dialogue focusing on GHI mechanisms/procedures rather than national health system itself).
Dramatic increase in the extent of earmarking in health sector aid flows, undermining

How Unpredictable Aid Influences Service Delivery
52
Domain Specific Factors Which Have Influenced Service Delivery
the gains made by sector donors in the switch to GBS and SBS and the discretion of health sector managers
Successful attempt to undermine MFPED macroeconomic management and GoU strategic resource allocation by GHIs‘ insistence on additionality clauses.
Continued confusion surrounding processes for drug procurement. Contingent liability of new but expensive health interventions – ARVs and pentavalent
vaccines – adopted through the GHIs. Contingent liability of running and maintaining expanded health infrastructure.
Broadly positive Abolition of user fees in Government units in March 2001 (Initially) improved donor coordination through implementation of a health SWAp Improved strategic planning (HSSP I and II) Consolidation of donor funding for drugs into a single credit line
5.2 Impact of unpredictable aid on health sector service delivery
123. Bearing in mind the factors summarised in Table 18 above, some assessment can be made concerning the impact of unpredictable aid on service delivery in the health sector. Table 20 gives an overview of aid predictability issues in the Health Sector and suggests the impact that the issues might have on service delivery. The aid flows in question clearly resulted in a net increase in aggregate ‗service delivery‘ over the period. The question examined in this Section is whether or not, for the given volumes of funding in question, unpredictability resulted in a change in service delivery compared to a scenario in which these aid flows had been delivered in a more predictable manner.

Uganda Country Case Study
53
Table 19: Impact of unpredictable aid on service delivery
Nature of Aid Delivery
Aid Predictability Issues Responses from key Actors Suggested Impact on Service Delivery
Via national systems and unearmarked below sector
level (i.e. GBS, SBS)
Limited medium-term predictability for most donors.
Highly unpredictable source of funding in terms of short-term predictability.
Limited prospects for improvement: Unlikely to be resolved in the medium-term primarily due to political environment.
Strategy of saving and dissaving of foreign exchange reserves by MFPED and BoU mitigates unpredictability.
Strategy of inflating budget support projections in the outer years of the MTEF to counter donor under-estimation.
Strategy of discounting of donor commitments in the annual budget in anticipation of shortfalls by MFPED mitigates unpredictability.
Explicit macroeconomic strategy from MFPED & BoU of reducing aid dependence (measured primarily by fiscal balance before grants), resulting in a decrease in the proportion of aid financing of the budget.
Strategy by MFPED of maintaining recurrent expenditures at or below domestic revenues ensuring budget support is not required to finance recurrent expenditures (e.g. salaries or interest payments).
Strategy by MFPED of attempting to ensure that the development budget does not contain activities that are recurrent in nature.
Creation of Poverty Action Fund (PAF) by MFPED to provide ‗virtual‘ reassurance to donors that funds will be spent on priority areas.
Use of PAF to guarantee 95% short-term predictability of releases to priority line ministries & districts.
Strategy by MFPED of in-year cut backs of discretionary expenditures – in particular the development portion of the budget.
MFPED strategies have helped to mitigate against the high medium-term and short-term unpredictability of budget support as an adverse influence on execution of recurrent expenditures.
Although in-year predictability of budgetary releases has improved, it is still highly imperfect, particularly at health facility level.
Project aid via national systems
Unpredictable source of funding in terms of short-
In 2004 MFPED required that all project aid accounts be transferred from commercial
~ A key tension in the health sector is how to reconcile tightly earmarked donor

How Unpredictable Aid Influences Service Delivery
54
Nature of Aid Delivery
Aid Predictability Issues Responses from key Actors Suggested Impact on Service Delivery
term predictability at the aggregate level.
Not possible to verify short-term predictability at Vote Function level due to lack of project aid execution data.
Routinely undermined by low absorptive capacity and failure by GoU to meet disbursement triggers.
Adversely affected by GoU in-year cutbacks to counterpart funds.
banks to the BoU. This has substantially improved the availability of information on project aid inflows and BoU‘s macroeconomic management of them.
However, not all project accounts are held centrally at BoU and, in any case, the data is not sufficiently accurate to capture project expenditures at Vote Function level.
GoU does not have comprehensive data on project expenditure data. Budget execution reports routinely cite N/A for project execution at Vote Function level.
As with budget support, MFPED applies discounting to project aid in order to mitigate unpredictability.
projects delivered within sector ceilings with the need for more discretionary resources for sector managers to ensure consistent levels of service delivery.
Global Health
Initiatives partially using
national systems (i.e. Global Fund
& GAVI)
Very limited data on aid flows for planning and budgeting.
Highly unpredictable source of funding in terms of short-term predictability.
Highly unpredictable in terms of in-year predictability.
Highly earmarked and predominantly in-kind.
Potential contingent liability created by high cost medicines tied to aid delivery.
Disruptive suspensions of funding flows in both cases.
Lack of transparency and openness on procurements of EMHS and their deliveries (―pipeline information‖).
MFPED sought (but initially failed) to have funds channelled through established structures and within sector ceilings and accountability structures as budget support.
Naive analysis of health sector political economy behind initial aid instrument design by GAVI (ISS payments in particular) and Global Fund, thereby making abuse and ultimately suspension of funding more likely. Funds were more vulnerable outside GoU procedures.
Enormous and rapid aid inflow, tight earmarking focused on consumables & insistence on additionality in context of low health sector absorptive capacity overstretch systems & make underperformance inevitable.
Ultimately MFPED has been vindicated in seeking to channel funds more fully through national systems and the Global Fund has agreed to adhere to the Long-Term Institutional Arrangements (LTIA) while GAVI seems likely to adopt them too.
Suspension of both GAVI and Global Fund aid flows represented a major shock to service delivery.
Routine delays in disbursements of Global Fund between MFPED (Principal Recipient) and Sub-Recipients, adversely affecting service delivery.
Delays in Global Fund disbursements have resulted in stock-outs of e.g. tuberculosis drugs in late 2008 and early 2009 in many districts.
The unpredictability of small but more discretionary aid flows such as GAVI-ISS funds was particularly damaging for service delivery as it came to displace a recurrent budget line for UNEPI. MoH was able to mitigate the effects eventually but there was a clear negative impact on service delivery. Over 50% of districts experienced immunisation drug stock-outs, and ultimately the coverage of DPT3 declined from 90% to 82%.
Risk aversion within MoH resulting from the

Uganda Country Case Study
55
Nature of Aid Delivery
Aid Predictability Issues Responses from key Actors Suggested Impact on Service Delivery
Onerous and separate procurement procedures complicate and delay procurement.
Refusal to accept GoU sectoral ceilings by GAVI and Global Fund continues to undermines macroeconomic framework and GoU strategic resource allocation according to domestic political priorities.
MoH forced to adopt innovative ad hoc approaches to deal with shortfalls in aid delivery (both cash & in-kind) including renegotiating gas supply contracts & borrowing drugs from neighbouring countries.
GoU made budgetary allocations for the procurement of ARVs & ACTs and increased the credit line budget to counter Global Fund unpredictability.
MoH is seeking to build improved mechanisms for financing and procurement of EMHS, including the harmonization of procurements through the Rolling 3-Year Medicines and Health Supplies Procurement Plan.
scandals around GAVI and Global Fund abuses has slowed the flow of funds within the sector.
Sector Projects entirely outside
national systems (i.e. PEPFAR &
PMI)
Extremely limited data on aid flows for planning and budgeting.
Financing service delivery in PNFP sector rather than through GoU.
Very poor predictability of funding levels available to recipients during planning due to link to Congressional budget timetable.
Recipient organizations closely monitor the budget process & maintain regular dialogue with PEPFAR staff, undertaking programmatic planning prior to final U.S. budget approval based on educated guesses about how much funding will be available to particular countries.
~ PEPFAR finances service delivery through PNFP sector.

Uganda Country Case Study
56
6. Conclusions & Recommendations
6.1 Conclusions
124. Aid to Uganda over the study period has been highly unpredictable – far more unpredictable than domestic resources. The average shortfall or windfall for domestic resources (i.e. tax and non-tax revenues) using absolute values was 2.0% of the total budgeted figure for 2000/01 – 2008/09 compared to 15.6% for total on-budget aid. The available evidence suggests that aid unpredictability is high across all definitions used here: medium-term, short-term and in-year. It also suggests that all the aid instruments examined – budget support, project aid and the GHIs – are highly unpredictable across these dimensions. However, the implications of this unpredictability for service delivery vary by aid modality and by whether or not aid is on-budget or not. Aggregate aid predictability issues 125. The risk to the long-term fiscal sustainability of the GoU budget posed by a substantial and sustained shock to aid flows has reduced dramatically due to the strategies adopted by MFPED and BoU. To implement the budget, the MFPED effectively follows a fiscal rule which ensures that GoU recurrent expenditures (i.e. excluding domestically and externally financed development projects) can be wholly financed by domestic revenues, thereby insulating GoU recurrent expenditures almost completely from sustained shocks to aid flows (including shocks to direct budget support). Basic services such as primary health care comprise expenditures that are predominantly recurrent in nature (e.g. doctors‘ and nurses‘ salaries and drugs). GoU has therefore established a position whereby domestic revenues are always sufficient to finance the recurrent (i.e. operational) elements of such basic services.22 126. This strategy was made possible by consistently high economic growth rates over the last decade (averaging 7.6%), which have allowed GoU to significantly increase domestic revenues and, by limiting expenditure growth to below revenue growth, to reduce the fiscal deficit before grants. Although this policy was not solely motivated by aid unpredictability concerns – it was primarily seen as a prudent macroeconomic policy – it has had the effect of dramatically reducing the risk to long-term fiscal sustainability posed by a shock to aid flows. 127. The extent to which domestically financed development projects are dependent on aid has also reduced, although not entirely. The hypothetical scenario of a sustained reduction or cessation of on-treasury aid (e.g. direct budget support) would therefore not have much of an impact on GoU recurrent spending, though there may be some limited impact if domestically financed development projects are prioritised at the expense of some non-essential discretionary recurrent spending. 128. Over the medium-term, predictability of aid flows is very low, as donors have a tendency to overestimate aid commitments in the short-term and to underestimate their likely contributions in the medium-term. This undermines the reliability of the annual budget and, to an even greater extent, the outer years of the MTEF resource envelope. MFPED attempts to correct for these effects by applying differing discount factors on budget support and project aid in the short-term and by projecting an (unrealistic) increase in Net Credit to Government from BoU in the outer years of the Macro Framework, to ‗compensate‘ for the decline in project support projections. This strategy has primarily helped to improve the realism of the monetary programme (i.e. the mix between the use of international reserves and government securities) because it enabled a more realistic forecast of likely foreign exchange inflows from donor aid by forecasting predictable shortfalls.
22
This strategy has already been identified by Brownbridge and Tumusiime-Mutebile (2007) for Uganda. Penrose (2009) dicusses some of the implications of such fiscal rules for budget support programmes.

Uganda Country Case Study
57
129. As part of its macroeconomic management, MFPED has attempted to impose sectoral ceilings through the MTEF process which include project aid, thereby asserting GoU‘s prerogative to undertake strategic resource allocation and clearly limiting the additionality of project aid to recipient sectors. This in turn has created perverse incentives for aid reporting at sector level and is likely to have lead to an increase in the proportion of aid which is not captured within the MTEF and annual budget. This has not been helped by the lack of a single comprehensive system for collation of data on aid inflows – GoU and donors were developing an Aid Information Management System (AIMS) at time of writing which may go some way to addressing this.
130. Direct budget support (both general and sector budget support) is highly unpredictable, with an average shortfall or windfall (using absolute values) of 30% over 2000/01 – 2008/09. However, MFPED‘s adherence to an IMF programme totally insulates GoU from this unpredictability. Under the programme shortfalls in budget support inflows are automatically offset by domestic borrowing and windfalls are automatically saved, thereby lowering the GoU‘s ‗Net Credit to Government‘ position with BoU and enabling a greater borrowing in future years if required. 131. This is a strategy commonly adopted in countries operating IMF programmes, whereby the programme targets for government domestic borrowing are ―adjusted‖ for deviations in external budget resources and external debt service from what is budgeted. The ability of the MFPED to insulate the GoU budget from budget support shortfalls in this way requires that international reserves are large enough to absorb a shortfall without falling to levels regarded as inadequate – budget support unpredictability is therefore a much greater problem in countries with low levels of international reserves. In Uganda, service delivery is unaffected by high short-term unpredictability of budget support, despite the fact that donors have failed to make it into a stable and predictable form of budgetary finance. 132. MFPED has also adopted a strategy of discounting donor aid commitments in the budget by 20% or so. Even without this strategy, the IMF programme would afford MFPED total protection. Discounting therefore effectively serves to increase the realism of the GoU monetary programme. 133. As with the policy of imposing sectoral expenditure ceilings which included aid flows, the risk mitigation strategies pursued by MoFEP (discounting, expenditure smoothing and deficit reduction) have at times been highly controversial with certain donors, who object to reductions in pro-poor spending that supposedly result from these practices. This allegation only applies strongly to MFPED‘s policy of pursuing a policy of fiscal deficit reduction (before grants). While this is in part a subjective question, donors in favour of a more expansionary macroeconomic policy severely undermined their case by providing such highly unpredictable aid flows. 134. Expenditure releases by MFPED for expenditures within the Poverty Action Fund (PAF) are particularly reliable. GoU has made a political commitment to guarantee the predictable release of up to 95% of these funds to line ministries and districts. MFPED has been able to sustain this commitment by using the above-mentioned mitigation strategies that protect in-year cash flows despite a high degree of (both expected and unexpected) unpredictability in budget support and by prioritising PAF releases in the cash management process. The availability and coverage of budget data for budget support flows is relatively good, partly as a result of the introduction of a spreadsheet-based reporting system for commitments by MFPED‘s Macro Department which donor country office economists complete and return, and partly because budget support is by definition ‗on-treasury‘ and ‗on-account‘. 135. The picture is less clear for project aid. Partly due to a widespread assumption within MFPED that budget support would comprise an increasingly large portion of total aid flows in recent years (a trend that has failed to materialise), aid financed projects have not been the subject of as much comprehensive attention as budget support within MFPED. Attention has focused more on trying to encourage donors to move towards budget support than on compiling data on projects and encouraging them to be moved on-system. While there is a similar spreadsheet based system

How Unpredictable Aid Influences Service Delivery
58
to that used for budget support in operation for collation of project aid commitments, far less emphasis has been placed on systematically recording aid financed project execution data. While the move to ensure all project aid accounts were held centrally at BoU has helped in assessing total aid flows, this does not provide sufficiently disaggregated data for budget execution reporting at Vote Function level. There is therefore a far lower quality of data available for project aid than budget support. 136. Recent reforms to the preparation of the Budget Framework Paper (BFP) and the annual budget designed to give budget documents a more programmatic and output-focused structure have revealed to GoU managers the fact that there is no comprehensive budget execution data for aid-financed projects at Vote Function level present. This makes assessing the predictability of project aid very difficult. Available evidence at the aggregate level suggests that the unpredictability of project aid is very high. Reasons for unpredictability of project aid are often highly idiosyncratic to specific projects, relating for example to the reliability of GoU counterpart payments, completion of agreed ‗prior actions‘ by GoU. 137. However, managing the unpredictability of project aid has proved more difficult. MFPED does adopt the discounting approach applied to budget support for project aid, but the high degree of unpredictability of project aid continues to affect the in-year execution of externally financed projects in the development portion of the budget. Since the unpredictability of budget support is in part mitigated by in-year changes in domestically financed projects, the overall result is that unpredictable aid is much more damaging to the development portion of the budget, thereby disproportionately undermining public investment. Specific findings in the health sector 138. Evidence from the health sector suggests that the extent to which aid unpredictability influences service delivery depends upon the detailed design of the aid instrument. The key area where aid unpredictability has the strongest adverse influence on service delivery is where aid is: i) channelled outside of national systems to some extent (either through Channel 2 or Channel 3); and ii) tightly earmarked to specific recurrent activities (e.g. provision of expensive in-kind drugs such as pentavalent vaccines, ACT anti-malarial drugs and ARVs). Highly discretionary aid flows such as budget support are less damaging because many more strategies are available to GoU managers (i.e. in MFPED and MoH) to mitigate the effects of their unpredictability. Although it does not capture all the variables at play, these differences are summarised in Table 20.
Table 20: Implications of Aid Instrument Design for Management of Unpredictability
Broad earmarking Tight earmarking
Channel 1 Aid instrument examples: GBS, Some SBS Some SBS, Some aid projects, GAVI ISS Funds
Influence of unpredictability on service delivery:
None. MFPED and BoU totally mitigate through IMF programme.
High, sector can make in-year budget transfers, request supplementary.
Channel 2 Aid instrument examples: No examples found Health Basket, Some aid projects, GFATM, GAVI, PEPFAR
Influence of unpredictability on service delivery:
N/A. Very High sector uses unorthodox strategies (e.g. borrowing drugs from Kenya), GoU ultimately increased own resources to reduce reliance on aid
Channel 3 Aid instrument examples: No examples found PEPFAR, Some aid projects
Influence of unpredictability on service delivery:
N/A Not primary study focus. Likely to be very high.

Uganda Country Case Study
59
139. Nowhere have these effects been more pronounced than in the case of the ‗vertical‘ global health initiatives – GAVI and the Global Fund in particular. Both funds promised to channel millions of dollars to pre-defined operational/recurrent activities within the health sector, and both refused at first to fully use national PFM systems (contrary to requests from MFPED). Both initiatives were also subject to diversion and abuse that led to the suspension of disbursements, partly as a result of being off budget and hence not subject to full GoU accountability processes, based on a somewhat naive assessment of health sector political economy at the design stage. It is only recently that they have come more comprehensively ‗on-system‘ as MFPED had initially requested following damaging suspensions in both cases. 140. Again, GoU sought to adopt strategies to mitigate the unpredictability of global health initiatives, such as providing supplementary budgets for health and the MoH borrowing drugs from neighbouring countries. Despite the attempts to mitigate the large shortfalls, there was a large reported adverse influence on service delivery, as illustrated within the immunisation programme where there was a marked fall in DPT3 coverage following the suspension of GAVI-ISS funding. In the longer-term, the health sector has gone about mitigating the adverse effects of the unpredictability of GHIs by negotiating ‗Long Term Institutional Arrangements‘ (LTIA) that are broadly acceptable to the GHIs and, to some extent, by reinvigorating the role of the SWAp in health sector management.
141. As a result of the vertical funds‘ entry into the health sector there has been an unravelling of gains in donor coordination and a re-fragmentation of sectoral funding. In particular, sector dialogue has come to focus disproportionately on GHI procedures (disbursement triggers, audits etc.) rather than national health system itself. This is an indirect effect of the high unpredictability of these funds, and has transferred MoH officials‘ and sector donors‘ attention away from strengthening sector systems for service delivery and onto how to resuscitate and manage the flow of vertical funding. 142. The GHI approach also raises substantial challenges regarding the long-term sustainability of health sector service delivery, as they are tightly earmarked to specific drugs which have tripled the cost of immunisation and malaria prophylaxis for example. It is expected that GoU will ultimately take on the burden of financing these more expensive treatments, but the high medium-term, short-term and in-year unpredictability of the aid flows delivering them to date suggests that a smooth transition to GoU provision is likely to be very difficult to manage. From managing unpredictability to improving service delivery 143. It should be noted that at sector and district levels the link between aid predictability and service delivery immediately becomes more complicated. At this level the regularity of resource flows between levels of government becomes important. Often regular releases from MFPED to line ministries and districts do not translate into regular disbursements to frontline service delivery units, and there is evidence of significant leakage, waste and inefficiency in health sector spending. Thus it is more difficult to attribute resource unpredictability to aid unpredictability as we move down the service delivery chain. However, by using these systems to channel aid and by focusing dialogue and capacity building on their strengthening, more ‗on-system‘ and discretionary aid modalities such as budget support offer a means of addressing this systemic unpredictability, while approaches that hive off service delivery through parallel systems tend to draw sector attention away from strengthening of core GoU systems as dialogue becomes fixated on the instruments themselves and how to address their flaws.
144. Designing aid instruments that make the inherent unpredictability of aid flows more manageable for recipients is a necessary but not sufficient condition for improved government service delivery. Going beyond this rather narrow ‗do no harm‘ agenda and actually getting to grips with the substantive barriers to service delivery in government systems will – as Williamson et al. (2010) observe – take donor officials and their counterparts out of their comfort zones and consequently will require a substantial policy drive from donor HQs, especially in the light of the

How Unpredictable Aid Influences Service Delivery
60
general move away from sector specialists in donor country office staffing. It will also require a more nuanced interpretation of ‗national ownership‘, seeing it not simply an excuse for the scaling back of donor engagement with sector problems. Genuine country-level engagement in the strengthening of sector systems for service delivery – including a robust dialogue over bottlenecks – will require a substantial shift in donor policy. This is a distant prospect however. Evidence from Uganda‘s health sector suggests that there is some way to go before the ‗do no harm‘ agenda is adequately addressed, let alone the genuine problems of health sector service delivery.
6.2 Recommendations
For Ministries of Finance and Planning and/or Central Banks
Prudent macroeconomic management strategies can help to protect cash releases – and hence service delivery – from the inherently high unpredictability of aid flows. As Uganda‘s case illustrates, practices such as adhering to an IMF programme (which requires maintenance of adequate levels of international reserves and close coordination of fiscal and monetary policy), pursuing a strategy of fiscal deficit reduction and discounting aid forecasts have proved very effective for certain types of aid.
Insisting that the accounts for externally financed projects are all held at the Central Bank can significantly enhance the data available on aggregate aid inflows and therefore improve macroeconomic management of episodes of unpredictability.
The change in the structure of the budget associated with the introduction of Vote Functions (i.e. a greater output focus) has illustrated a systematic lack of financial data about externally financed projects. Tracking project aid disbursements at project level requires concerted effort, especially where projects are off system and can be undermined if there are unclear or overlapping responsibilities within government.
As regards cash management, the creation of a virtual Poverty Action Fund (PAF), provided it is accompanied by strong political commitment and a sensible identification of ‗pro-poor‘ budget lines or votes, can also help to ensure that cash releases from the Treasury for service delivery – especially basic services such as primary health care – are prioritised ahead of other budget lines or votes. This mechanism depends crucially on political support and is not appropriate to all settings at all times.
By providing virtual earmarking, a PAF is a particularly useful strategy for encouraging donors to adopt aid instruments that make more extensive use of country systems (notably GBS and SBS). Such ‗on-system‘ aid modalities are amenable to the unpredictability mitigation strategies identified above and therefore preferable to off-system aid instruments. This depends on the willingness of donors to increase their use of country systems however, which may be limited by other factors: it will not work in all settings at all times.
Encouraging donors to put projects on-system can be equally as important as encouraging a concerted move to different aid instruments such as Direct Budget Support.
While the above mechanisms can ensure a high degree of predictability for cash releases from the Treasury, they do not guarantee a predictable flow of resources to frontline service delivery units. This requires attention to the intermediary ‗pipes‘ though which money flows. While not the panacea they are often portrayed as, nationally owned and initiated diagnostic studies such as PERs, sub-national PEFAs and PETs (or even simple unannounced monitoring missions such as those the MFPED‘s BMAU undertakes) can help to identify bottlenecks and leakages at lower levels in the system.
Having an output based classification in the annual budget can help to make it a more accessible document and to focus attention on what outputs are delivered (planned and executed), thereby bringing the pressures of accountability mechanisms (parliament, public accounts committee, donors) to bear, however indirectly, on service delivery. MFPED has used this approach to apply pressure to line ministries to try to improve performance. This is budgetary reform is the result of a temporally unique set of political incentives however – sustaining the reform after the elections will be more challenging.
Uganda Country Case Study
61
There is a tension between the objectives of prudent aggregate macroecononmic management and sector level interests (both line ministry and donor) which can lead to unintended policy outcomes. MFPED‘s policy of setting sectoral expenditure limits that included aid flows limited the extent to which donors could claim additionality in their funding and lead to an increase in the proportion of off-system aid.
For Ministries of health
The temptation to support sector donors in establishing parallel funding channels outside of Government systems (often in pursuit of ‗additionality‘) should be resisted. By opting out of engagement with national systems, it is not as easy to deal with the inevitable episodes of aid unpredictability.
Tight earmarking of aid to expensive recurrent expenditures (ARVs, ACTs, pentavalent vaccines) which displaces (usually cheaper) options which were formerly funded through the budget creates a serious contingent liability that requires close attention. Purchasing such items through the national budget with ‗virtual‘ GBS or SBS financing provides more scope for dealing with aid shortfalls or sustained shocks such as those experienced by GAVI and GFATM.
Approaches such as the Long-Term Institutional Arrangements (LTIA) developed in Uganda provide an example of a framework through which negotiation with the global initiatives on aligning with government systems for planning, budgeting, reporting and accountability can be undertaken.
For donor agencies
Uganda‘s experience suggests that all aid instruments are inherently unpredictable. However, the unpredictability of aid instruments that use country systems to a greater extent is much more manageable for recipient countries than off-system aid. This suggests that the implementation of key dimensions of the Paris Declaration on use of country systems is materially important for service delivery (at least in a ‗do no harm‘ sense). GBS and SBS are on-system by definition and are therefore less harmful in this regard. However, it is important to note that both project aid and vertical programmes can also be on-system. Careful attention should be paid to this.
Both donor officials dealing with dialogue on macroeconomic and fiscal management and operating at sector level should make efforts to improve their economic literacy to ensure a better understanding of the effects of unpredictable aid and the logic behind government efforts to mitigate this.
Progress towards more manageable aid instruments requires sustained attention to ensure reforms stick. It is possible for hard won advances in sector aid effectiveness to unravel under pressure. This could be addressed in part if feedback channels from country officials (both sector specialists and macroeconomists) to those in headquarters designing global health interventions were built and used at design stage.

How Unpredictable Aid Influences Service Delivery
62
References Barkan, J. D., Simba Kayunga, S., Ng‘ethe, N. and Titsworth, J. (2004) ‗The Political Economy of
Uganda: The Art of Managing a Donor-Financed Neo-Patrimonial State.‘ Final Draft, July 6th 2004.
Berstein, M. & Sessions, M. (2007) ‗A Trickle of a Flood: Commitments and Disbursement for HIV/AIDS from the Global Fund, PEPFAR, and the World Bank‘s Multi-Country AIDS Program (MAP).‘ Centre for Global Development, March 5th 2007.
Brownbridge, M. & Tumusiime-Mutebile, E. (2007) ‗Aid and Fiscal Deficits: Lessons from Uganda on the Implications for Macroeconomic Management and Fiscal Sustainability.‘ Development Policy Review, 2007, 25 (2): 193-213.
Brownbridge, M. (2009) Correspondence with authors.
Cruz, Valeria Oliveira, Ros Cooper, Barbara McPake, Rob Yates, Freddie Ssengooba, Francis Omaswa, Christine Kirunga Tashobya and Grace Murindwa (2006) ‗Is the sector-wide approach (SWAp) improving health sector performance in Uganda?‘ In Health Systems Reforms in Uganda: Processes and Outputs. Christine Kirunga Tashobya, Freddie Ssengooba, Valeria Oliveira Cruz (Eds.).
Davies, F. (2009) Correspondence with authors.
GAVI Alliance (2008) ‗GAVI Alliance and Fund Board Meeting 25-26 June 2008 Doc # AF.14 -Report on Uganda ISS.‘
GAVI Alliance (2008a) ‗Mission to agree on requirements for lifting the suspension of cash transfers on GAVI Alliance Immunization Strengthening Support (ISS) & Health Systems Strengthening (HSS) support between the Government of Uganda and the GAVI Alliance Secretariat.‘
Global Fund (2003) ‗Programme Grant Agreement Between the Global Fund to Fight AIDS, Tuberculosis and Malaria (―Global Fund‖) and the Ministry of Finance, Planning and Economic Development of the Government of Uganda (―Principal Recipient‖).‘ 10th July 2003.
Government of Uganda (2005) ‗Memorandum of Understanding Between the Government of Uganda and the Following Development Partners...‘
Government of Uganda (2007) ‗GAVI Alliance Annual Progress Report 2006.‘
Government of Uganda (2008) Evaluation of the Implementation of the Paris Declaration.‘
Government of Uganda (2008a) ‗GAVI Alliance Annual Progress Report 2007.‘ 15th May 2008.
Government of Uganda (2008b) ‗Long Term Institutional Arrangements for Management and Coordination of Global Health Grants in Uganda – Abridged Version.‘ August 2008.
Government of Uganda (2008c) ‗Annual Budget Performance Report FY 2007/08.‘ Ministry of Finance, Planning and Economic Development, October 2008.
Government of Uganda (2009) ‗Public Finance Management Performance Report 2008.‘ Final Report, June 14, 2009.
Handley, G. (2009) ‗Sector Budget Support in Practice: Literature Review.‘ Overseas Development Institute, November 2009.
HealthNet Consult (2007) ‗Assessment of Public Expenditures for the Health Sector in Uganda 2003/04 – 2005/06‘, May 2007.
IMF (2005) Macroeconomics of Managing Increased Aid Inflows.

Uganda Country Case Study
63
IMF (2007) Aid Inflows—The Role of the Fund and Operational Issues for Programme Design Background Paper (Including Ghana and Uganda case studies).
IMF (2009) 2008 Article IV Report.
Kapiriri, L. & Martin, D. K. (2006) ‗The Global Fund Secretariat‘s suspension of funding to Uganda: how could this have been avoided?‘ Bulletin of the World Health Organization 2006;84:576-580.
Kirunga Et Al. (2006) Health Systems Reforms in Uganda: Processes and Outputs. Health Systems Development Programme, London School of Hygiene & Tropical Medicine, UK.
Lister et al. (2006) ‗Evaluation of General Budget Support – Uganda Country Report.‘
MFPED (2003) ‗Partnership Principles between Government of Uganda and its Development Partners.‘
Ministry of Health (2008) HSSP II MTR Parts a and b. October 2008.
Ministry of Health (2008a) ‗Annual Health Sector Performance Report, Financial Year 2007/08.‘ October 2008.
Ministry of Health (2009) National Health Policy: Reducing poverty through promoting people‘s health.
Ministry of Health (Undated) HSSP II 2005/06 – 2009/2010.
MoH (2005) Health Sector Strategic Plan 2005/06 – 2009/10 Volume I.
Mokoro (2008) ‗Putting Aid on Budget: A Study for the Collaborative Africa Budget Reform Initiative (CABRI) and the Strategic Partnership with Africa (SPA).‘ Synthesis Report, April 2008.
Moncrieffe J. (2004) ‗Uganda‘s Political Economy: A Synthesis of Major Thought.‘
ODI (2007) Division of Labour Exercise for Uganda. Interim Report
ODI (2009) ‗How Unpredictable Aid Influences Service Delivery: Outline Methodology for Country Case Studies.‘ Centre for Aid and Public Expenditure (CAPE), Overseas Development Institute, 5th May 2009.
OECD (2008) ‗2008 Survey on Monitoring the Paris Declaration: Uganda Country Chapter.‘
Office of the Auditor General (2006) ‗Value For Money Audit Report On The Management Of Health Programmes In The Health Sector Ministry Of Health‘, December 2006.
Office of the Auditor General (2006) ‗Value for Money Audit Report on Uganda Aids Control Project.‘ October 2007.
Office of the Auditor General (2006) Value for Money Audit Report on the Management of Health Programmes in the Health Sector: Ministry of Health.‘ December 2006.
Office of the Auditor General, 2008, PEFA ―LITE‖ Public Expenditure and Financial Accountability Appraisal of the Financial Management Performance, Kampala-Uganda
Oomman, N., Bernstein, M. & Rosenzweig, S. (2007) ‗Following the Funding for HIV/AIDS: A Comparative Analysis of the Funding Practices of PEPFAR, the Global Fund and World Bank MAP in Mozambique, Uganda and Zambia.‘ HIV/AIDS Monitor and Centre for Global Development, October 10th 2007.
OPM (2008) PEAP Evaluation Synthesis.
OPM (2008) PEAP Evaluation: Institutional Arrangements Theme Paper
OPM (2008) PEAP Evaluation: Partnerships Theme Paper
OPM (2008) PEAP Evaluation: Partnerships Theme Paper
OPM (2008) PEAP Evaluation: Political Economy Theme Paper

How Unpredictable Aid Influences Service Delivery
64
Örtendahl (2007) ‗The Uganda Health SWAp: New Approaches for a More Balanced Aid Architecture.‘
Penrose, P., (2008) ‗European Commission budget support programmes: nature, dialogue and design‘, June 2008, European Commission, unpublished.
Regional Forecasts Limited (2007) ‗Northern Uganda Public Expenditure Review (NUPER)‘, Final report for Uganda Multi-Donor Group.
Reinikka, R and Svensson, J, 2003, The power of information: Evidence from a newspaper campaign to reduce capture, Working Paper, IIES, Stockholm University.
Schneider, B. (2006) ‗An Analysis of Donor Flows: Case Study of Uganda.‘ UNU WIDER conference, 2006.
Williamson, T, 2008, ―Putting Aid on Budget: A Case Study of Uganda.‖ A study prepared for the Collaborative Africa Budget Reform Initiative and for the Strategic Partnership with Africa. Mokoro Ltd., Oxford, UK.
Williamson, T., 2009, Correspondence with authors.
Williamson, T., Dom, C. with Booth, D. (2010) ‗Making sector budget support work for service delivery: wider policy implications.‘ Overseas Development Institute Project Briefing Number 38, February 2010.
World Bank (2008) DRAFT UGANDA Focus on Health in the Budget PUBLIC EXPENDITURE REVIEW 2008 CHAPTER 3: GETTING MORE HEALTH FROM THE BUDGET.
World Bank (2009) Fiscal Space for Health in Uganda: Contribution to the 2008 Uganda Public Expenditure Review. The World Bank in collaboration with the Ministry of Finance, Planning, and Economic Development and the Ministry of Health
Yates, R. Et Al (Undated) Health care outputs have doubled in Uganda: What has been the role of health financing reforms?
Yates, Rob, Christine Kirunga Tashobya, Valeria Oliveira Cruz, Barbara McPake, Freddie Ssengooba, Grace Murindwa, Peter Lochoro, Juliet Bataringaya, Hanif Nazerali and Francis Omaswa (2006) The Ugandan health systems reforms: miracle or mirage? In Health Systems Reforms in Uganda: Processes and Outputs. Christine Kirunga Tashobya, Freddie Ssengooba, Valeria Oliveira Cruz (Eds.).

Uganda Country Case Study
65
List of Persons Met
Name Post Organisation
David Kihangire Executive Director Research Bank of Uganda Kenneth Alpha Egesa Balance of Payments Bank of Uganda Adam Mugume Modelling Bank of Uganda Tim Williamson Research Associate ODI Michael Aliyo Economist, Health Sector Desk Officer MFPED Maris Wanyera Commissioner, Macroeconomic Policy
Dept MFPED
Lawrence Kiiza Director Economic Affairs MFPED Margaret Kakande Head – Budget Monitoring and
Accountability Unit MFPED
James Olanya Senior Economist MFPED Juvenal Muhumuza Senior Economist – Aid Liaison
Department MFPED
Ishmael Mweru Magona Commissioner, Infrastructure and Social Services
MFPED
Dr. Possy R. Mugyenyi Programme Manager – Uganda National Expanded Programme on Immunisation
MoH
Dr Robert Basaza Senior Economist, Planning MoH Mr Rogers Enyaku Asst Commissioner Budget & Finance
Division MoH
Sylvester Mubiru Senior Economist Budget and Finance Division, Health Planning Department
Dr. Francis Runumi Mwesigye
Commissioner Health Services (Planning) MoH
Ulrika Hertel First Secretary, Health and HIV/AIDS Advisor
Embassy of Sweden
Wilfired Fiermans Attaché for development Cooperation Embassy of Belgium Elise Ayers Chief, HIV/AIDS, Health and Education
Office USAID
Luc Geysels Health Sector Advisor Belgian Technical Cooperation
Francine Kimanuka Health Specialist UNICEF Primo Madra UNFPA Programme Officer UNFPA Daniel Isooba Infrastructure Expert African Development
Bank Francis Lemoine Attaché, Programme Officer – Economic
Affairs EC
Francis Abwaimo District Health Officer Mbale District Dr. Eddie Mukooyo Assistant Commissioner Health Services
Resource Centre MoH
Herbert Mulira Health Services Resource Centre MoH Florence Kuteesa Former Budget Director, MFPED Independent Consultant Fiona Davies Former Advisor, MFPED UNDP Burundi