how to use this book - princeton...
TRANSCRIPT
AR
TS &
AR
CH
ITEC
TUR
ESC
IEN
CE
& T
ECH
NO
LOG
YR
ELIG
ION
& P
HIL
OSO
PHY
POLI
TIC
S &
EC
ON
OM
Y
AD 200
80 100 120 140 160 180 2001 20 40 60
80 100 120 140 160 180 20020 40 601
7 billion
World Population (approximate)
AD 200
202 million
200 BC 2010
9 Teutoberg Forest
14 Augustus
43
68–69Year of the Four Emperors 116
Trajan122 Hadrian 167–80 Marcomannic Wars
50–75 Kushans
66–73 Zealot revolt
115–17Mesopotamia 132–35 Bar Kochba revolt
10 Kalinga
46–50 Kushans
120–30 *Kushan empire
174–203 Satavahana
2 Chinese census
9–23 Wang Mang
16–66 Kujala Kadphises
48 Xiongnu
166 travellers from Rome
184Yellow Turban peasant revolt
190General Dung Zhuo
50–100 *
Funan
192 *Champa
1–100 * Madagascar
40 *
southern India
40–42Mauretania
100 * Tiwanaku
30 Jesus of Nazareth
1–100 Mithraism
42 *St Peter
47–62 St Paul
70Temple Jerusalem
70–100Gospels
1–100 Mahayana (Great Vehicle) Buddhism
200 *Hindu laws
34–156 * Daoism
58 * Buddhism
64 persecutions of Christians
50 *Watermills 79Pliny the Younger
170 * Galen
200 *Roman road
100 * cast steel
1–100 Stern-mounted rudders83 Magnetic compass
105 * Writing paper 160 * Wheelbarrow132 Earthquake detector
190 *Abacus
1–100 * Polynesia
60 *
steam-powered device 150 *Ptolemy of Alexandria
185 *alchemy
36
Maya calendrical inscriptions
72–80Colosseum
6 * Metamorphoses
27 * Vitruvius
65 *Codices
100–20 * The Twelve Caesars
100–800 * megalithic sculptures
118–25 * Pantheon temple
130 * Gandhara school
68White Horse monastery
100 Chinese dictionary
150 * Pyramid of the Sun 100 *Tacitus
*
180°150°120°90°60°30°0°30°60°90°120°150°
45°
45°
75°
1
2
3
4
5
6
4
5
6
1
2
3
1
2
3
4 5
Aleuts
Dorset Inuit culture
Dorset Inuitculture
Dorset Inuitculture
Dorset Inuitculture
Sub-Arctic caribou hunters
Eastern Woodlandshunter-gatherersGreat Plains
bison hunters
Centralplateau
hunter-fisher-gatherers
West coast fishers,hunters and gatherers
Caribbean fishers,hunters and gatherers
Savanna hunter-gatherers
Pampashunters
Fishers and marinemammal hunters
Sanhunter-
gatherers
Sami
Finno-Ugrians Palaeo-Siberians
Ainu
Australian Aborigines
Tasmanians
Maizefarmers
Maniocfarmers
Savanna cereal farmers and pastoralists
Tropical forestyam farmers
Niloticpastoralists
Ethiopianhighlandfarmers
Cushiticpastoralists
Bantu farmersand pastoralists
Khoikhoipastoralists
Malays
Papuans
1st century AD Melanesians
Micronesians
Tibetan transhumantpastoralistsBerbers
Libyans
Arabs
Samoyedreindeerherders
Tungusicreindeerherders
SarmatiansAlans
Huns
Tuyuhun
Tocharians
Turks
Xiongnu
Khitans Tungus
Nazca
Andeanchiefdoms
Celts
Germanicpeoples
Balts
Finns
Slavs
TaisBurmese
Pyu
Mons
Yayoichiefdoms(Japanese)
TEOTIHUACÁN
ZAPOTECS
MOCHE
COLCHIS
IBERIA
ARMENIA
GARAMANTES
HADRAMAUT
NABATAEA
AXUM
MAGADHA
SAKAKINGDOM
SATAVAHANA
CHOLAS
ANURADHAPURA
KINGDOMS
HINDU
FUNAN(Khmers)
CHAMPA(Chams)
KOGURYO
SILLA
RO
MA
N E M P I R E P A R T H I A N
E M P I R E
K U S H A NE M P I R E
H A NE M P I R E
TIWANAKU
MAYA CITYSTATES
Hopewell burialmound traditions
Basketmakercultures
Desert hunter-gatherers
Rome
Luoyang
Alexandria
Athens Ephesus
Tropic of Cancer
Tropic of Capricorn
Equator
Hunter-gatherers Urbanized societies/kingdoms
Uninhabited
Settled farming culturesand peoples
Pastoral nomads
Complex farming societies/chiefdoms
Empires
Arctic Circle
Polynesians
Poly
nesi
an
s
Nokculture
MEROË HIMYARITEKINGDOM
AD 200the roman and kushan empires reach their greatest extents; decline of the han empire
1. Rome 3. Alexandria 5. Ephesus
4. Athens2. Luoyang (to 190)
Five Largest Cities 000s (approximate)
1,000 420 250 250 250
6
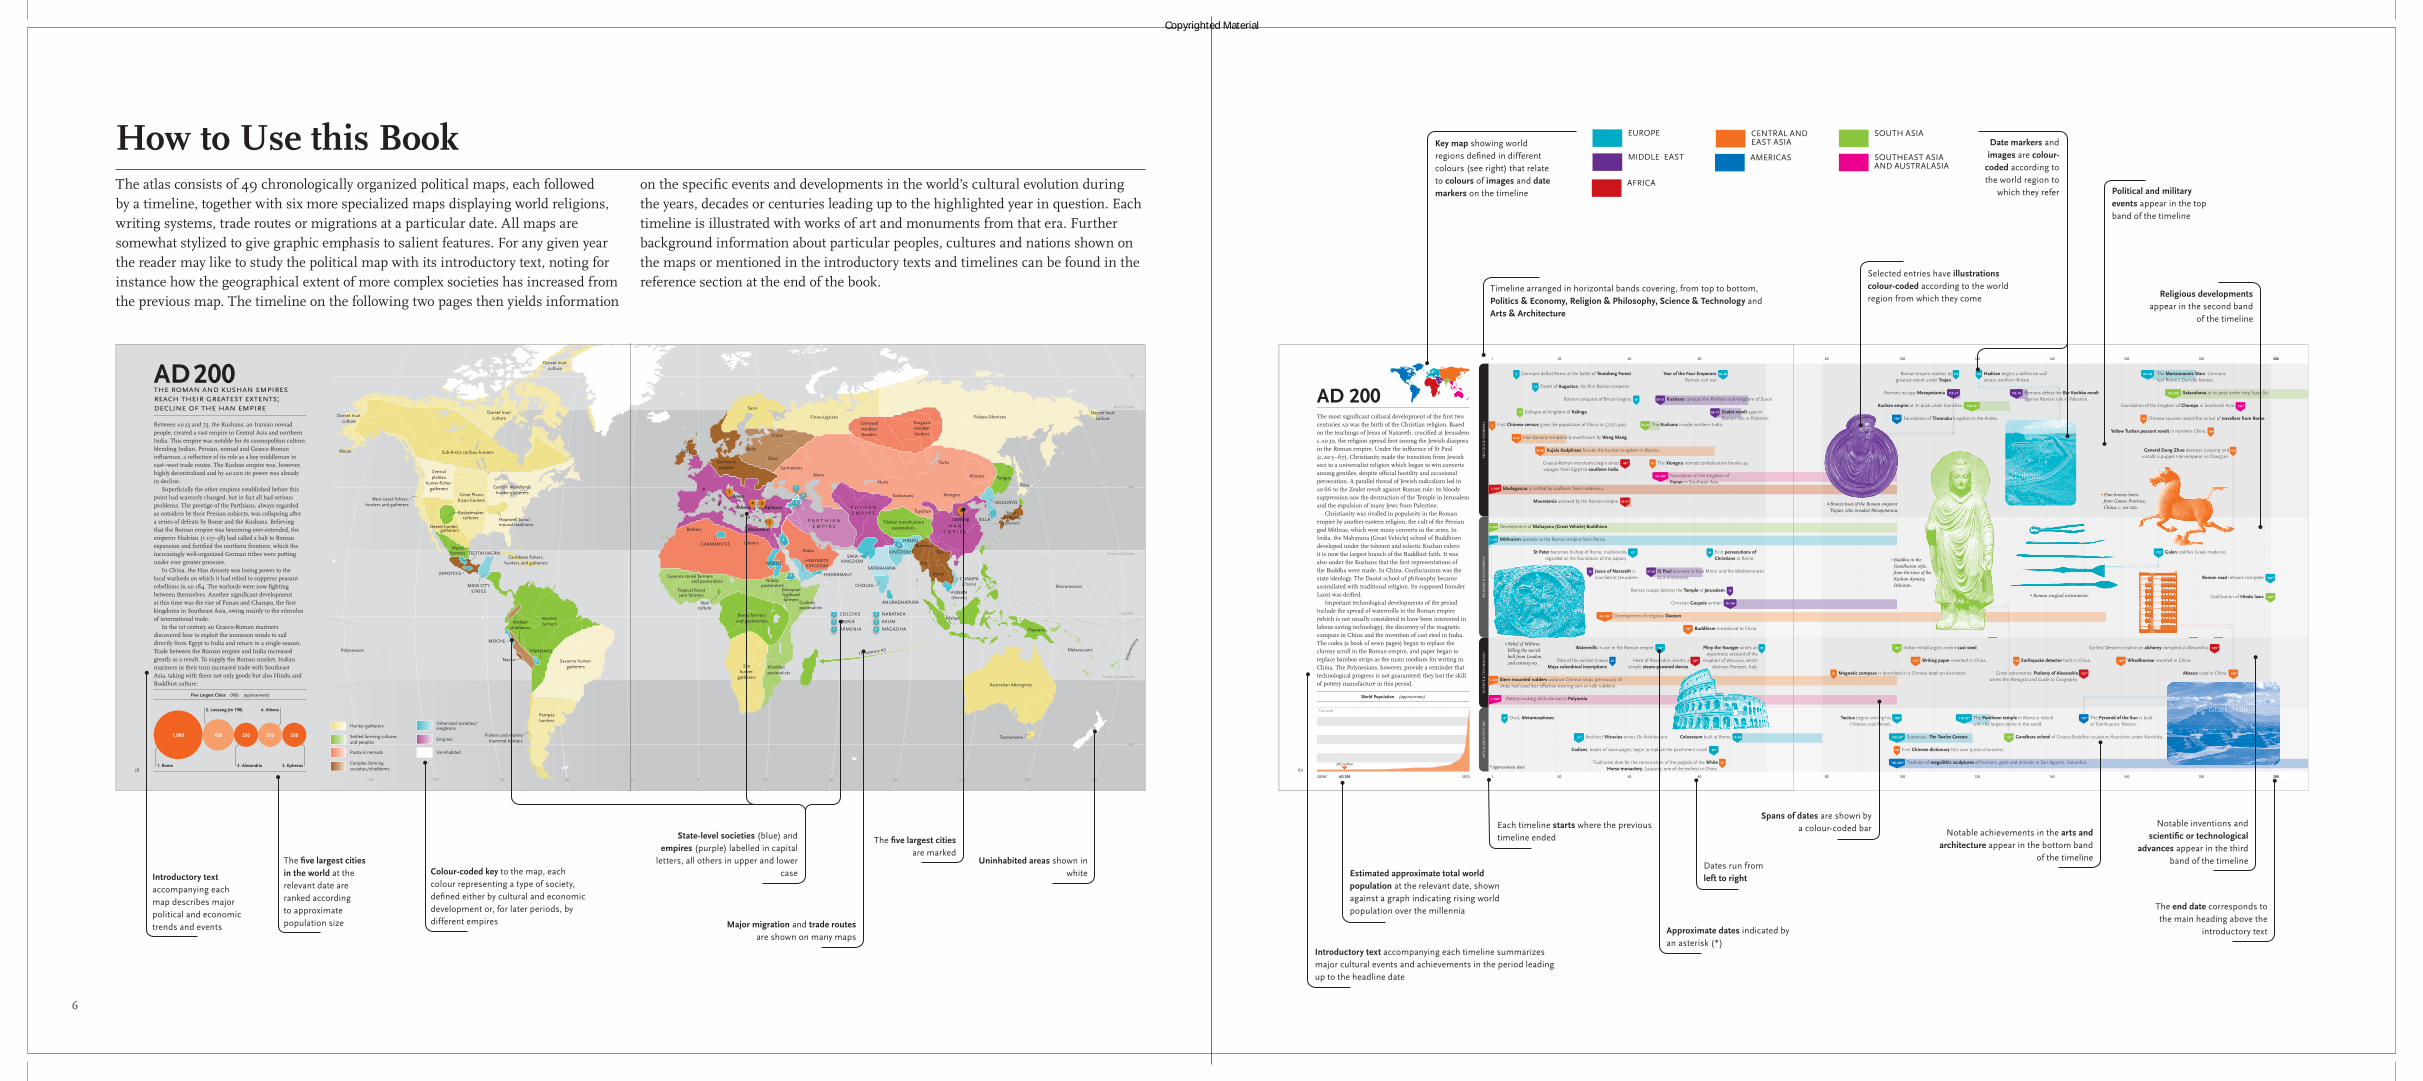
The atlas consists of 49 chronologically organized political maps, each followed by a timeline, together with six more specialized maps displaying world religions, writing systems, trade routes or migrations at a particular date. All maps are somewhat stylized to give graphic emphasis to salient features. For any given year the reader may like to study the political map with its introductory text, noting for instance how the geographical extent of more complex societies has increased from the previous map. The timeline on the following two pages then yields information
on the specific events and developments in the world’s cultural evolution during the years, decades or centuries leading up to the highlighted year in question. Each timeline is illustrated with works of art and monuments from that era. Further background information about particular peoples, cultures and nations shown on the maps or mentioned in the introductory texts and timelines can be found in the reference section at the end of the book.
How to Use this Book
Introductory text accompanying each map describes major political and economic trends and events
The five largest cities in the world at the relevant date are ranked according to approximate population size
Date markers and images are colour-
coded according to the world region to
which they refer
Selected entries have illustrations colour-coded according to the world region from which they come Religious developments
appear in the second band of the timeline
Introductory text accompanying each timeline summarizes major cultural events and achievements in the period leading up to the headline date
Estimated approximate total world population at the relevant date, shown against a graph indicating rising world population over the millennia
Each timeline starts where the previous timeline ended
Approximate dates indicated by an asterisk (*)
Dates run from left to right
State-level societies (blue) and empires (purple) labelled in capital
letters, all others in upper and lower case
The five largest cities are marked
Major migration and trade routes are shown on many maps
Key map showing world regions defined in different colours (see right) that relate to colours of images and date markers on the timeline
Timeline arranged in horizontal bands covering, from top to bottom, Politics & Economy, Religion & Philosophy, Science & Technology and Arts & Architecture
Notable achievements in the arts and architecture appear in the bottom band
of the timeline
The end date corresponds to the main heading above the
introductory text
Spans of dates are shown by a colour-coded bar Notable inventions and
scientific or technological advances appear in the third
band of the timelineUninhabited areas shown in whiteColour-coded key to the map, each
colour representing a type of society, defined either by cultural and economic development or, for later periods, by different empires
Political and military events appear in the top band of the timeline
MIDDLE EAST
EUROPE SOUTH ASIACENTRAL AND EAST ASIA
SOUTHEAST ASIA AND AUSTRALASIA
AMERICAS
AFRICA
Copyrighted Material