how to sellto how to buy. 2 campaign objectives primary objective –to train registered base to...
TRANSCRIPT
How to Sell
How to Buy
2
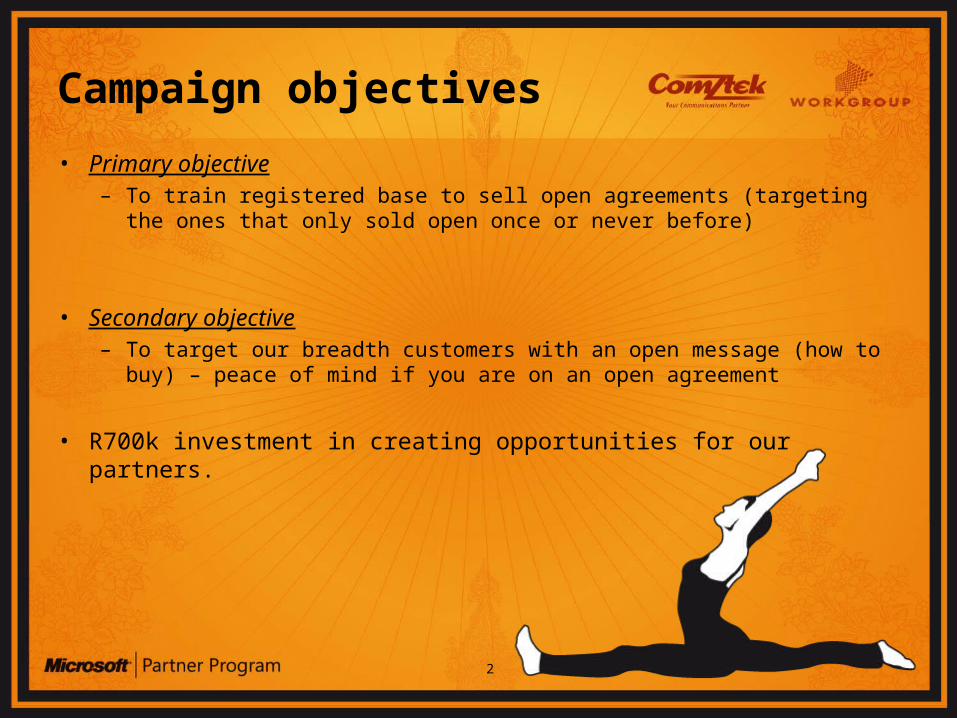
Campaign objectives
• Primary objective– To train registered base to sell open agreements (targeting the ones that
only sold open once or never before)
• Secondary objective– To target our breadth customers with an open message (how to buy) –
peace of mind if you are on an open agreement
• R700k investment in creating opportunities for our partners.
3
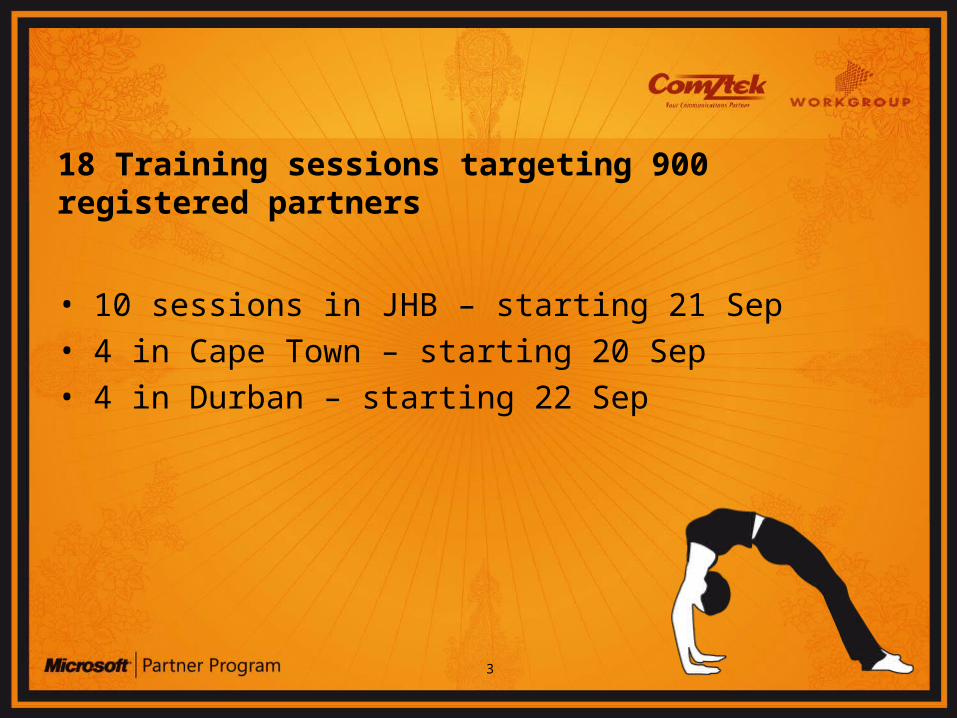
18 Training sessions targeting 900 registered partners
• 10 sessions in JHB – starting 21 Sep• 4 in Cape Town – starting 20 Sep• 4 in Durban – starting 22 Sep
4
5
Agenda• Microsoft Solution Sales Program
– Intro to MSSP
– Do We know our customers?
– Are we selling, pushing or consulting?
• Office 2007 video• Open value selling annuity
– Open broken down
– When to sell what?
• CapEx vs OpEx
• OLP vs OV vs OVS
• Cost per desktop vs value per desktop– The cost of IT
– TCO
• SA benefits overview
6
Microsoft Solution Sales Program: broad overview• Intro to MSSP – Sales Activity• Do we know your products?• Do we know your customers?• Are we selling, pushing or consulting?
• Other Resources• Order Processing• Office System Sales-Tool• Quick Reference Cards-OVS• Quick Reference Cards-SA• Open Fact-Sheet• GOLP• VL Comparison Chart
Resources
7
Office 2007 & Mobility video
The next Silver-Bullet
The other Silver-Bullet
8
Open value selling annuity• Open broken down
– FPP
– OEM/DSP
– Open
• OLP L
• OLP LSA
• OV
• OVS
– Select/EA
• When to sell what?– CapEx vs OpEx
• What is the difference?
– OLP vs OV vs DSP vs OVS
9
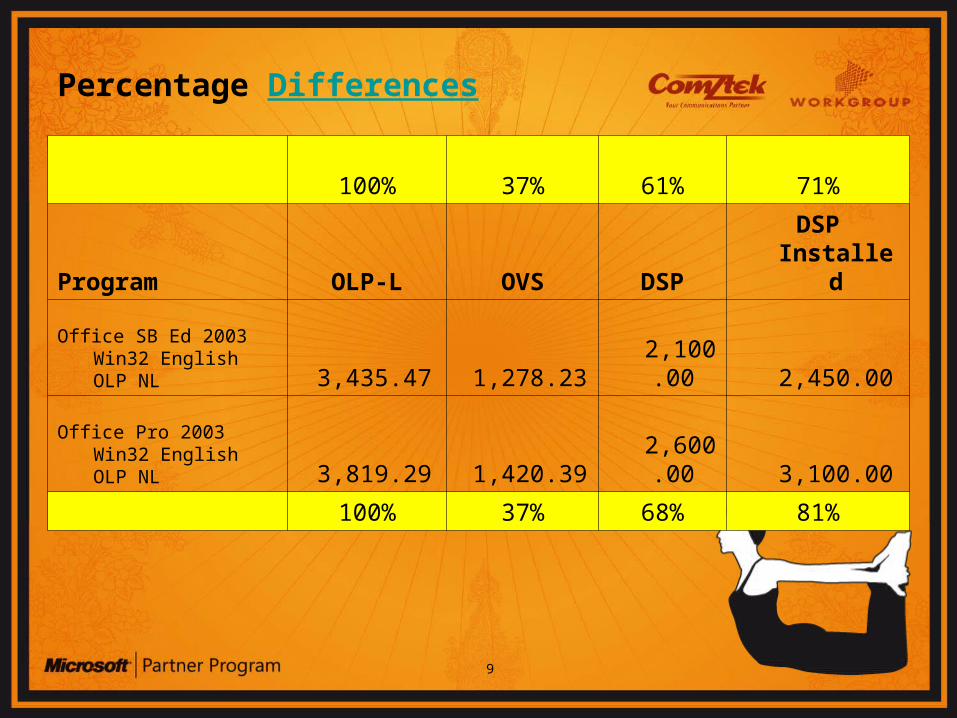
100% 37% 61% 71%
Program OLP-L OVS DSP DSP Installed
Office SB Ed 2003 Win32 English OLP NL 3,435.47 1,278.23 2,100.00 2,450.00
Office Pro 2003 Win32 English OLP NL 3,819.29 1,420.39 2,600.00 3,100.00
100% 37% 68% 81%
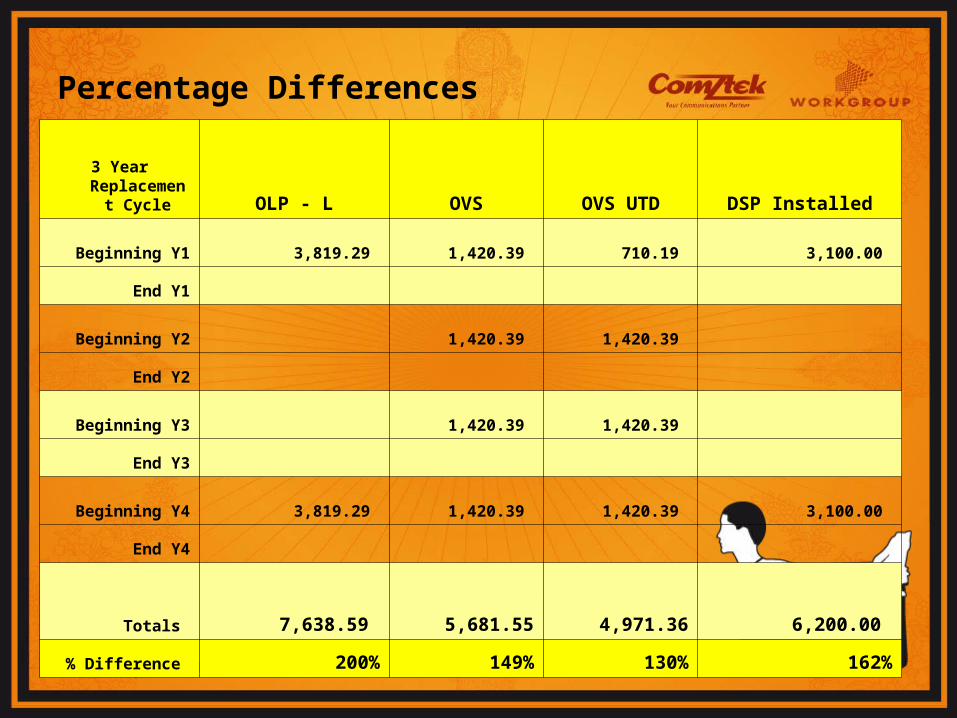
Percentage Differences
10
3 Year Replacement
Cycle OLP - L OVS OVS UTD DSP Installed
Beginning Y1 3,819.29 1,420.39 710.19 3,100.00
End Y1
Beginning Y2 1,420.39 1,420.39
End Y2
Beginning Y3 1,420.39 1,420.39
End Y3
Beginning Y4 3,819.29 1,420.39 1,420.39 3,100.00
End Y4
Totals 7,638.59
5,681.55
4,971.36
6,200.00
% Difference 200% 149% 130% 162%
Percentage Differences
11
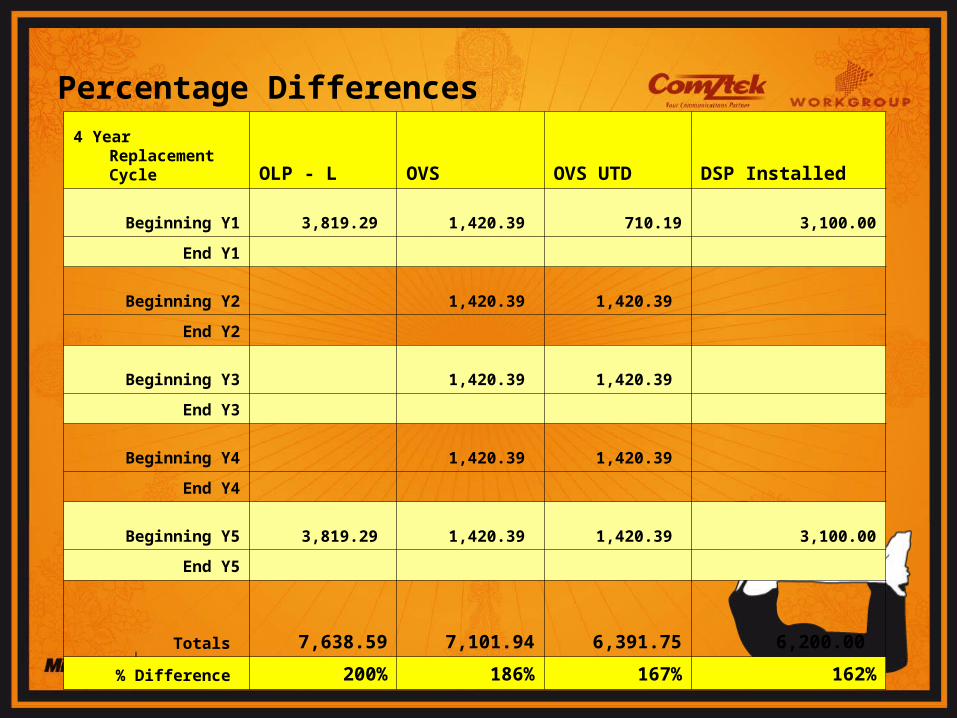
4 Year Replacement Cycle OLP - L OVS OVS UTD DSP Installed
Beginning Y1 3,819.29 1,420.39 710.19 3,100.00
End Y1
Beginning Y2 1,420.39 1,420.39
End Y2
Beginning Y3 1,420.39 1,420.39
End Y3
Beginning Y4 1,420.39 1,420.39
End Y4
Beginning Y5 3,819.29 1,420.39 1,420.39 3,100.00
End Y5
Totals
7,638.59
7,101.94
6,391.75
6,200.00
% Difference 200% 186% 167% 162%
Percentage Differences
12
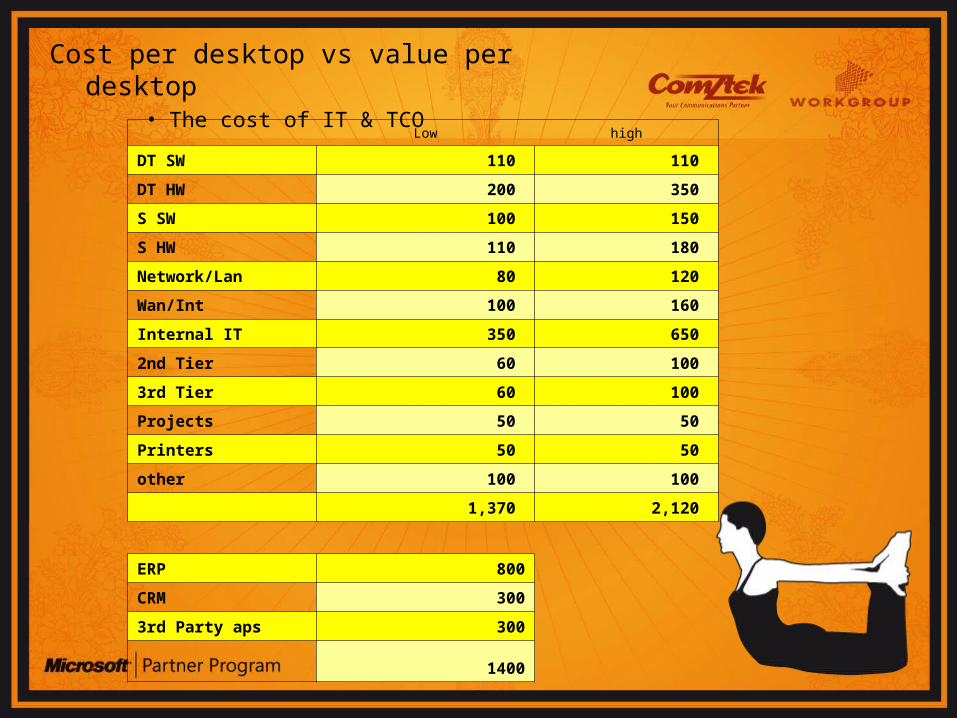
Cost per desktop vs value per desktop• The cost of IT & TCO
Low high
DT SW 110 110
DT HW 200 350
S SW 100 150
S HW 110 180
Network/Lan 80 120
Wan/Int 100 160
Internal IT 350 650
2nd Tier 60 100
3rd Tier 60 100
Projects 50 50
Printers 50 50
other 100 100
1,370 2,120
ERP 800
CRM 300
3rd Party aps 300
1400
13
Software Assurance Benefits - Summary
SA slides
14
Q&A
•Prizes & Evaluation Forms•Promotions
•Disti Contacts