how to reduce - mercury associates€¦ · – reduce unnecessary weight in the vehicle • 100...
TRANSCRIPT


How to Reduce Fleet Costs William Gookin & Scott Conlon Mercury Associates

Ways to Reduce Fleet Costs • Smaller fleet • Reduce Vehicle Miles Traveled (VMT) • Get more miles per gallon • Lower fuel cost • Reduce vehicle lifecycle cost
– Lower acquisition cost – Higher resale
• Lower maintenance cost – Reduce labor cost – Reduce parts cost – Reduce commercial repair cost
• Lower overhead costs (management)
3
Copyright*©*2015*Mercury*Associates,*Inc.*All*Rights*Reserved*

Rating Cost Reduction Strategies
4
Copyright*©*2015*Mercury*Associates,*Inc.*All*Rights*Reserved*

Smaller Fleet
• Estimate $5,000 per vehicle savings (light duty) per year
• Reduce 20 vehicles = $100 thousand per year
• Reduce 100 vehicles = $0.5 million per year
• Reduce 200 vehicles = $1 million per year
5
Copyright*©*2015*Mercury*Associates,*Inc.*All*Rights*Reserved*

How To Reduce Your Fleet?
6
• Fleet Rightsizing • Vehicle Alternative Fuels • Vehicle Right Typing • Must be Vehicle by Vehicle • Must Address 100% of
FAST* Reportable Fleet • Must be Performed
Annually for FMP* Updating
• Results of VAM • Schedule to Achieve
Optimal Fleet Inventory • Plan & Schedule for placing
AFV’s near stations • Vehicle Sourcing – GSA
Lease* vs. Own vs. Commercial Lease
• FMP incorporated into Agency’s SSPP*
Perform VAM Fleet Management Plan* (FMP)
*Pertains to Federal fleets Copyright*©*2015*Mercury*Associates,*Inc.*All*Rights*Reserved*

Reduce Vehicle Miles Traveled
– State of the Art Fleet Management Information System • Lets you track vehicle utilization • Enables you to position vehicles where demand is
highest • Provides opportunities for motor pooling vehicles • Highlights potential opportunities for shuttle/taxi
service • Can assess need for Home-to-Work use
7
Copyright*©*2015*Mercury*Associates,*Inc.*All*Rights*Reserved*

Approaches to Reducing Vehicle Miles Traveled – Reduce Home-to-Work (HTW) – Use Teleconferencing – Use Public Transportation – Improve Routing/Scheduling (use GPS) – Increase Car Pooling
8
Copyright*©*2015*Mercury*Associates,*Inc.*All*Rights*Reserved*
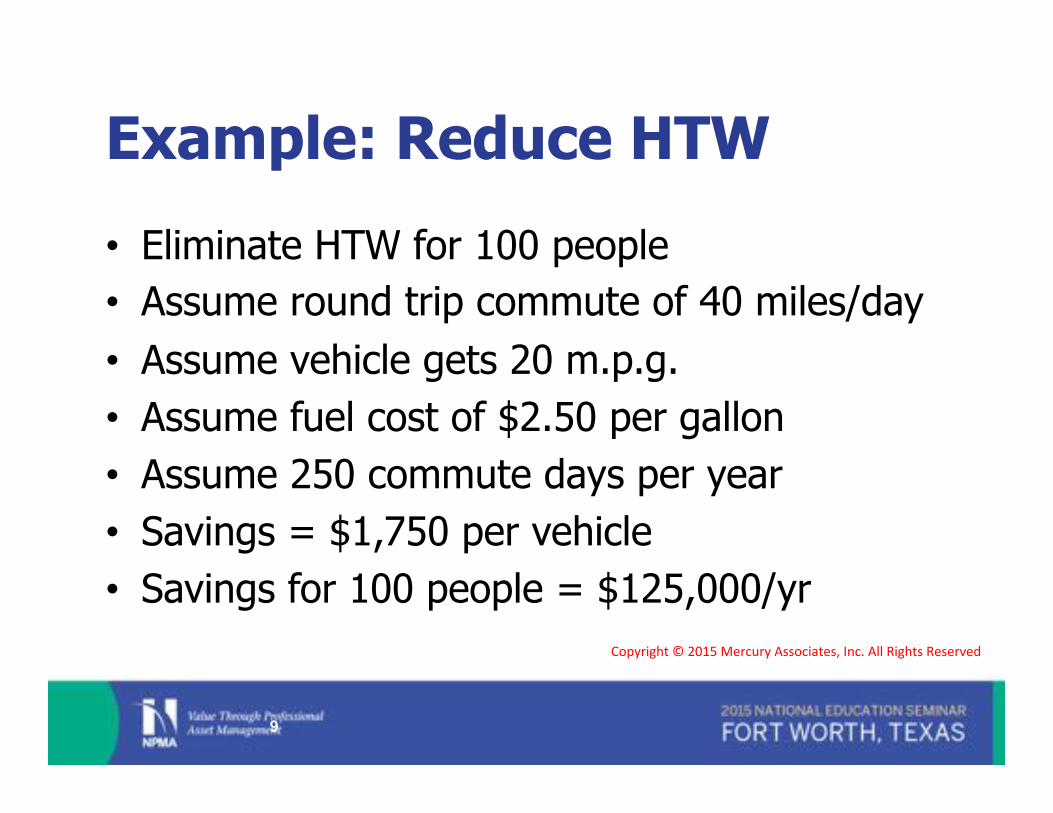
Example: Reduce HTW
• Eliminate HTW for 100 people • Assume round trip commute of 40 miles/day • Assume vehicle gets 20 m.p.g. • Assume fuel cost of $2.50 per gallon • Assume 250 commute days per year • Savings = $1,750 per vehicle • Savings for 100 people = $125,000/yr
9
Copyright*©*2015*Mercury*Associates,*Inc.*All*Rights*Reserved*
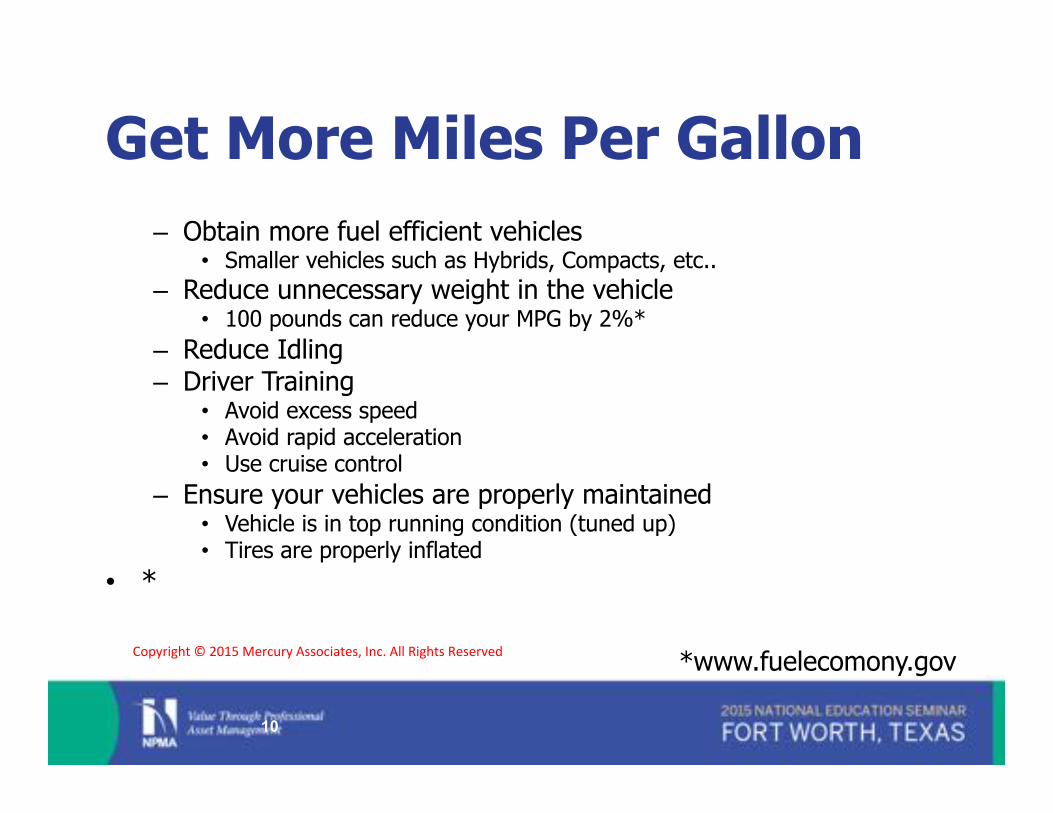
Get More Miles Per Gallon – Obtain more fuel efficient vehicles
• Smaller vehicles such as Hybrids, Compacts, etc.. – Reduce unnecessary weight in the vehicle
• 100 pounds can reduce your MPG by 2%* – Reduce Idling – Driver Training
• Avoid excess speed • Avoid rapid acceleration • Use cruise control
– Ensure your vehicles are properly maintained • Vehicle is in top running condition (tuned up) • Tires are properly inflated
• *
10
*www.fuelecomony.gov Copyright*©*2015*Mercury*Associates,*Inc.*All*Rights*Reserved*

Example: more miles per gallon
– Current fleet: average of 20 m.p.g. @ 10,000 miles per year, $2.50 per gallon = $1,250 per vehicle/yr.
– Future fleet: average of 25 m.p.g. (25% improvement) @ 10,000 miles per year, $2.50 per gallon = $1,000 per vehicle/yr.
– Savings is $250 per vehicle/yr. – Savings for 1,000 vehicle fleet = $250,000/yr.
11
Copyright*©*2015*Mercury*Associates,*Inc.*All*Rights*Reserved*

Lower Fuel Cost
• If possible use on-site fueling capabilities • Ride Share • Use on-site shuttle or taxi service • Use low speed electric vehicles (LSEV) • Right size vehicles for the mission • Establish a motor pool
12
Copyright*©*2015*Mercury*Associates,*Inc.*All*Rights*Reserved*

Example: Lower Fuel Cost
• Current fleet: average of 20 m.p.g. @ 10,000 miles per year, $2.50 per gallon = $1,250 per vehicle/yr
• Future: average of 20 m.p.g. @ 10,000 miles per year, $2.00 per gallon = $1,000 per vehicle/yr
• Savings = $250 per vehicle/yr • Fleet of 1,000 vehicles savings = $250,000
13
Copyright*©*2015*Mercury*Associates,*Inc.*All*Rights*Reserved*

Reduce Vehicle Lifecycle Cost
• GSA* replaces vehicles based upon an optimum life cycle
• Most Agency’s hold on to their vehicles until they fall apart – Old Vehicles = less safety & technology – Increased management cost – Increased maintenance cost – Increased fuel cost – Increased vehicle down time
14
* General Services Administration provides vehicles to Federal fleets Copyright*©*2015*Mercury*Associates,*Inc.*All*Rights*Reserved*

Reduce Vehicle Lifecycle Cost, Cont.
• Fewer vehicle safety features • Reduced employee and public safety • Decrease in employee morale • May cause employees to have less focus on
operator maintenance • Decreased residual value on resale • Fleet size may be larger to ensure backup vehicles
are available
15
Copyright*©*2015*Mercury*Associates,*Inc.*All*Rights*Reserved*

Lifecycle Cost Analysis
16
Capital, Operating, and Total Cost Trend Lines
Replacement Cycle (years) Copyright*©*2015*Mercury*Associates,*Inc.*All*Rights*Reserved*

Depreciation & Life Cycle Costs
17
A 7-yr cycle is cheaper than a 5-yr cycle
...and cheaper than a 9-yr cycle too Copyright*©*2015*Mercury*Associates,*Inc.*All*Rights*Reserved*

Cost Savings Optimized Replacement Cycle • Replace at 7 years vs. 10 years • Savings = $3,000 per vehicle per year • At 7 years, total savings per vehicle =
$21,000 • Fleet of 100 trucks would save $2,100,000
over 7 years ($300K per year)
18
Copyright*©*2015*Mercury*Associates,*Inc.*All*Rights*Reserved*
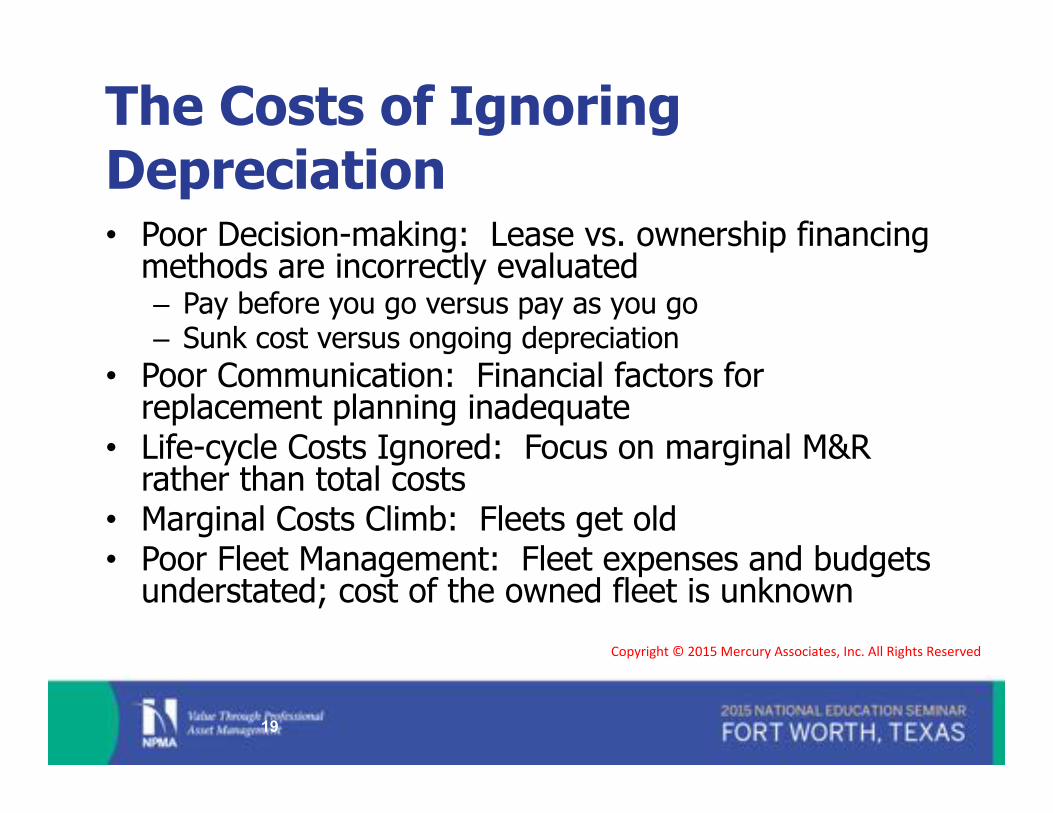
The Costs of Ignoring Depreciation • Poor Decision-making: Lease vs. ownership financing
methods are incorrectly evaluated – Pay before you go versus pay as you go – Sunk cost versus ongoing depreciation
• Poor Communication: Financial factors for replacement planning inadequate
• Life-cycle Costs Ignored: Focus on marginal M&R rather than total costs
• Marginal Costs Climb: Fleets get old • Poor Fleet Management: Fleet expenses and budgets
understated; cost of the owned fleet is unknown
19
Copyright*©*2015*Mercury*Associates,*Inc.*All*Rights*Reserved*

Consequences of Ineffective Replacement Practices – Maintenance costs climb – Resale (residual) value declines – Older units use more fuel – Older units pollute more – Vehicle condition (and safety) declines with age,
not just miles (technological obsolescence) – Downtime increases which makes fleet users less
productive – Users avoid older units leading to lower usage,
compared with newer units
20
Copyright*©*2015*Mercury*Associates,*Inc.*All*Rights*Reserved*

Residual Value
0%
20%
40%
60%
80%
100%
0 5 10 15 20 25 30 35 40
Res
idua
l Val
ue
Years
21
Residual Value is the projected market value of the asset at the end of its useful life (or at any time during its life). Copyright*©*2015*Mercury*Associates,*Inc.*All*Rights*Reserved*

Lower Maintenance Costs
– Perform preventative maintenance – Provide training to vehicle operators – Ensure maintenance personnel are properly
trained – Replace vehicles at the end of their lifecycle – Have a Fleet Management Information System
22
Copyright*©*2015*Mercury*Associates,*Inc.*All*Rights*Reserved*

Lower Maintenance Costs
– Enables the fleet manager to track which vehicles may require more maintenance than others
– Reduce Maintenance Cost per Mile from 18₵ per mile to 15₵ per mile
– Average fleet mileage = 10,000 miles per year – Savings of $300 per year per vehicle – For 1,000 vehicle fleet, total savings of
$300,000 per year
23
Copyright*©*2015*Mercury*Associates,*Inc.*All*Rights*Reserved*

Lower Overhead Costs • Consolidate fleet management operations • Reduce size of the fleet • Use GSA leasing • Develop a lifecycle model for replacement of
vehicles • Ensure fleet managers, operators are trained • Acquire a Fleet Management Information System
(GSA FMIS free) • Reduce 1 fleet management position • Cost savings (with benefits) = $130,000
24
Copyright*©*2015*Mercury*Associates,*Inc.*All*Rights*Reserved*

Cost Savings for 1,000 Vehicle Fleet Strategy Annual Savings Potential
Reduce Fleet by 100 vehicles $500,000 High
Eliminate HTW by 100 vehicles $125,000 Moderate
Improve m.p.g. by 25% $250,000 Moderate
Lower fuel cost from $2.50 to $2.00 per gallon
$250,000 Low
Reduce vehicle lifecycle cost on 100 vehicles
$300,000 Moderate
Lower maintenance cost $300,000 Moderate
Lower overhead costs $130,000 Moderate
25
Copyright*©*2015*Mercury*Associates,*Inc.*All*Rights*Reserved*

MERCURY ASSOCIATES, INC. “Specializing in the science of fleet management.”
William Gookin Director, Federal Fleet Consulting [email protected] Cell (540-809-3792) Scott Conlon Sr. Consultant, Federal Fleet Consulting [email protected] Cell (301-275-4799)
26
Copyright*©*2015*Mercury*Associates,*Inc.*All*Rights*Reserved*