how to pinpoint energy-inefficient buildings? an approach ... · how to pinpoint energy-inefficient...
TRANSCRIPT

HOW TO PINPOINT ENERGY-INEFFICIENT BUILDINGS?
AN APPROACH BASED ON THE 3D CITY MODEL OF VIENNA
B. Skarbal a, J. Peters-Anders a, A. Faizan Malik b, G. Agugiaro a, *
a Austrian Institute of Technology, Smart Citites and Regions Research Field, Giefinggasse 2, 1210 Vienna, Austria
{bernhard.skarbal, jan.peters-anders, giorgio.agugiaro}@ait.ac.at b Vienna University of Economics and Business, Institute for Economic Geography and GIScienceInstitute (WU Wien),
Welthandelsplatz 1, 1020 Vienna, Austria
Commission IV, WG IV/10
KEY WORDS: CityGML, 3D city modelling, Urban Energy Modelling, 3D Visualisation, Energy Performance of Buildings
ABSTRACT:
This paper describes a methodology to assess the energy performance of residential buildings starting from the semantic 3D city
model of Vienna. Space heating, domestic hot water and electricity demand are taken into account.
The paper deals with aspects related to urban data modelling, with particular attention to the energy-related topics, and with issues
related to interactive data exploration/visualisation and management from a plugin-free web-browser, e.g. based on Cesium, a
WebGL virtual globe and map engine.
While providing references to existing previous works, only some general and introductory information is given about the data
collection, harmonisation and integration process necessary to create the CityGML-based 3D city model, which serves as the central
information hub for the different applications developed and described more in detail in this paper.
The work aims, among the rest, at developing urban decision making and operational optimisation software tools to minimise non-
renewable energy use in cities.
The results obtained so far, as well as some comments about their quality and limitations, are presented, together with the discussion
regarding the next steps and some planned improvements.
* Corresponding author
1. INTRODUCTION
Cities are confronted today with a number of challenges due, on
one hand, to the global phenomenon of growing urbanisation
and, on the other hand, to the continuously increasing demand
of resources required, for example, by higher living standards.
To this extent, energy is one of the most crucial resources cities
need to deal with, and at city level there is a general struggle
nowadays to increase the overall efficiency, reduce the energy
consumption per capita, and as a direct consequence, the
emissions of CO2 and other greenhouse gases.
The European Union, for example, is aiming for a 27% cut in
Europe's annual primary energy consumption by 2030. Some
measures to reduce the energy consumption focus particularly
on the building sector, as buildings alone consume circa 40% of
the total energy, of which about 68% is used by households,
mainly for space heating, cooling, domestic hot water
preparation, cooking and appliances.
Urban energy planning is however a difficult task, as it needs to
find answers to a number of complex questions. At building
level, for example, some open questions are a) where are
inefficient buildings? b) how to increase their efficiency (e.g. by
refurbishment) c) how to evaluate the impact of these measures?
However, changing the scale from the single building to the
block/district and up to the city level, a number of other
questions arise, such as: d) how to evaluate the energy
performance of a block or a district? e) how is the energy
demand going to change in the near and mid-term future in a
block or district? f) what is going to happen to current and
future energy distribution networks as the energy demand
changes over time?
Answering these questions requires a deep understanding of the
complex system interdependencies at urban level, as it plays a
crucial role to have a comprehensive knowledge of the demand
and supply of energy resources, including their (multi-scale)
spatial characteristics and distribution within urban areas.
This is indeed one of the goals of the European Marie-Curie
ITN project “CI-NERGY, Smart cities with sustainable energy
systems” [CI-NERGY], which aims, among the rest, at
developing urban decision making and operational optimisation
software tools to minimise non-renewable energy use in cities.
As case studies, the project involves the municipalities of
Geneva and Vienna, which were chosen for their very ambitious
sustainability goals. Although this paper focuses on Vienna, CI-
NERGY-related information about the other case study city
Geneva can be found in (Agugiaro et al. 2017), also published
in the proceedings of this conference.
In Vienna, the adoption in 2014 of the Smart City Wien
framework strategy [SC-W], which builds upon and extends the
previous Urban Energy Efficiency Programme [SEP-W],
represents a great step towards sustainable energy supply
through resource conservation and intelligent use of resources.
The strategy defines energy-relevant targets for different areas,
such as efficient energy use, renewable energy sources,
infrastructure, mobility, and buildings. One of the overall goals
is to decrease the final energy consumption per capita in Vienna
by 40% by 2050 (compared to 2005) and, at the same time, the
per-capita primary energy input should drop from 3000 to 2000
Watt, i.e. to 48 kWh per day, as envisioned by the so-called
2000-W-society.
More specifically, on the building sector comprehensive
refurbishment activities are planned to reduce the energy
ISPRS Annals of the Photogrammetry, Remote Sensing and Spatial Information Sciences, Volume IV-4/W3, 2017 2nd International Conference on Smart Data and Smart Cities, 4–6 October 2017, Puebla, Mexico
This contribution has been peer-reviewed. The double-blind peer-review was conducted on the basis of the full paper. https://doi.org/10.5194/isprs-annals-IV-4-W3-71-2017 | © Authors 2017. CC BY 4.0 License.
71

consumption of existing buildings for space heating, cooling
and domestic hot water preparation by one percent per capita
and year. This is coupled with cost-optimised zero-energy
building standards for all new structures, additions and
refurbishments from 2018/2020 and further development of
heat supply systems.
The relevance of the above mentioned goals can be better
understood if one considers the following figures regarding the
building stock in Vienna: in 2011 there were approximately
165000 buildings in Vienna, of which 149000 were of
residential type, while the rest served for service,
industrial/commercial or other purposes. Due to demographic
change and the related population growth, it is estimated that
approximately 120000 new dwellings will have to be
constructed by 2025.
This paper describes a methodology to estimate the energy
performance of residential buildings starting from a semantic
3D city model. Once the estimation is carried out, the most
energy-inefficient buildings can be spatially identified, and a
number of refurbishment scenarios can be computed depending
on the data available about the specific building and the energy
resources (e.g. photovoltaic, geothermal, etc.) The adoption of a
3D visualisation interface, as well as the possibility to query
data and results at building level directly in the web-based 3D
environment greatly improve the effectiveness in exploring,
communicating, and (optionally) publishing the results.
The adoption of semantic 3D city models as an information hub
for different application domains is relatively new in the GIS
community, one of the reasons being the steady but “slow”
development of proper IT tools (standard data models, database
and editing tools, etc.). Nevertheless, a number of applications
already exist and range from urban planning, noise mapping,
augmented reality, utility network management to energy
simulation tools. When it comes to energy, Carrión et al. (2010)
and Strzalka et al. (2011) have proposed algorithms to estimate
space heating energy demand of buildings. A city-wide energy
atlas, focussing on energy demand for residential buildings, was
created within the project “Energy Atlas Berlin” (Krüger and
Kolbe, 2012; Kaden and Kolbe, 2013). Other conceptually
similar examples exist for the cities of Stuttgart, Hamburg,
Karlsruhe, Ludwigsburg in Germany, Lyon in France,
Rotterdam in the Netherlands, and Trento in Italy (Nouvel et al.,
2013; Bahu et al., 2013; Nouvel et al., 2015b; Agugiaro,
2016a). Given the growing relevance of the topic, several
research groups are focussing on a number of different topics:
for example, Molien et al. (2017) compare building modelling
assumptions and methods for urban-scale heat-demand
forecasting, Romero Rodríguez et al. (2017) focus on the
assessment of the photovoltaic potential at urban level based on
3D city models, while Biljecki et al. (2017) deal with the
generation of 3D city models without elevation data. For more
information, a state-of-the-art and up-to-date review of different
applications of 3D city models, including energy, can be found
in Biljecki et al. (2015).
In the case of Austria, and to the authors’ knowledge, there are
however no other examples of adoption of a semantic 3D city
model for energy-related applications other than the one
described in this – and previous, however tightly related –
papers regarding Vienna (Agugiaro, 2016b; Agugiaro, 2016c).
If, on one hand, the computation of the energy demand is
conceptually comparable to the existing approaches mentioned
above, this paper nevertheless also presents some data
visualisation and exploration tools and describes work carried
out to extend otherwise out-of-the-box missing functionalities.
The paper is structured as follows: section 2 briefly describes
the test area, the data sources, and the 3D model used in this
work, section 3 focuses on the implemented algorithms to
compute the energy demand of the residential buildings, section
4 deals with web-based 3D visualisation, data exploration and
management, and section 5 contains the conclusions and the
discussion regarding the next steps and some planned
improvements.
2. TEST AREA AND DATA SOURCES
2.1 Test area
The 12th district of Vienna (Meidling) was chosen as test area
thanks to its heterogeneity in shape, structure and characteristics
(Figure 1). Meidling spans an area of approximately 8.2 km2
and it lies just 5-7 km southwest of the city centre. Counting
circa 90000 inhabitants (i.e. circa 11000 inhabitants/km2), it is a
heavily populated urban area with many residential buildings of
greatly varying size and typology, but also with large
recreational areas and parks. It can be approximately divided
into two main parts: the north-eastern one is characterised by a
heavily developed urban residential texture, while the south-
western one is a more mixed (industrial and light residential)
area, which then gradually continues southwards. In Meidling
there are circa 7400 buildings, of which approximately 5600 are
residential or mixed-residential ones.
Figure 1. Boundaries of Vienna (in white) and extents of the
district of Meidling (in yellow). Image source: Google Earth
2.2 The 3D city model
Starting from 2015, a large number of datasets (both spatial and
non-spatial) were collected for the whole city of Vienna, mainly
from the already available Open Government Data Wien
catalogue [OGD-W], or were provided by the Municipality of
Vienna for the purposes of the CI-NERGY project.
Many of them were harmonised and integrated in order to
generate the semantic 3D city model according to the CityGML
Open Geospatial Consortium’s [OGC] standard. However,
giving a detailed description of all the steps required to obtain
the 3D city model is far beyond the scope of this paper. Further
details can be found in Agugiaro (2016b) about the most
relevant data integration issues, and in Agugiaro (2016c)
regarding the extension of the CityGML data model by means
of the Energy Application Domain Extension (ADE), in order to
specifically enhance and extend the urban data model to
accommodate energy-specific data. Further information about
ISPRS Annals of the Photogrammetry, Remote Sensing and Spatial Information Sciences, Volume IV-4/W3, 2017 2nd International Conference on Smart Data and Smart Cities, 4–6 October 2017, Puebla, Mexico
This contribution has been peer-reviewed. The double-blind peer-review was conducted on the basis of the full paper. https://doi.org/10.5194/isprs-annals-IV-4-W3-71-2017 | © Authors 2017. CC BY 4.0 License.
72

the CityGML Energy ADE can be found in Nouvel et al.
(2015a) or in Benner et al. (2016) [ENERGY-ADE].
What follows is a short description of the main characteristics
of the 3D city model, the data it contains, both in terms of
geometries and “normal” attributes.
The 3D city model contains buildings modelled in LoD0, LoD1
and LoD2. Buildings are modelled either as multi-part objects,
i.e. as a composition of CityGML BuildingParts, or as simple
single-part objects. For some buildings, architectonical elements
like “flying roofs” are added as Building Installations in LoD2.
With the 3D city model, following attributes are available for
each building:
Name and address(es) of the building
Building class, function and usage;
Year of construction;
Number of storeys above and below ground;
Roof type;
Building height.
Thanks to the Energy ADE, numerous other attributes and
features were integrated into the 3D city model, such as:
Gross volume (both for LoD1 and LoD2 geometries);
Footprint area;
Lowest rain gutter height, ridge height of the roof;
Presence and type (conditioned or not) of the attic floor;
Sum of all net floor areas, and building usages according to
the Vienna buildings’ database (AGWR, Adress-, Gebäude-
und Wohnungsregister);
Presence and characteristics of installed thermal and solar
panels;
Monthly and yearly values of global solar irradiance on the
roof surfaces, and the corresponding values in terms of
potential yield for photovoltaic and solar panel installations;
Suitability of the roof surfaces for installation of solar
systems;
Classification of the residential buildings into four
typologies: single-family house, terraced house, multi-
family house, and apartment block (e.g. as commonly used
in the project Tabula [TABULA];
Information about the type of energy supply (gas, district
heating, other, unknown).
Due to the strong heterogeneity of the input data in terms of
completeness and accuracy, a series of automatic, semi-
automatic and manual checks (the latter only in the area in
Meidling) were carried out to reduce gross errors and further
increase the overall data quality.
Moreover, in order to facilitate data exploration and analysis, all
datasets were imported into a PostgreSQL 9.4 database with the
PostGIS 2.2 extension. For the CityGML 3D city model, the
free and open source 3DCityDB implementation for
PostgreSQL was adopted [3DCityDB]. As a consequence, all
data are stored in the same spatially enabled database, either as
CityGML-compliant data, or as “normal” database tables.
For visualisation purposes, the 3D city model is available both
for Google Earth in kmz format (Figure 2), and for the Cesium-
based 3DCityDB-Webmap-Client (Figure 3).
Figure 2. Example of visualisation of the 3D city model in
Google Earth: thematic data for each building can be accessed
in the balloon
Figure 3. Example of web-based 3D visualisation of the 3D city model in Cesium. Thematic data for each building is retrieved by
clicking on it
ISPRS Annals of the Photogrammetry, Remote Sensing and Spatial Information Sciences, Volume IV-4/W3, 2017 2nd International Conference on Smart Data and Smart Cities, 4–6 October 2017, Puebla, Mexico
This contribution has been peer-reviewed. The double-blind peer-review was conducted on the basis of the full paper. https://doi.org/10.5194/isprs-annals-IV-4-W3-71-2017 | © Authors 2017. CC BY 4.0 License.
73

3. COMPUTATION OF ENERGY DEMAND FOR
RESIDENTIAL BUILDINGS
In order to compute the energy demand, all buildings had to be
characterised by more specific attributes. For each building, the
surface area, the azimuth and the inclination angles of the wall,
ground and roof surfaces were calculated. The azimuth angles
were then classified in the eight main and secondary cardinal
directions (N, S, W, E, NE, NW, SE, SW). All shared walls
between adjacent buildings were identified, calculated and
classified. For each polygon resulting from the 3D intersection,
the area was calculated and an assignment to adiabatic or non-
adiabatic class was performed. Due to the Energy ADE, all the
calculated geometries could be added to the 3D city model as
ThermalBoundary objects and saved with the model. In
addition, all buildings were classified according to their year of
construction. For all residential buildings, the classification was
further used to characterize them by physical parameters (e.g.
U- and g-values) taken from existing parameter libraries,
including the guideline 6 on energy performance behaviour of
buildings from the Austrian Institute of Construction
Engineering [OIB]. It should be mentioned here that in this
work all buildings with a net floor area equal to or greater than
60% of the total net floor area of the building were treated as
residential buildings. Non-residential buildings were not
included in the following steps.
After all residential buildings were characterized with the
necessary attributes, the heating energy demand was calculated.
The heating energy demand is the most common energy
characteristic and describes the amount of heat that must be
supplied to the conditioned rooms in order to maintain their
predetermined set temperature. The basis of the calculations
was the Austrian norm ÖNORM B 8110-6. In addition to the
available data from the CityGML model, further assumptions
were, which are explained in the following.
The climatic data were used in accordance with the Austrian
norm ÖNORM B 8110-5. The test area Meidling is located
in the moderate climatic zone North Region (N). The
assumed sea level is 156.68 m, which is equivalent to the
lowest sea level of Vienna. The assumed heating season for
this region ranges from October to April;
Due to the lack of detailed information about the internal
structure, each building was modelled as a single thermal
zone, with the usage profile for residential buildings
according to ÖNORM B 8110-5;
Due to the lack of explicit geometric information about the
windows in the LoD2 model, a heuristic window-to-wall
ratio of 28% for the outer facades was assumed to calculate
the glazed surface area of the outer facade;
The gross floor area of the buildings as a reference area for
the calculation of the specific heating energy demand in
kWh/(m²·a) was determined in two different ways:
Directly through the net floor area according to AGWR and
conversion to the gross floor area by the factor 1.25;
Estimation of the gross floor area using the LoD2 gross
volume and an estimated average storey height of 3.5 m in
reference to Bretschneider et al. (2002).
While the heating energy demand provides information on the
thermal quality of a building, the type of energy supply and user
behaviour must also be taken into account when determining
the final energy demand that needs to be delivered to the
building.
For the majority of the buildings, information about whether
they are heated with natural gas or district heating is known. For
the remaining residential buildings, a supply of natural gas is
assumed in a first approach. Starting from the heating demand
and the heat demand for domestic hot water (DHW) production,
the respective final energy requirement values were determined
by means of the energy expenditure numbers differentiated
according to energy carriers. Taking into account the household
electricity demand, the primary energy demand (non-renewable,
renewable, total), as well as the CO2 emissions resulting from
the energy input were calculated using the primary energy
factors and CO2 emission factors for each energy carrier
according to the guideline 6 on energy saving and heat
insulation of buildings from the Austrian Institute of
Construction Engineering. The energy-related results are not
only available as a year sum but also as monthly values. This
allows for the presentation of the energy values over the course
of the year and a differentiation into the winter season (showing
the effect of the building envelope refurbishment and the low
yield through photovoltaics and solar thermal energy) and the
summer season (high supply of renewables by photovoltaics and
solar thermal energy) as well as the comparison of demand and
decentralized generation (e.g. coverage of DHW demand by
solar thermal energy over the summer months) and the resulting
reduction in CO2 emissions.
Using this approach, four other scenarios were calculated in
addition to the baseline scenario (status quo). The scenarios
deal with the refurbishment of the building envelope, increase
of renewables (e.g. by photovoltaics, solar thermal energy), as
well as mixed forms (refurbishment of the building envelope in
combination with roof-mounted photovoltaics). In order to use
economically viable solar-thermal systems for the scenario, an
annual solar coverage of 50-60% for domestic hot water in
single family homes and 30-40% in residential buildings was
used, with up to 100% coverage of the hot water demand in
summer. For the photovoltaic scenario, the appropriate roof
areas were taken into account according to the solar cadastre.
Moreover, results at building level were aggregated at building
block level, in order to offer a generalised view of the overall
energy performance of a block.
Examples of different visualisation techniques to explore the
results are presented in the following figures (Figure 4 to Figure
7). Please refer to section 4 for more details about the different
visualisation tools.
Figure 4. The Google Earth balloon contains information about
the monthly heating energy demand for the original state and a
refurbishment scenario, as well as data about energy demand for
space heating, domestic hot water (DHW) production, CO2
emissions, and the corresponding energy performance class
ISPRS Annals of the Photogrammetry, Remote Sensing and Spatial Information Sciences, Volume IV-4/W3, 2017 2nd International Conference on Smart Data and Smart Cities, 4–6 October 2017, Puebla, Mexico
This contribution has been peer-reviewed. The double-blind peer-review was conducted on the basis of the full paper. https://doi.org/10.5194/isprs-annals-IV-4-W3-71-2017 | © Authors 2017. CC BY 4.0 License.
74

Figure 5. [Top] 3D visualisation of the energy performance class (in terms of annual area-specific primary energy demand) of all
residential buildings in the 12th district of Vienna (baseline scenario). The colours correspond to the classes provided for in the
Guideline 6 of the Austrian Institute of Construction Engineering. Buildings in grey are not residential. [Bottom] Detail view of area-
specific primary energy demand in two refurbishment scenarios. Left: Scenario 1 – thermal insulation of the building envelope.
Right: Scenario 2 – thermal insulation of the building envelope in combination with roof-mounted photovoltaics
Figure 6. Example of hybrid (multi-scale) representation of the energy performance class of buildings and building blocks. The user
can select among different scenarios in the upper-left drop-down menu and query buildings and blocks for thematic data
ISPRS Annals of the Photogrammetry, Remote Sensing and Spatial Information Sciences, Volume IV-4/W3, 2017 2nd International Conference on Smart Data and Smart Cities, 4–6 October 2017, Puebla, Mexico
This contribution has been peer-reviewed. The double-blind peer-review was conducted on the basis of the full paper. https://doi.org/10.5194/isprs-annals-IV-4-W3-71-2017 | © Authors 2017. CC BY 4.0 License.
75
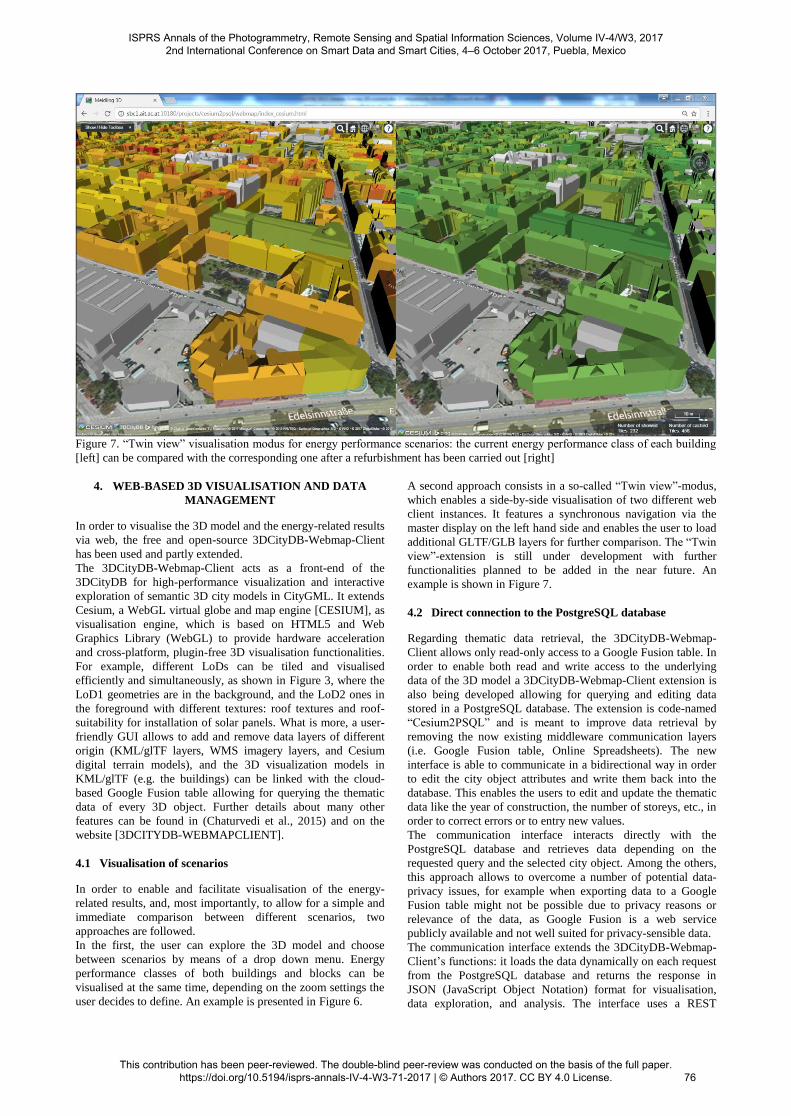
Figure 7. “Twin view” visualisation modus for energy performance scenarios: the current energy performance class of each building
[left] can be compared with the corresponding one after a refurbishment has been carried out [right]
4. WEB-BASED 3D VISUALISATION AND DATA
MANAGEMENT
In order to visualise the 3D model and the energy-related results
via web, the free and open-source 3DCityDB-Webmap-Client
has been used and partly extended.
The 3DCityDB-Webmap-Client acts as a front-end of the
3DCityDB for high-performance visualization and interactive
exploration of semantic 3D city models in CityGML. It extends
Cesium, a WebGL virtual globe and map engine [CESIUM], as
visualisation engine, which is based on HTML5 and Web
Graphics Library (WebGL) to provide hardware acceleration
and cross-platform, plugin-free 3D visualisation functionalities.
For example, different LoDs can be tiled and visualised
efficiently and simultaneously, as shown in Figure 3, where the
LoD1 geometries are in the background, and the LoD2 ones in
the foreground with different textures: roof textures and roof-
suitability for installation of solar panels. What is more, a user-
friendly GUI allows to add and remove data layers of different
origin (KML/glTF layers, WMS imagery layers, and Cesium
digital terrain models), and the 3D visualization models in
KML/glTF (e.g. the buildings) can be linked with the cloud-
based Google Fusion table allowing for querying the thematic
data of every 3D object. Further details about many other
features can be found in (Chaturvedi et al., 2015) and on the
website [3DCITYDB-WEBMAPCLIENT].
4.1 Visualisation of scenarios
In order to enable and facilitate visualisation of the energy-
related results, and, most importantly, to allow for a simple and
immediate comparison between different scenarios, two
approaches are followed.
In the first, the user can explore the 3D model and choose
between scenarios by means of a drop down menu. Energy
performance classes of both buildings and blocks can be
visualised at the same time, depending on the zoom settings the
user decides to define. An example is presented in Figure 6.
A second approach consists in a so-called “Twin view”-modus,
which enables a side-by-side visualisation of two different web
client instances. It features a synchronous navigation via the
master display on the left hand side and enables the user to load
additional GLTF/GLB layers for further comparison. The “Twin
view”-extension is still under development with further
functionalities planned to be added in the near future. An
example is shown in Figure 7.
4.2 Direct connection to the PostgreSQL database
Regarding thematic data retrieval, the 3DCityDB-Webmap-
Client allows only read-only access to a Google Fusion table. In
order to enable both read and write access to the underlying
data of the 3D model a 3DCityDB-Webmap-Client extension is
also being developed allowing for querying and editing data
stored in a PostgreSQL database. The extension is code-named
“Cesium2PSQL” and is meant to improve data retrieval by
removing the now existing middleware communication layers
(i.e. Google Fusion table, Online Spreadsheets). The new
interface is able to communicate in a bidirectional way in order
to edit the city object attributes and write them back into the
database. This enables the users to edit and update the thematic
data like the year of construction, the number of storeys, etc., in
order to correct errors or to entry new values.
The communication interface interacts directly with the
PostgreSQL database and retrieves data depending on the
requested query and the selected city object. Among the others,
this approach allows to overcome a number of potential data-
privacy issues, for example when exporting data to a Google
Fusion table might not be possible due to privacy reasons or
relevance of the data, as Google Fusion is a web service
publicly available and not well suited for privacy-sensible data.
The communication interface extends the 3DCityDB-Webmap-
Client’s functions: it loads the data dynamically on each request
from the PostgreSQL database and returns the response in
JSON (JavaScript Object Notation) format for visualisation,
data exploration, and analysis. The interface uses a REST
ISPRS Annals of the Photogrammetry, Remote Sensing and Spatial Information Sciences, Volume IV-4/W3, 2017 2nd International Conference on Smart Data and Smart Cities, 4–6 October 2017, Puebla, Mexico
This contribution has been peer-reviewed. The double-blind peer-review was conducted on the basis of the full paper. https://doi.org/10.5194/isprs-annals-IV-4-W3-71-2017 | © Authors 2017. CC BY 4.0 License.
76

(Representational State Transfer) architecture that is also known
as RESTful APIs (Application Programming Interfaces).
Whenever the user clicks on a city object within the 3DCityDB-
Webmap-Client’s map, the request is sent to the REST APIs
server and the requested action is performed. The REST APIs
server is connected to the PostgreSQL database and retrieves
the selected city object’s attributes (in case the request is a
HTTP GET request), or updates the city object attributes (in
case the request is HTTP POST request). The server then sends
the response of each request, including all the attributes’
information of the city object and the status code as a JSON
response. On the client side, the 3DCityDB-Webmap-Client
parses the response and populates the city object attributes
information along with their attribute names. The following
Figure 8 depicts the architecture of the REST APIs server.
Figure 8. REST APIs server architecture, on the right, compared
to the existing one, based on Google services, on the left
In this way, the user is able to control and manage the thematic
data layers by using the 3DCityDB-Webmap-Client as usual,
either as layers linked with a Google Fusion table URLs or with
the REST APIs server URL. If the user clicks on a city object
that has a thematic data URL of a Google Fusion table, then the
standard functionalities are provided (read-only access). If the
user clicks on a city object with thematic data URL of a REST
APIs server then the user can also update the city object
attributes.
5. CONCLUSIONS
In this article a methodology for the assessment of the energy
performance of residential buildings in a test area in Vienna,
namely the 12th district Meidling, as well as some web-based
3D visualisation and data exploration tools were presented.
They all share a semantic 3D city model as homogeneous and
centralised information hub. The 3D city mode is based on the
CityGML standard, although extended by means of its Energy
Application Domain Extension (ADE).
With regard to the estimation of the energy performance of
residential buildings, the calculation method is based on the
Austrian Guideline 6 of the Austrian Institute of Construction
Engineering and allows to obtain several energy-related
parameters, such as the heating energy demand, the energy
demand for domestic hot water production, the electricity
demand, the primary energy demand and the CO2-emissions.
The same parameters were then recomputed for different
scenarios, in which a number of measures to refurbish the
thermal hull and to increase the use of renewables were defined
and computed, and finally aggregated at building block level.
The input data were mostly extracted or derived directly from
the 3D city model. If this was not possible, existing parameter
libraries were used. The entire 12th district of Vienna, Meidling,
was used a test site, and contains about 7400 buildings,
including about 5600 residential or mixed residential buildings.
When it comes to the 3D visualisation and data exploration
possibilities, the open nature of the Cesium-based 3DCityDB-
Webmap-Client has allowed to start developing extended
functionalities: the “Twin Viewer”-modus, on one hand, which
enables the visual comparison of different scenarios in a side by
side 3D view, and the “Cesium2PSQL” data connector, on the
other hand, which enables retrieval and editing of the 3D model
thematic data stored in a PostgreSQL database. Both extensions
provide great potential for further development in the 3D
visualisation and data analysis via the 3DCityDB-Webmap-
Client.
The implemented tools contribute to answering some of the
questions raised at the beginning of this paper, i.e. they help a)
to spatially identify energy-inefficient buildings; b) to evaluate
the impact of refurbishment measures in order to increase their
energy efficiency, and, thanks to the bottom-up approach, c) to
evaluate the energy performance of a block (or district). As a
consequence, it is now easier to understand how the energy
demand is going to change in the near and mid-term future.
5.1 Outlook
Some improvements to the methodology are already planned.
Among other things, it is planned to extend the approach to
non-residential buildings, and to use a finer level of detail for
buildings with mixed use. Although the goal of work described
in this paper was, first and foremost, the identification,
development and implementation of the methodology for the
determination of the energy characteristics in combination with
a semantic 3D city model, a further major point is to properly
calibrate the model. The most straightforward way consists for
example in comparing the results with the existing Energy
Performance Certificates (EPCs) of a selected number of
buildings, or with real consumption data. However, at the time
of writing, neither of these data sources have been made
available by the City of Vienna. Nevertheless, results from
analogous experiences in other cities in Europe have shown that
a deviation of up to ±30% between the estimated values and the
EPCs can be expected (Nouvel et al. 2017). An alternative
approach, in case no real data can be retrieved, would be to
compare results obtained by different energy simulation tools,
as proposed for example by Monien et al. (2017).
The adoption of a 3D city models as integrated information
source can however greatly contribute to the reduction of the
simplifying assumptions and therefore to a general increase of
the overall accuracy in the estimations.
As far as the 3D visualisation and data exploration possibilities
are concerned, some improvements are already planned. The
next version the “Twin view”-extension will provide the
possibility to dynamically load data layers via the web interface
for both map frames in order to have greater flexibility in
comparison to the currently hard-coded ones. It will also enable
data retrieval for the city objects’ underlying data sets in the
right hand side map frame. On the other hand, the
“Cesium2PSQL”-extension will be improved to allow for
ISPRS Annals of the Photogrammetry, Remote Sensing and Spatial Information Sciences, Volume IV-4/W3, 2017 2nd International Conference on Smart Data and Smart Cities, 4–6 October 2017, Puebla, Mexico
This contribution has been peer-reviewed. The double-blind peer-review was conducted on the basis of the full paper. https://doi.org/10.5194/isprs-annals-IV-4-W3-71-2017 | © Authors 2017. CC BY 4.0 License.
77
secured connections, user authentication, and will be extended
with a fine-grained data access mechanism to give access to
authorised users only, should the data for example be of
privacy-related nature.
ACKNOWLEDGEMENTS
The authors gratefully acknowledge the European Commission
for providing financial support during the conduct of research
under the FP7-PEOPLE-2013 Marie Curie Initial Training
Network “CI-NERGY” project with Grant Agreement Number
606851.
Research work and tests regarding the Cesium-based
visualisation applications were carried out partially within the
IntegrCiTy project [INTEGRCITY, 2017], which is funded by
the Austrian Federal Ministry for Transport, Innovation and
Technology within the framework of the ENERGIE DER
ZUKUNFT/JPI Urban, with support from the European Union’s
Horizon 2020 research and innovation programme.
As stated in section 2, some of the datasets used in this work
were kindly provided by the city of Vienna specifically for the
CI-NERGY project.
REFERENCES
Agugiaro, G., 2016a, Energy planning tools and CityGML-
based 3D virtual city models. Experiences from Trento
(Italy). Applied Geomatics, 8/1:41–56, Springer Berlin
Heidelberg.
Agugiaro, G., 2016b, First steps towards an integrated
CityGML-based 3D model of Vienna. ISPRS Ann.
Photogramm. Remote Sens. Spatial Inf. Sci., III-4, pp. 139-
146.
Agugiaro, G., 2016c, Enabling “energy-awareness” in the
semantic 3D city model of Vienna. ISPRS Ann. Photogramm.
Remote Sens. Spatial Inf. Sci., IV-4-W1, pp. 81-88.
Agugiaro, G., Robineau, J.L., Rodrigues, P., 2017, Project CI-
NERGY: Towards an integrated energy urban planning
system from a data modelling and system architecture point
of view. ISPRS Ann. Photogramm. Remote Sens. Spatial Inf.
Sci. 2nd Int. Conf on Smart Data and Smart Cities 2017,
Puebla, Mexico, 4-6 October 2017.
Bahu, J.M., Koch, A., Kremers, E., Murshed, S.M., 2013,
Towards a 3D spatial urban energy modelling approach.
ISPRS Ann. Photogramm. Remote Sens. Spatial Inf. Sci., II-
2/W1, pp. 33-41.
Benner, J., Geiger, A., Häfele, K.H., 2016, Virtual 3D City
Model Support for Energy Demand Simulations on City
Level – The CityGML Energy Extension. Proceedings REAL
CORP Conference 2016, pp. 777-786.
Biljecki, F., Ledoux, H., Stoter, J., 2017, Generating 3D city
models without elevation data. Computers, Environment and
Urban Systems, 64, pp. 1-18.
Biljecki, F., Stoter, J., Ledoux, H., Zlatanova, S., Çöltekin, A.,
2015, Applications of 3D city models: state of the art review.
ISPRS Int. Journal of Geo-Information, 4(4), pp. 2842-2889.
Bretschneider, B., Herzog, M., Zelger, T., 2002,
Multifunktionaler Stadtnukleus, Planung eines
multifunktionalen Gebäudekomplexes unter
Berücksichtigung energetischer Planungsfaktoren. Berichte
aus Energie- und Umweltforschung, Bundesministerium für
Verkehr, Innovation und Technologie.
Carrión, D., Lorenz, A., Kolbe, T.H., 2010, Estimation of the
energetic rehabilitation state of buildings for the city of
Berlin using a 3D City Model represented in CityGML.
ISPRS Arch. Photogramm. Remote Sens. Spatial Inf. Sci.,
38(4/W15), pp. 31–35.
Kaden, R., Kolbe, T.H., 2013, City-wide total energy demand
estimation of buildings using Semantic 3D city models and
statistical data. ISPRS Ann. Photogramm. Remote Sens.
Spatial Inf. Sci., II-2/W1, pp. 163–171.
Krüger, A., Kolbe, T.H., 2012, Building analysis for urban
energy planning using key indicators on virtual 3D city
models – the Energy Atlas of Berlin. ISPRS Ann.
Photogramm. Remote Sens. Spatial Inf. Sci., 39(B2), pp.
145–150.
Monien, D., Strzalka, A., Koukofikis, A., Coors, V., Eicker, U.,
2017, Comparison of building modelling assumptions and
methods for urban scale heat demand forecasting. Future
Cities and Environment, 3(1), 2.
Nouvel, R., Bahu, J.-M., Kaden, R., Kämpf, J, Cipriano, P.,
Lauster, M, Häfele, K.H., Munoz, E., Tournaire, O., Casper,
E., 2015a, Development of the CityGML Application
Domain Extension Energy for Urban Energy Simulation.
Proceedings of BS2015: 14th Conf. of Int. Building
Performance Simulation Association, Hyderabad, India.
Nouvel, R., Mastrucci, A., Leopold, U., Baume, O., Coors, V.,
Eicker, U., 2015b, Combining GIS-based statistical and
engineering urban heat consumption models: Towards a new
framework for multi-scale policy support. Energy and
Buildings, 107, pp. 204-212.
Nouvel, R., Schulte, C., Eicker, U., Pietruschka, D., Coors, V.,
2013, CityGML-based 3D city model for energy diagnostics
and urban energy policy support, IBPSA World 2013, pp. 1–
7.
Nouvel, R., Zirak, M., Coors, V., Eicker, U., 2017, The
influence of data quality on urban heating demand modeling
using 3D city models. Computers, Environment and Urban
Systems, 64(2017), pp. 68–80.
Romero Rodríguez, L., Duminil, E., Sánchez Ramos, J., Eicker,
U., 2017, Assessment of the photovoltaic potential at urban
level based on 3D city models: A case study and new
methodological approach. Solar Energy, 146, pp. 264-275.
Strzalka, A., Bogdahn, J., Coors, V., Eicker, U., 2011, 3D City
modeling for urban scale heating energy demand forecasting.
HVAC&R Research, 17(4), pp. 526–539.
Chaturvedi, K., Yao, Z., Kolbe, T.H., 2015, Web-based
Exploration of and interaction with large and deeply
structured semantic 3D city models using HTML5 and
WebGL. In: Wissenschaftlich-Technische Jahrestagung der
DGPF und Workshop on Laser Scanning Applications (3).
REFERENCES FROM WEBSITES (30 APRIL 2017)
3DCITYDB, http://www.3dcitydb.org
3DCITYDB-WEBMAPCLIENT,
https://github.com/3dcitydb/3dcitydb-web-map
CESIUM, https://cesiumjs.org/
CI-NERGY, http://www.ci-nergy.eu
ENERGY-ADE, http://en.wiki.energy.sig3d.org
INTEGRCITY, http://integrcity.epfl.ch
OGD-W, https://open.wien.gv.at
OIB, https://www.oib.or.at/en/oib-guidelines
OGC, http://www.opengeospatial.org
SC-W,
https://smartcity.wien.gv.at/site/files/2014/09/SmartCityWien_F
rameworkStrategy_english_doublepage.pdf
SEP-W,
https://www.wien.gv.at/stadtentwicklung/energie/pdf/sep-
endbericht.pdf
TABULA, http://episcope.eu/iee-project/tabula/
ISPRS Annals of the Photogrammetry, Remote Sensing and Spatial Information Sciences, Volume IV-4/W3, 2017 2nd International Conference on Smart Data and Smart Cities, 4–6 October 2017, Puebla, Mexico
This contribution has been peer-reviewed. The double-blind peer-review was conducted on the basis of the full paper. https://doi.org/10.5194/isprs-annals-IV-4-W3-71-2017 | © Authors 2017. CC BY 4.0 License.
78