how to monitor your energy use gil157
TRANSCRIPT

How to monitor your energy use
How to Guide | GIL157 Monitoring energy use
Why monitor energy?You can’t manage what you don’t measure. Good energy monitoring allows you to:
• Understand where and how energy is being used
• Identify areas where you can reduce energyconsumption and save money
• Confirm whether energy-saving measures are working.
This leaflet will show you how to recordinformation on your business’ energy use, andoutline some simple techniques to help you to usethat data to spot money saving opportunities.
Did you know?Using a meter to help monitor your energy typically identifies energy savings of more than 5%.

1. Gather data• Learn how to read your meter. Digital meters are straightforward,
but older dial versions (analogue) can be tricky (see below)
• Find out if your supplier keeps data for your business — larger sites*should be able to access consumption readings taken at half-hourlyintervals. If not, consider installing your own half-hourly meter to get an accurate picture of your energy use, and save time in readings. If you do read your meter manually make sure that you take readingsat regular intervals
• Always check your meter reading against your bill. Make sure that you are only paying for what you are using.
Three aspects of metering
Reading an analogue meterStart with the smallest unit first and read the dials in order. In thisexample that is left to right. For electricity, record the units in kWh, but gas could be cubic feet too. When the hand is between twonumbers, write down the number it has just passed.
OLD VERSION - DO NOT USE
The reading on thisexample meter is 94694 kWh. The 1/10reading is generally ignored
*>£15K spend on electricity a year.
2. Plot your data• Whether you get your data from your supplier or manual readings,
record it in a simple table. Many suppliers will let you download this information directly into a spreadsheet. Use the table to plot a straightforward graph of energy against time
• The more meter readings you take, the better the picture you can build of your site’s consumption. This is why the Carbon Trustrecommends half-hourly meter readings. This added detail will help you identify energy saving opportunities faster
• Contact the Carbon Trust for more information which will help you account for the variables that may affect your energy use.
etering
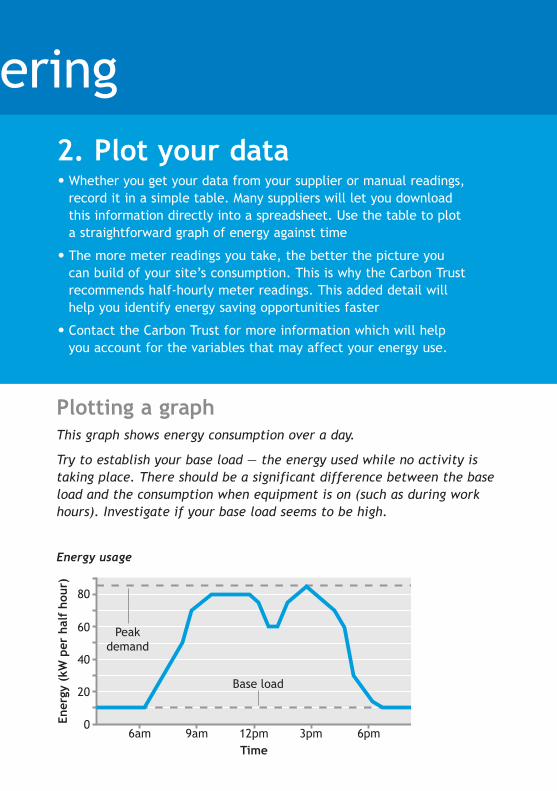
Plotting a graphThis graph shows energy consumption over a day.
Try to establish your base load — the energy used while no activity istaking place. There should be a significant difference between the baseload and the consumption when equipment is on (such as during workhours). Investigate if your base load seems to be high.
6am
20
0
40
60
80
9am 12pmTime
Ener
gy (
kW p
er h
alf
hour
)
3pm 6pm
Peakdemand
Base load
Energy usage

3. Understand your energy use• Look at your graph of energy consumption and think about how this
fits in with the pattern of production/occupancy of your building.Investigate any suspicious areas, for example, has the energy usecontinued at a high rate during periods of low production? Or, is energystill being used during office holidays?
• Also, consider other factors which might affect your energy consumption:did you change your production patterns, or did you need extra heatingdue to cold weather? The Carbon Trust has more information aboutanalysing factors like these
• Investigate potential waste areas and make changes. And remember to re-plot your graphs to see if your changes have worked.
1,2,3...
Analysing your graphCompare the energy profile of different days with each other. Identifywhether energy consumption is higher on certain days, or at particulartimes from day to day. For example, why is Wednesday’s profile so high?Perhaps there is a straightforward explanation, such as work continuingduring lunch time that day. Or perhaps there were inefficiencies thatshould be investigated.
6am
20
0
40
60
80
100
120
9am 12pmTime
Ener
gy (
kW p
er h
alf
hour
)
3pm 6pm
MondayTuesdayWednesday
Peakdemand
Base load
Energy usage

How to Guide | GIL157 Monitoring energy use
Before you startAsk how much information you have about your energy consumption — and whether you need more detail.
Your bill can tell you about your site’s peak demand, power factor andoverall energy use. These can all affect the amount you pay. Ask yoursupplier to help you understand your bill.
Consider installing sub-meters onto equipment that uses lots of energy.These will allow you to see the consumption patterns of that unit in detail.
Automatic meter reading systems provide accurate and timely data withthe minimum of effort. These systems make it easy to take readings inreal time and therefore identify savings opportunities quickly. They oftenpay for themselves in under a year.
Safety first Although reading the meter should be perfectly safe, gas and electricityare potentially lethal, so:
Never attempt to remove, install, repair, or tamper with a meter or any of its connections. Always use a qualified technician.
Have the meter tested for electrical safety and/or gas leaks at least once a year.
Undertake a safety assessment of your energy meter’s location. Wheremeters are installed in awkward or potentially hazardous locations,consider having them moved or installing a remote reading system.

Choosing metering equipment and an installerIf you want to get more useful information from your meter, you mayconsider purchasing a more sophisticated unit. The meter you buy may qualify for a tax break under the Enhanced Capital Allowances (ECA) scheme:
• Visit the products and claims section of the Energy Technology List (ETL)at www.eca.gov.uk/etl
• Look at the entries for Automatic Monitoring and Targeting and select the type of system you want to install
• The site also provides more information on the ECA scheme.
Use a qualified local supplier to install the meter, or a specialist installer in the case of more complex systems. A trade association such as theEnergy Systems Trade Association can help you to find a local supplier or installer.
Need more help or information?Call the Carbon Trust on: 0800 085 2005 or visit www.carbontrust.co.uk/energyThe Carbon Trust helps businesses and public sector organisations cuttheir energy costs to combat climate change through the provision offree, professional advice and assistance.
The Carbon Trust is grant funded by the Department for Environment, Food and RuralAffairs, the Department of Trade and Industry, the Scottish Executive, the Welsh AssemblyGovernment and Invest Northern Ireland.
Whilst we have taken reasonable steps to ensure that the information contained within thisleaflet is correct we give no warranty and make no representation as to the results that maybe achieved from following its instructions or the completeness of the instructions containedin it. If in any doubt about the instructions given in this leaflet, seek professional advice.Nothing in this leaflet is intended to be or should be interpreted as an endorsement of, orrecommendation for, any supplier, service or product. All and any liability that might arisefrom this leaflet is hereby excluded to the fullest extent permitted by law.
The Carbon Trust is a company limited by guarantee. Registered in England and Wales Number 4190230. Registered at: 8th Floor, 3 Clement’s Inn, London WC2A 2AZ.
© Queen’s Printer and Controller of HMSO. Published January 2006. Revised October 2006
Ref: GIL157