how to monitor and improve unilever jm supply chain ... · 4 this was supported by kaplan and...
TRANSCRIPT

A Work Project, presented as part of the requirements of the Award of a Masters
Degree in Management from the NOVA – School of Business and Economics
How to monitor and improve Unilever JM Supply Chain
processes to become the best of Portugal’s sector in 2015?
Dário Silva Santos Student Number 1458
A Project carried out on Field Lab in Entrepreneurial Innovative Ventures under the
supervision of: Professor Filipe Castro Soeiro
May 30th 2014

1
Contents Executive Summary ........................................................................................................ 2
Keywords ..................................................................................................................... 2
1. Introduction and Background ................................................................................... 3
1.1 Project Purpose and Scope .................................................................................. 3
1.2 Research Question Analysis and Methodology .................................................. 3
1.3 Introduction .......................................................................................................... 5
2. Literature Review ....................................................................................................... 9
2.1 Performance Measurement Systems ................................................................... 9
2.1.1 Tableau de Bord ............................................................................................ 11
2.2 Continuous Improvement Models ..................................................................... 13
3. Cross Continuous Improvement Analysis Model .................................................. 13
3.1 Porter Model Analysis ........................................................................................ 13
3.2 “Benchmarking 2013” ........................................................................................ 15
3.3 Tableau de Bord – Core Processes Analysis and Nexus Causality ................. 17
3.3.1 Planning and Customer Service ..................................................................... 17
3.3.2 Logistics and Quality Management ............................................................... 19
3.3.3 Internal Benchmarking between Category Division and Clients .................. 21
5. Conclusions and Recommendations ........................................................................ 25
References ...................................................................................................................... 28
Appendixes .................................................................................................................... 31
2
How to monitor and improve Unilever JM Supply Chain processes to become the best of Portugal’s sector in 2015?
Executive Summary
Unilever Jerónimo Martins is a Portuguese joint-venture leading firm in what
concerns the supply chain industry of fast-moving consumer goods in Portugal.
The scope of analysis of this Work Project is focusing on Unilever-JM
operations and services in the Portuguese market regarding quality, efficiency and
effectiveness over B2B customers.1
It will be analysed the possibility of development and implementation of a
performance measurement system, Tableau de Bord,2 which will be crucial for the
identification of potential opportunities of improvement with impact in the supply chain
processes.3 This will be completed through the establishment of KPI’s to monitor and
manage periodically logistics, planning and customer service processes’ performance,
which are the ones where the bottlenecks are impacting more in the supply chain.
In this work project the nexus causality for the problems will also be discussed
and some recommendations will be prepared to tackle the inefficiencies found through
the monitoring of the previous core processes, in order to improve efficacy and quality
service of the supply chain.
Keywords Unilever JM; Supply Chain Management; Tableau de Bord; Key Performance
Indicators; Performance Measurement Systems; Logistics; Planning; Customer Service;
1 UJM main B2B customers are Auchan, Dia Portugal, El Corte Inglês, Intermarché, Makro, Pingo Doce, Recheio and Sonae. 2 The Tableau de Bord is a strategy performance management tool that allows the strategic and operational control of different areas of supply chain. 3 Potential improvements in the core processes like logistic (reducing costs and potentially driving to more competitive pricing strategies) and customer service (which will impact on customer satisfaction, loyalty and potential sales revenues).

3
1. Introduction and Background
1.1 Project Purpose and Scope
The aim of this work project is to develop a performance measurement system,
Tableau de Bord, through the design and implementation of key performance indicators
in relation to core processes and resources, which will be essential for the application of
strategic decisions.4 This system will allow Unilever-JM to monitor, manage and
improve logistic, planning and customer service processes in order to increase and
sustain quality, efficiency and value perception of those operations to clients.
Subsequently, it will be identified opportunities of improvement and it will be discussed
the best ways to implement corrective and preventive measures in these areas.
The scope of analysis, as mentioned previously, is focusing on UJM operations
and services in the Portuguese market regarding quality, efficiency and effectiveness
over B2B customers.
With the intention of fully understanding the origins of inefficiencies or
problems in the SCM, it is imperative the examination of performance for different
divisions, since they might be related with a specific division. Thus, 5 major category
divisions will be analyzed individually (Iglo, Lever, Personal Care, Foods and Knorr).
1.2 Research Question Analysis and Methodology
The first step of this project consists in the development of Porter Five Forces
Analysis and in the revision of a “Benchmarking Study”5 performed by GS1 Portugal6
in 2013. Firstly, these will be extremely important to understand the industry’s
4 This was supported by Kaplan and Norton, 1996, in their book “The Balanced Scorecard: Translating Strategy Into Action”. 5 Study where top national retailers evaluated the services provided by suppliers. This report is explained and analyzed in “Benchmarking Study” section. 6 GS1 Portugal was founded in 1985 and it is an advisory and nonprofit organization, which has the aim of making businesses more efficient and sustainable.

4
structure. 7 Secondly, it’s crucial to know how retailers evaluate their suppliers’
operations and services, and to recognize the areas which retailers care the most in order
to improve.
Afterwards, the existing key performance metrics will be analysed (data
collected from UJM database) for UJM supply chain management and new indicators
will be suggested to improve and control core processes’ performances. The previous
steps will allow the development of a Tableau de Bord aligned with UJM vision and
strategic objectives.
Lastly, after the implementation of this performance measurement and the
interpretation of results, some recommendations will be given to improve Unilever-JM
Supply Chain processes’ performance.
7 The Porter Five Forces analysis is essential to conduct a sustain analysis of the Supply chain FMCG industry.
5
1.3 Introduction
Unilever-JM is a company that emerged from a partnership between Unilever
and Jerónimo Martins in 1949, and it is responsible for the distribution of consumer
goods. By that time, the partnership agreement resulted in the constitution of a firm
named Fima. The Joint Venture with the name of Unilever Jerónimo Martins was only
established in 2007, after the company had made several acquisitions both at National
and International levels.
Currently, Unilever-JM is a major player regarding the supply chain industry of
FMCG. However, due to its vast portfolio of products, it faces strong and powerful
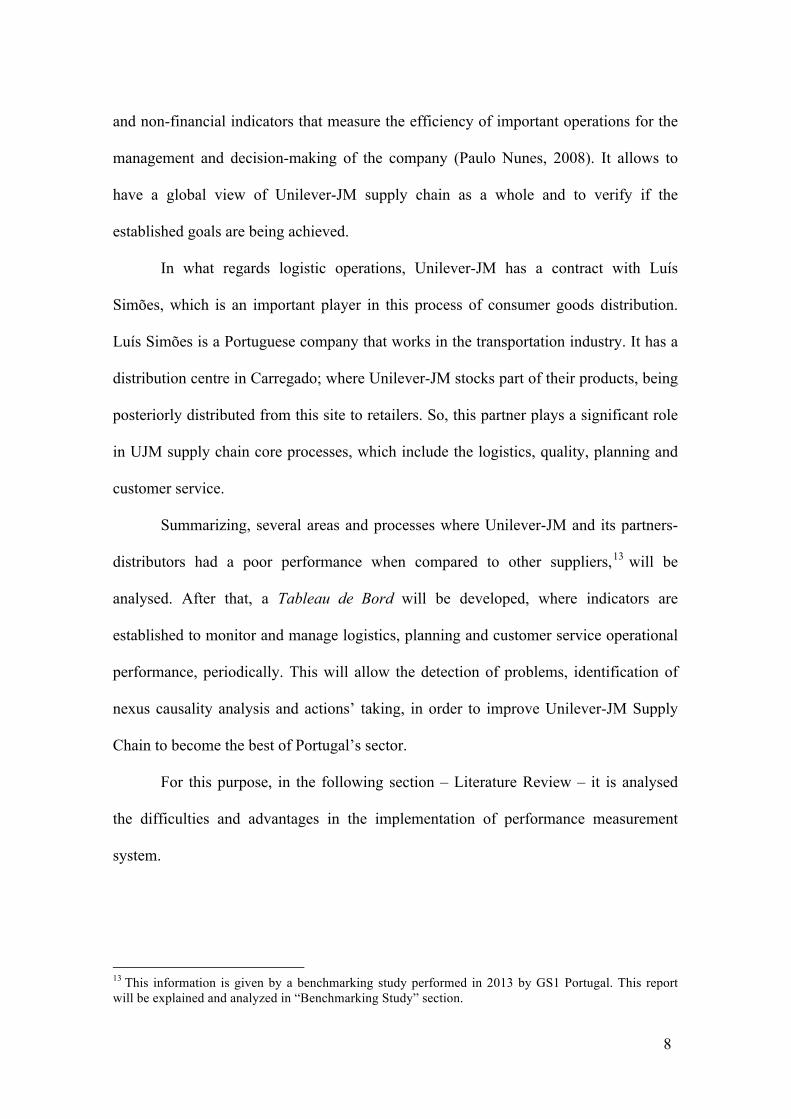
competitors8 of different categories (i.e. Foods, Home and Personal Care). In Figure 1,
presented below, it is represented the supply chain management flow of UJM as a
whole. However, this work project will focus on a part of it – covering the products’
flow from “Unilever Sourcing Unit” until it reaches “Retail Distribution Centre”. In this
segment some potential major improvements are identified in planning, logistics and
customer service (i.e. collaborative forecasting of demand, joint deliveries and
improvement of communication systems).
8 Nestlé, Sovena, Delta, Danone, Renova and Central Cervejas e Bebidas are some examples of these competitors.
Figure 1 – Supply Chain Management Flow

6
These are the processes where bottlenecks9 have a higher impact on the supply
chain. Since the capacity of a process is defined by the capacity of the slowest stage, it
is essential to know where the bottleneck is to act on it, which will consequently lead to
an increase on overall process capacity. Then, this procedure must be repeated in order
to find the new bottleneck and tackle it. This cycle represents the steps of Theory of
Constraints, which results in a process of continuous improvement (Rand, G.K., 2000).
In order to improve efficiency in the supply chain industry, it is also extremely
important to have a strong supply chain management. According to Stock and Boyer
(2009) “the goal of SCM is to achieve greater profitability by adding value and creating
efficiencies, thereby increasing customer satisfaction”.
Therefore, SCM assumes a huge importance for Unilever-JM logistics, planning
and customer services’ areas. This happens due to the high number of operations that
occur every day, the geographically distribution of their clients and the fact of handling
with a huge number of SKU’s10 (Stock Keeping Units).
Besides that, there are two other aspects that have acquired some increasing
prominence lately. These two issues are the higher level of competition in this industry
and the increasing power of retailers. The origins of these problems come from the high
level of concentration in the retail market,11 the growth of private labels, the central
purchasing (price control and competition problem) and the trade spending (cost of
distribution and promotion service).
These issues can lead to different reactions from retailers. As retailers have more
power they can demand more from suppliers. The increase in bargain power can be used
to demand discounts, retrospective payments, after-sale rebates, higher slotting fees (to 9 According to Graham K Rand, bottleneck is the system constraint regarding production planning. 10 Unilever-JM has more than 1100 SKU’s. 11 Continente and Pingo Doce retain 54,5% market share of retailers in Portugal (2013).
7
gain access to shelf space) and return of unsold goods. Other examples of how retailers’
power can be used are the promotion of their own brands or the threatening of delisting
(when suppliers refuse to reduce price or make other payments and concessions).
This type of retailers’ reactions have effects on UJM supply chain management,
which can bring additional and unexpected costs, loss of volume, loss of profitability,
potential forecasting errors and will weaken UJM bargaining power.
Consequently, with the aim of facing these challenges, it is important to
establish a measurement system to monitor and control day-to-day operations
performance. By identifying, selecting and implementing these key performance
indicators to control and manage supply chain operations, it is possible to know how
well internal and external expectations (Unilever and customers) are being met. The
conceptualization and implementation of this system will be further explained in the
Cross Continuous Improvement Analysis Model section.
Currently, UJM has a database with key indicators12 that measure and monitor
transversely core processes of the supply chain. However, Unilever-JM does not have
an integrative scorecard or system with KPI’s in order to control and manage
periodically the supply chain end-to-end processes. Without this performance
indicators’ tool, the identification of issues, opportunities for improvement and UJM’s
alignment of vision, goals and strategies is harder and time consumable.
The Tableau de Bord is a strategy performance management tool that allows this
type of strategic and operational control in an easy and synthetic way, by periodically
monitoring different areas of supply chain. It results from the combination of financial
12 Unilever has several indicators (more than 100 indicators) to measure UJM supply chain processes performance. However, this high number of indicators leads to a new problem: complexity and difficulty to analyze the information in order to identify opportunities of improvement. Hence, in Appendix 1 is presented a list of selected KPI’s (most relevant).
8
and non-financial indicators that measure the efficiency of important operations for the
management and decision-making of the company (Paulo Nunes, 2008). It allows to
have a global view of Unilever-JM supply chain as a whole and to verify if the
established goals are being achieved.
In what regards logistic operations, Unilever-JM has a contract with Luís
Simões, which is an important player in this process of consumer goods distribution.
Luís Simões is a Portuguese company that works in the transportation industry. It has a
distribution centre in Carregado; where Unilever-JM stocks part of their products, being
posteriorly distributed from this site to retailers. So, this partner plays a significant role
in UJM supply chain core processes, which include the logistics, quality, planning and
customer service.
Summarizing, several areas and processes where Unilever-JM and its partners-
distributors had a poor performance when compared to other suppliers,13 will be
analysed. After that, a Tableau de Bord will be developed, where indicators are
established to monitor and manage logistics, planning and customer service operational
performance, periodically. This will allow the detection of problems, identification of
nexus causality analysis and actions’ taking, in order to improve Unilever-JM Supply
Chain to become the best of Portugal’s sector.
For this purpose, in the following section – Literature Review – it is analysed
the difficulties and advantages in the implementation of performance measurement
system.
13 This information is given by a benchmarking study performed in 2013 by GS1 Portugal. This report will be explained and analyzed in “Benchmarking Study” section.

9
2. Literature Review
2.1 Performance Measurement Systems The implementation of performance measures and its application in corporate
operations is a recent concept. According to (Bourne, M., Mills; et al 2000) due to
today’s highly competitive environment, businesses must implement such practices.
Particularly, this leads to improvements in operational results, as well as boosting their
reputation within the industry sector (Lisiecka, K.; Czyż-Gwiazda, E., 2013). These
practices will be extremely important for the supply chain management of FMCG,
especially because of the relative short Life Cycle Industry and the short Product Life,
Cycle; which turn this industry to focus on continuous innovation strategies that
demand short time to market capacities, quality, efficiency and very well organized
supply processes. Besides that, UJM is in a highly competitive industry where it needs
to take advantage of resources and capabilities that are valuable, rare, costly to imitate
and supported by the organization. These types of resources and capabilities can be the
source of sustained competitive advantages.14
Indeed, recent literature backs up the previous statements, as mentioned by
Michaela Striteska and Marketa Spickova (2012), “the first condition to improve, and
ultimately to achieve, business excellence, is to develop and implement a system for
performance measurement (hereafter PM) (Kanji, 2002).”
Nevertheless, up until the late 1980’s firms focused solely on using historical
financial data to establish performance measurements, mainly through analysis of
accounting measures and ratios such as ROI, ROE, ROCE (Lisiecka, K.; Czyż-
14 In order to analyze if internal resources and capabilities could be a source of sustained competitive advantage it was used VRIO analysis framework – Appendix 8 – VRIO Analysis Framework – Table 9. Source: Barney, J.B. 1991. “Firm resources and sustained competitive advantage.” Journal of Management, 19, pp. 99-12

10
Gwiazda, 2013). Even though they did consist of important measures, they lacked the
increasing complexity much needed to tackle difficulties in the markets in which
companies compete (Kennerley, Neely 2002). For this reason, in the late 1970s and
1980s, “authors expressed a general dissatisfaction with traditional backward looking
accounting based performance measurement systems, identifying their shortcomings
and arguing for change” (Lisiecka, K.; Czyż-Gwiazda, E., 2013).
Tung, Baird and Schoch (2011) acknowledged 4 core shortcomings of financial
measures. Firstly, these types of measures (outcome-oriented) do not provide
information relative to workers performance level across the core processes operations
of an organization. Secondly, these conventional measures only present results of
organizations operations, instead of presenting causes of possible issues affecting core
processes performance. So, these measures will not help managers to know what needs
to be improved to reach business excellence. Thirdly, traditional financial measures
might give wrong incentives to managers. Managers may jeopardize long-term
effectiveness, so as to maximize short-term results. Finally, these measures are only
internal oriented and can diverge from the organization strategy. All these limitations
combined with the increasing of market competiveness and demand, make necessary
the raise of qualitative measures (Lisiecka, K.; Czyż-Gwiazda, E., 2013).
The combination of key performance indicators with financial indicators is
important for a balanced view of global business performance.
Performance measurement systems can bring many benefits to a business. They
allow to manage core business areas through the establishment of indicators and to
measure different processes performance at all levels of an organization. This

11
monitoring helps managers to know if company goals and objectives are being
achieved.
Moullin (2007) considers that the best performance measurement definition is
Neely et al. (2002) “the process of quantifying the efficiency and effectiveness of past
actions”.
“Effectiveness is compliance with customer requirements, and efficiency is how
the organisation’s resources are used to achieve customers’ satisfaction levels. To
quantify efficiency and effectiveness, performance measures should be chosen,
implemented, and monitored” (Lisiecka, K.; Czyż-Gwiazda, E., 2013).
In the development of a performance measurement system, the first step is the
planning of how core processes performance can be measured and the creation of
performance indicators to measure it. This allows to control if performance objectives
are being accomplished. This system is used by managers to improve planning, to
regularly monitor and control processes efficiency and effectiveness through the
implementation of key performance indicators and targets (Conradie, 2003).
Summarizing, performance measurement systems help aligning key processes
with company vision, mission and strategies. It also improves the communication and
comprehension of business goals and strategies throughout the different levels of a
company. Finally, it is an important tool that helps detecting opportunities for
improvement in organization’s key processes and in customer service.
2.1.1 Tableau de Bord
According to Epstein and Manzoni (1997) “The Tableau de Bord was first
developed by process engineers who were looking for ways to improve their production
process by better understanding cause-effect relationships. The same principle was then

12
applied at the top management level, to give senior managers a set of indicators
allowing them to monitor the progress of the business, compare it to the goals that had
been set, and take corrective actions”.
In this work project, the Tableau de Bord was the tool used to monitor and
manage UJM supply chain core processes’ performance. It is a performance
measurement system that contains information organized in a synthetic and easy way
for a quick overview covering main areas of the organization. In the case of UJM
FMCG industry, it will be an essential tool to identify opportunities of improvement and
it will be crucial for strategic decision making in the supply chain core processes.
According to Paulo Nunes (2008), the Tableau de Bord has the following main
purposes:
! Reduction of uncertainty – It offers a better perception of current processes
performance and if goals are being achieved or not. This is important to identify
measures that should be taken in order to improve and reach the performance
desired (important for decision-making).
! Stabilization of information – It filters the essential and crucial information
required for managers to sustain measures/actions to take.
! Improves communication by sharing it not only between an area/division, but by
sharing it also across different areas/divisions of an organization.
! Offers efficient tools to explore opportunities for improvement in organization
main processes.
Therefore, the Tableau de Bord is an important performance measurement
system that will help Unilever-JM to continuously improve core processes performance

13
in the supply chain industry of FMCG; which will be analysed in the following section
in a literature review of Continuous Improvement Models.
2.2 Continuous Improvement Models
Nowadays, due to competitive environment, there is a need for continuous
improvement in products and processes, which is widely recognized (Bessant, Caffyn,
& Gallagher, 2001). One of the most widely famous models is the Deming Cycle,
which proposes that: “businesses processes should be analyzed and measured to identify
sources of variations that cause products to deviate from customer requirements” (Paul
Arveson, 1998).
This quality model is organized in four steps: - Plan, Do, Check and Act. In the
first step of Deming Cycle, “Plan”, UJM supply chain core processes components will
be designed and revised, in order to improve performance. In the second step, “Do”, the
plan will be implemented and core processes’ performance are measured. Posteriorly, in
the “Check” step, the measurements will be assessed and the results will be reported for
strategic decision makers, which will be made through the Tableau de Bord. Finally, in
“Act”, it will be decided what must be done to improve UJM supply chain core
processes performance.15
3. Cross Continuous Improvement Analysis Model
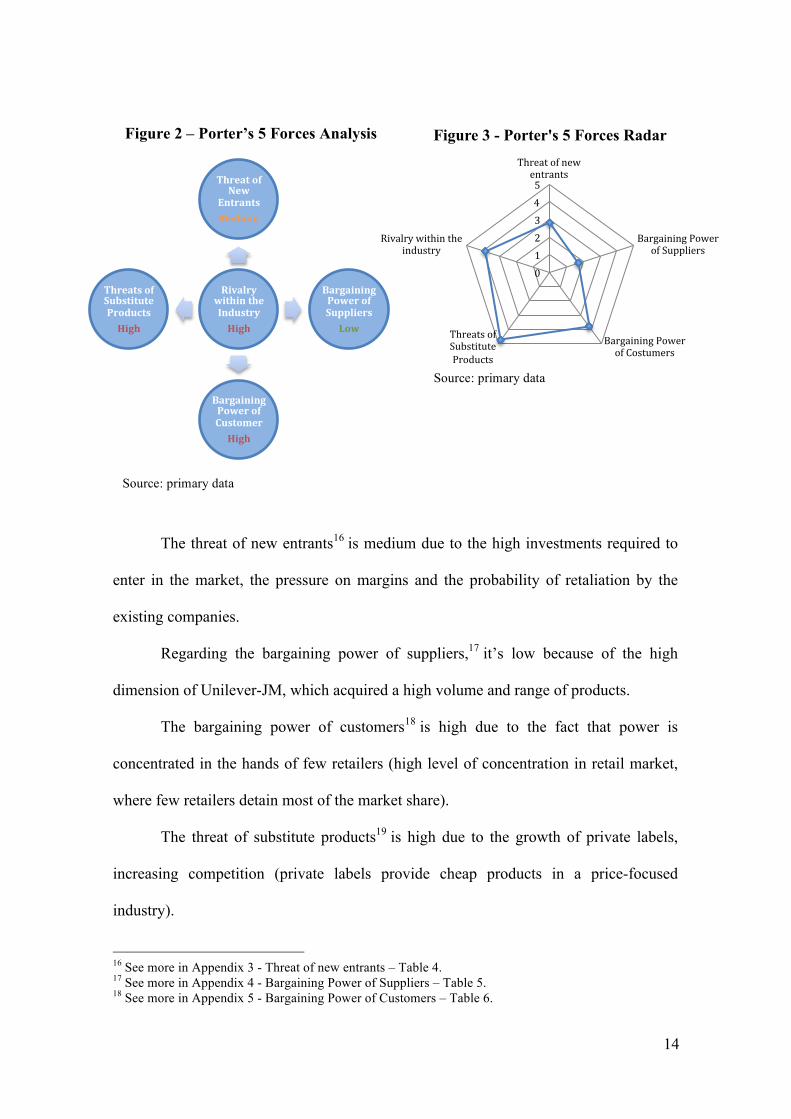
3.1 Porter Model Analysis
For a better understanding of the fast-moving consumer goods industry and its
competitive outlook it was conducted a Porter five forces analysis. The results of this
analysis are presented in Figures 2 and 3.
15 This is corroborated by Paul Arveson in “The Deming Cycle”, Balanced Scorecard Institute, viewed on May 4, 2014 at: http://balancedscorecard.org/thedemingcycle/tabid/112/default.aspx.
14
The threat of new entrants16 is medium due to the high investments required to
enter in the market, the pressure on margins and the probability of retaliation by the
existing companies.
Regarding the bargaining power of suppliers,17 it’s low because of the high
dimension of Unilever-JM, which acquired a high volume and range of products.
The bargaining power of customers18 is high due to the fact that power is
concentrated in the hands of few retailers (high level of concentration in retail market,
where few retailers detain most of the market share).
The threat of substitute products19 is high due to the growth of private labels,
increasing competition (private labels provide cheap products in a price-focused
industry).
16 See more in Appendix 3 - Threat of new entrants – Table 4. 17 See more in Appendix 4 - Bargaining Power of Suppliers – Table 5. 18 See more in Appendix 5 - Bargaining Power of Customers – Table 6.
0 1 2 3 4 5
Threat of new entrants
Bargaining Power of Suppliers
Bargaining Power of Costumers
Threats of Substitute Products
Rivalry within the industry
Figure 3 - Porter's 5 Forces Radar Figure 2 – Porter’s 5 Forces Analysis
Rivalry within the Industry High
Threat of New
Entrants Medium
Bargaining Power of Suppliers Low
Bargaining Power of Customer High
Threats of Substitute Products High
Source: primary data
Source: primary data

15
These forces, together, play an important role in the identification of the
competitive intensity and attractiveness (profitability) of the industry. Consequently, the
rivalry within the industry20 is considered high. There is a high competition from private
labels and there are also several manufactures that opt by product differentiation and
strongly bet on its brand image. Therefore, it its crucial to focus in the supply chain
improvement regarding innovation, R&D, customer service, logistics, marketing and
sales.
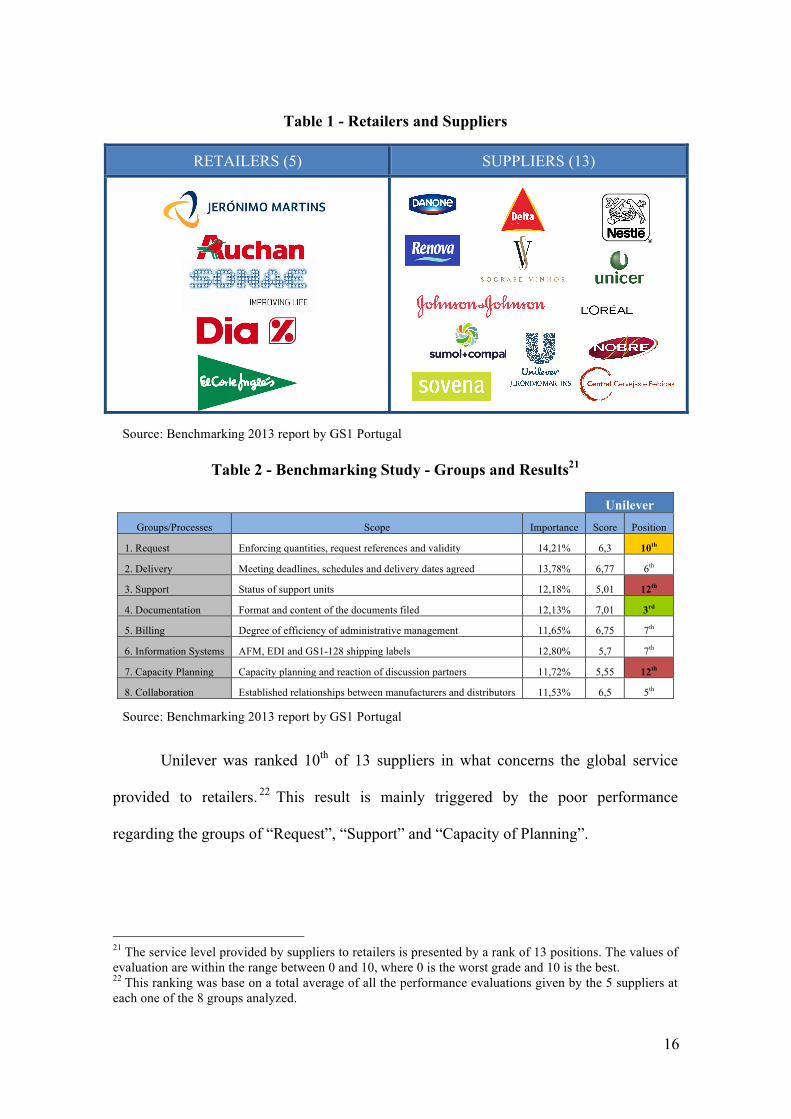
3.2 “Benchmarking 2013”
“Benchmarking 2013” is a study performed by GS1 Portugal with the aim of
evaluating the service level provided by suppliers and their distributors to retailers. The
report focuses on activities related with supply chain with the purpose of identifying
opportunities for improvement in suppliers’ core processes.
In this evaluation participated 5 retailers, which evaluated the performance of 13
suppliers (Table 1).
The study was performed through the development of questionnaires composed
by 50 questions related with the core processes presented in Table 2. For each question,
retailers attributed a classification for the importance of the issue and an evaluation for
suppliers’ performance (evaluation scale: 0 to10).
19 See more in Appendix 6 - Threat of Substitute Products – Table 7. 20 See more in Appendix 7 - Rivalry within the industry and Exit Barriers – Table 8.
16
Table 1 - Retailers and Suppliers
RETAILERS (5) SUPPLIERS (13)
Table 2 - Benchmarking Study - Groups and Results21
Unilever
Groups/Processes Scope Importance Score Position
1. Request Enforcing quantities, request references and validity 14,21% 6,3 10th
2. Delivery Meeting deadlines, schedules and delivery dates agreed 13,78% 6,77 6th
3. Support Status of support units 12,18% 5,01 12th
4. Documentation Format and content of the documents filed 12,13% 7,01 3rd
5. Billing Degree of efficiency of administrative management 11,65% 6,75 7th
6. Information Systems AFM, EDI and GS1-128 shipping labels 12,80% 5,7 7th
7. Capacity Planning Capacity planning and reaction of discussion partners 11,72% 5,55 12th
8. Collaboration Established relationships between manufacturers and distributors 11,53% 6,5 5th
Unilever was ranked 10th of 13 suppliers in what concerns the global service
provided to retailers. 22 This result is mainly triggered by the poor performance
regarding the groups of “Request”, “Support” and “Capacity of Planning”.
21 The service level provided by suppliers to retailers is presented by a rank of 13 positions. The values of evaluation are within the range between 0 and 10, where 0 is the worst grade and 10 is the best. 22 This ranking was base on a total average of all the performance evaluations given by the 5 suppliers at each one of the 8 groups analyzed.
Source: Benchmarking 2013 report by GS1 Portugal
Source: Benchmarking 2013 report by GS1 Portugal

17
In “Request”, problems regarding the condition of goods when delivered to
retailers were identified. Hence, in this process, one opportunity of improvement is the
development of infrastructures to better accommodate products during transportation.
Regarding “Support” and “Capacity planning”, there were issues regarding stock
availabilities. This represents another opportunity of improvement. With the intention of
tackling this issue and better estimate consumer demand, it could be developed
collaborative planning with retailers.
Finally, this study also offers key information regarding the most significant
issues in the supply chain industry of FMCG for retailers, which are the following:23
! Good condition of the products when received
! Compliance with the agreed delivery time
! Management of promotions (Stock Availabilities)
! Compliance with delivered products expiration date
This information of Unilever JM classification in each group and the
identification of the most important issues are important because it shows the perception
that retailers have from Unilever-JM service performance. It also supports the selection
and creation of KPI’s for the development of an efficient Tableau de Bord, which is
developed in the following section.
3.3 Tableau de Bord24 – Core Processes Analysis and Nexus Causality
3.3.1 Planning and Customer Service
In this section, an analysis of how efficient is UJM supply chain management
regarding the processes of Planning and Customer Service, will be executed. In the first
process, it was measured the number of failed cases due to stocks availability.
23 All of these issues will be monitor in the Tableau de Bord. 24 This performance measurement system is presented in Appendix 2 - Tableau de Bord.

18
In figure 4, presented below, it is represented the number of failed cases,
associated to each key performance indicator for December 2013. In this chart it is also
possible to identify that the major part of failed cases in this month are associated with
Losses Before Dispatch (LBD).25
Sources: Unilever Database
Looking at figure 5, the reasons behind the high number of failed cases related
with LBD are analyzed. One of the main causes contributing to this issue is the stock
availability, which is influenced by the accuracy in the forecasting of customers demand
(planning).
As Planning, Customer Service, will also affect the number of failed cases
associated with LBD.
In figure 5, presented previously, it is identified a high number of failed cases
due to Customer Relationship Management issues (25.667 failed cases of the total
48.246 failed cases in LBD, which represents 53,2%).26 Communication issues between
Unilever and its clients might be the cause behind this issue. Therefore, here is
presented a possible opportunity of improvement. There are inaccurate forecasts, lack of 25 This indicator is explained in Appendix 1 - Key Performance Indicators. 26 In this month, December 2013, customer expected quantity was 1.975.036 cases. So the 48.246 failed cases in LBD represents 3,08% of the total customer expected quantity.
Customer Relationship Management 25 667
Order Management
Issues 27
Stock Availability 22 113
Warehouse and Transportation
439
Figure 5 - LBD - December/13
48 246
7 566 3 102 1 988
0
10 000
20 000
30 000
40 000
50 000
LBD Refusals On Time Excluded
Figure 4 - Failed cases - December13
Cases Failed
19
communication between processes and communication issues with clients (for example,
customer service not fast enough in letting customers know about changes in products)
that are creating this inefficiency in these core processes.
Subsequently, in order to face these issues, it is important to develop
communication systems between processes, to improve communication and to develop
collaborative planning with retailers.
3.3.2 Logistics and Quality Management
Concerning Logistics, it was measured the number of failed cases due to late
delivering of orders to client (not respecting the schedule agreed, which is represented
by the indicator On Time) and the number of failed cases due to picking errors.27
By analyzing Figure 4, it is identified the 3102 failed cases associated with the
indicator “On Time”, which means that UJM needs to tackle this process inefficiency.
One of the reasons that might be behind this issue is the late placement of the order by
the customer, which gives less time for UJM distributor partner to deliver the orders.
The geographical distribution of UJM clients across the country also contributes for the
difficulty of planning and fulfilment of the agreed schedules.
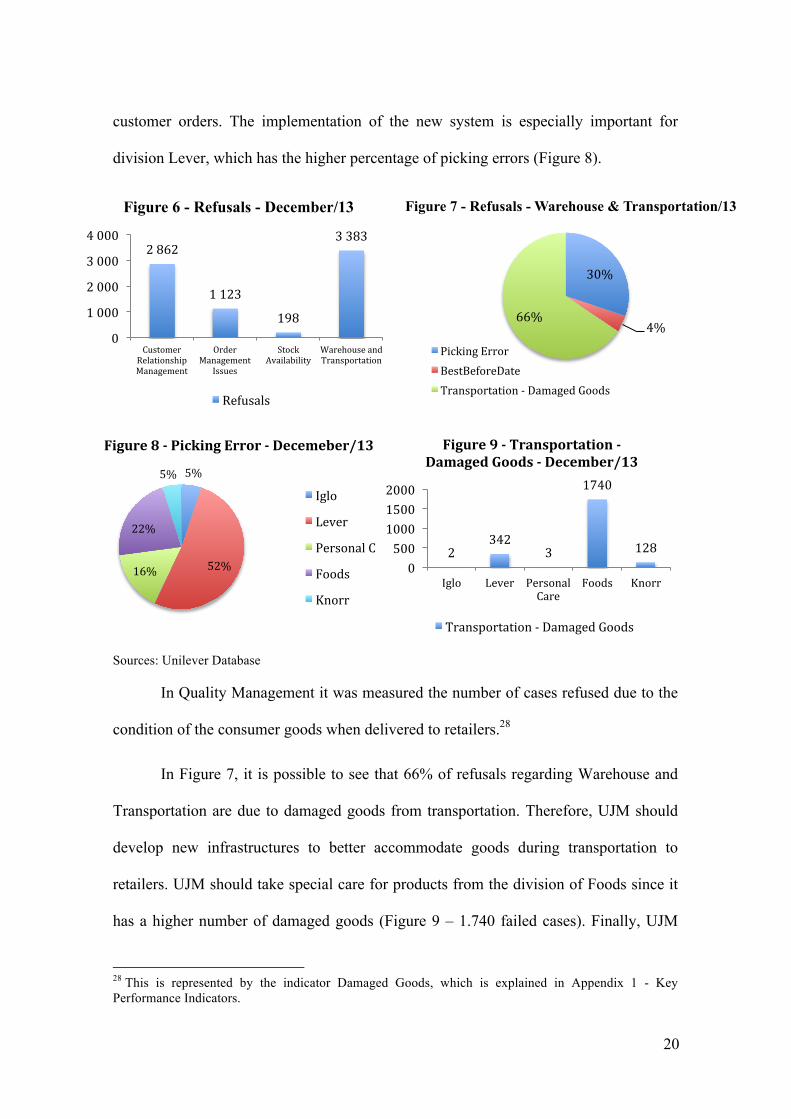
On the subject of the other indicator, “Picking Error”, it represents a significant
part (30%) of the total number of failed cases related with Warehouse and
Transportation in Refusals (Figures 6 and 7). Here it is identified other opportunity for
improvement. UJM, as mentioned previously, has a high number of SKU’s, which is
one of the reasons for the difficulty in the differentiation between packages. This can
lead to picking errors. Thus, due to the significant number of failed cases caused by this
issue, it is important to implement a new system for a more accurate preparation of
27 Both indicators are explained in Appendix 1 - Key Performance Indicators.
20
customer orders. The implementation of the new system is especially important for
division Lever, which has the higher percentage of picking errors (Figure 8).
Sources: Unilever Database
In Quality Management it was measured the number of cases refused due to the
condition of the consumer goods when delivered to retailers.28
In Figure 7, it is possible to see that 66% of refusals regarding Warehouse and
Transportation are due to damaged goods from transportation. Therefore, UJM should
develop new infrastructures to better accommodate goods during transportation to
retailers. UJM should take special care for products from the division of Foods since it
has a higher number of damaged goods (Figure 9 – 1.740 failed cases). Finally, UJM
28 This is represented by the indicator Damaged Goods, which is explained in Appendix 1 - Key Performance Indicators.
5%
52% 16%
22%
5%
Figure 8 -‐ Picking Error -‐ Decemeber/13
Iglo
Lever
Personal Care
Foods
Knorr
2 342
3
1740
128
Iglo Lever Personal Care
Foods Knorr 0
500 1000 1500 2000
Figure 9 -‐ Transportation -‐ Damaged Goods -‐ December/13
Transportation -‐ Damaged Goods
30%
4% 66%
Figure 7 - Refusals - Warehouse & Transportation/13
Picking Error BestBeforeDate Transportation -‐ Damaged Goods
2 862
1 123
198
3 383
0
1 000
2 000
3 000
4 000
Customer Relationship Management
Order Management
Issues
Stock Availability
Warehouse and Transportation
Figure 6 - Refusals - December/13
Refusals

21
should renegotiate contracts with retailers by offering them incentives for the order of
standardized pallets, which could not only reduce the number of damaged goods (pallets
of just one product are better accommodated, reducing the probability of damage in
transportation) but also reducing the number of picking errors.
3.3.3 Internal Benchmarking between Category Division and Clients
In this last section it was compared the service performance level across UJM
supply chain major category divisions and across UJM main clients, which is analyzed
in Figures 10 to 15.
In Figure 10 it was used CCFOT indicator, which represents the percentage of
cases accepted by the client on time.29 Hence, in this chart it is possible to see the
evolution of performance (associated to CCFOT indicator) for each category division
over the year of 2013 (monthly). This indicator gives important data since it covers the
areas of quality and capacity of UJM supply chain. The category division that has the
lowest average performance was Personal Care, with CCFOT equal 94,84% (2013).
Source: Unilever database
29 This indicator is explained in Appendix 1 - Key Performance Indicators.
90%
92%
94%
96%
98%
100%
Jan/13 Fev/13 Mar/13 Abr/13 Mai/13 Jun/13 Jul/13 Ago/13 Set/13 Out/13 Nov/13 Dez/13
Figure 10 - CCFOT - Divisions
10 -‐ Iglo 30 -‐ Lever 31 -‐ Personal Care 50 -‐ Foods 52 -‐ Knorr
22
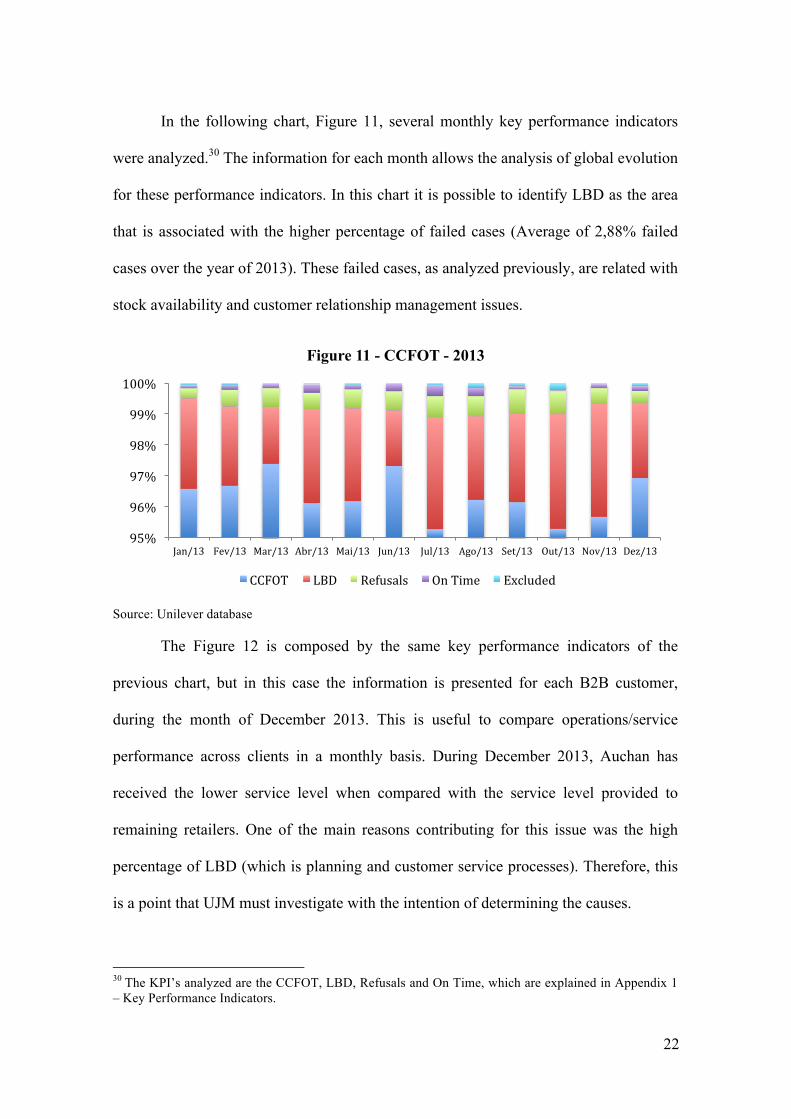
In the following chart, Figure 11, several monthly key performance indicators
were analyzed.30 The information for each month allows the analysis of global evolution
for these performance indicators. In this chart it is possible to identify LBD as the area
that is associated with the higher percentage of failed cases (Average of 2,88% failed
cases over the year of 2013). These failed cases, as analyzed previously, are related with
stock availability and customer relationship management issues.
Source: Unilever database
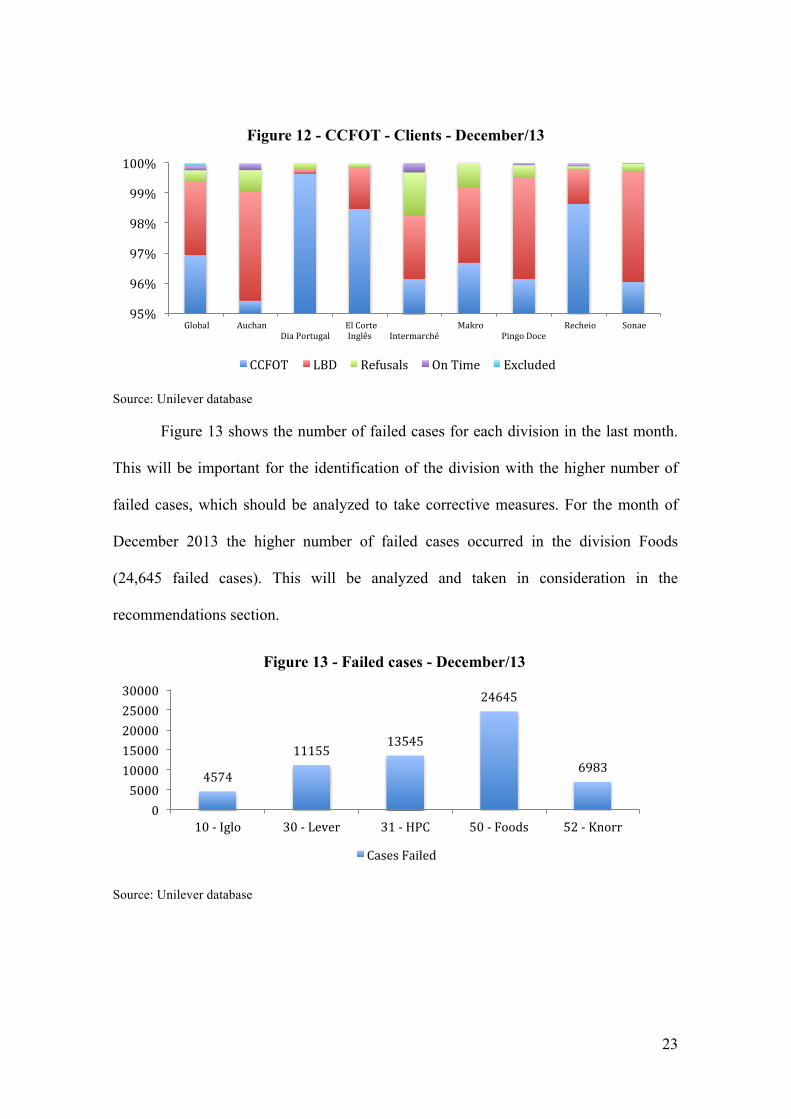
The Figure 12 is composed by the same key performance indicators of the
previous chart, but in this case the information is presented for each B2B customer,
during the month of December 2013. This is useful to compare operations/service
performance across clients in a monthly basis. During December 2013, Auchan has
received the lower service level when compared with the service level provided to
remaining retailers. One of the main reasons contributing for this issue was the high
percentage of LBD (which is planning and customer service processes). Therefore, this
is a point that UJM must investigate with the intention of determining the causes.
30 The KPI’s analyzed are the CCFOT, LBD, Refusals and On Time, which are explained in Appendix 1 – Key Performance Indicators.
95%
96%
97%
98%
99%
100%
Jan/13 Fev/13 Mar/13 Abr/13 Mai/13 Jun/13 Jul/13 Ago/13 Set/13 Out/13 Nov/13 Dez/13
Figure 11 - CCFOT - 2013
CCFOT LBD Refusals On Time Excluded
23
Source: Unilever database
Figure 13 shows the number of failed cases for each division in the last month.
This will be important for the identification of the division with the higher number of
failed cases, which should be analyzed to take corrective measures. For the month of
December 2013 the higher number of failed cases occurred in the division Foods
(24,645 failed cases). This will be analyzed and taken in consideration in the
recommendations section.
Source: Unilever database
95%
96%
97%
98%
99%
100%
Global Auchan Dia Portugal
El Corte Inglês
Intermarché
Makro Pingo Doce
Recheio Sonae
Figure 12 - CCFOT - Clients - December/13
CCFOT LBD Refusals On Time Excluded
4574
11155 13545
24645
6983
10 -‐ Iglo 30 -‐ Lever 31 -‐ HPC 50 -‐ Foods 52 -‐ Knorr 0
5000 10000 15000 20000 25000 30000
Figure 13 - Failed cases - December/13
Cases Failed

24
In Figures 14 and 15 it’s represented the service level provided to the 2 main
UJM clients during the year of 2013.31 This type of study does not only shows to see the
evolution of service level for each client over the year, but it also allows the comparison
of the service level provided to other clients; providing a benchmarking analysis.
Source: Unilever database
The previous charts reveal the service level provided by UJM to its clients
during the year of 2013 and set lower and upper control limits that will provide
guidance in the negotiation of Service Level Agreements with each retailer. These limits
were set through the development of statistic process control analysis, ensuring the
proper continuous improvement and control of core processes. In these charts it is also
perceptible a higher standard deviation regarding the service level performance
provided to Sonae, comparing with the one provided to Pingo Doce. Consequently,
Sonae has a higher range concerning the service level control limits. This difference
might be a consequence of a lower level of shared information compared to the one that
Unilever-JM has with Pingo Doce. Sonae can be uncomfortable to share certain
information, while Pingo Doce on the other hand – because it belongs to Jerónimo
31 The remaining charts with the service level provided to UJM clients during the year of 2013 is presented in the end of Appendix 2 – Tableau de Bord.
Jan/13
Fev/13
Mar/13
Abr/13
Mai/13
Jun/13
Jul/13
Ago/13
Set/13
Out/13
Nov/13
Dez/13 82%
84% 86% 88% 90% 92% 94% 96% 98% 100%
Figure 15 - CCFOT - Pingo Doce
Pingo Doce SLA-‐LCL SLA-‐UCL
Jan/13
Fev/13
Mar/13
Abr/13
Mai/13
Jun/13
Jul/13
Ago/13
Set/13
Out/13
Nov/13
Dez/13 82%
84% 86% 88% 90% 92% 94% 96% 98% 100%
Figure 14 - CCFOT - Sonae
Sonae SLA-‐LCL SLA-‐UCL

25
Martins, which is a partner of Unilever joint venture – might feel more comfortable with
this share of information.
Sonae and Pingo Doce are the two main Unilever-JM clients, retaining more
than 50% market share of retailers in Portugal (2013). These clients received the highest
and most consistent (lower variation) service level delivered by UJM, when compared
to the other remaining 6 major retailers (presented in Appendix 2 – Tableau de Bord).
This can be explained through the special attention and focus that Unilever-JM gives to
these two key clients, which leads to a higher quality of service level.32 However, in
order to deliver this high quality service, Unilever-JM increases costs of quality.33
The core processes’ performance of the supply chain was analyzed through the
Tableau de Bord measurement tool, as well as the benchmarking study regarding
retailers evaluations, perceptions and most important issues. So, in the next section, two
tables are presented with the consolidation of all results and continuous improvement
measures to take in order to improve and fulfill customers’ expectations.
5. Conclusions and Recommendations
In this last section, after having identified issues, causes and opportunities of
improvement regarding UJM supply chain core processes, it will be discussed
continuous improvement measures to improve UJM performance and service level
provided to retailers.
Therefore, the Table 3 is presented in order to consolidate the main issues for
each core process of UJM supply chain as well as the causes of them.
32 According to Withers & Ebrahimpour (2000) the eight dimensions of quality are: performance, features, reliability, conformance, durability, serviceability, aesthetics and perceived quality. 33 The Costs of Quality are: internal and external failure costs, appraisal costs and prevention costs. Source: Vukčević, M. 2008. Cost of Quality Management. International Journal for Quality Research, Vol. 2, No. 4, 297–303.

26
Table 3 – UJM Supply Chain Core Processes Issues and Causes
Processes Issues Causes
Planning
• High number of failed cases associated with Losses Before Dispatch
• Inaccurate forecasts • Failed cases due to stock
availabilities
• Low accuracy in the forecasting of customers demand (volatile demand and optimistic predictions)
• Communication issues between Unilever and its clients
• Lack of communication between processes • Sales team is not aware of planning constraints
Customer Service
• Failed cases due to customer relationship management issues
• Communication delay in letting customers know about changes in products
• Inefficient communication system
Logistics and Quality
Management
• Refusals • Late deliveries • Picking errors (specially in Lever
division) • Damaged goods (specially in
Foods division)
• Late placement of orders by customers • High number of SKU’s, which increases the
difficulty of differentiation between packages • Inefficient structures for the transportation of goods
(significant number of damaged goods during transportation to retailers)
The Table 4 characterizes the implementation plan of initiatives for the main
processes analyzed in Table 3. KPI’s were selected for each one of these core processes
(so as to establish targets and to measure the evolution of performance).
Table 4 – Implementation Plan
Processes KPI's Targets Priority Division Continuous Improvement Measures Time
Frame
Planning LBD -15% HPC
• Collaborative planning with retailers • Improve communication with customer
service and sales • Create new indicator to measure forecast
accuracy34
Medium term Stock
Availabilities - 40% Iglo
Customer Service
Customer Relationship Management
- 30% Lever and
HPC
• Improve communication systems with retailers
Medium term
Logistics and Quality
Management
Damaged Goods - 40% Foods
• Development of new infrastructures to be placed inside trucks to better accommodate goods during transportation to retailers35
• Renegotiation of contracts with retailers in order to offer incentives for the order of standardized pallets (reducing the picking)
• Create new indicator - Unload Orders36 • Possible reduction in the number of
SKU’s37 • Increase products packaging differentiation
Short and
Medium term
Picking Error - 30% Lever
On Time - 15% -
34 Forecast Accuracy (KPI) – in a monthly base UJM could measure the forecast accuracy of demand in order to check if it is necessary to develop a more accurate system for this purpose. 35 UJM has being developing these infrastructures (source: Meeting with Pedro Lopes - Director of Logistics Department – March 10th, 2014) 36 Unload Orders (KPI) – in a monthly base UJM should measure the average time it takes to unload customer orders, since in Benchmarking study 2013 it was found that this is an important issue for retailers. 37 The revision of portfolio management (Smart Complexity) was developed by Miguel Saraiva and Madalena Silveira at Unilever-JM in the Survivor project.

27
Finally, frequent meetings with retailers should be scheduled, with the objective
of knowing their perceptions about the service level provided by Unilever-JM and its
distributor partners.
Nevertheless, some of these continuous improvement measures will take time to
implement and others also need retailers’ acceptance. For instance, the collaborative
planning with retailers will require a share of information, which they might not feel
comfortable with (very sensitive information that can be used in an opportunistic and
improper way). Other example is the improvement of communication systems that will
certainly take time to change and implement.
The implementation of this performance measurement system, Tableau de Bord,
aims to help Unilever-JM increasing core processes performance through the
identification of opportunities of improvement in order to become the best of Portugal’s
sector. Examples of these processes improvements are the increase of planning
effectiveness, increase in sales forecast accuracy, reduction of damaged goods during
transportation and reduction of picking errors. This will be extremely important due to
the market environment where there is a high level of competition and an increasing
power of retailers.

28
References
ASQ. 2014. “Continuous Improvement”, retrieved from
http://asq.org/learn-about-quality/continuous-improvement/overview/overview.html
(accessed on May 3rd, 2014)
Averson, P. 1998. “The Deming Cycle”, Balanced Scorecard Institute, retrieved from
http://balancedscorecard.org/thedemingcycle/tabid/112/default.aspx
(accessed on May 4th, 2014)
Barney, J.B. 1991. “Firm resources and sustained competitive advantage.” Journal of
Management, 19, pp. 99-12
Bessant, J.; Caffyn, S. and Gallagher, M. 2001. An evolutionary model of continuous
improvement behaviour. Technovation, 21(2), 67–77.
Bourne, M.; Mills, J.; Wilcox, M.; Neely, A. and Platts, K. 2000. Designing,
implementing and updating performance measurement systems, International Journal
of Operations & Production Management, Vol. 20, Iss: 7.
Conradie, J. and Schutte, H. 2003. “Are Performance Measurements Relevant to
Municipalities?” in Accountancy Sa; Mar. Accounting & Tax Periodicals. Pp.17-18.
Epstein, M. J. and Manzoni, J. F. 1997. The Balanced Scorecard and Tableau De
Board: A Global Perspective on Translating Strategy into Action, in Management
Accounting (August). Pp. 28-36.
Kanji, G. K. 2002. “Performance Measurement System,” in Total Quality
Management, Vol. 13, No. 5, Pp. 715-728.
Kaplan and Norton. 1996. “The Balanced Scorecard: Translating Strategy Into
Action” Harvard Business Review Press.

29
Kennerley, M. and Neely, A. 2002. “A Framework of the Factors Affecting the
Evolution of Performance Measurement Systems,” in International Journal of
Operations & Production Management, 22(11): 1222-1245.
Lisiecka, K. and Czyż-Gwiazda, E. 2013. “Performance measurement models –
comparative review”.
Martensson, H. 2014. “The Chain Theory – the foundation of Eliyahu Goldratt’s
theory of constraints”, retrieved from
https://www.youtube.com/watch?v=FbX9kQa-_eQ&feature=related
(accessed on May 19th, 2014)
Moullin, M. 2003. 'Defining Performance Measurement,' in Perspectives on
Performance, 2(2): 3.
Nunes, P. 2012. “Tableau de Bord”, retrieved from
http://www.knoow.net/cienceconempr/gestao/tableau_de_bord.htm
(accessed on February 25th, 2014)
Rand, G. K. 2000. Critical chain: the theory of constraints applied to project
management. International Journal of Project Management, 18(3), 173–177.
Sequeira, T. 2012. “How to optimize the traditional retail market for FMCG sector? A
Regional approach for Unilever’s Business Model”.
Soeiro, F. C. 2012. “Session 4 – VRIO and TOC” in Operations Management course, at
Nova School of Business and Economics.
Soeiro, F. C. 2012. “Session 7 – Quality Management” in Operations Management
course, at Nova School of Business and Economics.
Soeiro, F. C. 2012. “Session 10 – Service Operations Management” in Operations
Management course, at Nova School of Business and Economics.

30
Stock, J. and Boyer, S. 2009. Developing a consensus definition of supply chain
management: a qualitative study. International Journal of Physical Distribution &
Logistics Management, 39(8), 690-711.
Striteska, M. and Spickova, M. 2012. “Review and Comparison of Performance
Measurement Systems”, Journal of Organizational Management Studies, 1 – 13.
Tung, A.; Baird, K. and Schoch, H.P. 2011. Factors influencing the effectiveness of
performance measurement systems, International Journal of Operations & Production
Management, Vol. 31, Iss: 12.
Unilever-JM Project. 2013. “Process Management and Change Plan”, Unilever-JM
Supply Chain Project Dossier developed at Nova School of Business and Economics.
Vukčević, M. 2008. Cost of Quality Management. International Journal for Quality
Research, Vol. 2, No. 4, 297–303.
Withers, B. and Ebrahimpour, M. 2000. Does ISO 9000 Certification Affect the
Dimensions of Quality Used for Competitive Advantage ? European Management
Journal, 18(4), 431–443.

31
Appendixes
Appendix 1 - Key Performance Indicators
The indicators used for the establishment of the performance measurement
system are the following:
1. Customer Case Fill, which represents the percentage of cases accepted by the client:
1.1. 𝐶𝐶𝐹 = !"#$# !"#$%#& !" !!! !"#$%&!"#$%&'( !"#$%&$' !"#$%&%'
×100
2. Customer Case Fill On Time, which represents the percentage of cases accepted by
the client on time:
2.1. 𝐶𝐶𝐹𝑂𝑇 = !"#$# !"#$%#& !" !!! !"#$%& !" !"#$!"#$%&'( !"#$%&$' !"#$%&%'
×100
3. Refusals, which represents the percentage of cases refused by the client:
3.1. 𝑅𝑒𝑓𝑢𝑠𝑎𝑙𝑠 = !"#$# !"#$%"& !" !!! !"#$%&!"#$%&'( !"#$%&$' !"#$%&%'
×100
4. Losses Before Dispatch, which represents the percentage of cases lost before
dispatch:
4.1. 𝐿𝐵𝐷 = !"#$# !!"# !"#$%" !"#$%&'!!"#$%&'( !"#$%&$' !"#$%&%'
×100
5. On Time, which represent the percentage of cases that arrived to client late (not
respecting the schedule agreed):
5.1. 𝑂𝑛 𝑇𝑖𝑚𝑒 = !"#$# !"# !"#$"%&'() !!! !"!!"#$! !"#$$%!"#$%&'( !"#$%&$' !"#$%&%'
×100
6. Excluded, which presents the percentage of failed cases that are not included in the
previous indicators:
6.1. 𝐸𝑥𝑐𝑙𝑢𝑑𝑒𝑑 = !"#!" !"# !"#$%"&"' !" !"#$%& !"#$%&'& !" !"#$%&'( !"#$%&'()*!"#$%&'( !"#$%&$' !"#$%&%'
×100
7. Damaged Goods, which represents the percentage of goods that suffered damages
during its transportation to client:

32
7.1. 𝐷𝑎𝑚𝑎𝑔𝑒𝑑 𝐺𝑜𝑜𝑑𝑠 = !"#$%& !" !"#"$%& !""#$ !"#$%& !"#$%&'"(#()'$!"#$# !"#$%"& !" !!! !"#$%&
×100
8. Best Before Date, which represents the percentage of goods not complying with the
expiration date rule:
8.1. 𝐵𝑒𝑠𝑡𝐵𝑒𝑓𝑜𝑟𝑒𝐷𝑎𝑡𝑒 = !""#$ !"# !"#$"%&'() !"#$ !" !"#$%&'$() !"#$!"#$# !"#$%"& !" !!! !"#$%&
×100
9. Picking Error, which represents the percentage of picking errors:
9.1. 𝑃𝑖𝑐𝑘𝑖𝑛𝑔 𝐸𝑟𝑟𝑜𝑟 = !"#$% !" !"#$"%& !""#"$!"#$# !"#$%"& !" !!! !"#$%&
×100
10. Stock Availability, which represent the total number of failed cases due to stock
availabilities.
The previous indicators should respect the following: 𝐶𝐶𝐹𝑂𝑇 + 𝐿𝐵𝐷 + 𝑅𝑒𝑓𝑢𝑠𝑎𝑙𝑠 + 𝑂𝑛 𝑇𝑖𝑚𝑒 + 𝐸𝑥𝑐𝑙𝑢𝑑𝑒𝑑 = 100%
33
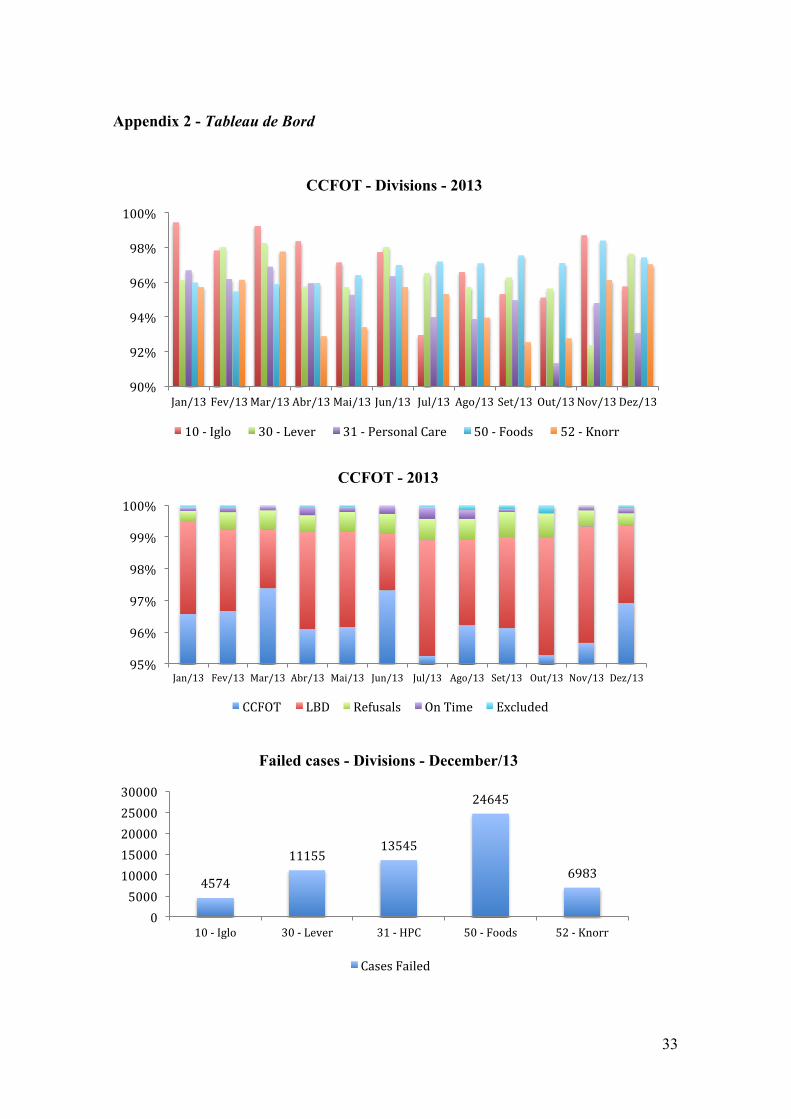
Appendix 2 - Tableau de Bord
90%
92%
94%
96%
98%
100%
Jan/13 Fev/13 Mar/13 Abr/13 Mai/13 Jun/13 Jul/13 Ago/13 Set/13 Out/13 Nov/13 Dez/13
CCFOT - Divisions - 2013
10 -‐ Iglo 30 -‐ Lever 31 -‐ Personal Care 50 -‐ Foods 52 -‐ Knorr
95%
96%
97%
98%
99%
100%
Jan/13 Fev/13 Mar/13 Abr/13 Mai/13 Jun/13 Jul/13 Ago/13 Set/13 Out/13 Nov/13 Dez/13
CCFOT - 2013
CCFOT LBD Refusals On Time Excluded
4574
11155 13545
24645
6983
10 -‐ Iglo 30 -‐ Lever 31 -‐ HPC 50 -‐ Foods 52 -‐ Knorr 0
5000 10000 15000 20000 25000 30000
Failed cases - Divisions - December/13
Cases Failed

34
95%
96%
97%
98%
99%
100%
Global Auchan Dia Portugal
El Corte Inglês
Intermarché
Makro Pingo Doce
Recheio Sonae
CCFOT - Clients - December/13
CCFOT LBD Refusals On Time Excluded
48 246
7 566 3 102 1 988
0
10 000
20 000
30 000
40 000
50 000
LBD Refusals On Time Excluded
Failed cases - December/13
Cases Failed
2 862
1 123
198
3 383
0
1 000
2 000
3 000
4 000
Customer Relationship Management
Order Management
Issues
Stock Availability
Warehouse and Transportation
Refusals - December/13
Refusals

35
2 342
3
1740
128
Iglo Lever Personal Care Foods Knorr 0
500
1000
1500
2000
Transportation -‐ Damaged Goods -‐ December/13
Transportation -‐ Damaged Goods
5%
52% 16%
22%
5%
Picking Error -‐ Decemeber/13
Iglo
Lever
Personal Care
Foods
Knorr
Jan/13
Fev/13
Mar/13
Abr/13
Mai/13
Jun/13
Jul/13
Ago/13
Set/13
Out/13
Nov/13
Dez/13 82%
84% 86% 88% 90% 92% 94% 96% 98% 100%
CCFOT -‐ Auchan -‐ 2013
Auchan
Jan/13
Fev/13
Mar/13
Abr/13
Mai/13
Jun/13
Jul/13
Ago/13
Set/13
Out/13
Nov/13
Dez/13 82%
84% 86% 88% 90% 92% 94% 96% 98% 100%
CCFOT -‐ Dia Portugal -‐ 2013
Dia Portugal

36
Jan/13
Fev/13
Mar/13
Abr/13
Mai/13
Jun/13
Jul/13
Ago/13
Set/13
Out/13
Nov/13
Dez/13 82%
84% 86% 88% 90% 92% 94% 96% 98% 100%
CCFOT -‐ El Corte Inglês
El Corte Inglês
Jan/13
Fev/13
Mar/13
Abr/13
Mai/13
Jun/13
Jul/13
Ago/13
Set/13
Out/13
Nov/13
Dez/13 82%
84% 86% 88% 90% 92% 94% 96% 98% 100%
CCFOT -‐ Intermarché
Intermarché
Jan/13 Mar/13 Mai/13 Jul/13 Set/13 Nov/13 82% 84% 86% 88% 90% 92% 94% 96% 98% 100%
CCFOT -‐ Recheio
Recheio
Jan/13 Mar/13 Mai/13 Jul/13 Set/13 Nov/13 82% 84% 86% 88% 90% 92% 94% 96% 98% 100%
CCFOT -‐ Sonae
Sonae
Jan/13
Fev/13
Mar/13
Abr/13
Mai/13
Jun/13
Jul/13
Ago/13
Set/13
Out/13
Nov/13
Dez/13 82%
84% 86% 88% 90% 92% 94% 96% 98% 100%
CCFOT -‐ Makro
Makro
Jan/13
Fev/13
Mar/13
Abr/13
Mai/13
Jun/13
Jul/13
Ago/13
Set/13
Out/13
Nov/13
Dez/13 82%
84% 86% 88% 90% 92% 94% 96% 98% 100%
CCFOT -‐ Pingo Doce
Pingo Doce

37
Appendix 3 - Threat of new entrants – Table 4
Industry Analysis Application of the Model of 5 Strengths of Porter
Contribution to the Strength
Ver
y L
ow
Low
Med
ium
Hig
h
Ver
y H
igh
Threat of new entrants Product Differentiation High 1 Low Brand Identification High 1 Low Others disadvantages of costs High 1 Low Capital need High 1 Low Cost of change to the customers High 1 Low Difficulty to access to distribution channels High 1 Low Protectionist Policies High 1 Low Difficulty to access to the technology need High 1 Low Difficulty to access to materials High 1 Low Experience effects High 1 Low Probability of retaliation by the existing companies High 1 Low 1 2 3 4 5
Global Value of the Strength Low 2,82 High
Appendix 4 - Bargaining Power of Suppliers – Table 5
Industry Analysis Application of the Model of 5 Strengths of Porter
Contribution to the Strength
Ver
y L
ow
Low
Med
ium
Hig
h
Ver
y H
igh
Bargaining Power of Suppliers
Number of suppliers in the industry High 1 Low
Importance of the industry as client High 1 Low
Cost of change of suppliers Low 1 High
Weight of the cost of the purchased products by the industry on the total costs Low 1 High
Importance of the quality of the products purchased Low 1 High
Degree of differentiation of the products purchased by the industry Low 1 High
Profitability of the suppliers High 1 Low
1 2 3 4 5
Global Value of the Strength Low 1,71 High

38
Appendix 5 - Bargaining Power of Customers – Table 6
Industry Analysis Application of the Model of 5 Strengths of Porter
Contribution to the Strength
Very Low
Low
Medium
High
Very High
Bargaining Power of Customers
Number of clients of the industry High 1 Low
Concentration of the clients in the industry Low 1 High
Average volume of the purchases by the customers Low 1 High
Cost to the customers to change suppliers High 1 Low
Weight of the cost of the products sold by the industry on the total costs of the customers Low 1 High
Importance of the quality of the products sold for the customers Low 1 High
Degree of differentiation of the products provided by the industry High 1 Low
Disposal of substitute products to the customers Low 1 High
Threat of vertical integration by the customers Low 1 High
Disposal of information for the customers about the industry Low 1 High
1 2 3 4 5
Global Value of the Strength Low 3,80 High
Appendix 6 - Threat of Substitute Products – Table 7
Industry Analysis Application of the Model of 5 Strengths of Porter
Contribution to the Strength
Ver
y L
ow
Low
Med
ium
Hig
h
Ver
y H
igh
Threat of Substitute Products
Disposal of substitutes Low 1 High
Cost for the clients to change to substitute products High 1 Low
Aggressiveness of the suppliers of substitute products Low 1 High
“Price-performance” relation of the substitute products compared to the industry Low 1 High
1 2 3 4 5
Global Value of the Strength Low 4,75 High
39
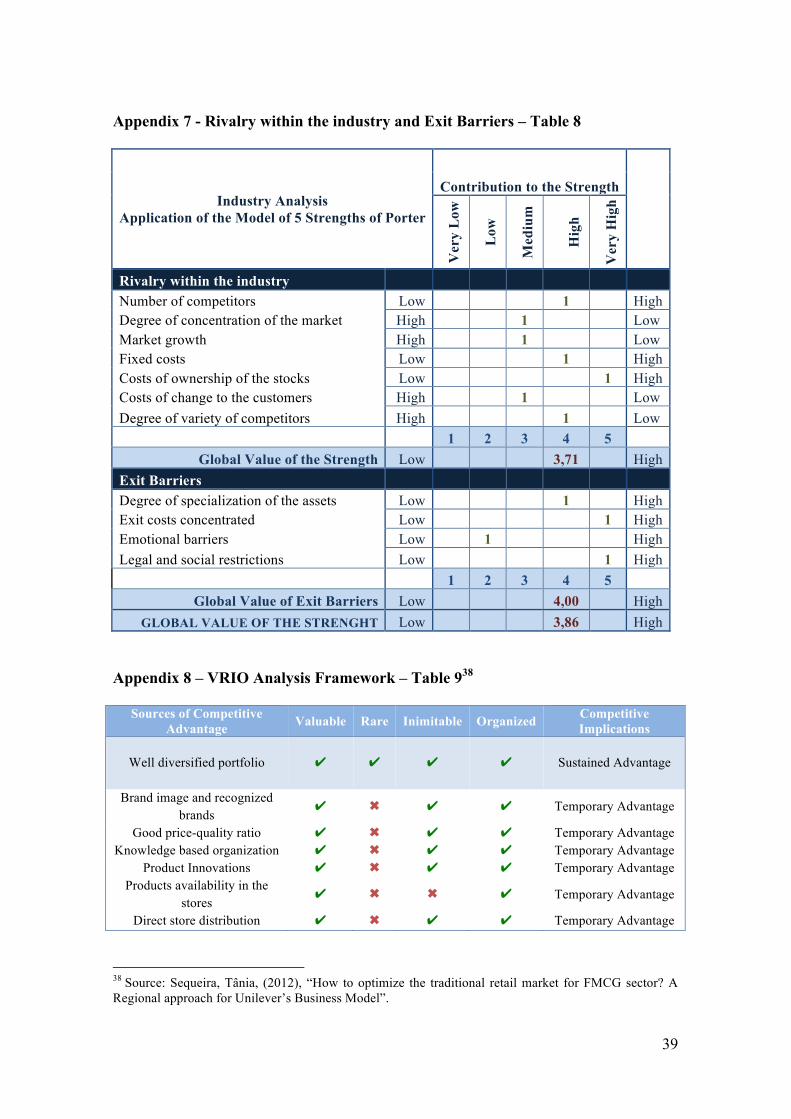
Appendix 7 - Rivalry within the industry and Exit Barriers – Table 8
Industry Analysis Application of the Model of 5 Strengths of Porter
Contribution to the Strength
Ver
y L
ow
Low
Med
ium
Hig
h
Ver
y H
igh
Rivalry within the industry Number of competitors Low 1 High Degree of concentration of the market High 1 Low Market growth High 1 Low Fixed costs Low 1 High Costs of ownership of the stocks Low 1 High Costs of change to the customers High 1 Low Degree of variety of competitors High 1 Low
1 2 3 4 5 Global Value of the Strength Low 3,71 High
Exit Barriers Degree of specialization of the assets Low 1 High Exit costs concentrated Low 1 High Emotional barriers Low 1 High Legal and social restrictions Low 1 High
1 2 3 4 5 Global Value of Exit Barriers Low 4,00 High
GLOBAL VALUE OF THE STRENGHT Low 3,86 High
Appendix 8 – VRIO Analysis Framework – Table 938
Sources of Competitive Advantage Valuable Rare Inimitable Organized Competitive
Implications
Well diversified portfolio ✔ ✔ ✔ ✔ Sustained Advantage
Brand image and recognized brands
✔ ✖ ✔ ✔ Temporary Advantage
Good price-quality ratio ✔ ✖ ✔ ✔ Temporary Advantage Knowledge based organization ✔ ✖ ✔ ✔ Temporary Advantage
Product Innovations ✔ ✖ ✔ ✔ Temporary Advantage Products availability in the
stores ✔ ✖ ✖ ✔ Temporary Advantage
Direct store distribution ✔ ✖ ✔ ✔ Temporary Advantage 38 Source: Sequeira, Tânia, (2012), “How to optimize the traditional retail market for FMCG sector? A Regional approach for Unilever’s Business Model”.