how to make money in dividend...
TRANSCRIPT
How to Make Money in DividendStocks
Edward Page Croft
This book is for sale at http://leanpub.com/dividend-stocks
This version was published on 2014-09-01
This is a Leanpub book. Leanpub empowers authors andpublishers with the Lean Publishing process. Lean Publishing isthe act of publishing an in-progress ebook using lightweight toolsand many iterations to get reader feedback, pivot until you havethe right book and build traction once you do.
©2014 Stockopedia
Contents
Introduction . . . . . . . . . . . . . . . . . . . . . . . . . 1
Chapter 1 . . . . . . . . . . . . . . . . . . . . . . . . . . . 4
Do dividend strategies work? . . . . . . . . . . . . . . . . 51. Dividends and dividend growth provide nearly 80
percent of stock returns . . . . . . . . . . . . . . . 62. Dividend reinvestment strategies provide blistering
compound gains . . . . . . . . . . . . . . . . . . . 73. High dividend yield strategies trounce the market… all
over the world . . . . . . . . . . . . . . . . . . . . 84. Dividend stocks provide 90 percent of themarket return
in bear markets . . . . . . . . . . . . . . . . . . . . 95. Dividend stocks are a great inflation hedge . . . . . . . 106. Dividend stocks are stronger and less volatile . . . . . 11But it’s not all rosy… . . . . . . . . . . . . . . . . . . . . 12
Chapter 2 . . . . . . . . . . . . . . . . . . . . . . . . . . . 13
When do dividend stocks work best? . . . . . . . . . . . . 14A rough guide to surviving market cycles . . . . . . . . . 14Dividend stocks – the only bear market winners? . . . . 16How to recoup bear market losses dramatically faster
through reinvestment . . . . . . . . . . . . . . . . 17
CONTENTS
Chapter 3 . . . . . . . . . . . . . . . . . . . . . . . . . . . 19
Three Pillars and Two Pitfalls . . . . . . . . . . . . . . . . 20
Dividend Yield - Crown Jewel or Emperor’s New Clothes 21Why do high yield stocks provide higher returns? . . . . 23Share Buybacks - the dividend yield’s blind spot? . . . . 27
Chapter 4 . . . . . . . . . . . . . . . . . . . . . . . . . . . 30
Dividend Safety - how to sleep better at night . . . . . . . 31The traditional approach to safety . . . . . . . . . . . . . 33A modern approach to safety . . . . . . . . . . . . . . . . 36A Technical approach to safety . . . . . . . . . . . . . . . 38
Chapter 5 . . . . . . . . . . . . . . . . . . . . . . . . . . . 41
Dividend Growth - a new holy grail? . . . . . . . . . . . . 42Why the Dividend Growth Streak matters . . . . . . . . 42The importance of compounding & Rule 72 . . . . . . . . 44Opposing pillars? The trade off between growth and yield 45
Chapter 6 . . . . . . . . . . . . . . . . . . . . . . . . . . . 48
The Two Worst Pitfalls for Dividend investors . . . . . . 49Pitfall 1: Failing to buy in tax-efficient wrappers . . . . . 49Pitfall 2: Failing to always reinvest dividends . . . . . . . 51
Chapter 7 . . . . . . . . . . . . . . . . . . . . . . . . . . . 54
A compendium of income strategies . . . . . . . . . . . . 55Strategy 1: Dogs of the Dow . . . . . . . . . . . . . . . . 56Strategy 2: Geraldine Weiss’ Yield Range . . . . . . . . . 58Strategy 3: HYP - High Yield Portfolio . . . . . . . . . . . 60
CONTENTS
Strategy 4: DGI - Dividend Growth Investing . . . . . . . 62Strategy 5: BSD - Big Safe Dividends . . . . . . . . . . . 64Strategy 6: SG Quality Income . . . . . . . . . . . . . . . 67
Chapter 8 . . . . . . . . . . . . . . . . . . . . . . . . . . . 70
Diversification - the only free lunch . . . . . . . . . . . . 71
Asset Allocation & Rebalancing . . . . . . . . . . . . . . . 74Determining need – the 4 percent Rule . . . . . . . . . . 74
The merits of dividend stocks vs bonds . . . . . . . . . . . 79Inflation looms - why the time for stocks is near . . . . . 80
When to sell . . . . . . . . . . . . . . . . . . . . . . . . . . 84Why sell ever? . . . . . . . . . . . . . . . . . . . . . . . 85
Chapter 9 . . . . . . . . . . . . . . . . . . . . . . . . . . . 91
Where to find dividend stocks . . . . . . . . . . . . . . . . 92The Quant Approach - Screening and Indices . . . . . . . 92Dividend History Indices . . . . . . . . . . . . . . . . . . 94The Scuttlebutt Approach . . . . . . . . . . . . . . . . . 95Piggybacking the best fund manager ideas . . . . . . . . 97
Chapter 10: Conclusion . . . . . . . . . . . . . . . . . . . 100
Chapter 11: Appendix . . . . . . . . . . . . . . . . . . . . 102
Dividend Basics . . . . . . . . . . . . . . . . . . . . . . . . 103
How to calculate dividend yield . . . . . . . . . . . . . . . 106
How to minimise dividend taxes . . . . . . . . . . . . . . . 108

CONTENTS
Other Dividend Strategies . . . . . . . . . . . . . . . . . . 113
Bibliography etc . . . . . . . . . . . . . . . . . . . . . . . . 117
Introduction
At the end of the twenty year bull market run-up to the millennium,the baby boom generation looked perfectly positioned to cash in.Their era had been a golden age for capital growth. But it couldn’tlast. Ever since equities have seesawed violently, growth has stalled,and a ‘perfect storm’ of economic and social factors has loomed evercloser that looks certain to force investors to dramatically changetheir approach to investment.
When capital growth looks uncertain, income and capital safetybecome a priority. As a result many investors have opted for thesupposedly ultra safe option of stashing their cash in governmentbonds as an alternative - despite modest, ever diminishing returns.
While government bonds (gilts in the UK) might appear to offera safe haven, the reality is that holding them at coupon ratespaying less than the rate of inflation guarantees a deterioration ofwealth. In his excellent book The Zeitgeist Investor, Tim Richardshas called this a form of ‘financial repression’. Governments arecannily planning to pay off the massive debts built up during thefinancial crisis by underpaying for loans while legislating to ensuredemand from pension funds.
Comfort in retirement relies on the income that can be generatedfrom their investments. But these economic conditions, the marketcycle and demographics are contributing to a paucity of returns ata time when income is at the forefront of the minds of a generation.
With many high quality dividend strategies offering compound
2
returns of more than five percent, it is perhaps unsurprising thatinterest in dividend paying stocks is rising. Unfortunately, investorknowledge about dividend stocks and strategies is not only deficientbut also littered with myths and misunderstandings. All too often,the message that investors are getting about dividend stocks is un-clear, with too much emphasis on the wrong things, little directionon what to look for or guidance on which stock selection methodsto employ to ensure lasting success.
Ironically, this knowledge gap is at odds with the dividend policyof UK PLC; dividend payouts from UK listed corporates are grow-ing. While corporates appear to be increasingly willing to rewardshareholders, it seems that many investors have yet to evolvetheir strategies accordingly to the new era. Average stock holdingperiods among private stock pickers are around eight months andit’s clear that many are still more concerned with short-term priceappreciation than long term dividend returns. That’s a great shame.
As we shall see, the volatile conditions that have plagued equitymarkets could well continue for many years to come. If investorstook to heart the truth, evidenced in the next chapter, that strategiesfocusing on solid dividend paying stocks will continue to producethe lion’s share of returns in these conditions then the early moversmay be hugely well rewarded. Not only will they benefit from thesizeable dividends paid but also from the capital growth that comeswith an expansion of P/E multiples, as more and more of the marketjoins in to inflate what may turn out to be a ‘dividend bubble’.
This book assesses the concepts behind dividend investing and thestrategies that investors can employ to build portfolios that canhelp them achieve their financial objectives. That means not onlylooking at why dividend stocks can deliver superior total returnsbut how to find them, what to look for, what to avoid and how tomanage a portfolio over the long term. It also includes insight intosome of the most effective dividend investment strategies and whythey work.
3
We have endeavoured to show investors how they can think strate-gically about dividend stocks. Knowing what to buy is an importantpart of this, but so is tackling tax, handling reinvestment and know-ing when to sell stocks and rebalance a portfolio. Ultimately, thisbook takes the dividend universe and distils it into an explanation ofwhy a strong focus on yield, growth and safety should give investorsa strategy that can excel in the long term regardless of the marketconditions.
More specifically, this book has been produced for subscribersof Stockopedia¹, which aims to give investors the essential data,fundamental analysis and screening tools they need to make well-informed decisions. At Stockopedia, we are firm advocates of anevidence-based approach to investing and of learning how to makesmarter investments. We aim to equip investors with the knowl-edge, data, resources and ideas that they need tomakemoney in anymarket. We hope that this short guide helps you in your dividendinvesting journey.
¹http://www.stockopedia.com

Chapter 1
Do dividend strategieswork?
“The deepest sin against the humanmind is to believe things withoutevidence” T.H. Huxley
In this chapter, we’ll share the hard research, maths and statisticsthat show how investing in dividend paying stocks has been amarket beating strategy whatever the environment, with the addedbenefit of lowering portfolio volatility and risk. While there isongoing disagreement about the exact level of contribution thatdividends make to stock market returns, there’s one thing that canbe agreed on - dividends, and their reinvestment, drive the majorityof the returns that investors receive in the stock market, especiallyover the long-term.
The evidence is incontrovertible. The trouble is that finding itrequires digging through volumes of generally rather dry and littleknown research notes on the subject written by obscure, ivorytowered, academics and quants. This is not a task for the fainthearted at all and is one of the reasons you will find that youraverage journalist or stock broker has almost zero knowledge onthe subject (while continuing to promote story stocks at readers orclients on a daily basis)!
But the legendary value investing firm of Tweedy Browne Inc hasdone investors a huge service. They have gathered and collated theresults of many of the greatest studies into stock market returnsoffered by dividend paying stocks into a single paper titled The HighDividend Yield Return Advantage. Some of the startling conclusionstaken from the research that it references and others that we havegathered include the following:
Do dividend strategies work? 6
1. Dividends and dividend growthprovide nearly 80 percent of stock
returns
The esteemed Robert Arnott published a paper titled Dividendsand the Three Dwarves in 2002 in which he analysed stock marketreturns over a 200 year period ending in 2002. He found that the totalcompound annual return for stocks over the period to be 7.9 percentper year. This broke down into a 5 percent return from dividends,a 0.8 percent return from real growth in dividends, a 1.4 percentreturn from inflation, and a 0.6 percent return from rising valuationlevels. Essentially the return from dividends ‘dwarfed’ the returnfrom all other sources – “dividends are the main source of the realreturn we expect from stocks”.
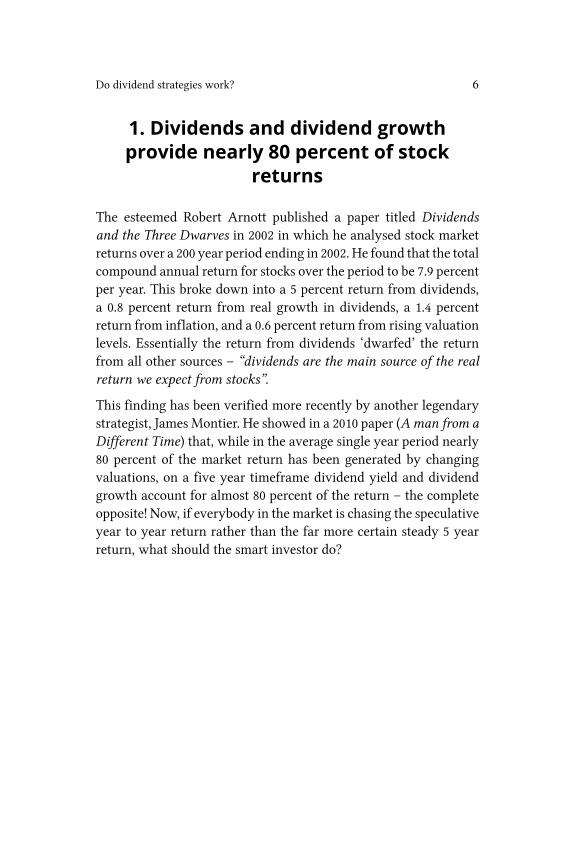
This finding has been verified more recently by another legendarystrategist, James Montier. He showed in a 2010 paper (Aman from aDifferent Time) that, while in the average single year period nearly80 percent of the market return has been generated by changingvaluations, on a five year timeframe dividend yield and dividendgrowth account for almost 80 percent of the return – the completeopposite! Now, if everybody in the market is chasing the speculativeyear to year return rather than the far more certain steady 5 yearreturn, what should the smart investor do?
Do dividend strategies work? 7
2. Dividend reinvestment strategiesprovide blistering compound gains
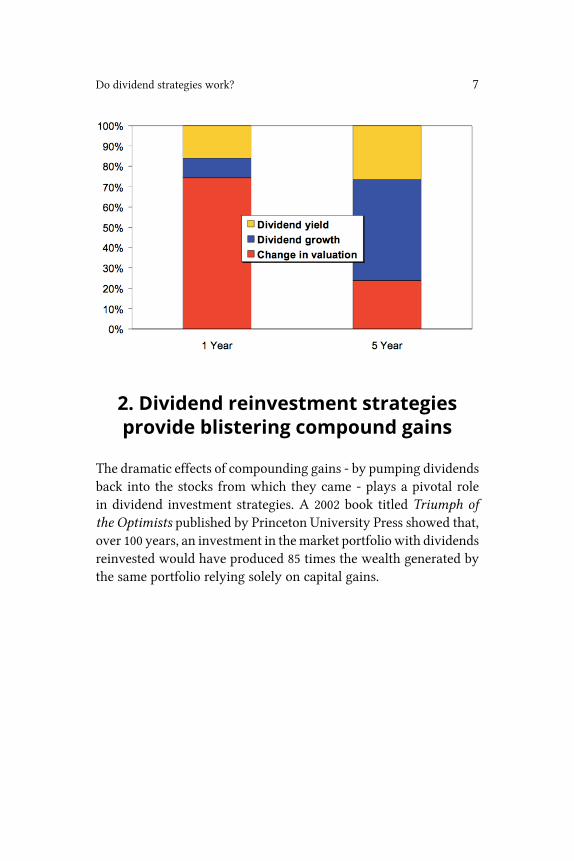
The dramatic effects of compounding gains - by pumping dividendsback into the stocks from which they came - plays a pivotal rolein dividend investment strategies. A 2002 book titled Triumph ofthe Optimists published by Princeton University Press showed that,over 100 years, an investment in themarket portfolio with dividendsreinvested would have produced 85 times the wealth generated bythe same portfolio relying solely on capital gains.
Do dividend strategies work? 8
Just as startling are the findings in the annual Barclays Equity GiltStudy. £100 invested into stocks at the end of World War II wouldhave been worth just £5,721 at the end of 2008 in nominal terms,but by reinvesting the dividends the same £100 would have grownto £92,460 – an astonishing 16 times the value!
Now granted, those not reinvesting dividends would have been en-joying extra disposable income during those years, but nonethe-less the cumulative impact of this strategy illustrates the awesomepower of compounding available through dividend reinvestment.
3. High dividend yield strategies trouncethe market… all over the world
While much dividend research is biased towards US stocks, theresults are magnified in the few studies into international stocks.Michael Keppler in 1991 set up a test to compare investing inhigh dividend yield stocks compared with low dividend yieldstocks ranked in deciles across an equal weighted portfolio of 18international indexes. The results were astonishing. The highestyielding portfolio returning 18.5 percent annually, compared with
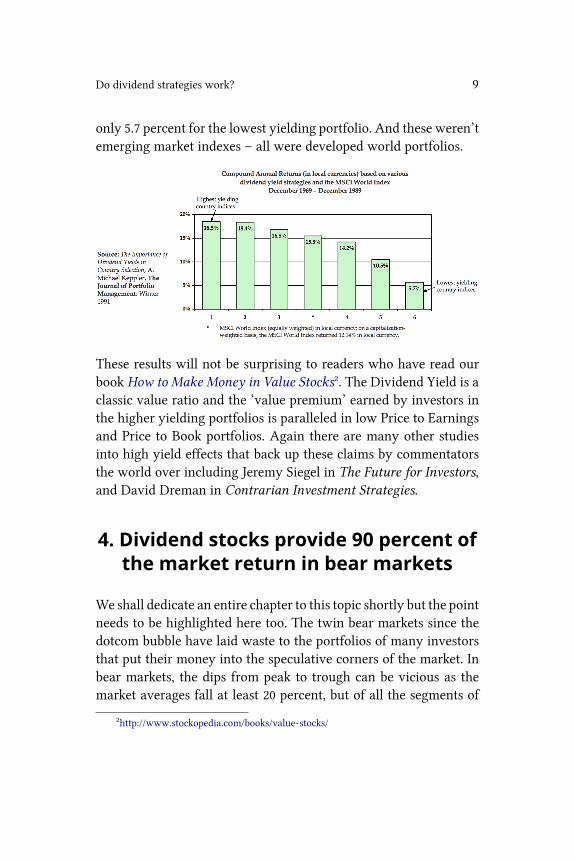
Do dividend strategies work? 9
only 5.7 percent for the lowest yielding portfolio. And these weren’temerging market indexes – all were developed world portfolios.
These results will not be surprising to readers who have read ourbook How to Make Money in Value Stocks². The Dividend Yield is aclassic value ratio and the ‘value premium’ earned by investors inthe higher yielding portfolios is paralleled in low Price to Earningsand Price to Book portfolios. Again there are many other studiesinto high yield effects that back up these claims by commentatorsthe world over including Jeremy Siegel in The Future for Investors,and David Dreman in Contrarian Investment Strategies.
4. Dividend stocks provide 90 percent ofthe market return in bear markets
We shall dedicate an entire chapter to this topic shortly but the pointneeds to be highlighted here too. The twin bear markets since thedotcom bubble have laid waste to the portfolios of many investorsthat put their money into the speculative corners of the market. Inbear markets, the dips from peak to trough can be vicious as themarket averages fall at least 20 percent, but of all the segments of
²http://www.stockopedia.com/books/value-stocks/
Do dividend strategies work? 10
the market, it’s high dividend stocks that perform most robustly insuch an environment.
In a study from 1970 to 1996 titled When The Bear Growls: BearMarket Returns, David Dreman calculated the average performanceof different segments of stocks in all the down quarters and com-pared them with the overall market. It was high yielding stocks(low price/dividend) that fared best, only declining half as much asthe overall market. In fact, more generally, Vitaly Katsenelsen dis-covered in Active Value Investing that through ‘sideways’ marketsdividend stocks actually account for up to 90 percent of the returnson offer from the stock market. In the light of that, it’s worth askingwho would want to invest in anything else during those times?
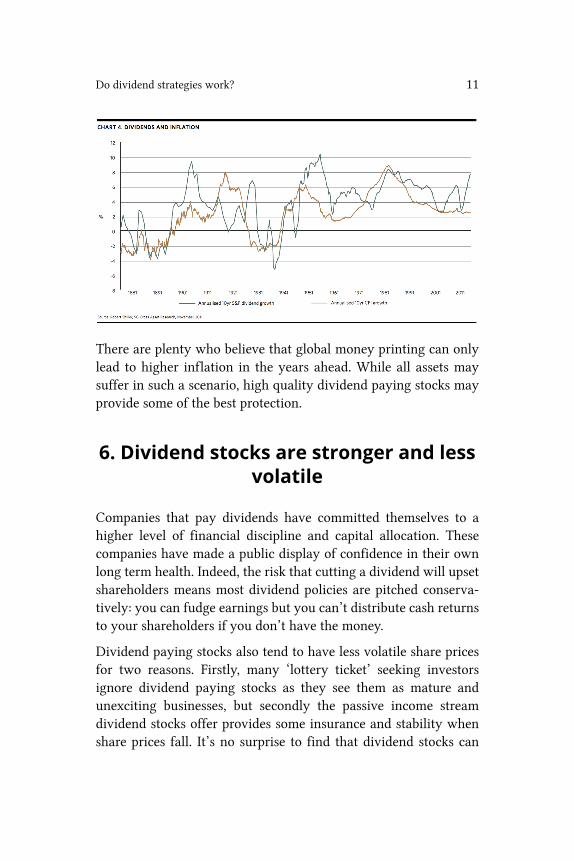
5. Dividend stocks are a great inflationhedge
Fixed income streams – such as the interest you receive from acorporate or government bond – can suffer greatly during timesof higher inflation. The reason is simply that the coupon receivedand principal returned is fixed and can’t grow as the inflation rategrows. Studies into equities have proven that the dividends paidby higher quality stocks do grow with inflation and sometimeseven outpace it. Companies are often able to pass on their higherinput costs to their customers allowing greater flexibility in raisingdividend payments and greater potential for capital growth. Thechart below from Societe Generale’s research team shows how thedividend growth rate has tracked the inflation rate overmany years.
Do dividend strategies work? 11
There are plenty who believe that global money printing can onlylead to higher inflation in the years ahead. While all assets maysuffer in such a scenario, high quality dividend paying stocks mayprovide some of the best protection.
6. Dividend stocks are stronger and lessvolatile
Companies that pay dividends have committed themselves to ahigher level of financial discipline and capital allocation. Thesecompanies have made a public display of confidence in their ownlong term health. Indeed, the risk that cutting a dividend will upsetshareholders means most dividend policies are pitched conserva-tively: you can fudge earnings but you can’t distribute cash returnsto your shareholders if you don’t have the money.
Dividend paying stocks also tend to have less volatile share pricesfor two reasons. Firstly, many ‘lottery ticket’ seeking investorsignore dividend paying stocks as they see them as mature andunexciting businesses, but secondly the passive income streamdividend stocks offer provides some insurance and stability whenshare prices fall. It’s no surprise to find that dividend stocks can
Do dividend strategies work? 12
often offer some of the highest returns at the lowest risk in themarket as a result - a very attractive pairing for mature investors.
But it’s not all rosy…
While we have certainly painted a rosy picture of dividend returnsin this chapter, there are a great number of mistakes that investorsmake in attempting to replicate these results. The biggest reasonswhy investors fail come down to their own risk and portfoliomanagement mistakes, most notably overtrading, failing to diver-sify effectively, failing to use tax efficient accounts, and failing toreinvest dividends. We shall cover these issues in far more detail inthe latter half of Part 3.

Chapter 2
When do dividend stockswork best?
“A cow for her milk, a hen for her eggs, and a stock, by heck, for itsdividends” John Burr Williams
The tech and trading boom of the last 30 years or so has createda breed of investors who disparagingly refer to dividend payingstocks as being for retirees, widows and orphans and who see thepayment of a dividend as a sure sign that a company has gone ‘exgrowth’. Meanwhile press and broker commentary fuel these atti-tudes by focusing on hope stocks, hole-in-ones and moon-shots.These attitudes are completely misguided. While the bull marketyears of the 1980s and 1990s certainly rewarded the average mar-ket speculator handsomely, the real winners in the bear markets ofthe last dozen years have been those that have rediscovered the artof dividend stocks.
A rough guide to survivingmarket cycles
To understandwhy dividend stocks perform sowell in bearmarkets,it is worth exploring what actually happens to equity valuationswithin them. In an excellent book called Little Book of SidewaysMarkets, Vitaliy Katsenelson provides a mental model to helpinvestors think about what drives the market over the long term.In essence, he illustrates with great effect how stock marketshave a tendency to move in long valuation cycles from extremeovervaluation to extreme undervaluation.
He begins by making the important distinction between cyclicalmovements in themarket, which last from several months to several
When do dividend stocks work best? 15
years, and secular movements, which last from five to 15 years.These cyclical bull and bear moves may be the prime focus of themedia, but really they are just shorter-term waves within broadersecular tides that take the market from high valuations (in terms ofP/E ratio) to low valuations and back again. Katsenelsen notes thatthese secular trends have tended to be what he categorises as eitherlong term bull markets or long term ‘sideways’ markets. The last100 years have seen four main bull markets, four sideways markets(each lasting 13 to 18 years) and one short secular bear market in theGreat Depression. Clearly, our current predicament is a sidewaysmarket with a long way still to run.
Howandwhy the P/E ratio drives these cycles: A simple equationto understand stock market return is as follows:
Return = Earnings Growth + Change in P/E + Yield
Historically during bull and sideways market periods the level ofearnings growth and dividends haven’t been much different – sothe prime reason for the long drift upwards or sideways in pricehas been a result of the P/E multiple expanding and contracting.
If you look at the historic series of peaks and troughs in P/E ratios,it sets quite a sobering scene. The P/E lows (based on trailing 10year average EPS) that were reached at the beginning of each bullmarket in the last 100 years have been 11x, 7x, 13x and 12x, butduring the long bull market from 1982 to 2000 the P/E ratio of theS&P 500 expanded enormously to hit 48x earnings! At peaks suchas this there’s only one way for the P/E ratio to go – down – andhistory shows it can take anywhere from one to several decades tobottom.
When do dividend stocks work best? 16
Dividend stocks – the only bear marketwinners?
Katsenelsen isn’t entirely pessimistic about the outlook for stocksin such an environment. He illustrates that between 1900 and 2000the average annual return from the S&P 500 was 10.4 percent,out of which 5.5 percent could be explained by dividends. Butthese returns were extremely lumpy depending on whether theprevailing environment was a secular bear or a secular bull. Hediscovered that in secular bull markets dividends accounted for only19 percent of annual average stock market returns (the rest comingfrom capital growth), whereas in sideways markets they accountedfor 90 percent of the returns.
In fact, many studies of equity markets since 2000 have confirmedthat dividend strategies have massively outperformed. Researchby Societe Generale has shown that the high quality, high yieldsegment of the market has more than doubled since 2000 versusmar- ket indexes that have stayed completely flat. Clearly under-standing the dynamics of bear markets and which stocks performwithin them can have a massive impact on your overall portfolioperformance.
These are wake up numbers for the typical equity investor whochases the annual ups and downs in the stock market with theworst timing – buying when markets rise and selling when theyfall. The truth is that investors need to start learning to act contraryto their instincts to take advantage of market declines. Not only candividend stocks provide extra return in lean times, but, as we shallsee in the next section, reinvesting those dividends back into themarket during market breaks can actually be hugely beneficial inthe long run as prices recover.
When do dividend stocks work best? 17
How to recoup bear market lossesdramatically faster through
reinvestment
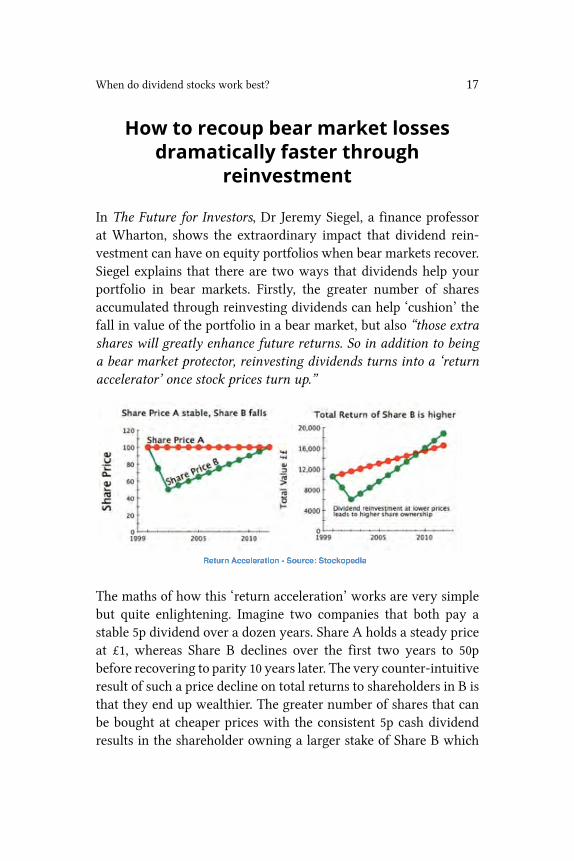
In The Future for Investors, Dr Jeremy Siegel, a finance professorat Wharton, shows the extraordinary impact that dividend rein-vestment can have on equity portfolios when bear markets recover.Siegel explains that there are two ways that dividends help yourportfolio in bear markets. Firstly, the greater number of sharesaccumulated through reinvesting dividends can help ‘cushion’ thefall in value of the portfolio in a bear market, but also “those extrashares will greatly enhance future returns. So in addition to beinga bear market protector, reinvesting dividends turns into a ‘returnaccelerator’ once stock prices turn up.”
The maths of how this ‘return acceleration’ works are very simplebut quite enlightening. Imagine two companies that both pay astable 5p dividend over a dozen years. Share A holds a steady priceat £1, whereas Share B declines over the first two years to 50pbefore recovering to parity 10 years later. The very counter-intuitiveresult of such a price decline on total returns to shareholders in B isthat they end up wealthier. The greater number of shares that canbe bought at cheaper prices with the consistent 5p cash dividendresults in the shareholder owning a larger stake of Share B which
When do dividend stocks work best? 18
ultimately ends up being worth more. It may well be that long termdividend investors really ought to welcome bear markets instead ofloathing them!
Further Reading
• The Future for investors³• Little Book of Sideways Markets⁴���
³http://www.amazon.co.uk/The-Future-Investors-Tried-Triumph/dp/140008198X⁴http://www.amazon.co.uk/The-Little-Book-Sideways-Markets/dp/0470932937

Chapter 3
Three Pillars and TwoPitfalls
In the next three chapters we are going to introduce and explain thethree key pillars that comprise many of the great dividend strategies– yield, safety and growth. We’ll introduce some important tech-niques and ratios that can be used to measure each factor and theways in which they can be combined to achieve a required market-beating return.
According to our statistics at Stockopedia, there were 804 dividendpaying companies in the UK market in 2011-2012 with a medianyield of 3.1 percent but in terms of £ sterling value, more than80 percent of total dividend payments were paid by just 15 bluechip FTSE 100 companies. On paper, that might imply that trackingdown suitable investment candidates is relatively straightforward.Unfortunately, things are rarely that simple. Dividend policy, or thecompany’s stated intentions when it comes to shareholder payouts,is heavily influenced bymanagement decision-making. That meansthere are psychological factors at play – from the decision toinitiate a dividend and make annual increases through to cuttingor even suspending payouts. Bearing in mind that even the biggestblue chips with the proudest dividend records can (and do) suffercatastrophes, then the job of the investor is complex. It’s a delicatebalance as we shall see.
Dividend Yield - CrownJewel or Emperor’s New
Clothes“Do you know the only thing in life that gives me pleasure? It’s tosee my dividends come in” John D Rockefeller
We all share the fantasy that we might stumble upon an unloved,misunderstood or otherwise incorrectly priced gem that’s just throw-ing off cash. In a low return world, who wouldn’t want to owna stock with a dividend yield of 10 or 12 percent? But while thedividend yieldmay be highly promoted in the financial press it can’tbe taken at face value. Its interpretation requires nuance withoutwhich the ‘chase for yield’ can lead to an exceptional amount ofpain.
In simple terms, the yield measures how much a company has paid(or will pay) in dividends relative to its share price. It is a crucialmetric for investors because, in the absence of any share price gains,the yield is the only return on investment for a stock. It also allowsinvestors to compare the relative income streams available betweenstocks and bonds.
But whereas the interest on a bond is fairly certain to be paid, thereis no such guarantee with dividends. While company managementare always reluctant to cut the prevailing level of dividends, at timesof crisis companies have to preserve cash. That makes the choicebetween defaulting on debt payments or cutting dividends an easyone.
Dividend Yield - Crown Jewel or Emperor’s New Clothes 22
The typical yield cycle
Successful listed companies generally travel through a cycle fromfledgling growth outfit to mature stalwart over many years andduring that time their dividend policies change substantially. In theearly growth period, dividends are rarely paid because stakeholdersoften prefer to see profits reinvested back into the business. Whencashflow starts being generated sustainably and reinvestment needslessen, dividend payments are initiated at a very low level (generallyat a 0.5 percent to 1 percent yield). From here, they can thenconsistently rise while still allowing enough cash to remain in thebusiness to fuel growth. Typically, the yield will then grow morequickly than earnings until the company reaches maturity, at whichpoint the yield reaches a sustained level of 4 percent or more andthe majority of profits are returned to shareholders each year.
Of coursemany companies run into trouble or go ‘ex-growth’ beforethey ever get to that stalwart stage - sometimes due to no fault oftheir own - andwhenever investors smell trouble they sell the stock,driving up the dividend yield in the process. As a result, the types ofcompanies that offer higher yields can be a mixture of both steadypayers as well as those that are unpopular, at business cycle lows orin states of distress.
As we saw in Part 1, the evidence suggests that this diverse groupof high yield stocks does generate anomalously high returns. Oneof the studies in the previously mentioned Tweedy Browne paperlooked specifically at the UK market over 35 years up until 1988and found that the highest yielding decile of stocks outperformedthe lowest yielding by almost 6 percent annually. In order to buildconfidence in an investment strategy that seeks to harvest this‘yield premium’ systematically, it’s worth understanding why theanomaly may persist and why there aren’t more investors chasingthe returns on offer.
Dividend Yield - Crown Jewel or Emperor’s New Clothes 23
Why do high yield stocks provide higherreturns?
Dividend yield investors are a curious lot - they usually prizecertainty of income over everything else. Pension funds especiallyare under pressure to pay out a constant stream of income and needtheir investments to bear expected fruit in order to match theirliabilities. So whenever a stock looks to be having trouble and at riskof suffering from a dividend cut, a large group of shareholders willstart to ask questions… “where will the yield end up?”, “will theseproblems continue?” and more importantly “how will we meet ourincome liabilities if the dividend is cut?”…
As a result many investors over-react to bad news in dividendstocks, feeling obliged to just dump their shares regardless of pricein order to reinvest in safer, more certain waters. These worries of-ten drive prices down too low for the risk, providing an opportunityfor canny contrarians.
If you do invest in these stocks you could be the beneficiary oftwo bangs for your buck. Even if a dividend cut does occur, youmay still end up getting a half-decent yield after all, but moreimportantly you could end up with a nice capital return to bootas the uncertainty surrounding the stock dissipates. But as is sooften the case in these situations, it takes the mentality of the valueinvestor to venture forth and pick up the returns left on the table.
Income investors aren’t all stupid - the troublewith high yield
While the group of income investors throwing away the veryhighest yielding stocks are leaving some return on the table forcontrarian vultures to pick up on, they do realise that the risksassociated with these stocks may not be worth the hassle. High risk,high yield dividend strategies come with a generally unpalatable
Dividend Yield - Crown Jewel or Emperor’s New Clothes 24
array of nasties that most investors don’t have the thickness of skinto cope with - perhaps that’s what high yield investors get paidfor dealing with. Let’s investigate four common high yield hazardsworth being aware of.
Hazard 1: The very highest yielders can be morevolatile
Whenever the market is expecting and pricing-in future problemsfor a company, the price can see-saw as the apparent size of thedividend becomes detached from the true expectations around thestock - analysts may be slow to downgrade their dividend forecastswhile the previous dividendmay be unrealistic to achieve again thisyear.
Let’s say that a stock’s annual dividend per share is £1 while thestock price is £10 per share to yield 10 percent. If the price of thestock plummets to £5 per share because of, say, cashflow problems,the new yield percentage is 20 percent (£1 dividend / £5 price).Whenscreening the market for stocks this might look really juicy to youbecause it looks like the yield is increasing. The problem with thislogic is that it actually rewards a stock for tumbling in price…
In this confusion over expectations, the highest yielding decile ofstocks can have a tendency to become vastly more volatile as newbuyers are lured in by the headline yield and recovery possibilities,while sellers become willing to throw it away at any price. Manyshareholders just can’t stomach that kind of the volatility in theirportfolios.
Be prepared to weather high volatility if investing inthe highest yielding stocks.
Dividend Yield - Crown Jewel or Emperor’s New Clothes 25
Hazard 2: High yields bring higher risk ofdividend cuts
Back in September 2008 Lloyds Banking Group was boasting ahead-turning yield of around 8 percent. Investment commentatorswere amusing themselves over the fact that the banking giant’sshares offered a stronger return than a Lloyds TSB internet saveraccount. However, the banking collapse that followed shortly af-terwards put Lloyds’ dividend loving shareholders to the sword.Stocks may be priced as bargains for a reason - the market thinksthe company is in trouble and is worried that the dividend can’t besustained or will be cut, as a result high yield stocks come with aprice-tag of increased risk and share price volatility.
Often, in the highest yielding segment of the market at least half thestocks will be paying more in dividends than they make in profits,if they make profits at all. Intuitively one would expect these stocksto be the most susceptible to dividend cuts, and the evidence doesseem to back this up.
A Credit Suisse study of S&P 500 stocks from 1980 through toJuly 2006 found that the 2nd and 3rd highest yielding decilesoutperformed the top yielding decile significantly. Similarly, Bankof America-Merrill Lynch divided Russell 1000 constituents intoquintiles from 1984 to 2010, again finding that the second highestyielding quintile provided the highest risk-adjusted returns. In otherwords the highest yielding stocks in the market actually don’t payout what you expect them to! They are the ultimate temptress.
Avoid picking stocks from the highest yielding decilein the market. Pick from the second, third or evenfourth highest decile preferentially.
Dividend Yield - Crown Jewel or Emperor’s New Clothes 26
Hazard 3: High yield strategies create sectorover-exposure
Companies within sectors have different policies when decidinghow much cash to pay out in the form of dividends. As legalmonopolies, utilities by their nature tend to have reliable revenueand high dividends, whereas technology and energy companiesgenerally need to reinvest their earnings. Focusing purely on build-ing a portfolio with high yield stocks could lead you to concentratetoo narrowly on one sector.
In a similar way, the best dividend payers in the market tend to bea handful of FTSE 100 companies. Focusing your portfolio on justthe high-yielders creates stock or sector-specific concentration risksthat can leave portfolios overexposed - as illustrated by the millionsof investors whose income was slashed when dividends were cut inthe banking crisis of 2008.
Some investors are happy to accept these kinds of risk – one suchexample is Neil Woodford (previously at Invesco) who has beenfirmly over-weight in the large-cap pharmaceuticals sector for sometime in order to pick up the attractive yields there. However, this is arisk that should be consciously undertaken based on a macro sectorview, rather than just assumed by accident.
Beware of becoming overexposed to specific sectorsin high yield strategies.
Hazard 4: High yield strategy returns can beinconsistent
There are contrarian voices heard against pure yield strategies, mostnotably in the very decorated academic Ken French. He discoveredthat high yield stocks have very variable returns depending on the
Dividend Yield - Crown Jewel or Emperor’s New Clothes 27
decade chosen. In some decades, notably the 1970s and 1990s, thehighest yielding stocks actually underperformed the lowest yieldingstocks. It appears that during inflationary periods or periods ofrising interest rates high yield stocks can behave much more likebonds and lose value. As we saw in the previous chapter, the bestconditions for investing in higher dividend paying stocks are duringsideways markets as bull markets tend to favour speculative growthstories. Don’t get caught pushing on a string!
Ensure thatmarket conditions favour strong dividendreturns before venturing into high yield strategies.
Share Buybacks - the dividend yield’sblind spot?
For many years, companies have been increasingly spending theirexcess cash on buying back their own shares in the open marketrather than just paying it out as cash dividends. These ‘buybacks’have increased massively in popularity since the early 1990s: be-tween 2000 and 2012 Next Plc returned over £2.6 billion to share-holders by way of share buybacks compared to only paying £1.2billion in dividends.
As a result the reported yields for many shares have fallen. As bothdividends and buybacks are designed to return cash to shareholdersit ought to be vital to factor buybacks into an overall dividend yieldanalysis - yet so many investors fail to do it.
Introducing the Net Payout Yield
One way to take advantage of this blind spot is to calculate the socalled ‘Net Payout Yield’. This is defined as the level of dividendsplus buybacks minus any share issuance divided by the company’smarket cap. A 2004 paper by US researchers Boudoukh, Michaely,
Dividend Yield - Crown Jewel or Emperor’s New Clothes 28
Richardson and Roberts found that the net payout yield was a“superior predictor of equity returns than simply using the dividendyield”. This has been confirmed in the book, Your Next Great Stock,where Jack Hough showed that between mid-1983 and the end of2005 using the Net Payout Yield would improve the returns of ahigh yield strategy by almost 3 percent per year. Clearly, whensearching for high yield stocks, not factoring in buybacks by usingthe Net Payout Yield maymean that youmiss out on some excellentopportunities.
Reasons for caution
While clearly the net payout yield is more comprehensive thanthe bare vanilla yield in some regards, there are reasons to remainsceptical that it should be given equal status in dividend strategies:
• Firstly, some high net payout yield companies may not payout a dividend at all, which could be a trap for those seekinghigh income.
• Secondly, buybacks may be initiated by management for thewrong reasons. Many management teams are encouraged toincrease earnings per share as part of their incentive plans.Initiating a buyback campaign reduces the number of sharesin issue, thus increasing EPS and therefore also their bonuses!
• Thirdly, buybacks are often mistimed. In 2012, ThomsonReuters⁵ examined returns on stocks in the S&P 500 in theperiods following buybacks and found that the majority ofcompanies un- der analysis had typically timed their buybackactivity poorly. As Warren Buffet has noted, “many CEOsnever stop believing their stock is cheap”.
• Finally, net payout yields are usually more volatile thandividend yields. As opposed to dividends, which generally
⁵http://alphanow.thomsonreuters.com/2012/01/stock-market-valuations-may-be-low-but-buying-still-has-its-risks/
Dividend Yield - Crown Jewel or Emperor’s New Clothes 29
require a long-term commitment to distributing surplus prof-its, buybacks can be made with a lot more flexibility and thencarried out (or suspended) as the managers sees fit.
Look before you leap!
Despite yield playing such a central role in dividend investing, it’simportant to realise that, by focusing on yield alone, you may beexposed to the vagaries of the market – not to mention the occa-sional disasters that may befall companies and sectors. Dividendyields which look too good to be true usually are. Reaching beyonda yield of 8 or 9 percent is not going to pay any further dividends.It’s actually more likely that you’ll receive less. As we’ll see in thenext chapter the dividend yield needs to be interpreted in light ofthe rest of the company’s financials to determine its safety andsustainability.
Further Reading
• Tweedy Browne – the Dividend Yield Advantage⁶• Aswath Damadoran: Investment Fables⁷• CSFB: High Yield and Low Payout⁸
⁶http://www.tweedy.com/research/papers_speeches.php⁷http://www.amazon.co.uk/Investment-Fables-Exposing-Strategies-Financial/dp/
0131403125⁸http://papers.ssrn.com/sol3/papers.cfm?abstract_id=946448

Chapter 4
Dividend Safety - how tosleep better at night
“The whole secret to winning and losing in the stock market is to losethe least amount possible when you’re not right” William O’Neill
While nothing can prepare the dividend investor for the kindsof disasters that have hit a handful of high yielding blue chipcompanies recently, there are some important steps that can betaken to minimize the risks we’ve been discussing. In particular,research by Societe Generale suggests that ‘financial robustness’ -defined as companies having strong balance sheets but also goodunderlying business economics - is a better indicator of dividendsustainability than even the dividend track record itself.
The irony is that giving up on the high yield dream and searchingfor more moderate yielders that promise greater dividend safetycan actually improve portfolio returns materially, while loweringvolatility to boot - a win-win proposition. We will shortly coversome of the traditional and modern approaches to assessing div-idend safety, but as the best offence is a good defence, let’s firstinvestigate the terrain of dividend cuts and traps as a prophylacticmeasure.
On dividend traps, cuts and other nasties
A dividend trap is a situation where a high headline dividend yieldlures unwitting investors into its snare only for them to discoverthat it was a temporary illusion. Broadly speaking, we can think ofthree perfect setups for a dividend trap which you should be awareof:
1. A Cow Feeding Itself Its Own Milk - where a company hasbad cashflow but attempts to maintain its dividend policy it
Dividend Safety - how to sleep better at night 32
may financing the payout with debt. This is highly likely toend in tears.
2. A Falling Knife - where an apparently compelling yield isactually the result of a substantial freefall in the share priceof a dividend paying stock. Because earnings ultimately drivedividends, a sustained drop in anticipated earnings usuallyforeshadows a dividend cut or, in severe cases, bankruptcy.
3. Fools Gold - where a company decides to pay a large oneoff dividend payment in one year without any intention forit to persist. This might be the result of a windfall, such as adisposal, and naive extrapolation of this payment level intothe future can lead investors astray.
As we’ll repeatedly hammer home, dividends are not certain cashflows and can be illusory. While CEOs do fear the repercussions ofcutting dividends, sometimesmanagement feel they have no choice.In 2011, 438 UK quoted companies paid a dividend, 59 of thoseactually cut their payouts while a further 31 firms cancelled theirpayments altogether bringing extremely unwelcome news for theshareholders involved.
Given the typical volatility in corporate earnings and cash flows, itmight seem surprising that we don’t see even more dividend cuts.Wouldn’t it be rational for firms to actively reassess howmuch theyshould pay in dividends as their prospects change? It seems not.In his classic 1956 study on dividend policy, Lintner interviewedcorporate managers and found: “a reluctance to reduce regular[dividend] rates once established and a consequent conservatismin raising [dividend] rates”. As a result, dividends tend to followa much smoother path than earnings - the variability from 1960to 2008 of year-to-year changes in dividends was just 5.2 percent,compared to 14.7 percent for earnings. Management are hell benton sustaining them.
You would think that paying an unsustainable level of dividendsis going to be worse for investors in the long term, especially if it
Dividend Safety - how to sleep better at night 33
leads to a dilutive capital raising. However, the evidence suggeststhat this simply doesn’t wash with investors. Research shows thatthe investor response to a dividend cut tends to be brutal. Severalstudies show that in 80 percent or more of cases, the stock prices offirms that cut dividends drop sharply at the time of the announce-ment. Furthermore, research by Michaely, Thaler and Womackfound that that stock prices then continue to drift downwards inthe weeks following a dividend decrease.
The traditional approach to safety
So given that dividend cuts have a tendency to reduce not onlyincome but also the capital value of the shares, it makes sense forinvestors to value safety above all else. One approach to assessingthis to rely on qualitative analysis aimed at identifying companieswith a sustainable competitive advantage and a robust operatingmodel. Warren Buffett likened businesses to castles at risk of siegefrom competitors and the marketplace. Great companies are ableto dig deep economic moats around their castles that becomeincreasingly impregnable to competition and market pressures.These moats bring either pricing power, scale advantages or costreductions which help sustain very high returns on capital, leadingto higher cashflows and returns for investors.
Judging a company’s “economic moat” is an important but time-consuming exercise. However, there are also some helpful financialratios and indicators that can be handy short-cuts to assessingfinancial robustness. Obviously excessively high yields and lack ofdividend history are key warning signs that all is not well, but hereare a few other key health indicators which should be monitoredclosely.
Dividend Safety - how to sleep better at night 34
Dividend Cover / Dividend Payout Ratio
Perhaps due to its simplicity and universality, the dividend coverhas earned a reputation among investors and analysts as the es-sential dividend health metric. It gives investors a quick fix onhow much a company is paying out in dividends in relation to theearnings it is generating. As we’ll see in the Strategies section, it’sso important that Charles Carlson gave it a 30 percent weighting inhis Big, Safe Dividend formulation.
It is easily calculated by dividing the earnings per share by thedividend per share (EPS/DPS). In the United States, they prefer toinvert this ratio and express it as a percentage which they call theDividend Payout Ratio (DPS/EPS).
The preferred level of dividend cover
The usual rule of thumb is that dividend cover of less than 1.5x mayindicate a danger of a dividend cut, while more than 2x is typicallyviewed as healthy. 1.5x cover is ultimately an arbitrary line in thesand, but it reflects the need for somemargin of safety. At a cover of1x or less, the company is distributing all of its earnings as dividendsand even dipping into reserves from previous years. That’s usuallya big red flag.
Because many companies are reluctant to cut payouts even ifprofit levels fall, dividend cover is a useful indicator of earningspersistence and financial health, particularly when tracked over along period of years. The issue of dividend cover only really comesto the fore when a stock looks vulnerable. Companies themselveswill often refer to their preferred level of cover in their overalldividend policy, which tends to get discussed in preliminary resultsand an- nual reports.
The debate over dividend cover
In spite of the above, there’s a lot of debate over whether investorsshould prefer a low or a high dividend cover.
Dividend Safety - how to sleep better at night 35
The traditional view is that, if a company is paying out too muchin dividends, it does not have the ability to reinvest profits backinto the business which could hurt the business’s growth prospectslonger-term. On this view, low dividend cover is bad whereas highdividend cover is good. In support of this claim, in 2006, analysts atCredit Suisse attempted to discover the optimum balance betweenyield and cover. What they found was that, between 1990 and 2006,S&P 1500 stocks with high yields and high dividend cover producedannualised returns of 19.2 percent – beating every other variationof payout ratio and yield. By comparison, over the same period theS&P 500 (large cap companies) delivered a return of 11.16 percent.
But in the opposite corner, in a 2003 paper entitled Surprise! HigherDividends = Higher Earnings Growth, US finance commentatorsRobert D. Arnott and Clifford S. Asness concluded that high rates ofdividend cover historically precede periods of low earnings growth.Essentially they showed that management of companies with lowdividend cover are forced into being more disciplined with theirretained profits. They become less likely to indulge in ‘inefficientempire building and the funding of less than ideal projects’ whichlead to ‘poor subsequent growth’ rates.
Regardless of which camp you are in it’s still likely to be worthchecking out the dividend cover. After all, dividend cover of lessthan 1 means that a firm paid out more than it earned as dividends– an unsustainable approach in the long-term!
Gearing
For investors who find the toing and froing over high or lowdividend cover confusing, an alternative is to focus more directlyon a company’s balance sheet strength and cashflow. Clearly, ifthe company is highly leveraged, and is having trouble meeting itsshort-term liabilities, then this is going to be a big red flag for thedividend. If the company has recently acquired another company,how did it finance this? Did it make a huge cash payment from itscash reserves or borrow money from banks?
Dividend Safety - how to sleep better at night 36
There are some rules of thumb that analysts like to use to assessbalance sheet strength. While we won’t go into too much detailhere, a safe level of gearing (debt to equity) on the balance sheetis generally considered to be 50 percent or less. While many arecomfortable with gearing of up to 100 percent the likelihood ofdefault obviously increases as the gearing rises. It is essential tolook at gearing levels in comparison to sector and industry normsas clearly high levels of gearing are more usual in some industriesthan others.
Other ratios
Other common ratios to use in assessing balance sheet strength in-clude watching the current ratio (current assets / current liabilities)which assesses the ability of the company to service short termdebts. A current ratio of less than one tends to be a worry.
A modern approach to safety
At Stockopedia⁹ we are big advocates of usingmore advanced quan-titative indicators to assess balance sheet and financial strength.The benefits of using checklists and algorithms are that they canweigh up many more ratios and indicators more effectively than atypical traditional approach, and don’t suffer the inherent bias andoverconfidence that can plague human judgement.
Our eyes were really opened to the possibilities of using theseindicators in dividend strategies by the astonishing results of SocieteGenerale’s Quality Income Index. We go into its construction inmore detail in the Strategies section, but in a nutshell by filteringhigh yield stocks using a quality score (specifically the F-Scoredescribed below), and a balance sheet risk score they were ableto improve the returns from equities since 1990 from a market
⁹http://www.stockopedia.com
Dividend Safety - how to sleep better at night 37
average of 5.6 percent to a remarkable 11.6 percent annualised ata significantly reduced volatility.
Assessing financial robustness - The PiotroskiF-Score
The primary indicator used by SocGen to assess quality is anindicator known as the F-Score. A nine test checklist¹⁰ that isapplied to a company’s financial statements as developed by JosephPiotroski, now associate professor of accounting at the StanfordUniversity Graduate School of Business. A company either passesor fails each of the nine tests adding up to create a score betweenzero and nine.
Each of these rules looks at one aspect of a company’s financials,with six of the nine rules looking at the change in a company’sfinancials. Whereas most ratios (e.g. dividend cover) look solely ata company’s current financial state, the F-Score looks more deeplyinto the direction in which it’s financial state is moving, and hereinlies it’s secret sauce - it captures fundamental momentum, earningsquality and balance sheet strength in a single very smart number.
Piotroski found that any stocks scoring 8 or 9 points had a tendencyto massively outperform companies with scores in the 0-2 range ina test by 7.5 percent annually over 20 years. These findings thathave been confirmed in live tracking tests in our model portfolioson Stockopedia.
Assessing Balance Sheet Strength - The AltmanZ-Score
Rather than look at gearing and interest cover ratios, SocGen useda ‘distance to default’ measure to assess balance sheet risk in theirpaper. Thismethodology is lesser known and numbers aren’t widely
¹⁰http://www.stockopedia.com/apps/piotroski/
Dividend Safety - how to sleep better at night 38
dispersed but a commonly used alternative used by credit analystssince the 1970s. It was developed by Professor Edward Altman andis known as the Z-Score.
There are several forms of the Z-Score for different classes ofcompany but essentially they come down to the same thing – acompany with a low Z-Score signals a high probability of financialdistress over the next 12 months. It weights four or five strictbalance sheet factors¹¹ into a single number that can be easilyinterpreted. Clearly avoiding companies such as these makes sensefor the keen dividend investor.
In the Strategies section, we’ll also discuss a custom algorithmknown as the ‘BSD’ formula for finding high safety dividend payingstocks. While not ‘academically’ derived, it again illustrates thatmodern approaches to dividend safety are evolving beyond simpleratio analysis.
A Technical approach to safety
There are many technical analysts and efficient market theoristswho would swear that all market information is held within acompany’s share price. No matter how much regulators wouldwish otherwise, different investors have different information anda collapsing share price on no news is a huge red flag. The followingindicators are all useful factors in any sound approach to dividendsafety.
1. Does the share price have good relative strength? Thischeck is used by US research firm Russell Research as partof its Russell High Dividend Yield Index Series. In order toprotect against the price “freefall” dividend trap, they filterout the bottom 10 percent of stocks based on 12 month price
¹¹http://www.stockopedia.com/apps/altman/
Dividend Safety - how to sleep better at night 39
momentum. In a similar vein, a Charles Schwab study rankedthe highest yielding stocks by 6-month price momentum,divided them into five segments, and found that highestyield stocks with the highest 6-month price momentumoutperformed all the other momentum segments. Yet again,these studies show that price momentum works - even withdividend strategies.
2. Is it a low volatility (beta) stock?Another measure you canuse to judge a potential dividend candidate is its “beta”. Usedby traders, beta measures howmuch the stock price moves upand down relative to the whole market. A “high” beta stock(more than 1) is generally more volatile and prone to widerswings in either direction compared to the broad market,while a stock with a “low” beta (less than 1) is generallymore ‘boring’, less volatile and less likely to excite mostequity investors. Of course when things are boring, there’sa systematic tendency to leave them underpriced, which canin turn lead to higher future returns. Like anything, it’s nota silver bullet and beta has always had its critics. Even a lowbeta stock could tumble in price or suffer financial troublesbut, in general, it looks more likely that a high beta stock witha toppy yield could turn out to be a dividend trap.
3. Is the market cap big enough? The small cap market isof course a wonderful hunting ground for potential marketinefficiencies but, notwithstanding the recent lessons fromthe banking sector, it remains true that larger-cap companiestend to be more stable. Work by Bank of England analystsAndrew Benito and Garry Young has found that the smallerscale of a business is correlated with an increased chance ofa dividend cut, so it’s important to measure the potentialgreater capital gains against the increased risks of capitaldestruction.
Our recommendation for income investors seeking safety is to usea combination of the above techniques. It is worth factoring in both
Dividend Safety - how to sleep better at night 40
traditional safety measures such as good Dividend Cover combinedwith modern filters such as the F-Score to avoid companies at highrisk of default. Focusing on large, low volatility stocks will alsoensure that you aren’t exposing yourself to the perils of the highestyielding, highest risk segments of the market.
Further Reading
• Surprise! Higher Dividends = Higher Earnings Growth¹²• One Indictor to Rule Them All: The Piotroski F-Score¹³
¹²http://papers.ssrn.com/sol3/papers.cfm?abstract_id=390143¹³http://www.stockopedia.com/content/one-indicator-to-rule-them-all-the-piotroski-
f-score-66530/

Chapter 5
Dividend Growth - a newholy grail?
“Here’s a simple way to succeed on Wall Street: buy stocks from theMoody’s [Dividend Achievers] list and stick with them as long asthey stay on the list” Peter Lynch
While factoring dividend safety into high yield strategies is clearlya smart move in terms of improving returns, another school ofthought favours a focus on dividend growth. Rather than priori-tising the highest yield plays, Dividend Growth Investors aim toselect stocks that may offer a lower initial yield but have a historyof growing that payout over time. The emphasis here tends to beless on the absolute rate of compound dividend growth over timeand more on the number of consecutive years of dividend increases- known as a dividend growth streak.
Why the Dividend Growth Streakmatters
As we’ve discussed, companies with growing dividends are sig-nalling confidence about their future earnings. They tend to bestable businesses, which are well positioned in their industries andare able to perform throughout market cycles. More specifically,a steadily growing dividend streak is an important signal for thefollowing reasons:
1. It provides a rich seam of information about the stability ofcompany management, the corporate culture and whetherthe dividend is important to the company even in times offinancial stress.
Dividend Growth - a new holy grail? 43
2. It maximizes the potential for dividend reinvestment.3. It is an indicator of management confidence in cash flow.4. It provides protection against the dreaded effects of inflation.
In a 1985 paper entitled A Survey of Management Views on Divi-dend Policy, US academics Baker, Farrelly and Edelman found thatmanagement were ‘highly concerned with dividend continuity’ andfelt that dividend policy affected share value. The findings talliedwith the seminal 1950s paper by Lintner we discussed previouslywhich outlined a behavioural model whereby managers typically‘smoothed’ dividend increases over time and only made upwardchanges when they were sure that earnings could support theincrease.
In other words, companies think very carefully before implement-ing and then increasing dividends, so this is an important sign toinves- tors in search of dividend longevity, reliability and growth.
The past can be a signal…
Of course, investors are routinely drilled on the risks of extrapo-lating too much from the past when trying to predict the futureperformance of a stock – but when it comes to dividends, the pastcan be a useful guide. Ned Davis Research discovered that overthe past 40 years stocks in the S&P 500 index that had increasedtheir dividend payouts annually averaged a 9.4 percent annualisedreturn, whereas companies that paid a dividend but didn’t increasethat payout had an annualized return of about 7 percent.
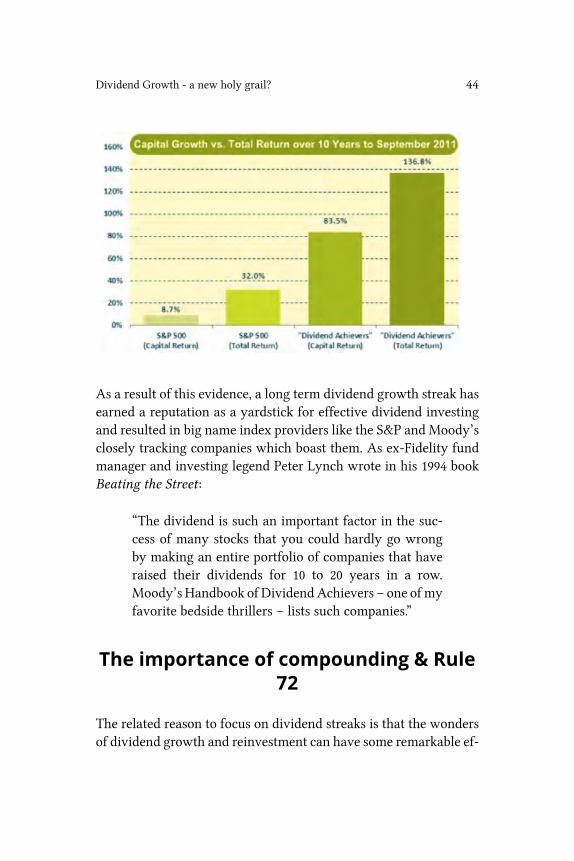
Similarly, the following M&G Investments chart shows the totalcumulative return from the S&P 500 Index in the ten years to 2011,including the reinvestment of dividends, as 32 percent. However, ifyou put cash solely into US companies that grew their dividends forat least 25 consecutive years, the total return was over 136 percent.
Dividend Growth - a new holy grail? 44
As a result of this evidence, a long term dividend growth streak hasearned a reputation as a yardstick for effective dividend investingand resulted in big name index providers like the S&P and Moody’sclosely tracking companies which boast them. As ex-Fidelity fundmanager and investing legend Peter Lynch wrote in his 1994 bookBeating the Street :
“The dividend is such an important factor in the suc-cess of many stocks that you could hardly go wrongby making an entire portfolio of companies that haveraised their dividends for 10 to 20 years in a row.Moody’s Handbook of DividendAchievers – one ofmyfavorite bedside thrillers – lists such companies.”
The importance of compounding & Rule72
The related reason to focus on dividend streaks is that the wondersof dividend growth and reinvestment can have some remarkable ef-
Dividend Growth - a new holy grail? 45
fects over the long term. A friend once remarked that the dividendshe received from his investment in the shares of the UK pawnbrokerAlbermarle & Bond were now worth more than his entire initialinvestment. That is a classic example of the real power at the heartof any form of stock market success and something that WarrenBuffett has called the “eighth wonder of the world” - the power ofcompound growth. At a 15 percent growth rate your annual returnwill be greater than your initial stake in the 16th year.
Investors have an affection for calculating how long it will take todouble the value of their investments – and this can be done veryeasily with dividend growth stocks. Using what’s known in financecircles as Rule 72, you can get an instant fix on how many yearsit will take a dividend stock to double. In simple terms here’s howit works. If you invest £1,000 in a stock with growth of 6 percentper year, the Rule 72 calculation would involve dividing 72 by 6⇒12 years. That’s roughly 12 years for the investment to be worth£2,000.
We will look more closely at a few dividend growth strategies inthe next section, however, it’s important to note that assessing thefuture dividend growth prospects of a company should not just be amechanical exercise based on the company’s historical track record.It also involves focusing on a company’s ability to sustainablyincrease its cash flow – which requires hard graft and diligence tounderstand the quality of the underlying business franchise.
Opposing pillars? The trade off betweengrowth and yield
Of course, it would be ideal to combine a very high yield with a longdividend growth streak. Unfortunately, those kinds of opportunitiesdon’t come around very often. So – if given the choice - how shouldan investor decide between, say, a stock with a 2 percent yield
Dividend Growth - a new holy grail? 46
increasing at 10 percent a year, versus a stock with a 6 percent yieldincreasing at only 5 percent a year. Which is better?
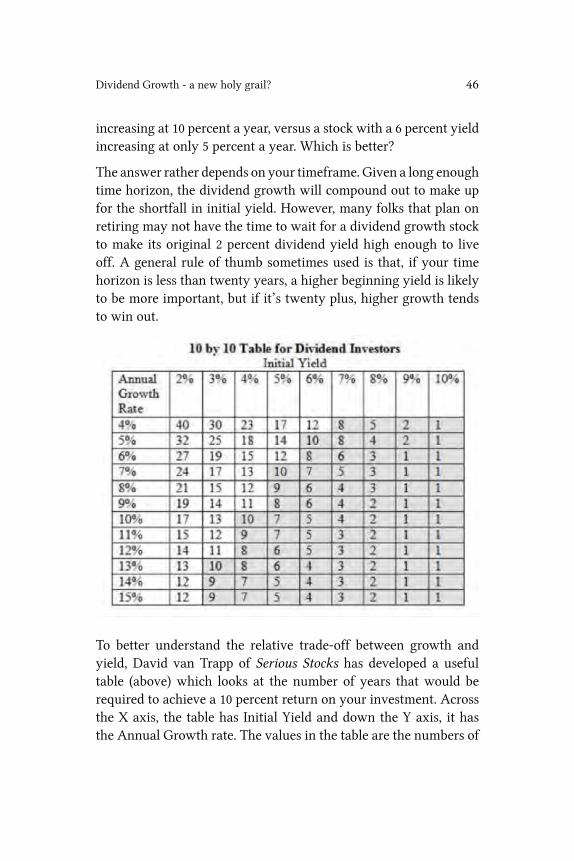
The answer rather depends on your timeframe. Given a long enoughtime horizon, the dividend growth will compound out to make upfor the shortfall in initial yield. However, many folks that plan onretiring may not have the time to wait for a dividend growth stockto make its original 2 percent dividend yield high enough to liveoff. A general rule of thumb sometimes used is that, if your timehorizon is less than twenty years, a higher beginning yield is likelyto be more important, but if it’s twenty plus, higher growth tendsto win out.
To better understand the relative trade-off between growth andyield, David van Trapp of Serious Stocks has developed a usefultable (above) which looks at the number of years that would berequired to achieve a 10 percent return on your investment. Acrossthe X axis, the table has Initial Yield and down the Y axis, it hasthe Annual Growth rate. The values in the table are the numbers of
Dividend Growth - a new holy grail? 47
years of compounding required to achieve the target return. The 10percent targeted return is an arbitrary number but it is used on thebasis that it’s a healthy return, almost equal to the long-term totalreturn of the stock market.
If we take the scenario discussed above, the table suggests that a2 percent yield compounding at 10 percent a year would take 17years to reach a 10 percent return on investment. By comparison,a 6 percent yield increasing at 5 percent a year would take just 12years.
Don’t accept too low a yield in dividend growthstocks
AsVanKnapp notes: “An additional 1 percent in initial yield reducesby 2 percent to 4 percent the growth rate needed to reach 10 percentyield on cost in a given time”. He argues that this is importantsince, the faster you hit your targeted yield on cost, the fewer yearsyou are subject to the risk that you have overestimated its rate ofdividend growth. This analysis suggests that it simply isn’t worthchasing stocks with yields as low as 1-1.5 percent, however fastthey are growing. It will just take too long to get to the targetedreturn. Admittedly this analysis doesn’t factor in the impact ofreinvesting dividends and it ignores the rising share prices thatare often associated with growing dividends. Still, one of the keyconclusions from this table is that, percent-for-percent, the initialyield carries more weight than the dividend growth rate.
Further Reading
• 10 by 10: The Interaction of Dividend Yield and Growth¹⁴
¹⁴http://seekingalpha.com/article/261754-10-by-10-the-interaction-of-dividend-yield-and-growth

Chapter 6
The Two Worst Pitfalls forDividend investors
“I wish it grew on trees, but it takes hard work to make money” JimCramer
In the last few chapters, we’ve rammed home the truth that in-vesting in high yield stocks comes with a lot of risk - especiallyof dividend cuts and volatility - but there are two other temptressesthat dividend investors often fall for to their detriment. We mustbang the table at this point because, without taking the followingtwo lessons to heart, the expected returns of long term dividendinvesting could be found to be a complete mirage.
Pitfall 1: Failing to buy in tax-efficientwrappers
It’s important to remember almost all those stellar gains reportedin the research reports do not account for tax! In the real world,dividends are taxed as income which is higher than capital gainstax thus creating a massive drag on reported returns.
Income taxes are high!
Historically, dividends have almost always been taxed more puni-tively than capital gains. According to research by Legg MasonCapital, in the US over the last 50 years dividends have been taxedon average at a rate of 50 percent. Meanwhile in the UK, dividendsare taxed on a sliding scale according to your income band meaningthat top-rate tax payers pay an awful lot more (36.1%+) for dividendincome than capital gains (20%).
The Two Worst Pitfalls for Dividend investors 50
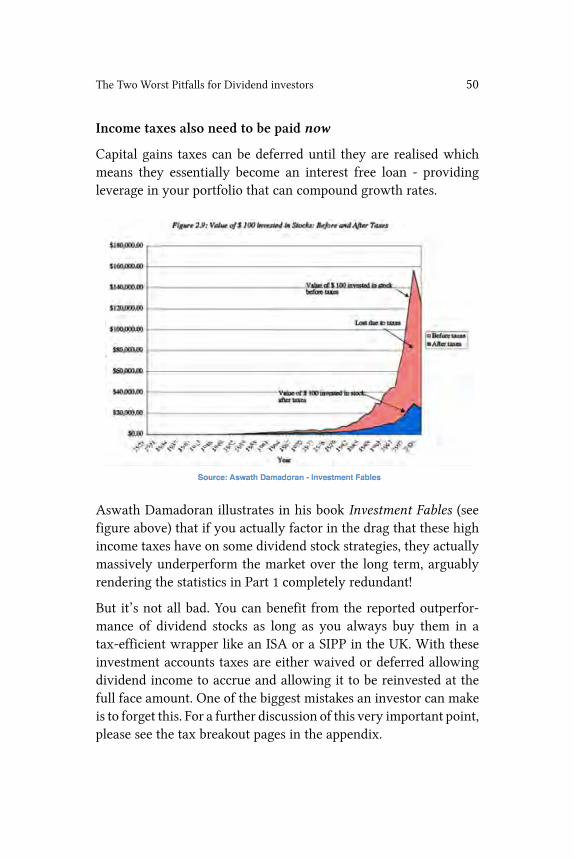
Income taxes also need to be paid now
Capital gains taxes can be deferred until they are realised whichmeans they essentially become an interest free loan - providingleverage in your portfolio that can compound growth rates.
Aswath Damadoran illustrates in his book Investment Fables (seefigure above) that if you actually factor in the drag that these highincome taxes have on some dividend stock strategies, they actuallymassively underperform the market over the long term, arguablyrendering the statistics in Part 1 completely redundant!
But it’s not all bad. You can benefit from the reported outperfor-mance of dividend stocks as long as you always buy them in atax-efficient wrapper like an ISA or a SIPP in the UK. With theseinvestment accounts taxes are either waived or deferred allowingdividend income to accrue and allowing it to be reinvested at thefull face amount. One of the biggest mistakes an investor can makeis to forget this. For a further discussion of this very important point,please see the tax breakout pages in the appendix.
The Two Worst Pitfalls for Dividend investors 51
Pitfall 2: Failing to always reinvestdividends
There’s a famous fable about an arrogant young Sultan prince whochallenged all comers to a game. Boasting of his boundless wealth,the prince offered the winners the prize of their choice. A cannycourtier decided to teach him a lesson asking for the winner’s prizeto be a chess board with one square each day to be filled withrice - a single grain on the first square, 2 on the second, 4 on thethird and doubling in number until the board was filled after 64days. The prince, thinking he was mocking him by asking for sucha measly prize, agreed and subsequently lost the game. Little didhe know that by the 64th day the courtier would be demanding18,446,744,073,709,551,615 grains of rice - a number which could fillthe surface of the entire earth several times over!
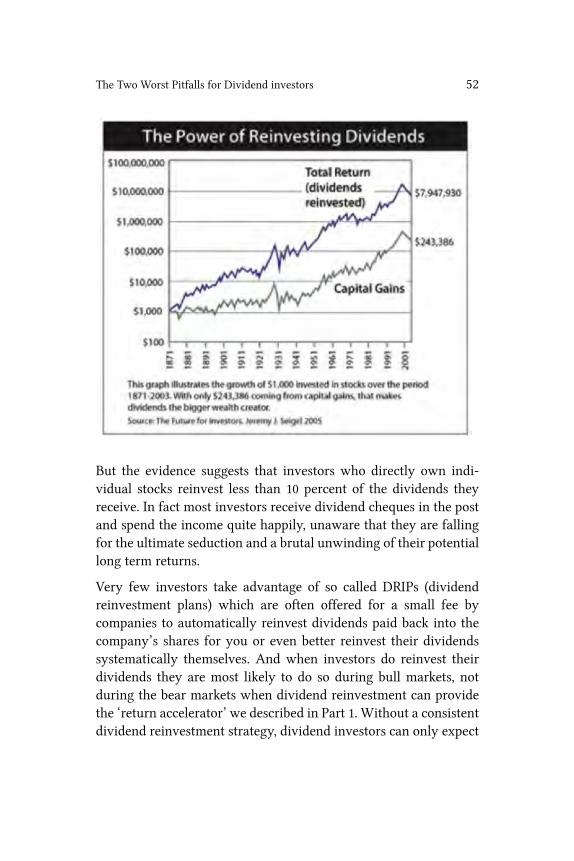
This is the power of compound interest which we’ve already talkedabout. Every study into the wealth that can be achieved fromdividend strategies has relied on the assumption that all dividendsare reinvested back into new shares of the underlying company. Byconsistently reinvesting dividends, in bearmarkets or bull, investorscan ensure that they are exposed as much as possible to this powerof compounding, not only growing their stake in each company, butgrowing their exposure to price appreciation and dividend growth.
The Two Worst Pitfalls for Dividend investors 52
But the evidence suggests that investors who directly own indi-vidual stocks reinvest less than 10 percent of the dividends theyreceive. In fact most investors receive dividend cheques in the postand spend the income quite happily, unaware that they are fallingfor the ultimate seduction and a brutal unwinding of their potentiallong term returns.
Very few investors take advantage of so called DRIPs (dividendreinvestment plans) which are often offered for a small fee bycompanies to automatically reinvest dividends paid back into thecompany’s shares for you or even better reinvest their dividendssystematically themselves. And when investors do reinvest theirdividends they are most likely to do so during bull markets, notduring the bear markets when dividend reinvestment can providethe ‘return accelerator’ we described in Part 1. Without a consistentdividend reinvestment strategy, dividend investors can only expect

The Two Worst Pitfalls for Dividend investors 53
sub-par investment returns from dividend stocks.

Chapter 7
A compendium of incomestrategies
Previously we looked at the reasons for using yield, safety andgrowth as the main concepts around which to shape a dividendinvestment strategy. In this section, we’re going to look at howsix well known income strategies have sought to track down greatdividend stocks and see how these approaches stack up, both intheory and in practice. As will see, these three factors are rarelytreated equally - different investors place more or less emphasis onone or another, as they see fit.
These strategies are quantitative and/or semi-mechanical. As part ofevaluating them, dividend investors have to ask themselveswhetherthey wish to approach dividend investing with an active stockpicking approach (as alpha hunters) or with a passive quantitativeportfolio approach (as beta farmers). Making that decision dependson your tolerance for risk and personal day to day passion for stockpicking. As we discovered in a chapter of How to Make Money inValue Stocks¹⁵ many modern investors are learning that the passiveapproach can be just as lucrative, less stressful and can help to avoidthe myriad ways in which investors manage to trick themselves outof their fortune.
We have deliberately made the following pages concise & formulaicto allow quick comparison of the pros and cons of each strategy.We track the relative performance of each of these strategies inour Screening Centre¹⁶, including our own variants where we seescope for improving the approach (we also review a couple of moreobscure dividend strategies in the Appendix).
¹⁵www.stockopedia.com/books/value-stocks/¹⁶http://www.stockopedia.com/screens/
A compendium of income strategies 56
Strategy 1: Dogs of the Dow
“Beating the Dow is based on simple logic that will produce excep-tional returns in any rational market”, Michael O’Higgins
Perhaps the most famous high yield investing strategy around isthe “Dogs of the Dow”, first popularized back in 1991 by MichaelHiggins in the book Beating the Dow.
How it works Simply invest an equal sum in the top 10 highestyielding stocks (“the Dogs”) in the Dow Jones Industrial Average (oran equivalent large-cap index such as the FTSE 100) once per year.Rinse and Repeat. O’Higgins argued that, by doing so, you couldbeat the Dow and with it probably the majority of most active fundmanagers.
Why it works The thinking behind the Dogs of the Dow strategyis that blue chip companies do not alter their dividend to reflecttrading conditions whereas share prices fluctuate. Companies witha high yield, i.e. high dividend relative to price, are therefore nearthe bottom of their business cycle and should see their stock priceincrease faster than low yield companies. The screen theoreticallyoffers a conservative option that produces a list of well-financedcompanies that have long histories of weathering economic turmoil.But of course there’s theory and there’s practice…
Can it beat the market? In his back-testing, O’Higgins demon-strated that over a 17-year period from 1973 to 1989, the Dogsstrategy averaged a return of 17.9 percent annually, compared to11.1 percent for the Dow. The Dogs of the Dow website suggeststhat, for the 20 years from 1992 to 2011, the Dogs of the Dowmatched the average annual total return of the Dow (10.8 percent)and outperformed the S&P 500 (9.6 percent). It did however struggleto keep up with the Dow during latter stages of the dot-com boomand the 080/09 financial crisis, suggesting that an investor would bebest served by viewing this as a longer-term strategy.
A compendium of income strategies 57
Key issues
• No safety filter (other than index membership): Although theDogs approach has the advantage of simplicity, the greatdisservice that O’Higgins did for investors was to encouragethem to look primarily at the list of highest yielding stocksin an index without filtering for dividend sustainability andgrowth. In the 80s and 90s Dow Jones index stocks wereextremely stable, but these days with the disruptive natureof internet competitors and tough credit markets, the giantsof yesterday are more at risk than ever before.
• Higher risk of dividend cuts: The singular focus on the highestpossible yield means that the approach has had a tendency topick for inclusion troubled names like Eastman Kodak whosebroken business models led to bankruptcy.
• High sector concentration risk: Stocks in the same sector tendto go out of favour or into trouble at the same time e.g. Lloydsand RBS in the UK during the financial crisis.
• Trading costs: The annual review of the portfolio is likelyto mean making major changes thus triggering trading costsand possibly crystallising capital gains taxes.
Stockopedia Subscriber Screening Resources
• Forecast Dogs of the FTSE Screen - qualifying UK stocks¹⁷• Dogs of the FTSE Screen – qualifying UK stocks¹⁸
Further Reading
• Michael O’Higgins, Beating the Dow¹⁹
¹⁷http://www.stockopedia.com/screens/forecast-dogs-of-the-ftse-100-screen-86/¹⁸http://www.stockopedia.com/screens/dividend-dogs-of-the-ftse-100-screen-14/¹⁹http://www.amazon.co.uk/Beating-Dow-Michael-OHiggins/dp/0066620473/ref=sr_1_
1?s=books&ie=UTF8&qid=1340012674&sr=1-1
A compendium of income strategies 58
• Aswath Damadoran. Investment Fables²⁰• Jack Hough, Your Next Great Stock²¹
Strategy 2: Geraldine Weiss’ Yield Range
“Anyone can be a successful investor… you confine your selectionsto blue-chip stocks, you buy them when they are undervalued, andyou sell them when they become overvalued” Geraldine Weiss
Rather than focusing on high absolute yield, an alternative strategyfocuses in on relative yield over time - the most renowned advocateof this kind of ‘range-trading’ approach was Geraldine Weiss,known as the Grand Dame of Dividends. For more than 50 years,Weiss has been regarded as one of the investment community’smost astute dividend hunters. The now retired editor of the USdividend newsletter Investment Quality Trends, Weiss developeda formula for identifying companies with strong dividend trackrecords that are attractively valued in the market, which she docu-mented in two best-sellers, Dividends Don’t Lie and The DividendConnection.
How it works At its heart, the technique uses the dividend yieldas the critical measure of its valuation. If the yield is high, it maysignal a buying opportunity and, if the yield is low or drifting lower,then that could be an indication to sell. As well as looking for lowyields on a historical basis, there is a filter for high quality stocks -each company needs to have a good quality track record and passan additional set of robust “blue chip” criteria to prove it.
Stock Selection Criteria: 1. Dividend yield must be undervaluedvs. its historical average 2. It must be a growth stock that has raiseddividends at a rate of at least 10 percent over the past 12 years.
²⁰http://www.amazon.co.uk/Investment-Fables-Exposing-Myths-Strategies/dp/0131403125
²¹http://www.amazon.co.uk/Your-Next-Great-Stock-Performers/dp/0470117931
A compendium of income strategies 59
3. It must be selling for two times book value or less. 4. It musthave a P/E ratio of 20-to-1 or below. 5. It must have a dividendpayout ratio in the 50 percent area (or less) to ensure dividend safetywith room for growth. 6. Its debt must be 50 percent or less of totalcapitalization. 7. It must be “blue chip”, defined as: - The dividendraised five times in the last 12 years - It should carry an A ratingfrom S&P - It should have at least 5 million shares outstanding -It should have at least 80 institutional investors hold the stock - Itshould have had 25 uninterrupted years of dividend history - Thereshould be earnings improvements in seven of the last 12 years.
Why it works It’s easy to understand the blended emphasis onrelative value and quality. Weiss argues that stock valuations froma yield perspective move in their own specific bull to bear cyclesas sentiment ebbs and flows. The average time for a stock to raisefrom undervalue to overvalue is three years, while the downhill runis usually two years. This strategy seeks to exploit those relativelypredictable cycles.
Can it beat the market?Weiss has now retired but, as of 2002, In-vestment Quality Trendswas said to be the number one performinginvestment newsletter in the US over the previous 15 years, earningan impressive 12.4 percent annualised. It had placed third for theprior ten years and third over the prior five years.
Key issues
• Charting based: This approach involves aspects of techni-cal analysis. Its reliance on historic patterns may concernfundamentals-focused investors, although the charting is notpurely based on price action.
• Higher risk of dividend cuts: Focusing on historically highyields may lead investors into dividend traps, although thequality filters help here.
• Accessibility: It’s difficult to replicate some of these criteriaexactly for the UK market (e.g. the S&P A rating or the 25
A compendium of income strategies 60
year dividend history as this is as rare as hen’s teeth in theUK market).
Stockopedia Subscriber Resources
• Geraldine Weiss ‘Lite’ Screen²² – a similar strategy for UKinvestors
Further Reading
• Geraldine Weiss, Dividends Don’t Lie²³• Forbes: Dividend Stocks Pay Off²⁴
Strategy 3: HYP - High Yield Portfolio
“You buy the top high-yielding stocks - building a diversified port-folio across all sectors. And you simply sit back and allow thedividends to pile up” Stephen Bland
A strategy which shares some of the same thinking as Dogs ofthe Dow is the ‘High Yield Portfolio’, a passive large-cap incomeinvesting strategy popularized by the writer and investor StephenBland in a series of Motley Fool articles back in 2000.
How it works This is a buy and hold forever strategy aiming tobuild a well diversified portfolio of shares in big, solid companieschosen primarily for high yield to provide increasing retirementincome from dividends. All forecasts and opinions on stocks areignored and stock positions are never sold. The stock selectionapproach is as follows:
²²http://www.stockopedia.com/screens/geraldine-weiss-lite-dividend-screen-80/²³http://www.amazon.co.uk/Dividends-Dont-Lie-Finding-Blue-Chip/dp/0793100232/
ref=sr_1_1?ie=UTF8&qid=1323984465&sr=8-1²⁴http://www.forbes.com/2002/02/12/0212adviser.html
A compendium of income strategies 61
1. Rank a large-cap universe by highest forecast yield.2. Select one stock from each different sector3. Examine fundamentals to make sure the yield is sustainable:
a) Less than 50 percent gearing, except in special cases likeutilities, b) Dividend cover of at least 1.5x ), and c) A historyof dividend growth over, say, the last five years. However,Bland also notes that these rules are flexible “for the sake ofessential sector diversification”.
Can it beat the market? Over the 10 years to November 2011,the strategy was reported to have generated a 4.95 percent incomereturn per annum.
Key issues
This is a combined yield and safety approach but the safety filtersare fairly basic and - as with the Dogs - the focus on the veryhighest yielding stocks looks misguided (the 2nd and 3rd decile tendto deliver higher risk-adjusted returns). Perhaps unsurprisingly, inthe 2008 credit crunch, the HYP portfolio suffered a number of highprofile issues from a capital perspective, including picking Lloydsand BP.
Stockopedia Subscriber Screening Resources
• What is HYP investing?²⁵• PYADScreen²⁶ –Anothermodel screen developed by Stephen• Bland. We will be adding a HYP version too.
Further Reading
• How to select High Yield Portfolio shares²⁷
²⁵http://www.stockopedia.com/content/introducing-the-high-yield-portfolio-78349/²⁶http://www.stockopedia.com/screens/pyad-screen-17/²⁷http://www.stockopedia.com/content/hyp-1-how-to-select-high-yield-portfolio-
shares-78749/
A compendium of income strategies 62
Strategy 4: DGI - Dividend GrowthInvesting
“The stockmarket also contains an escalator, one that allows youto stay invested and ride the roller coaster with something ap-proaching peace of mind” Roxann Klugman
This is an increasingly popular income investing strategy in theUnited States. One of the earliest books to focus on DGI in detail asa strategy was Roxann Klugman’s 2001 title, The Dividend GrowthInvestment Strategy²⁸. As a more populist school of investmentthinking, Dividend Growth Investing has emerged in recent yearsout of the blogosphere, via sites like Van Knapp’s Sensible Stocksand the writings of oth- ers like David Fish, Chuck Carnevale andNorman Tweed on social finance site, Seeking Alpha.
How it works This approach involves buying stocks with a longhistory of increasing dividend payments, i.e. Dividend Champi-ons²⁹, and reinvesting any proceeds. While a long dividend streakis considered crucial, it’s also important to find a company thatis growing at a sustainable rate, with low debts and lots of cashinflows. There is usually a strong Buffettesque focus on the qualityof the underlying business franchise to ensure sustainability ofthe dividend payment. As with the HYP approach, there is moreemphasis on the income stream generated by the portfolio, thanthe portfolio value per se.
Stock Selection Criteria DGI is a fairly broad church but a typicalset of criteria to find candidate stocks might be: 1. Consistenthistory of dividend increases: This usually starts with the list ofcompanies with a 25+ year record of maintaining or increasingdividends. 2. Strong historic dividend growth rate:Aminimum five-year dividend growth rate of 10 percent or more, or a 10-yeardividend growth rate at the same level. 3.Aminimum dividend yield
²⁸http://www.amazon.com/The-Dividend-Growth-Investment-Strategy/dp/0806521821²⁹http://www.dripinvesting.org/Tools/U.S.DividendChampions.pdf
A compendium of income strategies 63
of 3 or 4 percent: If the current yield of an existing holding dropsbelow 3 percent, this might trigger a decision to sell and deploy thecash elsewhere. 4. Increased dividend payout yield (either in relationto EPS or free cash flow): This is more controversial since some DGIinvestors target low payout ratios as a sign of sustainability.
Why it works We discussed earlier the way companies with longdividend streaks are signalling the stability of their business model,their confidence about future earnings and their commitment topaying dividends. Companies think very carefully before increasingdividends in this way - as a result, they tend to be very high qualitybusinesses that are able to grow profits over a long period of timeby selling / manufacturing / distributing products that people reallyneed.
Can it beat the market?Given its popularity, the evidence whetherDividend Growth Investing delivers excess long-term returns issurprisingly mixed. While a number of its supporters have back-tested the performance of the Dividend Champions list, this workis based on a data-set that suffers from significant survivorship bias(i.e. it does not show companies that cut their dividends or wentbankrupt). However, one international study by Cass Universityof UK stocks, Consistent Dividend Growth Investment Strategiesexamined data for the London Stock Exchange from 1975-2006.It found that firms with 10+ years of consistent dividend growth(especially small-caps) returned considerably more than the equitymarket as a whole, with the additional benefits of lower volatilityand smaller drawdowns.
In any case, the idea is that, rather than beating the market throughcapital growth, a portfolio of DGI stocks should provide a sufficientincome stream to retire on, without the need to touch the principal(i.e. the appropriate benchmark is total return).
Key issues
• Unbalanced approach – As blogger Financial Uproar writes,
A compendium of income strategies 64
the proponents of DGI can appear somewhat myopic in theirfocus on growth to the exclusion of other concerns: “I likedividends too. The problem is with the almost singular focuson it. As long as a company is growing the bottom lineand their inves- tors get that yearly dividend hike, dividendgrowth investors are happy to buy, all other metrics bedamned”.
• Limited focus on valuation – Given the lack of focus on yield,there is a risk that valuation may be overlooked as a key pa-rameter for these kinds of stocks. A related concern is thatthe DGI approach is becoming very popular in the US, whichcould lead to a bubble in these kinds of stocks (discussedbelow).
Stockopedia Subscriber Resources
• Dividend Achievers Screens³⁰ – inspired by Indxis’ index.• What is Dividend Growth Investing?³¹
Further Reading
• The Dividend Growth Investment Strategy³²
Strategy 5: BSD - Big Safe Dividends
“Find stocks with above-average appreciation potential and safeand growing dividends, and buy them at attractive prices” CharlesCarlson
Charles Carlson is the boss of an investment advisory and pub-lishing group called Horizon which publishes “The DRIP Investor”
³⁰http://www.stockopedia.com/screens/dividend-achievers-screen-78/³¹http://www.stockopedia.com/content/what-is-dividend-growth-investing-67683/³²http://www.amazon.com/The-Dividend-Growth-Investment-Strategy/dp/0806521821
A compendium of income strategies 65
newsletter. Carlson wrote a book called The Little Book of BigDividends in which he laid out his own algorithm for picking safeyielding stocks. He is generally wary of high yield stocks and, unlikesome of the previous strategies, he suggests that investors shouldbe cautious about stocks with dividend yields that greatly exceedthe yields of companies in the same sector or industry, the overallmarket, or the stock’s own long-term historical average.
How it works Carlson discuss two approaches - Advanced &Simple Big, Safe Dividends (BSD). The Simple version relies onthe Dividend Payout Ratio and his own proprietary Quadrix score,the details of which are not disclosed. However, the AdvancedBSD Formula uses the following ten weighted fundamental andmomentum factors to arrive at a composite score. The idea is tofocus on the best-scoring companies and Carlson’s website providesa list of them for the S&P 1500.
Primary Factor
• Dividend Payout Ratio (30 percent Weighting) – Using thisap- proach, the most important factor is how well coveredthe divi- dend is by company profits.
Major Factors
• Interest Cover (10 percent Weighting) - measures how wella company profits cover its interest payments. Companieswith lots of debt may struggle to pay the dividend if businessconditions deteriorate.
• Three Year Dividend Growth (10 percent Weighting) – Carl-son observes that companies that have a history of raisingtheir dividend on a regular basis tend to continue to do so.
• Long Term Expected Growth (10 percent Weighting) - Whilenot a perfect measure given the poor record of analystforecasts, Carlson feels that it is a reasonable way to get someview on a firm’s future growth prospects.
A compendium of income strategies 66
• Tangible Change in Book Value (10 percent Weighting) - Thisis used as a check on a company’s balance sheet quality.
• 6 Month Relative Strength (10 percent Weighting) - Carlsonnotes that weak share price movements can often anticipatedividend cuts.
Minor Factors
• Cashflow to Net Income (5 percentWeighting) -While profitscan be seen as the primary funding source of dividends, youneed actual cash to pay the dividend.
• Three Year Cash Flow Growth (5 percent Weighting) – Afocus on companies that have a record of boosting cash flowson a regular basis.
• Three Year Earnings Growth (5 percent Weighting) – Prefer-able to bet on a company with a history of boosting earningsthan one that does not.
• Dividend Yield (5 percent Weighting) - Carlson includes itbut warns against focusing overly on dividend yield.
Can it beat the market? According to the book, Carlson back-tested his approach to 1994. A hypothetical investor that boughtall of the S&P 1500 stocks that were in the top 20 percent of theAdvanced BSD screen and in the top 25 percent of his Quadrixranking system, with annual rebalancing, would apparently haveoutperformed the S&P 1500 Index by more than 6 percent per year.
Key issues
• Debatable parameters: While Carlson’s approach is inter-esting, it does appear to be something of a laundry listof financial indicators that might (or might not!) impactdividend safety, plus a fairly arbitrary set of weightings. Theapproach is said to be focused on safety but also seems to
A compendium of income strategies 67
include factors that are assessing the prospects for dividendpayout growth.
• Omissions: There are a few surprising omissions from thealgorithm such as the size of the firm in question which dotend to be predictive. Finally, as we’ve discussed, it’s notalways clear that a low payout ratio is always a good thingso its heavy reliance on this metric is open to question.
• Proprietary aspects: The full back-tested results rely on Carl-son’s Quadrix ranking system, the details of which are notdisclosed.
Further Reading
• The Little Book of Big Dividends³³
Strategy 6: SG Quality Income
“There are very sound logical reasons for being biased towards highquality/low risk stocks. There are even more sound reasons for beingbiased towards sustainable dividend payers” Dylan Grice, SocieteGenerale
In May 2012, the equity strategy team of SocGen sought to producean investment strategy that would provide a tonic to ten years of de-pressed equity growth and stagnating bond returns. What SocGen’steam came up with was a ‘Quality Income Index’ designed to tracklarge cap stocks with robust balance sheets, strong fundamentalsand healthy yields. The barometer of quality essentially rests on thebroad shoulders of the Piotroski F-Score. They have subsequentlylaunched an ETN based on the Index.
How itworks Their stock selection criteria consists of the followingmetrics: 1. As a measure of quality, a stock must have a Piotroski
³³http://www.amazon.co.uk/The-Little-Book-Big-Dividends/dp/0470567996
A compendium of income strategies 68
F- Score of 7 or greater (out of 9) 2. It must also have a balancesheet risk score in the safest 40 percent of the universe. 3. Aforecast dividend yield above 4 percent or 125 percent of the averageuniverse yield. 4. Market capitalisation has to be at least $3bn.
Their “universe” is a global mix of ‘eligible countries’ subject to afew turnover minimisation techniques, quarterly rebalancing anda basket size of between 25 and 75 stocks. Financial companies areexcluded.
Why it works The idea of bringing both high quality and highincome together into a portfolio strategy has some very soundbehavioural foundations as it helps in avoiding overconfident man-agers and avoiding overpaying for lottery tickets. We’ve alreadylooked at why high yield stocks tend to do well; the fact thatcompanymanagement are generally bad at allocating capital meansthat distributing cash to shareholders seems to improve the disci-pline and skill of managers at reinvesting capital. Meanwhile, highquality businesses tend to be steady stalwarts that are often ignoredby fund managers as being just too boring. Fund managers have todo something from day to day and need a bit of pizzazz to keepthem excited about their work and possible bonuses. As a resultthey’ll tend to pay more money for stocks that have the capacityto double from year to year. Just like lottery ticket buyers, they payover the odds to play, systematically underbidding quality stocks inthe process.
Can it beat the market? Many in the market now appreciate thatboth higher ‘quality’ stocks and higher yielding stocks tend tooutperform. According to SocGen’s backtesting, stocks that shareboth qualities put together offer total returns that have averaged11.6 percent per year since 1990, more than doubling the return ofthe global equity markets at a significantly reduced volatility.
But what is more striking is the return of the portfolio since themarket topped in 2000 - a genuinely miserable time for all. Whilethe total return of stock markets has actually been negative in that
A compendium of income strategies 69
time period, the Quality Income index almost tripled. We’re nowtracking the screen for the UK market to see how it holds up underlive tracking as opposed to back-testing.
Key issues
Of all the dividend strategies discussed, this is the one we considerhas the soundest foundations in terms of the underlying researchand thinking. On the negative side, the Distance to Default measureused to assess balance sheet risk is somewhat esoteric, althoughin our own modelling of it, we’ve used the Altman Z-Score as asubstitute.
Stockopedia Subscriber Resources
• SocGenesque Quality Income Screen³⁴ – UK stock screen
³⁴http://www.stockopedia.com/screens/socgen-esque-quality-income-screen-808/

Chapter 8
Diversification - the onlyfree lunch
“The only investors who shouldn’t diversify are those who are right100 percent of the time” Sir John Templeton
Diversification is the only free lunch in investment and the idea is sosimple that even a child can understand, if not execute it – “Don’tput all your eggs in one basket”. But in practice stock portfo-liodiversification remains a contentious topic among investors.
On the one hand, there are those who argue that a portfolio shouldbe concentrated on a small, highly selective group of stocks (lessthan 10 stocks, perhaps as few as 4 or 5) to be monitored closelyand frequently. Warren Buffett has occasionally placed up to 40percent of his funds into exceptional stocks like Coca-Cola andAmerican Express. On the other hand, there are those who arguethat a portfolio should include a fairly large number of stocks (20-30, or as much as 50).
This topic is especially relevant in dividend investing. Seven bluechip companies account for a massive 50 percent of dividendpayouts in the UK and when events come out of leftfield literallymillions of investors can feel the pain simultaneously. In 2010, oilgroup BP slipped from fifth to seventh best payer following the Gulfof Mexico oil spill, while in 2009 Lloyds lost its seventh place in thewake of the banking crisis.
A 1990’s study of study of 60,000 private investor portfolios byKumar and Goetzmann at one of the US’s biggest discount bro-kerages found that investors on average owned only 4 stocks. Westrongly favour much wider diversification than this because themost important thing in income portfolios becomes the health anddividend generating capacity of the whole. By spreading out your
Diversification - the only free lunch 72
portfolio, you reduce the chances that one stock or industry issuecould derail your investment plan. Sure, Warren Buffet may run afocused portfolio but howmany investors have his command of thedetail?
Parsimony Investment Research suggest some useful rules for adividend portfolio – they argue that an investor can reduce portfoliorisk meaningfully by holding a combination of stocks that are not100 percent positively correlated along the following lines:
Maximum Stock Position: 3-5 percent of total portfolio. The ideahere is that a portfolio should include 20-30 high-quality dividendstocks, with no stock accounting for more than 5 percent of the totalportfolio.
Maximum Industry Position: 15-20 percent of total portfolio. Theirview is that a portfolio should include stocks from a variety ofindustries and certainly no one specific industry or sector accountfor over 20 percent of the total portfolio.
Maximum “High Yield” Exposure: 20-30 percent of total portfolio.They define high yield as stocks with yields greater than 6.0 percent,as these tend to be either speculative in nature or involve specialcircumstances (e.g. REITs). Clearly, this will be a matter of debate,depending on one’s appetite for high yield.
Maximum Portfolio Beta: less than 0.75
While these guidelines look sensible, we’d suggest some simplerrules of thumb to play it safe…
Limit any single holding or sector to no more thanone-third of your portfolio. Weed out less successfulholdings that shrink to become an insignificant partof your portfolio, for example less than 2 percent(other than recovery shares which you are activelymonitoring).
Further Reading

Diversification - the only free lunch 73
• Building A DIY Dividend Portfolio³⁵
³⁵http://seekingalpha.com/article/829241-building-a-diy-dividend-portfolio-part-3-asset-allocation-rules
Asset Allocation &Rebalancing
“Gentlemen who prefer bonds don’t know what they are missing”Peter Lynch
While equity investors enjoy nothing more than spending hourslabouring over which stock to buy, evidence suggests that this couldbe misplaced energy. Research presented by Ken Fisher in his book,“The Only Three Questions That Count”, shows that only 10 percentof an investor’s portfolio returns come from stock selection, with 70percent of investment returns coming from overall asset allocation!
Asset Allocation is the proportion in which an investor splits hisport- folio across different asset classes - i.e. stocks, bonds, funds,real estate, commodities and cash. While many believe it to be bun-kum, Modern Portfolio Theory suggests that since risk levels andportfolio returns are directly related, you should balance your desirefor return with your ability to withstand the ups and downs of themarket. But how do you do this systematically?
Determining need – the 4 percent Rule
Under conventional retirement planning, one accumulates assetsduring his or her working years, and then begins selling assets uponretirement to provide income. The rate at which an investor sellsdown assets is determined by things like the 4 percent Rule. This isa rule of thumb proposed in the 1990s by Bill Bengen, a financialadviser. He suggested that, if you spend 4 percent of your capital inyour first year of retirement, you can go on spending that muchuntil you die. Based on this, you can back out the capital sum
Asset Allocation & Rebalancing 75
required to fund your longer-term needs, for example you wouldneed £250,000 in savings to provide £10,000 per year in neededincome.
While this can be a useful guide, it does assume a standard 30-year retirement period. It may not accurately reflect future inflationrates, the risk of stock market downturns and your own longevity/health care bills. It is also worth noting that DGI investors tendto focus on the income generation potential of your investments,rather than the size of the capital pot.
What is your risk tolerance?
When thinking about how to achieve your target level of capital,you can use the following guidelines to estimate your comfort levelwith risk:
High risk tolerance: You are likely to be far away from retirement.You’re comfortable with the possibility of steep losses in order tomaximise potential return, and you’re able to sleep at night whenthe market is in turmoil.
Average tolerance: You can handle drops in price, even for ex-tended periods, but extreme swings makes it hard for you to sleepat night.
Low tolerance: You need your investment income to fund yourlifestyle in the near term. In this case, you’re likely to be weightedheavily towards cash, bonds and blue-chip dividend stocks.
Own your age in bonds?
Once you’ve decided where you stand, coming up with a targetedasset allocation does not need to be overly complex. The higher yourrisk tolerance, the higher the proportion of equities in your portfoliobasically.
Asset Allocation & Rebalancing 76
An old rule of thumb is that your stock allocation percentage shouldbe 100 minus your age (this is the same as “own your age in bonds”).For example, if you’re 30, you should keep 70 percent of yourportfolio in stocks. If you’re 70, you should keep 30 percent of yourportfolio in stocks.
However, with people living longer, financial planners have alteredthis to a more aggressive “110 – age” or even “120 – age”. That’sbecause if you need to make your money last longer, you’ll needthe extra growth that stocks can provide. Others suggest using youradjusted “allocation age” (i.e. the average age for everyone who hasan interest in your portfolio). For example, if your spouse is 8 yearsyounger than you are, your adjusted allocation age would be 4 yearsyounger than your own age.
Alternatively, John Bogle (the founder of Vanguard) has advocateda simple 50/50 portfolio for many years. In a 2001 essay, The TwelvePillars of Wisdom, he argued: “There are an infinite number ofstrategies worse than this one: Commit, over a period of a few years,half of your assets to a stock index fund and half to a bond indexfund. Ignore interim fluctuations in their net asset values. Hold yourpositions for as long as you live, subject only to infrequent andmarginal adjustments as your circumstances change. When thereare multiple solutions to a problem, choose the simplest one.”
The issue with these “simple” approaches, however, is that a) theydon’t factor in other asset classes (e.g. commodities) and b) youusually end up owning a lot of bonds. One of the themes of thisbook is that judicious dividend stock investment can provide astable income stream that may partly offset the needs for bondinvestments. As we’ll soon be discussing, on the back of a 30 yearbond market bull run and with interest rates at an all-time low,being too overweight in bonds might not be such a good idea afterall.
In any case, the key is finding something that you are comfortablewith (remembering that, on the whole, people overestimate their
Asset Allocation & Rebalancing 77
risk tolerance). It’s then important to track your allocation closelyand to look at rebalancing at least once a year. When assessing youractual vs. targeted asset allocation, don’t forget to factor in yourexposure to asset classes through your pension (usually very bond-heavy).
Rebalancing
Portfolio rebalancing means that as some assets appreciate andothers depreciate, you periodically adjust your allocations to stay inline with your original plan. This involves taking counter intuitiveaction of selling investments in markets that are performing welland buying more of less well-performing asset classes. This is donebecause markets have cyclical tendencies, meaning that a poorlyperforming asset class won’t always do badly and a high-flyingasset class will eventually come back down to earth.
The balance of your portfolio will change constantly, even if you donothing. Markets rise and fall over time. Dividends will be paid and(hopefully) re-invested. Some holdings may acquired or - despiteyour best efforts - go under. If a portfolio is not rebalanced, itwill gradually drift from its target asset allocation to higher-returnand, therefore, higher-risk assets. How should you respond to thesechanges? Broadly speaking, here are the options:
1. Do nothing , i.e. you decide to let the portfolio take care ofitself
2. Annual/Periodic Rebalancing: Aim to restore the balanceeach year, or fairly constantly, as you buy and sell
3. Threshold-Based Rebalancing: You impose upper and/or lowerpercentage limits and let the portfolio fluctuate within thoselimits.
4. Tactical/Dynamic rebalancing: This is where an allocation isshifted once certain pre-agreed market conditions come into
Asset Allocation & Rebalancing 78
being. For example, a neutral equity allocation might be 50percent but with an agreed tactical shift down to 40 percentif P/E ratio is higher than, say, 18.
Each approach has advantages and disadvantages. The most im-portant thing is to be rigorous in the implementation. Rebalancingtends to clash with our normal ‘fear and greed’ response, which iswhy it’s best to set down the approach in writing so you can referback to it.
Further Reading
• Siegel: The Future for Investor³⁶s• The 50/50 Portfolio Solution³⁷• Vanguard: Best practices for portfolio rebalancing³⁸
³⁶http://www.amazon.com/The-Future-Investors-Tried-Triumph/dp/140008198X³⁷http://portfolioist.com/2011/12/08/the-50-50-portfolio-solution/³⁸http://www.vanguard.com/pdf/icrpr.pdf
The merits of dividendstocks vs bonds
“When reward is at its pinnacle, risk is near at hand” Jack Bogle,founder of Vanguard Group
Bond prices are generally less volatile than equities, dividend pay-ing or not. Bond prices fluctuate with interest rates, inflation, fearand the credit ratings of the issuer, but these price fluctuations aredampened by the flow of a guaranteed stream of interest incomeand the guaranteed return of the principal.
Most bonds are ‘secured’ against the company’s assets, so that evenin the case of bankruptcy bondholders are likely to be paid back bythe administrators first. The common shareholder is only entitledto whatever remains after all bondholders, preferred shareholdersother creditors are paid out, which is regularly nothing at all!
So dividend stocks don’t carry a promise that you’ll get back whatyou paid. We’ve also seen that there is always the chance that theyield will be cut due to market uncertainty and the temporary poorhealth of the companies paying the dividends. As a result shareprices tend to be a lot more volatile. Jeffrey Gundlach, the famedbond investor, illustrated the difference between bond and equityvolatility by saying:
“If the yield on the ten-year bond doubles overnightfrom 3 to 6 percent, you’ve lost about 20 percent ofyour principal – but if Microsoft’s yield doubles from3 to 6 percent overnight, you’ve lost 50 percent of yourprincipal.”
However, while these facts are generally true, it’s important to
The merits of dividend stocks vs bonds 80
recognise some important caveats about bond risk that may meanthey are far more risky right now thanmost investors are expecting.
Firstly, bond markets have been in the longest bull run (30 years+) in history, with bond yields having dropped to levels not seenin at least 50 years. It is certainly arguable that interest rates havenowhere to go but up. Of course, it may be that the economy willcontinue to stagnate and interest rates will stay low but when anymarket is at an extreme in terms of values, reversion to the mean isa decent bet.
Secondly, bonds provide zero hedge against inflation. Governmentbonds are regularly yielding less than the rate of inflation or even,in the case of a recent German auction, less than zero. So even if youdo receive your principal back it may beworth far less in purchasingpower than it was when you initially bought your bonds.
Inflation looms - why the time forstocks is near
The one aspect where dividend stocks beat bonds hand-down isin combatting the ravages of inflation. If you buy a bond at a parvalue of £100, when it matures you will only receive the same £100without any adjustment for inflation - in the same way, the reasonthat bonds are known as “fixed income” investments is that theircoupon rate (essentially their yield) never rises. As a result there isa significant risk that the income you earn while holding a bond tomaturity won’t compensate you enough for the loss of purchasingpower. In contrast, the dividends from well-chosen dividend stockscan typically grow much faster than inflation - providing a farbetter hedge than bonds.
As mentioned in the introduction, we may be living in an era of‘financial repression’ where governments legislate to ensure enoughdemand for their AAA rated bond issuances while paying yields
The merits of dividend stocks vs bonds 81
that are so low they pay out less in interest than is required to matchinflation.
Effectively these bonds are losing value after factoring in inflationso the case for dividend stocks as an alternative source of portfolioincome is stronger than ever. Could it be appropriate for an investorto switch their asset allocation to more heavily weight stocks overbonds? Yes. Especially if the forecast is for higher future interestrates and better economic times ahead (as interest rates rise, bondprices go down).
But it’s important not to be blind to the risks that exist withdividend stocks as they do have a lower place in the hierarchyof the corporate capital structure. Dividend income streams aretheoretically more risky than the equivalent income stream fromhigh yield bonds.
One concern that’s been raised of late is the possibility of a divi-dend bubble forming, given the weight of retail and institutionalmoney moving into the space. Deluded by their quest for yield, areinexperienced investors sleepwalking into a dividend trap?
Could a dividend bubble be on the horizon?
So far, this looks to be a stretch. As Dan Kadlec notes, not every rallyis a bubble. Bubbles and investment manias tend to display severalcharacteristics. Usually, investors start buying with the expectationthat they will be able to flip the asset to a more willing buyer. Thisdemand is often fuelled by leverage, which magnifies gains, whichin turn draws in more buyers. Investors become more and moreexuberant, dismissing risks and discarding traditional valuationmethods with talk of a “new era” to justify the ascent in prices.
Dividend stocks do fortunately have a self-correcting mechanismbuilt in. If the price rises, the yield falls, making the shares lessattractive. In theory, that should keep prices from getting too out of
The merits of dividend stocks vs bonds 82
line, although the strong focus of DGI investors on dividend growtharguably breaks that link.
In absolute terms, this is not yet a low-dividend yield environment.P/Es and valuations may seem stretched relative to many non-dividend paying stocks - but only relative to them. As of late 2012,there’s very little evidence of dividend stocks selling at absurdvaluation multiples (e.g. P/Es north of 30x+). There continues tobe very juicy dividend yields available from really solid companies.
It could still get ugly…
This is not to say that there is not a fair amount of yield chasinggoing on or that defensive / dividend paying sectors of the marketare not becoming relatively expensive. Clearly, there are manyreasons why you could see a nasty / painful exodus from dividendstocks:
• Interest rates could rise substantially - since the TMT bubbleburst, interest rates have been on a relentless march downbut this could reverse as inflation spikes.
• The macro-economic picture could improve markedly, en-couraging money out of defensive stocks.
• There could be a structural change in the market (for exam-ple, a tax change) that might make it less attractive to pay (orreceive) dividends.
• A long recession could cause seemingly perpetual “dividendgrowers” to cut or stop increasing temporarily their pay-ments.
As ever, the most important thing is to focus on robust stock selec-tion methodologies, apply a margin of safety, and avoid warningsigns such as:
• Soaring valuation multiples vs. the market or other sectors..
The merits of dividend stocks vs bonds 83
• Low dividend yields in absolute terms (e.g. less than 3 per-cent)
• A high risk of a dividend trap.• Flashing momentum indicators, such as prices well above the200-day moving average.
Further Reading
• Why Dividend Stocks Aren’t the New Bonds³⁹• The Bond Bubble and the Case for Stocks⁴⁰• [The Bond Buyer’s Dilemma] http://online.wsj.com/news/articles/SB10001424052970204449804577068152764286924?mg=reno64-wsj&url=http%3A%2F%2Fonline.wsj.com%2Farticle%2FSB10001424052970204449804577068152764286924.html)
³⁹http://online.wsj.com/news/articles/SB10001424052970204542404577158761922787578?mg=reno64-wsj&url=http%3A%2F%2Fonline.wsj.com%2Farticle%2FSB10001424052970204542404577158761922787578.html
⁴⁰http://online.wsj.com/news/articles/SB10001424053111903639404576516862106441044?mg=reno64-wsj&url=http%3A%2F%2Fonline.wsj.com%2Farticle%2FSB10001424053111903639404576516862106441044.html
When to sell“I never buy at the bottom and I always sell too soon” Nat Rothschild
“Buy low and sell high” is the mantra of a lot of investors, but isless often adhered to by dividend investors who tend to subscribeto a “buy and hold” philosophy. They tend to be more comfortableholding onto their investments even as they soar in value farabove what they are realistically worth because the focus is on thedividend income, not the share price.
Still, if an investor buys in at a high yield, but later the current yieldbecomes much smaller due to price appreciation, should they lookto sell? They are still getting that high yield but the opportunity costof the investment has increased, assuming the price has appreciatedfaster than the market, and better investments may be available.
Many dividend investors argue against selling or rebalancing,main-taining that the original yield on cost locked in with the purchaseis there to stay, as long as the dividend is at least maintained. If astock you purchased had a current yield of 8 percent, your yield oncost is 8 percent. It doesn’t really matter if the stock is currentlyyielding 1 percent or 2 percent - you still earn 8 percent on yourcost. One consideration worth making on this point, however, is theimpact that a falling yield could have when it comes to reinvestingdividends. While you may have locked in a healthy yield with aninitial purchase, you may not necessarily get that yield again whenit comes to reinvesting. Once again, it comes down to your strategy– yield or growth – and it requires regular monitoring, as we’lldiscuss in a moment.
When to sell 85
Why sell ever?
Indeed, some dividend growth investors, such as David van Knapp,argue that you shouldn’t need to sell dividend stocks ever. Whyis that? Under conventional retirement planning, an investor accu-mulates assets during his or her working years, then begins sellingassets upon retirement to provide “synthetic” income (using the 4percent Rule discussed above), i.e. income not generated naturallyby the investments themselves.
Instead, van Knapp suggests that ideally nothing should be sold atall by a dividend growth investor. Instead, the income generatednaturally by the assets should be all that is removed from the in-vestment account. On this view, price falls or even a bad economyshould pose no particular threat to most of this dividend income,because there is little correlation between dividends and stockprices.
Nevertheless, while a “buy and hold” approach to dividend invest-ing may have some merit, this should not be the same thing as“Buy-And-Forget” – a better approach is likely to be “Buy, Hold &Monitor”. Dividend investors do still need to be vigilant and keepa close watch on their investments to ensure that their dividendincome stream remains intact. Things may change in an uncertainworld and adjustments must be made from time to time. A purist“buy and hold” approach also isn’t really practical if you havepress- ing and unexpected liquidity needs that exceed your current/ planned income.
With that in mind, here is a “sell signal” checklist of four keyquestions which cover the major scenarios where it would makesense for a dividend stock investor to review their position:
When to sell 86
Question 1: Has there been a dividend cut?
If a company reduces or eliminates its dividend, then this maybe an appropriate time to sell for a dividend investor. This is notjust because of the loss of the long-term passive income streambut also because the market response to such cuts tends to beindiscriminate. As we’ve discussed, several studies have shown thatinvestors simply flee from the shares and in the large majority ofcases the stock price of firms that cut dividends drops dramaticallyon the news.
While some commentators may present this as a hard and fastsell rule, it’s still worth being circumspect. Firstly, you mightbe selling out at the bottom and, secondly, as we’ve discussedelsewhere, a dividend cut is not always bad news from a medium-term perspective. Companies may cut or suspend dividends forseveral reasons; some clearly have negative implications for thefuture prospects and the value of the firm, whereas others havemore positive implications.
It may be: a) a last ditch response to operating problems (declin-ing earnings and losses), i.e. the company has finally run out ofother options (very bad news), b) a pre-emptive action to increasefinancial flexibility and avoid future problems e.g. by using the cashsaved to retire debt (moderately bad news), or c) it could simplybe because the firm wants to invest more than it expected, e.g.a dramatic improvement in its strategic options (potentially verygood news for its long-term prospects).
A classic example of a ‘good news’ dividend cut is Florida Power& Light in the US. In 1994, FPL cut dividends by a significant 32percent, marking the first cut by the company in 47 years. It was adecision taken in the midst of uncertainty caused by deregulationin the electric utilities industry. Far from financial distress, FPLannounced, at the same time as it cut dividends, that it was buyingback 10million shares over the next three years and emphasised thatdividends would be linked more directly to earnings. As expected,
When to sell 87
on the day of the announcement, the stock price dropped 14 percentbut recovered this amount in the month after the announcementand earned a return of 23.8 percent in the year after, significantlymore than the S&P 500 over the period (11.2 percent) and otherutilities (14.2 percent).
So, while sometimes the cancelled payout is a sign that the companyis toast, in other cases, the action may be in the shareholders’long-term interests. A company may be taking prudent measuresto conserve cash in tough times or it could be a wise decision todivert cash to exciting new projects. The level of scepticism shownby investors towards claims by companies of increased investmentrequirements at the time of a dividend cut is understandable,especially if the firm also reports lower earnings and has a historyof poor project returns. However, the data suggests that the markettends to be overly-sceptical. So, if you’re still a shareholder in acompany that decides to scrap its dividend, it may not make sense tosell the stock straightaway. Each individual case should be taken onits own merits. There looks to be value to examining closely timedearnings and dividend cut announcements to see if the marketreaction is justified.
Question 2: Has there been a fundamentalchange in the business?
If a company changes dramatically, it’s worth reviewing its useful-ness as an investment to you. It’s always worth writing down at thetime of purchase the specific thesis that underlies the investmentand any metrics for tracking this. This allow you to monitor howfuture events have impacted that thesis objectively, without gettingcaught up by hindsight bias or issues of loyalty or saving face. Usingthis, it’s very good practice to periodically review your investmentsand ensure that you still own them for logical reasons.
Examples of major changes that may undermine your reasons forinvesting in that company includemassiveM&A, or a re-focusing of
When to sell 88
the business, or a huge macro-economic shift, or that the companyis increasing its debt beyond the point that you are comfortablewith. In the case of M&A, frequently, such deals are made with alot of cash — meaning there may be less to pay out in dividends.Alternatively, you might find that a company with a great yieldand good potential for shares has been bought by a stingier orless favorable competitor. It may be better to dump the positioninstead of accepting the resulting shares from the buyout. Anotherexample of fundamental change could be the oil disaster in theGulf of Mexico for BP Plc. The company was just not preparedfor the situation and, as the damage claims mounted, investors lostconfidence in management to resolve the issue, leading to a sell- offand a dividend cut.
Question 3: Is the stock down by over 50 percentsince your purchase?
Jeff Reeves of InvestorPlace.com suggests another circumstancewhere dividend investor should maybe look towards the exit. Henotes that, while fluctuations in share price are not necessarilya problem for dividend investors, watching a position decline byover half should set off warning bells. His rationale: “A dividendstock with a yield of about 2 percent will take 50 years to “doubleyour money” via dividends…Waiting five decades (if not reinvested)just to get back to square one doesn’t make any sense no matterhow healthy the dividend payout is”. Sometimes you may be betteroff taking the loss and moving on to greener pastures, rather thanrelying on a recovery that may never come.
Question 4: Is the stock severely overpriced?
As we’ve discussed, dividend investors are mostly focused onthe dividend income rather than the stock price. However, thereare some circumstances where even the most hardened income
When to sell 89
investors might be cautious, namely where the stock has becomeso overpriced that you’re unlikely to earn a Total Return, evenfactoring in the dividends, because there is material and significantrisk to the share price. One way to spot such a scenario is where thedividend yield has declined to historic lows. This was the approachused by a range-trading dividend investor like Geraldine Weiss,the time to sell was when the dividend yield declined to historiclows. This suggests that it’s likely that the stock will “mean-revert”,leading to a significant loss of capital.
Keeping a cool head
It’s important to remember dividends typically increase over timeon average while cash in the bank typically loses its purchasingpower over time. As a result the investor who takes profits todaymight lose out on any increases in dividends as well as on any futureprice gains.
If the price of a stock falls dramatically in a short period of time,this is often a reason NOT to sell a position. You have to keep a coolhead and remember the reasons why you invested in the company.If the fundamentals remain the same, the dividend is in no danger,earnings and revenue appear to be growing and the valuation isattractive, this may be an opportunity to average down and loweryour cost basis on a holding.
However, paying attention to the above questions should help youmanage your downside risk. If, however, the market is exiting astock because of serious issues this would be a good opportunityto review the company’s financial information and make sure thelong-term health is intact. If it’s not, then one of the above threecriteria are likely to apply and you’ll likely want to sell and redeploythat capital.
Timing any sells
A final thing to bear in mind in terms of when, rather than whether,to sell is the well documented price action around the ex-dividend
When to sell 90
day – as we’ve discussed, stock prices tend to see a run-up in theperiod immediately before the ex-div date and fall by less thanthe amount of the dividend on the ex-div date itself. While markettiming on its own is generally futile, this does provides a relativelypredictable pattern that is worth bearing in mind when you’reconsidering a stock sale or purchase for other reasons.
SocGen research indicates that, in Europe, with its often annualor large final dividend payments, ex-dividend dates and paymentsare highly concentrated in April and May. The bulk of these ex-dividend events occur in these two months, which contain over65 percent of all the ex-dividend events and 50 percent of totaldividend payments for the year. Unless you’re a forced seller forliquidity reasons, it’s best not to sell a stock around these dates.
Further Reading
• When is it time to sell a Dividend Stock⁴¹• 3 Reasons to Sell a Dividend Stock⁴²
⁴¹http://investorplace.com/2012/08/when-to-sell-your-dividend-stocks/⁴²http://dividendmonk.com/3-reasons-to-sell-a-dividend-stock/

Chapter 9
Where to find dividendstocks
Where can you find good ideas? Of course, that’s the million dollarquestion and there is no one definitive answer. While many ofthe ‘City grade’ resources used by professional investors have beenaround for a long time, the good news for all of us is that a great dealof it is now available on the Internet. Combine that with improvedaccess to market data, increasing scrutiny of companies and theiraccounts and the explosion of successful investors documentingtheir activities through books and blogs, and the prospective Divi-dend Investor has an armoury of resources close at hand.
To generate ideas, we’re big believers in a) starting with quanti-tative stock-screening b) leveraging the power of the Web and c)reading as widely as possible to learn from others, following CharlieMunger’s words of counsel:
“In my whole life, I have known no wise people (over abroad subject area) who didn’t read all the time – none,zero… You’d be amazed at howmuchWarren [Buffett]reads – and how much I read.”
The Quant Approach - Screening andIndices
“A man who dares to waste one hour of time has not discovered thevalue of life.” Charles Darwin
Screening the market by using a set of quantitative criteria is a greatway to generate dividend stock ideas. It’s the basis of our ap- proach
Where to find dividend stocks 93
at Stockopedia and follows in the footsteps of Benjamin Graham,Joel Greenblatt and other investing luminaries. The benefit of quantscreening is that it is a dispassionate approach that highlights outof favour names that may be being overlooked.
Humans are emotional, spontaneous and biased animals designedprimarily for a bygone hunter gatherer age, certainly not for ad-vanced financial analysis! Too often, that means that people tendto generate their investment ideas in anecdotal or circumstantialways based on gossip or tips, rather than focusing systematicallyon the best ideas. Screening helps to counteract these behaviouralweaknesses and can help you find the real hidden gems.
Screening for dividend stocks can come in several forms, all ofwhich are worth considering:
1. Checking daily ranking lists like the list of the highest yield-ing stocks in themarket and highest forecast dividend growthrates. These ‘raw’ lists can often highlight surprising names.
2. Following Guru screens based on the approaches of investorsthat you respect - for example the Dogs of the Dow or Geral-dine Weiss strategies previously discussed. There are manyhighlighted at the Stockopedia Screening portal, including allof the strategies discussed in the previous sections.
3. Running your own screens, based on metrics you’ve founduseful (and ideally back-tested).
For this, apart from Stockopedia itself, there are the usual fi-nancial data website suspects, but relatively few of these siteshave much of an income focus. One site that does is Dividend-Investors.com. Registration is required but it has a handy UKversion (www.dividendinvestor.co.uk). It provides investors withbasic divi- dend data aswell as its DividendAll-Star Ranking, whichlists top- performing dividend-paying stocks. It also includes somebasic in- come screening capabilities, along the lines of our HighYield lists and our screens like the Dogs of the FTSE.
Where to find dividend stocks 94
Dividend History Indices
Any dividend growth investor worth his salt is keen to examinedividend histories over long timeframes. In the US, this is easy asthere are publicly available indices or lists:
DividendAchievers - This is a list maintained by Indxis of US com-panies that have increased their annual regular dividend paymentsfor the last 10 consecutive years.
Dividend Aristocrats – This is a list of large cap, blue chipcompanies within the S&P 500 that have consistently increas- ingdividends every year for at least 25 years. It is maintained by S&P.
Indxis has also launched a UKDividends Achievers Index but it justdefines Achievers as a meagre 5 years of increased dividends (notsuch an achievement really!). Fortunately, S&P has now launcheda UK equivalent of its Dividend Aristocrats Index, SPDR S&P UKDividend Aristocrats. This tracks the 30 highest dividend- yieldingUK companies that have increased or held dividends stable forat least 10 consecutive years. They have also launched a relatedETF. S&P also produces an index of consistent dividend payersfor European companies, the S&P Europe 350 Dividend Aristocratindex. However, you can also screen for up to 10 years of DividendStreak on Stockopedia, and then layer on any other value, growthor other filters as you see fit.
For globally minded investors, it’s worth checking out a Dutch sitecalled Top Yields, which has good global data. And for those inter-ested in fixed income more generally, it’s worth checking out theresource built by Mark Taber at fixedincomeinvestments.co.uk.
Stockopedia Subscriber Tips
In addition to these lists, it’s also worth consulting the Drip Invest-ing Resource Center. This site is updated by David Fish and themaster spreadsheet includes 3 different lists: � - Dividend Cham-pions - a list of US companies that have increased their dividends
Where to find dividend stocks 95
for 25 years. - Dividend Contenders - a list of US dividend streakcompa- nies from 10-24 consecutive years. - Dividend Challengers- a list of US companies who have increased their dividends from5-9 consecutive years.
Until recently, there’s been no real UK equivalent to these lists,apart from within the investment trust space where the Associationof Investment Companies publishes a list of trusts that have in-creased dividends for the longest number of consecutive years. Topof the table are the City of London Investment Trust, the AllianceTrust and the Bankers Investment Trust, all of which boast 45 yeardividend growth streaks!
Stock Screens⁴³ - we are tracking a growing collection of investmentmodels and stock screens based on investment classics, academicresearch and famous investors (including all the strategies discussedearlier). For the current top performers, click here⁴⁴. Alternativelyyou can ‘fork’ our models and tweak.
The Scuttlebutt Approach
Screening can sometimes throw the baby out with the bath water.As a hard edged approach it can’t pick up the many sizeabledividend opportunities that may be available in ‘the cracks’ of thestock market. The best way to find them (without doing the workyourself!) is to dig into the ‘scuttlebutt’ of conversation that lies outthere in the blogosphere.
Blogs
There are a growing number of high quality investment blogsthat focus on value opportunities and dividend payers. In the UK,the best blogs are mostly value-focused (e.g. Richard Beddard ofInteractive Investor) which often have a significant overlap with
⁴³http://www.stockopedia.com/screens/⁴⁴http://www.stockopedia.com/screens/
Where to find dividend stocks 96
dividends. But the best dividend focused blogs tend to be NorthAmerican which are well worth reading even if you don’t investthere, especially:
The Dividend Guy Blog - Dubbed as “one guy’s journey to passiveincome through dividend investing”, this is a popular US stock idea& analysis blog that has been around since 2005.
Dividend Growth Investor - Set up in 2008, this blog shows howone investor has implemented the dividend growth strategy and isa useful source of stock ideas.
Dividend Growth Stocks - A blog/site dedicated to the proc- essof identifying superior dividend investing using a value- basedapproach. He also writes as Dividends4Life.
Div-Net - This is an aggregation site and investor network set upby various bloggers which is focused on dividend invest- ing.
Disciplined Investing - This is the blog of David Templeton andHoran Capital Advisors. It covers a range of topics, in- cludingmacro, but there’s some good dividend coverage in there.
Other useful North American blogs include Dividend Ninja, Divi-dend Monk, Dividend Maven and Passive Income Earner.
The UK dividend blogging scene is a bit lacklustre frankly. Still,it’s worth checking out the blog of the Munro Fund. Munro is atracker fund which uses gross cash dividends to weight its holdingsso they focus hard on the dividend universe. The Monevator bloghas some good dividend coverage, including an excellent four partguide to building your own HYP. Another good blog is DIY IncomeInvestor – it also discusses bonds etc. but has some good cover-age of dividends and a good, free e-book. Steven Dotsch’s DividendIncome Investor is also worth a read.
Bulletin Boards
Bulletin boards can be a useful source of ideas and ways to track“scuttlebutt”. It’s worth being aware of the herding instinct that
Where to find dividend stocks 97
can exist on social media sites, though. Social finance site, SeekingAlpha is the spiritual home of income invest- ing discussion, albeitwith a strong US focus. The most followed / active contributorsin the DGI space tend to be David Van Knapp, David Fish, ChuckCarnevale and Norman Tweed.
The High Yield Portfolio (HYP) discussion area on the Motley FoolUK is also worth perusing. Incidentally, on the Motley Fool USA,Todd Wenning has also published a number of useful ‘DividendReport Cards’ for both the UK and US markets.
Tip Sheets
Since we believe in self-education/reliance, we are generally notkeen on tipsheets but we’d make an exception for Stephen Bland(a writer for Fool & Moneyweek). He writes the Dividend Letterand is one of the better online advocates for high yield. Amongstthe investing magazines, the Bearbull column of the Investor’sChronicle magazine is often insightful. From 2000-2011, the returnsfrom the Bearbull Income Portfolio income fund were apparently 9percent, versus just 0.3 percent for the FTSE All- Share index.
And, last but not least, there’s a useful application and onlineresource called… Stockopedia⁴⁵!
Key Stockopedia Subscriber Tips
Scuttlebutt - On top of our own market analysis, we syndicatemany of the best blogs and research on the web and host a vibrantdiscussion community. You may find some of the best ideas &comment on our boards.
Piggybacking the best fund managerideas
“Where are the customers’ yachts?” Fred Schwed
⁴⁵http://www.stockopedia.com
Where to find dividend stocks 98
While there are many well managed mutual funds that can bea great source of dividend ideas, for the most part we’d hazardagainst investing in them. In other books we’ve discussed howmostactively managed funds struggle to outperform due to high fees andmisaligned incentives of the managers. But that doesn’t mean thatthey can’t be a great source of ideas… if you know how to look!
Perhaps the best known “Equity Income” focused fund manager inthe UK is Neil Woodford. Previously at Invesco and now runninghis own fund, Woodford has had considerable historic success. Itcould be argued that those fundswill struggle tomatch their historicrecord due to the asset bloat that comes with long term success -but there are certainly many other smaller funds in the UK EquityIncome sector that are worth tracking.
Fund managers tend to keep their cards fairly close to their chest sotheir public commentary can be a little bland. Still, the Web makesit relatively easy to build a list of the better professional investors,particularly those whose philosophies you share, and look at theirholdings directly. This is much easier in the US due to differencesin disclosure requirements, but TrustNet still provides a very usefulresource for UK stock pickers looking to piggy back the pros.
As a starting place to find the better UK income funds, SanlamPrivate Investments in Bath publishes an influential guide. Its half-year review divides UK Equity Income funds into a white ‘buy’ list,a grey ‘hold’ list, and a black ‘sell’ list based on total returns and riskover five years. Clearly, this is just a backward-looking exercise butit’s as useful a way as any other for separating the sheep from thegoats. It’s worth noting though that much research suggests thatrecent 3-5 year top performers tend to gather 95 percent of newinvestor’s money and as a result often fail to replicate returns.
For each of thesemanagers, you can see a list of their top 10 holdingson TrustNet. However, these lists are just a starting point as theyare usually only a very small sample of the stocks held. To dig a bitdeeper, it’s best to revert back to the Annual Report for each Fund.

Where to find dividend stocks 99
Further Reading
• Fred Schwed: Where are the Customers’ Yachts?: Or a GoodHard Look at Wall Street⁴⁶
• Sanlam Private Investments, The White List⁴⁷
⁴⁶http://www.amazon.co.uk/Where-Are-Customers-Yachts-Investment/dp/0471770892⁴⁷http://www.whitelist.co.uk
Chapter 10: Conclusion
“Education is an admirable thing, but it is well to remember fromtime to time that nothing that is worth knowing can be taught”Oscar Wilde
Dividend investing has come a long way since it was first inventedduring the 1600s – and some of the earliest lessons on what worksand what doesn’t still very much apply. Back then, the Dutch EastIndia Company was emerging as an international powerhouse witha menacing mix of colonial and trade ambition, and it claimed ahandful of corporate firsts in the process. It was the first business toissue stock to raise capital – and it founded the world’s first stockexchange to do it, in Amsterdam. It also pioneered dividends asa means of regularly liberating profits to the investors that werebacking its risky, albeit lucrative voyages to the East.
For 200 years the Dutch East India Company paid an average 18percent annual dividend and in 1669, the payout on its shares rep-resented a heady 40 percent of its stock price. But as competition in-creased and revenues were squeezed the company took increasinglydrastic measures to prop up those shareholder payments. Inevitably,paying out dividends that exceeded surplus cash contributed to thecompany’s implosion in 1798. Among its dubious achievements, theDutch East India Company showed the world what damage couldbe done with a frothy yield and no cover!
More than 300 years later, keeping track of dividend yields, corpo-rate quality, and the potential for long-term dividend growth re-main the key challenges for income investors. But these are chal-
101
lenges that the brightest minds in finance have been learning toovercome ever since and it’s been our goal throughout this book tolearn all that they have to offer.
But a note of caution. Many investors wish to build the kind of lowvolatility high return portfolio that dividend strategies can deliver,but so few manage to stick to this route due to a perceived lack ofexcitement. The most important challenge we all face is to take toheart the sound underpinnings of why these strategies work andhave faith that the return drivers are still in place even when theyunderperform in the short term.
As Warren Buffett has said, “Investing is simple, but not easy”, andthe hardest thing to do is to stick to a well conceived plan wheneveryone else is having a party. If you can learn to avoid excitement,lengthen your investment timeframe from a few months to a fewyears and focus on higher quality, higher yielding stocks then youare well on your way to lasting success - just don’t forget to reinvestthose dividends!
Safe Investing.

Chapter 11: Appendix
Dividend BasicsWhat are Dividends?
Dividends are the profits distributed to shareholders by the corpo-ration, when a company decides to share part of its profits withthe shareholders this is called the dividend. When a companyproduces a profit it can be either reinvested into the business tofuel further growth or it can be distributed to shareholders. Whena company is established and has a strong cashflow it will startdistributing dividends - you won’t find many start-up companiespaying dividends.
How much is paid and when?
A company’s Board decides howmuch each dividend payment willbe. Each company will typically have its own dividend policy inwhich it outlines what percentage of the profits will be distributed,but companies are under no obligation to pay a dividend of anyset level. Usually, this percentage ranges between 15-50 percent de-pending on the strength/maturity of the company and the volatilityof its cashflows. Once the dividend has been declared, it will be paidto every shareholder.
In the UK dividends are normally paid semi-annually, after a com-pany’s interim and full-year results (e.g. split one-third at theinterim stage and two-thirds at the year-end). However, some largercompanies pay out dividends each quarter. The process of paying adividend has several stages:
1. Announcement/Declaration Date: When a company pub-lishes its results, normally between one and three monthsafter the end of each half-year period, it will declare howmuch and when its next dividend payment will be. At the
Dividend Basics 104
time a dividend declaration is made, the company will typi-cally announce three dates alongside the payment. These arethe record date, the payment date and the ex-dividend date,although the phrasing used in the announcement may bedifferent, eg. the dividend “…will be paid on [payment date]to shareholders on the register at [record date]”.
2. Ex-dividend (or ex-div) date: This is the date by which abuyer needs to have bought shares in order to be entitledto a divi- dend payment. It’s usually a Wednesday. Sharesnormally trade on the basis of cum (with) dividend so, on theex-dividend date, the share price will typically fall by roughlythe amount of the dividend. If you hold shares in a companyand do not realise what’s happening, this drop can be ratherdisturbing but it does make sense as the company is noweffectively worth less for new buyers of shares. If a seller hassold the shares prior to the ex-dividend date and has receiveda dividend, this has been paid in error and a dividend reclaimwill be raised to pass the dividend to the correct owner.
3. Record date: (also known as the ‘books closed’ data orthe ‘on-register date’) This is the date (usually a couple ofdays after the ex-dividend date) when the company checksits register to see who is entitled to a dividend. Dividendentitlement however is still based on the ex-dividend date.This is often a Friday. On the standard T+3 settlement systemoperated in the UK (i.e. a trade settles three days after it isexecuted), investors need to buy a stock three days prior tothe record date (that’s to say, the day before the ex-dividenddate) to be sure of qualifying for the dividend payment, sincethree days for settlement is needed before the shareholder’sname goes on the register.
4. Payment date: This is the date that dividend cheques areposted or bank accounts are credited. It typically comes twoweeks after the record date but it may even be months afterthe record date, so it is important to be aware precisely when
Dividend Basics 105
the payment is likely to be made. Note that if you buy theshares between the ex-dividend date and the payment datethen you won’t be entitled to that dividend. In newspapers,this period is often denoted by the letters ‘XD’ next to theshare price.
How to calculate dividendyield
To calculate the historical dividend yield, you need to divide thelast year’s dividend per share by the current share price. Make sureyou are using all the payments in a given year or use a ‘trailingtwelve month’ period. Simply multiplying the half-year (interim)payment by two is unlikely to work, because companies typicallymake a larger final payment than the interim payment.
A key problem with historic yield is that a company’s currentshare price valuation is likely to factor in expectations about thefuture, not just information about its past payments. In contrast,the forecast dividend yield is based on an estimate of what thetotal dividend payment for the current year will be (e.g. by usingconsensus forecasts from analysts). It is therefore more subjectivebut may capture important information about the company’s futureprospects.
The rolling yield is based on weighting the current and forecastyield depending on how far the company is through its financialyear-end – this adds comparability across stocks.
Worked example
Let’s imagine that in March you bought into pharmaceutical groupAstrazeneca at 2958p a share. It paid a full year annual dividendof $2.80 last year end in December and is forecast to pay $2.94next year. In that case, the historic yield would be 5.97 percent atthe time of purchase and the forecast yield would be 6.27 percent,whereas the ‘rolling’ yield would be 6.04 percent a quarter of theway between.
Which yield should you focus on?
How to calculate dividend yield 107
It rather depends. If you’re evaluating a well-monitored blue chipshare, analysts’ forecasts are likely to be more accurate so it’s prob-ably safer to base your decisions on the forecast yield or a rollingyield. If you’re considering investing in a more neglected, small-cap business, you may want to approach it with a greater degree ofscepticism or consider developing your own forecast. Either way,it’s worth checking if there are special circumstances that couldmean that the dividend payment in question is unrepresentative(for instance, has the company made a one-off special dividend dueto an asset disposal?).
Current Yield vs. Yield on Cost
A final distinction worth being aware of is between current yieldand yield on cost. The yield on cost is the current dividend pershare divided by the original pur- chase price. It is often thenumber focused on by an investor but it doesn’t actually reflectthe opportunity cost of continuing to hold your shares versus otherhigher yielding opportunities that may be available to you in themarket right now.
How to minimise dividendtaxes
As we’ve discussed, it’s important to keep a close eye on taxeswhen investing in dividend stocks. Historically, dividend incomehas almost always been taxed less favourably than capital gainsand income is taxed upfront. Berkshire Hathaway’s Charlie Mungerillustrates why this matters with the example of an investmentoffering a 10 percent annual return which pays taxes every singleyear against one that pays all taxes in a lump sum at the end: “Youadd nearly 2 percent of after-tax return per annum from commonstock investments in companies with tiny dividend payout ratios.”
But it’s not all bad. The Treasury is kinder to basic rate tax payersand you can prevent taxes from eroding your portfolio performance,as long as you remember to always buy them in a tax- efficientwrapper like an ISA or a SIPP in the UK. We’ll make a fewsuggestions below for maximising total returns.
In essence, dividend investment is basically subject to three formsof tax: stamp duty, capital gains tax and income tax.
1. Stamp Duty This is a flat 0.5 percent tax on buying all shares(but not unit trust shares as the trust pays it). There’s notmuch that can be done about this. Frankly, this is an arbi-trary tax on investing that most sensible commentators thinkshould be repealed but, unfortunately, this looks unlikely tohappen any time soon for political reasons. Of course, stampduty is not applicable if you’re spread-betting and, while youmight assume that dividends are not payable when spread-betting, in fact they are. However, it’s important to calculatethe interest charges built into the spread and compare this
How to minimise dividend taxes 109
cost vs. the stamp duty you’re saving on. While spread-betting may be attractive over the short-term, it’s likely to befar less attrac- tive for long-term “buy and reinvest” dividendincome investors.
2. Capital gains and capital gains tax (CGT) A capital gainis made if you sell a dividend stock for more than you paidfor it. Each tax year you have a capital gains tax (CGT)allowance which is known as the annual exempt amount.This is the amount of profit you can make from disposingof assets in that tax year without having to pay any CGT.Any profits above this amount are taxed. The profit is addedto your taxable income for the year and any part of the profitfalling within your basic-rate band is taxed at 18 percent,anything more at 28 percent. However, some investmentsare exempt from CGT such as gilts, most corporate bondsand stocks & shares ISAs. It’s important to keep track of off-setting capital losses but remember - you can’t use losses onISA investments to reduce Capital Gains Tax on profits frominvestments outside the ISA.
3. UK Dividend Income Tax If you have ever been a share-holder in a UK company, it’s likely that at some time you’vereceived a dividend cheque in the post and the joy thatcomes with knowing that this is income that you haven’tactually had to earn. But you also receive with your chequea tax voucher that shows the amount of the dividend you’vereceived from your shareholding and an additional tax creditline. These both add up to your gross dividend in- come andgenerally create a bunch of confusion.
Double Trouble: What is this tax-credit anyway?
Dividends are paid out of a company’s net (after tax) profits.But dividends are treated as income by the taxman, and as aresult are liable to be taxed at the prevailing rate of income tax.This effectively leads to a form of ‘double taxation’ whereby if a
How to minimise dividend taxes 110
company paid out all its profit as dividends, the cash received by theinvestor would be taxed twice - first by corporation tax, secondlyas income tax.
Since 1999, all UK company dividends have carried a tax credit of 10percent. The tax credit applies to all dividends regardless of whetherthe shares are held directly or in a fund such as a unit trust, OEIC orinvestment trust. The 10 percent tax credit can be set against yourtax liability, but your ability to “use” that tax credit depends onwhether you are a non-taxpayer, a basic rate taxpayer or a higherrate taxpayer. This effectively means that basic rate tax-payers gettheir dividends tax-free, while still hitting the higher tax payers atan effective rate of 25 percent or 36.1 percent depending on the taxband.
How it works
At the basic level this works a bit like PAYE. The divi-dend issuingcompany is deemed to be paying the basic rate of income tax(10 percent) for you at source on your gross dividend income,before sending you your post-tax dividend cheque. Once this wholeshenanigan has been applied, the dividend you actually get in thecheque is the actual dividend advertised by the company. Phew.
In reality, the tax credit system means that investors earning a totalannual taxable income below £42,475 (i.e. 34,370 plus the tax freeallowance of £8.105) are required to pay no tax whatsoever on theirdividend income (figures correct as of December 2012). This isbecause, for these individuals, dividend income is taxed directly atsource at a rate of 10 percent.
If, on the other hand, your total annual taxable income is morethan £34,370 above the allowance but less than £150,000 you will berequired to pay dividend tax at a rate of 32.5 percent. However, the10 percent tax credit mitigates your liability, bringing the ‘real’ ratedown to 25 percent. Similarly if you pay a total of 42.5 percent taxon dividend income that exceeds the higher rate Income Tax limit
How to minimise dividend taxes 111
of over £150,000, the effective rate owed on the dividend incomewould be 36.1 percent.
• Non-tax payers lose out If your total income (includingdivi- dend income) is below the annual £8,105 allowance (i.e.you are not a taxpayer), you don’t have to pay any more taxon the dividend, but unfortunately you cannot recover thetax you’ve already paid (or which you are credited as havingpaid). In effect the 10 percent is lost.
• Basic rate tax payers effectively pay 0 percent tax ondividends So if you are a basic rate taxpayer (< £34,370income above your £8,105 base allowance) you end up payingno tax at all on your dividend as your income tax liabilityis exactly equal to the tax-credit issued and paid for youby the company (10 percent!). If you receive a £90 dividendcheque the company has actually issued youwith a tax-creditadjusted £100 gross dividend but paid the £10 in tax for you.As a result basic rate tax-payers then don’t need to worryabout whether dividends are received in an ISA or not, aseffectively they are paying no tax on dividends anyway.
• Higher rate tax payers effectively pay 25 percent tax ondividends Higher rate tax payers (> £34,370 but < £150kincome above your base allowance) pay 32.5 percent tax ongross dividends, but as they’ve already paid 10 percent beforereceiving their net dividend cheque the effective additionaltax they have to pay becomes 25 percent. An example helps -imagine you receive a gross dividend of £1111 (i.e. a dividendcheque of £1000 + a £111 tax credit). That £1111 is taxed at32.5 percent to leave you with £750 net after all taxes - so ontop of the £111 tax paid at source, you effectively have to payan additional £250 (25 per- cent) on top. Unfortunately taxpayers in this band are suffering from the aforementioneddreaded double taxation.
• Additional rate tax payers effectively pay 36.1 percent ondividends Additional rate tax payers ( > £150k income above
How to minimise dividend taxes 112
the base allowance) pay 42.5 percent tax on dividends, but asthey’ve already received the 10 percent tax credit effectivelythe rate becomes 36.1 percent. e.g. imagine you receive a grossdividend of £1111 (dividend cheque of £1000 + a £111 taxcredit as in the example above). In this case the £1111 receivedis taxed at 42.5 percent to leave you with £638.88 net - i.e. youeffectively have to pay an additional 36.1 percent on yourdividend cheque received or just over £361.
Tax-efficient investing
Still, you can benefit from the reported out-performance of dividendstocks as long as you always buy them in a tax-efficient wrapperlike an ISA, a Child Trust Fund or a SIPP. With these investmentaccounts, taxes are either waived or deferred allowing dividendincome to accrue and allowing it to be reinvested at the full faceamount. The higher your income tax bracket, the more importantit is to do this. One of the biggest mistakes an investor can make isto forget this.
Any gains from investments in an ISA are tax-free and income isalso tax-free although you cannot reclaim the tax credit paid ondividends. Contributions into a pension scheme attract income taxrelief. Also, when you sell the investments to buy an income inretirement, part of this money can be taken as a tax-free lump sum.
If you are an ambitious shareholder, you’ll be planning on reinvest-ing dividends and growing your pot over time. While basic rate tax-payers may think that it doesn’t matter whether they buy dividendpaying stocks in a tax-free wrapper or not (as they effectivelypay 0 percent dividend tax) the truth is that if they reinvest theirdividends consistently their shareholdings will grow to the pointwhere their dividend income will tip them over to the higher ratetax band. At this point they’ll suffer from double taxation anddearly wish they had bought them elsewhere. Given this it might bewise to always buy dividend paying stocks in a tax-free wrapper!
Other Dividend StrategiesDividend Surprises
“Dealing with ‘known knowns’ not only reduces forecast risk butenables an intuitive approach to stock selection”, Gerard Lane, ShoreCapital
One seldom discussed – but very interesting – strategy is the onerecently outlined by investment strategist Gerard Lane in a ShoreCapital note. This involves focusing in on dividend surprises as asign of company quality. A dividend surprise is not only a welcomefinancial boost but it’s also a confident message from managementthat’s likely to have a positive influence on the share price as well.However, according to Lane, “there is much more proliferation ofstory around earnings upgrades and downgrades”, which meansthere is a greater tendency to move sales and earnings numbersamong analysts and less tendency to focus on the resulting dividendchange.
How it works ShoreCap defines the ‘dividend surprise factor’ asthe difference between what was forecasted 12 months ago for theforthcoming 12 months and what was actually delivered during theperiod on a dividend per share basis. By comparing historic 12-month dividend forecasts with how stocks then go on to perform,it is possible to lift the lid on those companies that are confidentenough about their future to beat market expectations.
Why it works The line of thinking here isn’t actually too farremoved from the concept of scouring the market for EarningsSurprises as a source of superior returns. This phenomena is knownas ‘Post Earnings An- nouncement Drift’ – and research has foundthat stocks that beat analyst forecasts tend to outperform themarketfor the next 6-12 months. This is generally credited to the fact that
Other Dividend Strategies 114
analysts are slow to revise these forecasts and the market does notfully react to the information about future growth conveyed by theearnings surprises.
As it turns out, this thinking can also be applied to dividends too –and it works even better. According to research by Michaely, post-dividend price drift “is distinct from andmore pronounced than thatfollowing earnings surprises”.
A higher than expected payout combined with management sig-nalling optimism about the future mean that dividend surprisesoffer an intriguing and exciting pursuit for dividend investors thatare looking for outperformance from their stocks. According toLane, dealing with ‘known knowns’ not only reduces forecast riskbut enables an intuitive approach to stock selection of favouringthose companies that have over-delivered on dividends comparedwith previously held expectations.
Can it beat the market? The original research by Michaely sug-gested that going long surprises could be a profitable strategyin 22 out of 25 sample years but this also involved going shortdividend cutters, which may not be feasible for many investors.Lane’s research suggests that the pursuit of companies that haveproduced dividend surprises can be a strong trading strategy evenin troubled times. It’s a short time frame but, during the 12 monthsto the beginning of April 2012, companies with the top 10 percentof dividend surprises apparently returned over 3.6 percent moreon an equal-weighted basis in capital returns versus the FTSE 350benchmark.
Key issues
• Limited empirical evidence, especially as applied to the UK
Further Reading
Other Dividend Strategies 115
• Price Reaction to Dividend Initiations⁴⁸
Dividend Stripping
“A change in dividend policy could cause a costly change in share-holder wealth”, Edward Elton
A final way to play the dividend game is to the idea of ‘arbitragingthe dividend calendar’ using an approach known as dividend-stripping. What happens on/around the ex-dividend day has beenthe subject of quite a lot of academic research because of two sur-prising phenomena. Firstly, there is often a small but noticeable run-up in the share price of a company just before it goes ex-dividend.This is possibly because of buying interest from investors wantingto hold the shares on the ex-dividend date and thus qualify for thepayment. Secondly, when the ex-day occurs (when the dividendbecomes payable), the share price drops but usually by less than thevalue of the grossed up dividend. Researchers Elton and Gruber didone of the earliest studies in the 1960s observing that stock pricesdrop on average by 77.7 percent of the dividend paid.
How it works A number of traders advocate a strategy of “divi-dend capture”, also known as “dividend stripping” or “ex-dividendtrading”. This involves buying a stock before the dividend is paid,holding it for a predetermined period (perhaps just overnight), andthen selling it and moving on. In essence, dividend capture is aboutcollecting (capturing) the dividend which provides income, andmaking a capital loss when the shares fall in value (in normalcircumstances) on going ex-dividend. This may be profitable if theincome is greater than the loss, or if the tax treatment of the twogives an advantage.
Why it (might) work This strange anomaly in the price fall ismost often attributed to the unfavorable tax treatment of dividends
⁴⁸http://forum.johnson.cornell.edu/faculty/michaely/Price%20Reactions%20to%20Dividend%20Initiations%20and%20Omissions.pdf
Other Dividend Strategies 116
versus capital gains in most markets. A tax advantage availableto everyone would be expected to show up in the ex-dividendprice fall. But an advantage available only to a limited set ofinvestors might not. Alternatively, it might be because collecting& reinvesting dividends is administratively more cumbersome thandealing with capital gains. Or perhaps naive investors simply forgetthat there is a dividend payout and plunge more money into thestock at higher prices the next day.
Can it beat the market? On the all-important question - is theremoney to bemade here? - the evidence is verymixed! One academicpaper titled “Taxes, Price Pressure and Order Imbalance aroundthe Ex-Dividend Day” focused on the Australian market foundthat dividend capture yielded positive profits in the 45 day run-up to the ex-dividend date. However, other studies have beenless encouraging, so the results may reflect peculiarities of theAustralian environment.
Key issues Success with this strategy is likely to turn on being ableto select those issues whose stock prices are most buoyant post thefall.
For example, stocks with good price momentum often don’t fall asmuch. However, that sounds more like stock-picking, with all its re-lated risks, rather than a form of easy “arbitrage”. Hence, dividendcapture and ex-dividend strategies are likely to work best in a neu-tral or rising stock market while, in a falling market, it’s going to bemore difficult.
Further Reading
• Taxes, Price Pressure and Order Imbalance around the Ex-Dividend Day⁴⁹
• Institutional Trading around the Ex-Dividend Day⁵⁰
⁴⁹http://papers.ssrn.com/sol3/papers.cfm?abstract_id=1314087⁵⁰http://69.175.2.130/~finman/Turin/Papers/Institutional_Trading_around_the_
ExDividend_Day.pdf
Bibliography etcBooks
Unfortunately, the dividend investing literature is just not as inter-esting or well populated as in the value investing space. Overall,we’d say that the books most worth reading (apart from this one!)are: - Aswath Damadoran: Investment Fables (it punctures a lot ofinvesting myths). - Geraldine Weiss: “Dividend Don’t Lie” & “TheDividend Connection” (there has also been a revised edition byKelley Wright – “Dividends Still Don’t Lie”). - Charles Carlson:“The Little Book of Big Dividends” (he pushes his BSD systemfairly hard but it’s still an interesting introduction to the topic). -David van Knapp: “Top 40 Dividend Stocks of 2012” (this is a good,practical exposition of the DGI philosophy). - Rodney Hobson: “TheDividend Investor” (this is fairly basic but a good introductory texton the subject).
Research papers
In terms of the best research papers on dividends, one handy (free!)synthesis is “Tweedy Browne – the Dividend Yield Advantage”.It summarises a number of studies analyzing the importance ofdividends and how they drive investment returns (for exampleRobert D. Arnott’s renowned paper, “Surprise! Higher Dividends= Higher Earnings Growth”).
We recommend getting hold of any of Societe Generale’s QualityIncome papers. While not generally available on the Web, you canfind them if you ask the right people and they are some of the mosteye opening dividend pieces you will read.
Bibliography etc 118
It’s not mentioned in the Tweedy Browne study but well worthreading is a study by Cass University called “Consistent DividendGrowth Investment Strategies”. This paper examined data for theLondon Stock Exchange from 1975-2006 for a range of incomeinvesting strategies.
It’s also worth searching SSRN for the latest research papers.