how to do fast analytics on massive datasets alexander gray georgia institute of technology...
TRANSCRIPT

How to do Fast Analyticson Massive Datasets
Alexander GrayGeorgia Institute of TechnologyComputational Science and Engineering
College of Computing
FASTlab: Fundamental Algorithmic and Statistical Tools
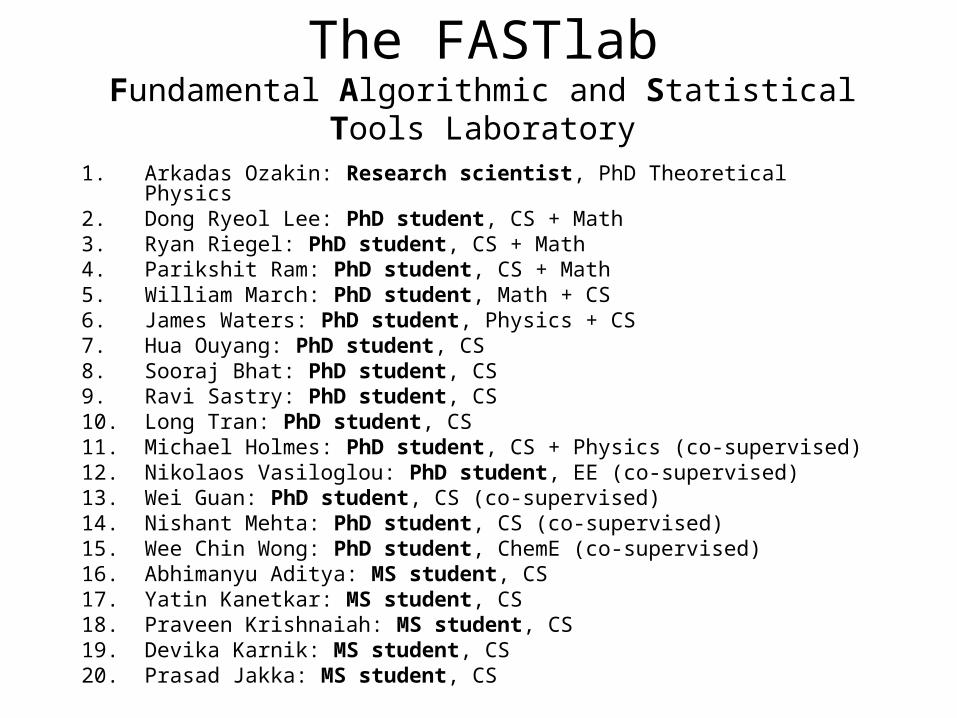
The FASTlabFundamental Algorithmic and Statistical Tools Laboratory
1. Arkadas Ozakin: Research scientist, PhD Theoretical Physics2. Dong Ryeol Lee: PhD student, CS + Math3. Ryan Riegel: PhD student, CS + Math4. Parikshit Ram: PhD student, CS + Math5. William March: PhD student, Math + CS6. James Waters: PhD student, Physics + CS7. Hua Ouyang: PhD student, CS8. Sooraj Bhat: PhD student, CS9. Ravi Sastry: PhD student, CS10. Long Tran: PhD student, CS11. Michael Holmes: PhD student, CS + Physics (co-supervised)12. Nikolaos Vasiloglou: PhD student, EE (co-supervised)13. Wei Guan: PhD student, CS (co-supervised)14. Nishant Mehta: PhD student, CS (co-supervised)15. Wee Chin Wong: PhD student, ChemE (co-supervised)16. Abhimanyu Aditya: MS student, CS17. Yatin Kanetkar: MS student, CS18. Praveen Krishnaiah: MS student, CS19. Devika Karnik: MS student, CS20. Prasad Jakka: MS student, CS
Allow users to apply all the state-of-the-art statistical methods…
….with orders-of-magnitude more computational efficiency– Via: Fast algorithms + Distributed computing
Our mission
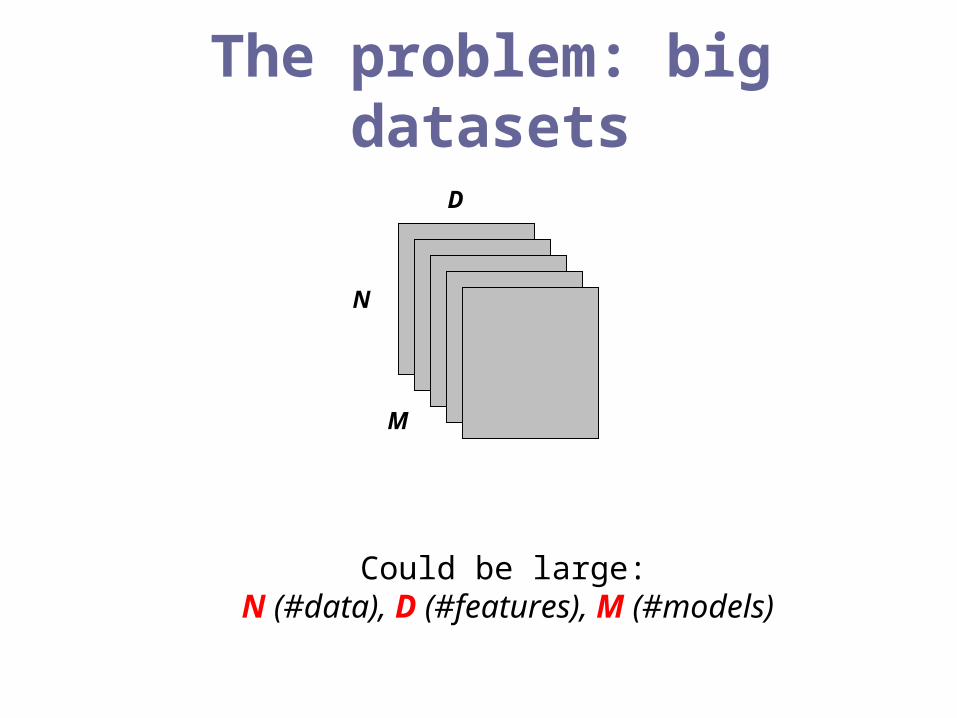
The problem: big datasets
D
N
M
Could be large: N (#data), D (#features), M (#models)
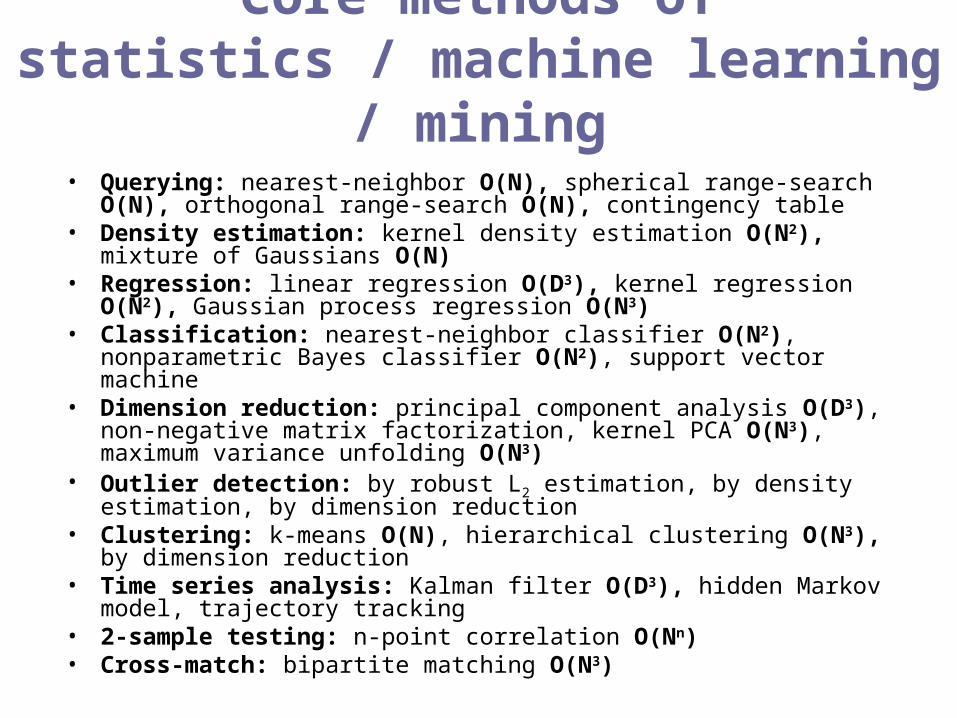
Core methods ofstatistics / machine learning / mining
• Querying: nearest-neighbor O(N), spherical range-search O(N), orthogonal range-search O(N), contingency table
• Density estimation: kernel density estimation O(N2), mixture of Gaussians O(N)
• Regression: linear regression O(D3), kernel regression O(N2), Gaussian process regression O(N3)
• Classification: nearest-neighbor classifier O(N2), nonparametric Bayes classifier O(N2), support vector machine
• Dimension reduction: principal component analysis O(D3), non-negative matrix factorization, kernel PCA O(N3), maximum variance unfolding O(N3)
• Outlier detection: by robust L2 estimation, by density estimation, by dimension reduction
• Clustering: k-means O(N), hierarchical clustering O(N3), by dimension reduction
• Time series analysis: Kalman filter O(D3), hidden Markov model, trajectory tracking
• 2-sample testing: n-point correlation O(Nn)• Cross-match: bipartite matching O(N3)
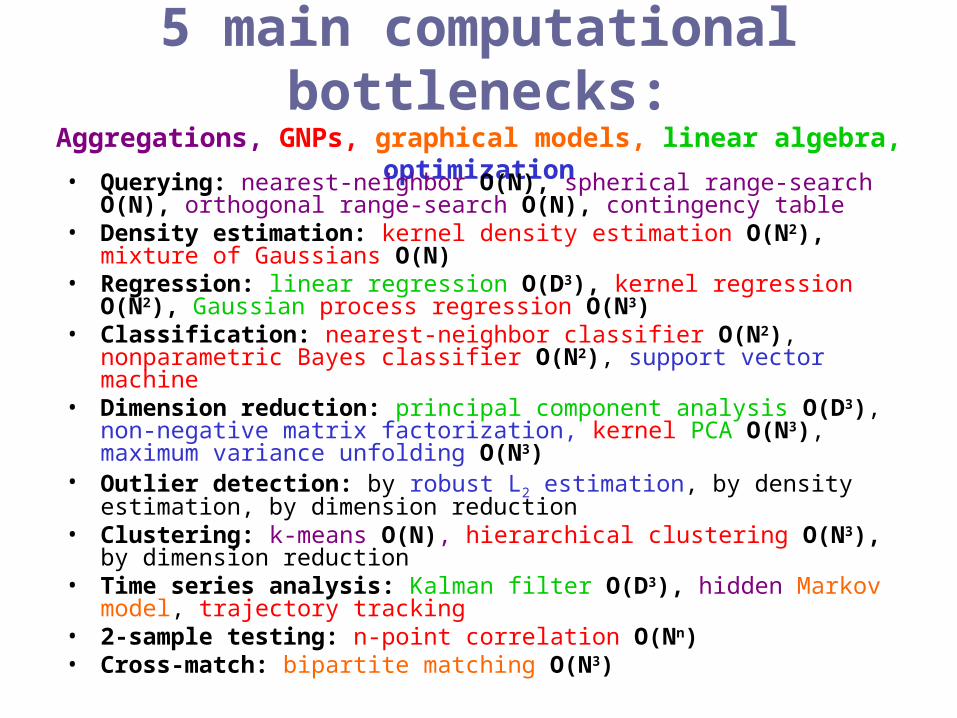
5 main computational bottlenecks:Aggregations, GNPs, graphical models, linear algebra, optimization
• Querying: nearest-neighbor O(N), spherical range-search O(N), orthogonal range-search O(N), contingency table
• Density estimation: kernel density estimation O(N2), mixture of Gaussians O(N)
• Regression: linear regression O(D3), kernel regression O(N2), Gaussian process regression O(N3)
• Classification: nearest-neighbor classifier O(N2), nonparametric Bayes classifier O(N2), support vector machine
• Dimension reduction: principal component analysis O(D3), non-negative matrix factorization, kernel PCA O(N3), maximum variance unfolding O(N3)
• Outlier detection: by robust L2 estimation, by density estimation, by dimension reduction
• Clustering: k-means O(N), hierarchical clustering O(N3), by dimension reduction
• Time series analysis: Kalman filter O(D3), hidden Markov model, trajectory tracking
• 2-sample testing: n-point correlation O(Nn)• Cross-match: bipartite matching O(N3)

Multi-resolution
data structures
e.g. kd-trees
[Bentley 1975], [Friedman, Bentley & Finkel 1977],[Moore & Lee 1995]
How can we compute this efficiently?

A kd-tree: level 1

A kd-tree: level 2

A kd-tree: level 3

A kd-tree: level 4
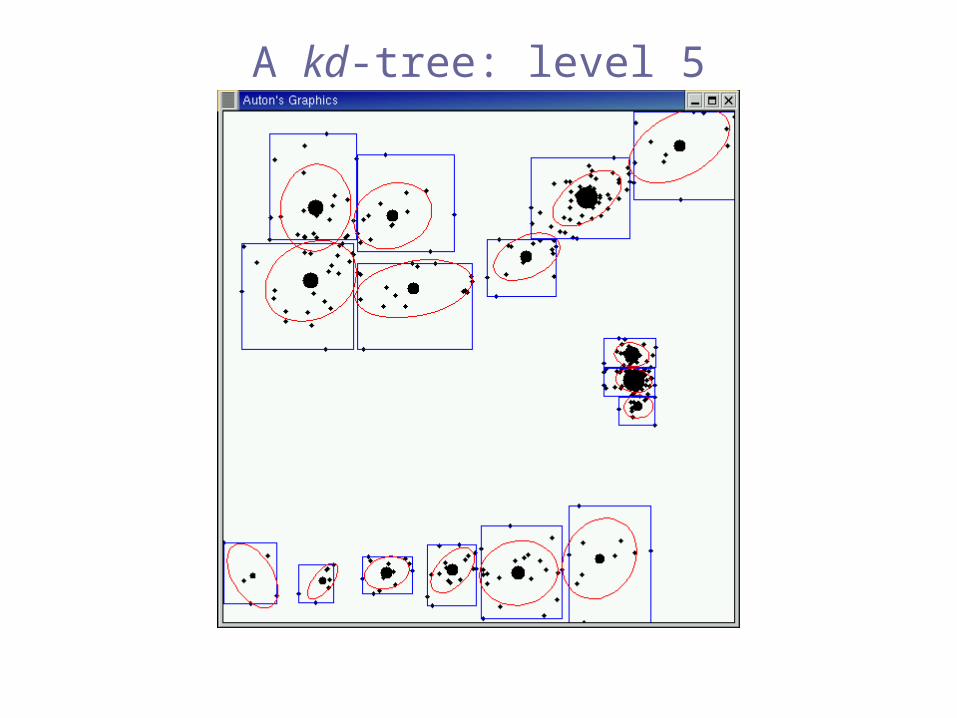
A kd-tree: level 5
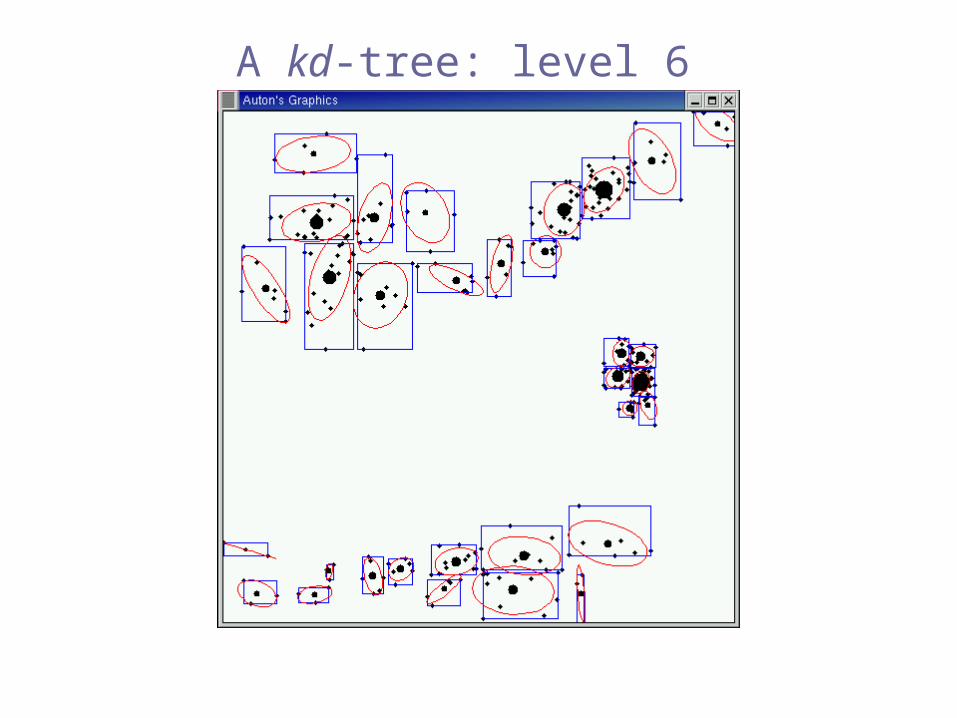
A kd-tree: level 6

Computational complexityusing fast algorithms
• Querying: nearest-neighbor O(logN), spherical range-search O(logN), orthogonal range-search O(logN), contingency table
• Density estimation: kernel density estimation O(N) or O(1), mixture of Gaussians O(logN)
• Regression: linear regression O(D) or O(1), kernel regression O(N) or O(1), Gaussian process regression O(N) or O(1)
• Classification: nearest-neighbor classifier O(N), nonparametric Bayes classifier O(N), support vector machine
• Dimension reduction: principal component analysis O(D) or O(1), non-negative matrix factorization, kernel PCA O(N) or O(1), maximum variance unfolding O(N)
• Outlier detection: by robust L2 estimation, by density estimation, by dimension reduction
• Clustering: k-means O(logN), hierarchical clustering O(NlogN), by dimension reduction
• Time series analysis: Kalman filter O(D) or O(1), hidden Markov model, trajectory tracking
• 2-sample testing: n-point correlation O(Nlogn)• Cross-match: bipartite matching O(N) or O(1)

Ex: 3-point correlation runtime
(biggest previous: 20K)
VIRGO simulation data,N = 75,000,000
naïve: 5x10⁹ sec. (~150 years)multi-tree: 55 sec. (exact)
n=2: O(N)
n=3: O(Nlog3)
n=4: O(N2)

Our upcoming products
• MLPACK (C++) Dec. 2008
– First scalable comprehensive ML library
• THOR (distributed) Apr. 2009
– Faster tree-based “MapReduce” for analytics
• MLPACK-db Apr. 2009 – fast data analytics in relational
databases (SQL Server)

The end
• It’s possible to scale up all statistical methods
• …with smart algorithms, not just brute force
• Look for MLPACK (C++), THOR (distributed), MLPACK-db (RDBMS)
Alexander Gray [email protected](email is best; webpage sorely out of date)

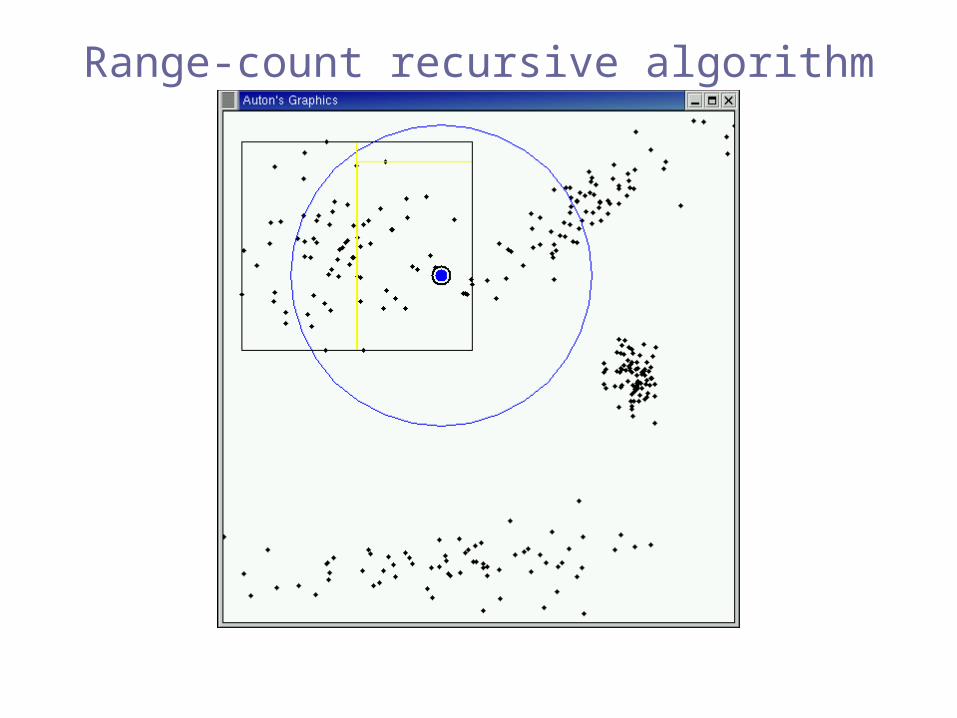
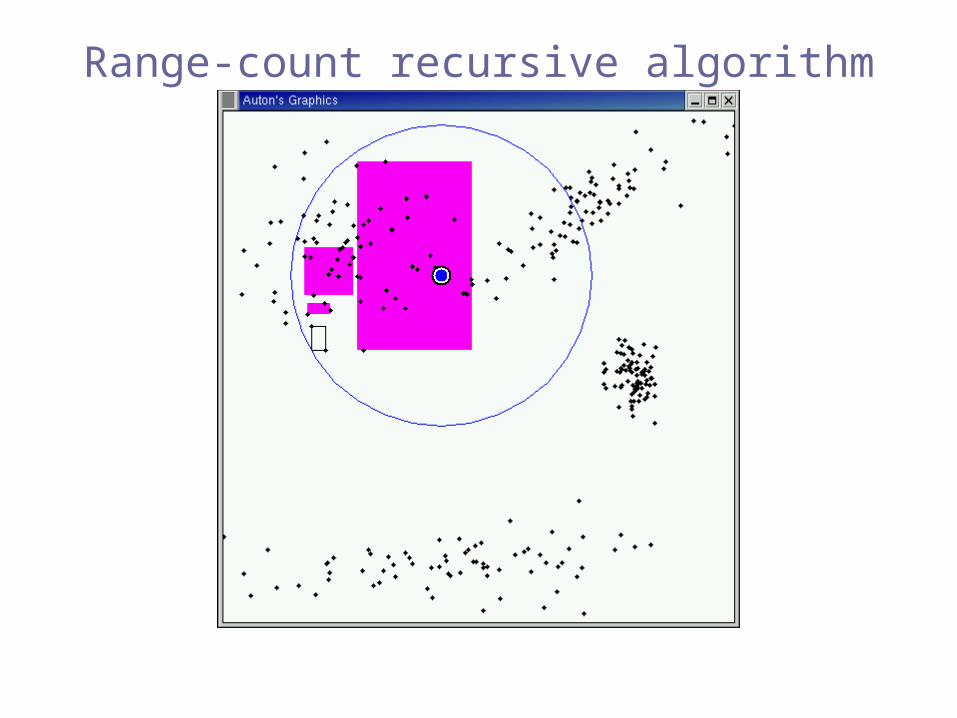
Range-count recursive algorithm

Range-count recursive algorithm
Range-count recursive algorithm

Range-count recursive algorithm

Pruned!(inclusion)
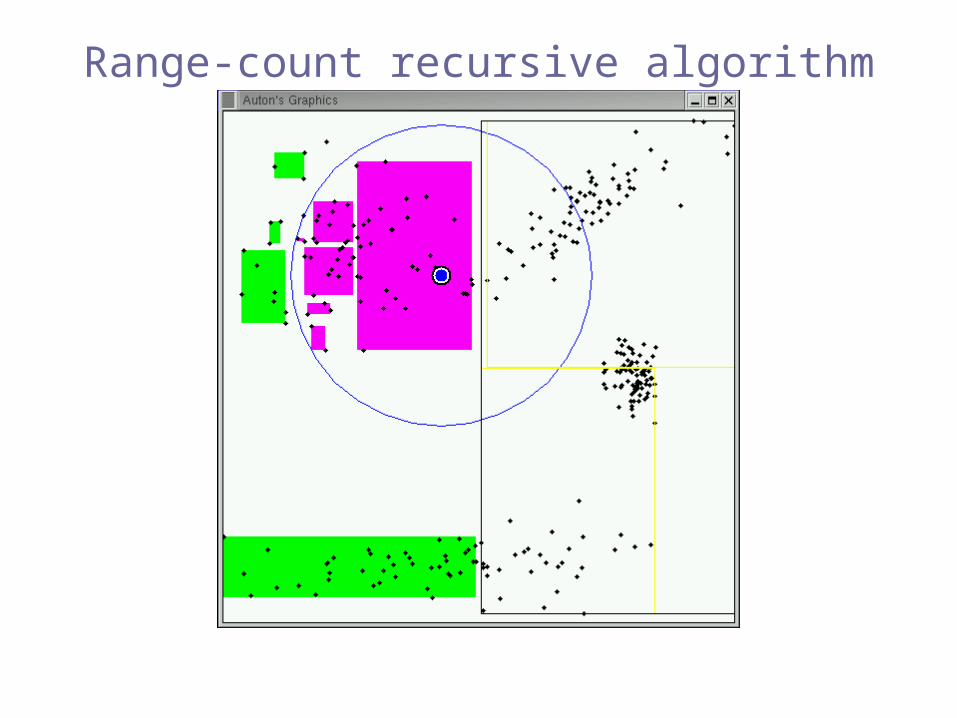
Range-count recursive algorithm

Range-count recursive algorithm

Range-count recursive algorithm

Range-count recursive algorithm

Range-count recursive algorithm

Range-count recursive algorithm
Range-count recursive algorithm

Range-count recursive algorithm

Pruned!(exclusion)
Range-count recursive algorithm

Range-count recursive algorithm
Range-count recursive algorithm

fastestpracticalalgorithm[Bentley 1975]
our algorithmscan use any tree
Range-count recursive algorithm