how to close a stock market - georgetown universityfaculty.georgetown.edu/evansm1/conference/how to...
TRANSCRIPT

Page 2 of 41
How to Close a Stock Market? The Impact of a Closing Call Auction on Prices and
Trading Strategies
Luisella Bosetti Borsa Italiana
Eugene Kandel Hebrew University and CEPR
Barbara Rindi Università Bocconi
September, 2006
Abstract
We study the effects of the introduction of the call auction at the closing stage of the trading day in Borsa
Italiana’s (BIt) equity markets. We show that the Closing Call Auction (CCA) reduces spreads and volatility right
before the close. We attribute this change in market quality to agents’ reactions to the new trading opportunity offered
by the CCA and we document this explanation by analyzing the effect of the introduction of the CCA on the trading
aggressiveness of various types of market participants around the close. We also show how the volume allocation
between the end of the continuous phase and the CCA is strongly affected by the BIt decision not to use the Closing
Auction Price as the Reference Price for the settlement of financial contracts, using instead a weighted average price of
the last 10% of the daily volume. We compare this outcome with that from the introduction of the CCA on Euronext
Paris (formerly the Paris Bourse), where the Closing Auction Price is the closing price. Finally, we investigate its
effects on the price discovery process, and show that the CCA improved price discovery of the closing prices.

Page 3 of 41
1. Introduction
Equity trading in order-driven markets may be organized as a periodic call auction, or as a continuous
auction (or continuous trading). The former has the advantage of aggregating the order flow over time, thus
creating a deeper market in which a single price is determined. The latter offers the opportunity to trade
whenever one wishes, according to some established order priority rules (usually price/time priority rules).
Stock exchanges around the world utilize both auction types; usually the day starts with a call auction, so
that the overnight information can be better incorporated into the price, and then proceeds with a continuous
auction.
The benefits of a call auction can be exploited also in the closing of the market. The closing price is
very important, since it serves as a Reference Price (RP) for the settlement of various financial contracts.
Mutual and provident funds NAV calculations, option expirations, and the entry of stocks into various
indexes are all generally based on the RP, and most compensation contracts are based on the close-to-close
returns. Consequently, exchange designers strive to make the Reference Price as reflective of the
fundamental value as possible.
Although quite uncommon today, some exchanges still use the price of the last trade as RP. The
problem with this approach is that the last trade price can be manipulated by traders with specific interests
(see the arguments and evidence in Hillion and Souminen 2004). The danger is especially high in markets
with low levels of liquidity, where the cost of such manipulation is low. As a result, some exchanges use a
volume weighted average price towards the end of the day as a Reference Price. While this practice reduces
the degree of manipulation, it introduces an inherent bias in the settlement price, relative to the end-of-the-
day fundamentals. This bias is amplified by high intraday volatility. Moreover, as we show later, institutions
wishing to trade at the Reference Price under this regime must devise a complex trading strategy.
An alternative solution is to introduce an auction at the end of the day. The main benefit of a Closing
Call Auction (CCA) is that it should attract traders who want to transact at the RP. The drawback is that it
may draw a great deal of volume from the end of the continuous session, reducing liquidity and increasing
the trading cost. Exchanges also worry that if such an auction does not gather enough volume, it may be
again vulnerable to price manipulations, as discussed above. Consequently, some exchanges continue using
RP that is calculated based on a certain percentage of the daily volume, instead of the Closing Auction Price
(CAP). In such an environment, traders must again devise a complex strategy to get as close as possible to
the RP.
The magnitude of the effects mentioned above is not well understood. The current empirical evidence
on the effect of a CCA introduction is relatively scarce. Pagano and Schwartz (2003), and Hillion and
Souminen (2004) study the introduction of the CCA on Euronext Paris (formerly Paris Bourse), where the
CAP is used as a Reference Price. Both studies show that price discovery for illiquid stocks improves, and

Page 4 of 41
the volatility of the closing price declines, but do not provide much insight into the microstructure sources of
these effects, and also do not look at their effect on the most liquid stocks. Ellul et al. (2003) analyze the
CCA in London, where it represents an alternative trading venue to a dealer market. Aitken et al. (2002)
study an introduction of CCA into the Australian Stock Exchange and found mixed evidence. Overall, there
remains much uncertainty regarding the optimal closing price determination, which explains the variety of
choices among the exchanges in the world, as presented in Table 1.
[Insert Table 1 here]
This paper utilizes a unique data set provided to us by Borsa Italiana (BIt) to study the effects of the
introduction of the CCA on market quality. BIt introduced the CCA not only with the aim of providing a
better closing mechanism for the trading day, but also with the explicit intention to improve the
representativeness of the Reference Price. Given its concern about the initial liquidity of this phase, it
decided to keep calculating the RP as before, using the weighted average of the last 10% of volume rather
than the CAP. This differentiates it from Euronext Paris, where the Reference Price used to be the price of
the last trade, and became the CAP after the introduction of the CCA. Table 1 shows that many exchanges
across Europe set CAP as the RP. Figure 1presents a graph from the 2004 JP Morgan report, which shows
that the average turnover during the CCA phase varies quite significantly across equity markets. BIt, is
placed roughly in the lower half of the distribution with a turnover of 6.2%,, which is lower than 7.9% of
France and higher than 4.9% of Germany.
[Insert figure 1 here]
Borsa Italiana introduced the closing call auction on December 3rd 2001. Our sample covers trading
over January to March in three different years: 2001 - one year before the introduction of the CCA; 2002 -
right after the introduction of the CCA- and 2003 - one year later. We do not use the period right before the
introduction to avoid the contamination of the September 11th effects on the financial markets which seem to
have died out by the beginning of the following year. We study stocks in two market segments1 that differ in
their liquidity and market capitalization, however traded using the same platform and rules. This provides a
robustness test, and may also yield insights on the appropriate market-closing procedure for different market
segments. We then compare our findings with the effect of the CCA introduction in the CAC 40 stocks, the
most liquid segment in the Paris Bourse –.
This paper raises three main questions:
1. How does the introduction of the CCA affect market quality at a microstructure level? When
and why does the effect take place?
2. How does it affect various market participants' order submission strategies around the close
and allocation of volume between the continuous trading stage and the CA?
1 We report results only for two segments, but we performed the same analysis on a third segment of Bit, which is available from the authors upon request.

Page 5 of 41
3. How should the closing price be set in the presence of a CA? This is a policy question for
which we hope to provide some guidelines.
Our data identifies the trader types and the types of orders they submit, which allows us to answer these
questions. We found that the introduction of the CCA, that replaced the trading in the last 5 minutes of the
continuous session, improved market quality right before the close, decreasing spreads and volatility and
increasing the trading volumes and the average trade size.
This improvement in market quality at the end of the continuous auction stems from the fact that the
CCA offers liquidity demanders a new opportunity to trade after the continuous market close; this reduces
the aggressiveness of their order submission strategies which manifests itself with lower volatility. Both
effects induce the liquidity suppliers to offer liquidity at better prices, i.e. at narrower spreads.
The trader’s choice to use the CCA depends on three factors: firstly, the relative convenience of the
two trading mechanisms; secondly, if the trader’s performance is evaluated at the Reference Price (e.g.
mutual funds), it may affect the choice of trading venue; and third, the state on the book prior to the close.
According to the extant theory2 (see e.g. Glosten (1994), Biais, Martimort and Rochet (2000),
Viswanathan and Wang (2002) and Biais, Glosten and Spatt (2005)) retail traders benefit from the uniform
pricing rule which governs the call auction, whereas large traders benefit from the discriminatory pricing rule
which governs the continuous auction. Our empirical results suggest that large traders mainly move to the
CCA. This finding, which (apparently) conflicts with the empirical implications of the theory, can be
explained by considering the second and third factor, which influence the traders’ behaviors at the end of the
continuous auction.
The second factor applies to institutional investors, as mutual funds, that settle their accounts
based on the Reference Price. The closer is the Reference Price to the Closing Auction Price, the
more will the mutual funds be inclined to trade at the close. As the mutual funds move to the CCA,
other institutional traders will follow the liquidity they create (see Admati and Pfleiderer, 1988 for
reasoning). Thus the move will be concentrated among the large traders, looking for sufficient
liquidity.
To explain the trading choice of retail traders who apparently did not move to the CCA, instead, we
have to consider the third factor that influences traders’ strategies, namely that traders are generally
influenced by the state of the book (Parlour, 1998). In theory, small traders should move to the CCA to
benefit from the uniform (no spread) pricing rule, but if the quality of the market at the end of the continuous
auction improves highly, they can decide not to move to the CCA. Since our results show that the
introduction of the CCA significantly improved liquidity and market quality during the last minutes of the
continuous phase, we suggest that retail traders perceived this improvement and consequently decided not to
move to the CCA. We also suggest that the improvement of market quality at the end of the continuous
2
Page 6 of 41
auction did prevent all large traders to move to the CCA.
Section 2 describes the general features of Borsa Italiana’s equity markets and the overall impact of
the introduction of the CCA. Section 3 presents theoretical predictions of this event on the intraday
distribution of volume and on the liquidity parameters during the day, and documents what had actually
happened to the aggregate level and to individual stocks. Section 4 investigates which traders tend to use the
CCA, and which type of orders they use. Section 5 studies the effect of the CCA on price discovery. Section
6 presents the conclusions drawn from the study.
2. Borsa Italiana and the overall impact of the CCA In this section we describe the structure of Borsa Italiana’s equity markets, the introduction of the
closing auction , and the samples we use.
Borsa Italiana
Borsa Italiana maintains three equity markets: the electronic market, MTA, which is the main market;
the MTAX (formerly Nuovo Mercato) that lists high growth companies, and the Mercato Expandi, which is a
market for small companies. The listing requirements and trading protocols differ across these markets. We
focus on the main market, the MTA. In April 2001, Borsa Italiana further divided the MTA into different
segments by market capitalization. Companies with a market capitalization above 800 Million Euro are
classified as Blue Chip. Companies with a market capitalization of less than 800 Million Euro are referred to
as SMEs: small and medium enterprises. We limit our attention to the Blue Chip segment of the MTA.
Our sample consists of stocks that compose the MIB30 index, which include the 30 most liquid and
capitalized stocks and the next 25 stocks that form the MIDEX index. These two segments are traded under
similar rules, which are described below.
Prior to December 2001 the trading day for all the stocks in the sample proceeded as follows:
• Opening Auction (OA): Pre-auction phase (8:00am-9:15am); Validation phase
(9:15am-9:20am) that determines the opening auction price. Opening phase (9:20am-
9:30am) executing transactions at the validated opening auction price
• Continuous trading (9:30am-5:30pm), during which trades are executed through the
automatic matching of compatible orders of opposite signs in the limit order book.
On December 3, 2001, Borsa Italiana introduced the Closing Call Auction mechanism for all its equity
markets. The continuous trading phase was shortened by five minutes, and the closing phase was scheduled
to start at 5:25pm. The CCA is organized similarly to the opening auction:
• Pre-auction phase (5:25pm-5:35pm), determining the theoretical closing auction price
Page 7 of 41
• Validation phase and closing phase that together last from 5:35pm to 5:40pm3
To detect the effects of the introduction of the closing auction, we compared four sample periods: two
before the introduction of the CCA, another right after the introduction of the CCA, and the last one a year
later.
• Pre periods: January-March 2001 and August-September 2001
• Post period: right after the introduction of the closing auction, January 28 – March 22,
2002, for a total of 40 trading days, for which we observe both the orders and the
trades
• Post-post period: roughly one year after the introduction of the closing auction,
January 12 – March 5, 2003, for a total of 38 trading days – again both the orders and
the trades are observed
The financial markets were shocked by the events of the 9/11, and the repercussions were felt well into
October and November, which means that we cannot use the data from these months. This is the reason why
we have chosen the following two Pre periods: the first, January-March 2001, which is almost exactly one
year prior to the Post period, and allows us to control for possible seasonality. The second, August 01 -
September 10, 2001 was selected because the data on orders was only available starting from August 1,
2001. Consequently, we ended with two pre-CCA periods, one for trades (January – March 2001) and the
other for orders (August, 1 – September 10, 2001).
Our analyses are based on several databases made available to us by Borsa Italiana:
• Executed trades: quantity, price, time of execution, and the trading phase;
• Reference Prices4 and Closing Prices5 as calculated by the BIt;
• Orders entered during each day for each stock, including the time, price, quantity, and
broad identifiers of the originating party;
• First five levels of the limit order book including time stamp, prices and quantities.
In addition to the comparison across the two segments, we also compute similar statistics for the
CAC40 market for the period May - June 1998, around the time of the introduction of the call auction into
Euronext Paris. CAC40 is the main index of the French market, comparable to MIB30 of Borsa Italiana.
Although each Exchange sets its own rules and requirements, CAC40 and MIB30 stocks are comparable in
terms of the index inclusion criteria, as well as the trading environment. It is worth noting that the Paris 3 In January 2006 equity market’s trading hours have been slightly changed, by bringing forward the start of
continuous trading in the morning by 5 minutes and reducing the extension of the closing auction by 5 minutes (also the extension of each phase of the call auctions have been suited).
4 The reference price is the weighted average price of the last 10% of the quantity traded during the daily trading session, excluding the quantity traded using the cross-order function.
5 For the pre-CCA period, the closing price is the price of the last contract executed; in the post-CCA periods, the closing price is the closing auction price.
Page 8 of 41
Bourse added the CCA after the regular trading hours, while BIt has substituted the last five minutes of the
continuous trading. We take these differences into account in the empirical investigation.
Table 2 presents the allocation of the trading volume over the course of the day during the three
sample periods. We distinguish between the Open Auction, the Continuous Phase, and the Closing Auction,
where relevant. We show that initially 2.8% of the daily volume shifts to the CCA in MIB30 stocks and
somewhat more in MIDEX. The CCA in the CAC40 stocks attracts relatively more trading volume than the
stocks in the MIB30 index. A year later both the MIB30 and the MIDEX stocks exhibit a further increase in
the usage of the CCA.
Interestingly, the usage of the Opening Auction initially increases for both the MIB30 and the CAC40
stocks, while it declines for the MIDEX. One year later the trend somewhat reverses.
The behavior of the MIB30 stocks is consistent with the gradual learning hypothesis – when traders
are still novices in using the CCA, they may submit orders that do not execute, with the result that part of the
unexecuted volume spills over to the Open. After getting used to the Closing Auction, they use it more
effectively, thus less volume is left unexecuted. However, we must look much closer to the data to be able to
discuss the process coherently.
[Insert table 2 here]
Since we study three distinct periods, we must control for the period-specific effects on the variables
of interest. We conjecture that the microstructure effects of the CCA introduction are localized around the
close of the market, which suggests that we can normalize all the variables of interest by their comparable
average values between 11:00am and 12:00am during the same period. We compute the average value of the
relevant variables for the stock during the time frame of interest, and then divide it by the same variable
average for that stock calculated over the 11:00-12:00 interval within the same sample period. We then
average across stocks. We use such normalized values throughout the paper, unless stated otherwise.
Using this normalization, we show that the main impact of the CCA introduction is indeed
concentrated very late in the trading session, namely in the last 10 minutes of trading. Table 3 presents the
changes in the normalized values of volume, volatility, trade size, and the bid-ask spread across the sample
periods. These values are calculated over five-minute intervals taken in the morning, early afternoon, half
hour before the close and ten minutes before the close. It is obvious that while there are some differences in
the reported values over time, most of them are not significant, except for the values calculated during the
last ten minutes before the closing. This prompts us to focus the attention on the last ten minutes before the
close of the market for all sample periods.
[Insert Table 3 here]

Page 9 of 41
3. Empirical Hypotheses
A CCA introduces another trading opportunity in a potentially deep market after the close of the
continuous trade. Admati and Pfleiderer (1988) predict that informed and uninformed traders alike prefer to
trade during the most active trading sessions. This yields endogenous spikes in the trading volume during the
day, but the theory does not predict when these spikes should occur. Empirically, such spikes are well
documented at the open and near the close of the continuous trading phase. What would be the prediction of
Admati and Pfleiderer (1988) for the introduction of an additional trading opportunity at the end of the day?
Two scenarios are possible: the first is that the CCA will attract its share of volume as if it were just another
15 minutes trading period during the day (similar to a 15 minute extension in the trading hours). The bulk of
trading will still take place right before the close where everybody will continue to concentrate their trades.
An alternative scenario is that the focal point shifts from right before the close to the CCA, in which case the
bulk of trading will take place at the CCA. We conjecture that the actual outcome is determined by the
behavior of investors that have specific incentives to trade near or at the close.
Mutual funds are an example of such investors; these are large and active traders that are subject to
random inflows and outflows of capital on a daily basis. These flows are to a large extent unexpected and
force the funds to trade for liquidity (i.e. non-informational) reasons. Since the settlement with the
departing/arriving owners is based on the RP, mutual funds prefer to execute most of these non-discretionary
trades at the RP as well, so as not to bear the settlement risk. A similar reasoning may be applied to all of
institutional investors, who settle at the RP. Before the introduction of the CCA this would imply trading in
the later part of the day, which, according to Admati and Pfleiderer (1988), would attract other traders to that
period as well. The introduction of the CCA on BIt did not change the algorithm for the RP calculation, even
though the last 10% of the daily volume now include the closing auction volume too. Institutional investors
now have to estimate how much volume will be traded at the CCA for each stock and allocate their non-
discretionary trades accordingly. The rest of the market will take this into account, which suggests a
multitude of possible trading patterns: we can expect some stocks to exhibit a high proportion of the daily
volume at the CCA stage, while others would exhibit a fairly low proportion of daily volume during the
CCA and a much higher proportion before the close. A stylized model of the institutional investors' non-
discretionary trading is presented in the Appendix 1; its goal is to illustrate the problem faced by institutional
investors, and to assist in forming predictions. The model emphasizes the crucial importance of the investor's
believes about the aggregate use of the CCA by others.
The equilibrium allocation of volume between the end of the continuous trading and the CCA has
direct implications on the liquidity measures of the market. A market with a low proportion of trading at the
CCA would generate patterns not very different from the pre-CCA environment. On the other hand, stocks
with a high CCA volume should experience a significant shift of the informed and uninformed traders from
the end of the day to the CCA. These two scenarios yield quite different predictions regarding the evolution

Page 10 of 41
of the volume, the volatility, the bid-ask spread, and the average trade size prior to the close.
We further rely on existing theoretical work to make predictions regarding the effects on the bid-ask
spread, and volatility. Kaniel and Liu (2002) use a Glosten and Milgrom (1985) type model to show that
informed traders prefer to submit limit orders when their private information is long-lived and they have
ample time to trade on it. The idea is that market orders reveal too much of this information too quickly.
Consequently, the information horizon is negatively correlated with the bid-ask spread. Since CCA
introduction extends the trading horizon, it should encourage the informed traders to submit limit, rather than
market orders at the end of the continuous auction, reducing the bid-ask spread. The more gradual revelation
of information also results in lower volatility before the close.
A liquidity-based model in Foucault, Kadan and Kandel (2005) generates similar predictions, but with
a different interpretation. Their model is based on the existence of patient traders (long-term players, such as
pension funds etc.) who serve as suppliers of liquidity, and the impatient traders (arbitrageurs, day traders,
index funds, some hedge funds) who demand liquidity.6 Following the introduction of the CCA, the liquidity
demanders receive another chance to trade and become less impatient to trade before the close.
Consequently, liquidity suppliers must offer better prices to entice them to trade during the last stages of the
continuous phase. This suggests a decline in the bid-ask spread before the close; the degree of this decline
should be positively correlated with the percentage of volume at the CCA. Furthermore, the same model
predicts a decline in volatility due to a lower bid-ask bounce.
The continuous auction is governed by a discriminatory pricing rule, whereas the closing auction has
a uniform pricing rule.7 It follows that large orders should benefit from the possibility to pay the marginal
prices on the limit order book, whereas retail trades should be submitted to the zero-spread call auction. This,
however, depends on the demand for immediacy and the state of the book. Small traders may choose to pay a
spread, if it is small, rather than face the chance of a price change in the CCA. Similarly, large liquidity
motivated institutional traders, such as mutual funds, may choose to submit their orders at the end of the
continuous auction to benefit from the low cost liquidity available at the top of the book, and then submit
their remaining demands to the CCA.
It follows that narrower spreads and lower volatility, caused by the introduction of the closing auction,
can induce traders to opt to trade at the continuous auction and make the equilibrium characterized by low
volume at the CCA more likely to occur. It also follows that narrow spreads and lower volatility could lead
to low volume at the close.
Based on the above arguments, we postulate the following set of empirical hypotheses and questions:
H1: Following the introduction of the CCA, the quoted bid-ask spread prior to the end of the
continuous stage is likely to decline relative to the pre-CCA period.
6 Keim and Madhavan (1995) show the types of strategies utilized by various trader types. 7 Glosten (1994), Biais Martimort and Rochet (2000), Viswanathan and Wang (2002), and Back and Baruch (2005) compare the relative advantages of these two market types for large and small investors.
Page 11 of 41
H2: Following the introduction of the CCA, the volatility prior to the end of the continuous stage is
likely to decline relative to the pre-CCA period.
H3: The effect of the proportion of the daily volume executed during the CCA on the quoted bid-ask
spread is ambiguous.
H4: The effect of the proportion of the daily volume executed during the CCA on the volatility is
ambiguous as well.
Sometimes market participants may be able to predict the extent of the CCA trading on certain days
for certain stocks. For example, where there is a large absolute price movement before the end of the
continuous phase, the Reference Price becomes much less indicative of the fundamental value of the asset
and thus may prompt more traders to shift their trading volume to the closing auction. The model (see
Appendix 1) suggests that the institutional investors who are interested in buying/selling this stock should
use this information when deciding how much to trade during the day. Admati and Pfleiderer’s argument
suggests that the trading of the mutual funds will be followed by other investors, amplifying the effect. This
suggests another hypothesis:
H5: The proportion of the daily volume transacted during the CCA increases in the absolute value of
the intraday return prior to the close of the market.
We test the above hypotheses below, using the aggregated data. Later in the paper we postulate and
test additional hypotheses based on the order submission data, and on the traders' identities.
4. Results We first present summary statistics to illustrate the effect of the CCA introduction, and then turn to
testing the hypotheses.
4.1 Summary Statistics
Volume
Figure 2 presents the trading volume during the last ten minutes (minute by minute), normalized by
the average trading volume between 11:00am and 12:00am during the relevant period. Table 4 reports more
detailed results for the last minute before the close of the Continuous Phase. First of all, notice that trading
towards the end of the day is very active: one minute at the end of the day exhibits over 5% of the midday
hourly volume for MIB30 and CAC40 stocks and over 10% for the MIDEX stocks. Prior to the CCA
introduction, the volume was relatively constant between 5:20pm and 5:29pm, and during the last minute it
would increase more than three-fold. This was the last chance of trading for that day, so traders seem to
utilize this option very extensively. After the CCA, the normalized volume during the last four minutes
(5:20pm-5:24pm) stays relatively constant and close to previous levels. For MIB30 stocks, the last minute
does not seem to attract higher volume either. This is not surprising, since this is no longer the last
opportunity to trade, as one can always trade at the CCA.

Page 12 of 41
[Insert figure 2 here]
For the MIB30 and the MIDEX stocks, the CCA volume is much higher than during any other minute.
One year later the volume during the CCA rises further, as we have already seen in Table 2.
Panel D of Figure 2 presents similar statistics for the CAC40 stocks on Euronext Paris around the
introduction of the CCA, in 1998. The main difference is again in the last minute of trading (4:59pm-
5:00pm) when the volume drops somewhat following the introduction of the CCA. The magnitude is
consistent with the findings of Hillion and Suominen (2004). For the CAC40 stocks, the CCA more than
replaces the volume in the last minute.
Table 4 presents the comparisons of means across the three periods, confirming the observed patterns.
[Insert table 4 here]
Trade Size
While volume is driven notably by the investment strategy (e.g. how much to rebalance the portfolio
or how much to bet on a stock), the trade size is also a function of the trader's order-submission strategy. If
traders are comfortable submitting large orders, this must indicate, all else equal, that they observe a deep
market with relatively little price impact. On the contrary, a decline in the trade size indicates the
deterioration of the market depth in absolute terms, or indicates a new opportunity to trade in an even deeper
market, i.e. depth deteriorates in relative terms. Possible decline in the average trade size towards the end of
the continuous phase in post-CCA periods may be due to the increased proportion of retail investors, as the
introduction of the CCA causes institutions to reallocate volume from the continuous phase to the CCA.
Figure 3 presents the average trade size in the last ten minutes of trading. Panel A shows that in the
Pre period, the average trade size for MIB30 stocks was about 50% higher than during the midday period,
increasing even further in the last two minutes. This appears to be an indication that institutions that must
trade before the end of the day (e.g. mutual funds), and that can no longer postpone, or break up their trades,
are taking plunges. After the introduction of the CCA the last-minute trade size (continuous trading) declines
significantly, relative to the last minute of trading in the Pre period. This is because there is now another
opportunity to trade, with perhaps higher depth. Indeed, we observe that during the CCA in the Post period,
the average trade size is the same, or exceeds the size during the last minute in the Pre period. One year later
the trade size becomes significantly higher, perhaps indicating an increased confidence in their ability to
execute large trades in the CCA. The same result is obtained for the CAC40 stocks, with the exception of the
last minute in the Pre period, where we observe a reduction in trade size.
[Insert figure 3 here]
The Post-post period shows a decline in the average trade size compared to the other periods. It may
well be that pre-arranged trades in large blocks dominate trading in these stocks during the continuous phase.
Table 4 presents the comparisons of the means across the three periods and shows which results are

Page 13 of 41
statistically significant.
Quoted Bid-Ask Spread
The Bid-Ask Spread may be affected by several market characteristics: information asymmetry,
competition among liquidity providers, and traders' impatience, among others. Figure 4 presents the changes
in the Quoted Bid-Ask Spread8 towards the end of the day, before and after the CCA introduction. For the
MIB30 stocks the spread before the CCA introduction during the last 10 minutes of continuous trading is
only marginally higher than the midday spread; as the end of the day approaches, it starts rising, and in the
last minute it is 60% higher than the midday spread. Recall that trade sizes increase significantly during the
last minutes, which implies a significant increase in the cost of immediacy, as one would predict. Once the
CCA is introduced, the spread in the last four minutes before the end of the Continuous Phase is of the same
magnitude as the midday spread, and the corresponding jump in the last minute is only 15% of the midday
spread, much lower than during the Pre period. Notice also that the average trade size declined as well,
which indicates a very significant reduction in the transaction costs following the CCA introduction. The
effect of the CCA introduction on the bid-ask spread in the CAC40 stocks is of a similar magnitude, with one
exception. In the Post period the spread during the last 10 minutes is below the midday spread. These
findings are consistent with H1 hypothesis, and with the predictions of Foucault et al (2005), and Kaniel and
Liu (2002).
[Insert figure 4 here]
Panel B shows the same pattern in MIDEX, with the exception that all the respective spread levels are
much higher than in MIB30, indicating more information asymmetry and lower liquidity. This is consistent
with the findings of Pagano and Schwartz (2003) for less liquid stocks on the Paris Bourse. Panel D shows
that the CAC40 stocks exhibit a similar pattern: the introduction of the CCA significantly reduces the spread
in the last ten minutes, and most of all in the last minute of trading, to a level equal to the midday spread.
Table 4 shows that in Paris and in the Borsa Italiana’s market segments, the quoted spread during the
last minute after the CCA introduction is significantly (economically and statistically) lower than the spread
in the last minute before the CCA. This is consistent with the H1 hypothesis.
Volatility
We do not expect that the introduction of the CCA changes the fundamental volatility,
stemming from the arrival of news about the firms' prospects. Any period-specific variation in
volatility should be eliminated by our normalization procedure (relative to the 11:00am – 12:00am).
Consequently, the changes in volatility that we study should be due to the microstructure effects e.g.
Bid-Ask Spread. Following Hillion and Souminen (2004), we use the realized variance, proposed
initially by Andersen et al. (2001), as a measure of volatility:
8 The quoted spread is computed relative to the spread midpoint.
TppT
t t
t /ln*1002
1 1∑
= −⎥⎦
⎤⎢⎣
⎡⎟⎟⎠
⎞⎜⎜⎝
⎛
The volatility before the CCA shows a similar pattern to that of the quoted spread. During the 17:20-
17:28 period, the volatility is higher than during the midday period, reaching a staggering level of 1100%
during the last minute of trading for MIB 30 and MIDEX. These estimates are surprisingly consistent across
the two market segments In the periods following the CCA introduction, volatility decreases somewhat, but
the largest impact is on the last minute: relative volatility declines to about 30% of the Pre period level
across both MIB30 and MIDEX segment.
Panel D presents the findings for the CAC40 stocks. The relative levels are much lower both in the Pre
and the Post periods, but the last minute volatility declines by 50%, as in the MIB30 stocks. This suggests
that the reduction in volatility is not due to the Exchange’s specific features, but rather to the CCA
introduction.
Table 4 shows that the volatility declines dramatically in the last minute. This is consistent with the
H2 hypotheses.
In conclusion, we have shown that the introduction of the Call Auction improves market quality
during the last few minutes before the close and it has no discernible effect on the intraday market. The
average volume and average trade size significantly increase at the CCA which attracts institutional traders
submitting larger orders than during the continuous phase. There seems to be an indication that once the RP
equals the closing auction price as in Paris, rather than a weighted average, the institutions move to the CCA
more aggressively, making it an even more liquid market.
4.2 Hypotheses Testing
We calculate the following variables for every stock over the three sample periods: the average Quoted
Bid-Ask Spread over the last minute of continuous trading, denoted by Slast , and the average Quoted Bid-Ask
Spread over the trading hour between 11:00 am and 12:00 am, denoted by S11-12 (both averaged over the entire
period). The ratio of the two, denoted by Srel = Slast / S11-12, is the first explanatory variable. Similarly, we
calculate the normalized volatility, again using the realized variance approach. We denote the resulting
normalized measure by Vltrel. Notice that the normalization removes the need to include stock specific
variables (price, volatility, daily volume) into the regression.
The average volume traded at the CCA normalized by the average volume over the 11.00am-12.00am
interval is denoted by CAVol. The variable DUMp takes the value of 1 in the Post CCA period, while DUMpp
takes the value of 1 in the Post-post period. We run the following cross-sectional regressions separately for
each sub-sample of stocks, but pool the three sample periods:
Srel = a0 + a1 DUMp + a2 DUMpp + b1 DUMp * CAVol + b2 DUMpp * CAVol + e
Vltrel = α0 + α1 DUMp + α2 DUMpp + β1 DUMp * CAVol + β2 DUMpp * CAVol + ε
Page 14 of 41

Page 15 of 41
Hypothesis H1 predicts that a1 and a2 should be negative and, according to H2, α1 and α2 should be
negative too. Furthermore, these regression results may allow us to resolve the ambiguity regarding the b1
and b2 parameters as well as the β1 and β2 parameters. The results are presented in Table 5, Panel A.
Consistent with hypothesis H1 we find that a1 and a2 are negative and significant in all samples of the
BIt as well as in the CAC40 sample. Similarly, hypothesis H2 is also strongly supported by the data: both α1
and α2 are significantly negative for all samples.
The predictions in H3 and H4 seem to pan out as well: there is no clear resolution of the ambiguity.
There is no correlation between the degree of usage of the CCA and the liquidity measures. Neither b1 and
b2, nor β1 and β2 are significant for both MIB30, and MIDEX. They are negative and not significant for the
CAC40 stocks.
As mentioned before, the existing theory (e.g. Foucault (1999) and Foucault et al. (2005)) predicts
that the introduction of the closing auction should be associated with a reduction in the spread and in the
volatility at the end of the continuous phase. Conversely, these models have no unambiguous predictions
regarding the relation between the amount of volume at the closing auction and the spread and volatility
changes. The regression results obtained do not resolve the ambiguity; however, they do not even contradict
the model’s predictions.
[Insert table 5 here]
An alternative specification of the same hypotheses looks at the panel data, rather than averaging over
time for each stock. To reduce day-specific outliers, we still normalize the daily values of a variable by the
average of the 11:00am-12:00am values of the same variable over the entire period. The resulting equations
are:
Srel,t = a0 + a1 DUMp + a2 DUMpp + b1 DUMp * CAVolt + b2 DUMpp * CAVolt + e
Vltrel,t = α0 + α1 DUMp + α2 DUMpp + β1 DUMp * CAVolt + β2 DUMpp * CAVolt + ε
The results are presented in Table 5, Panel B. The coefficients for the period dummies are the same as
in Panel A, providing strong support for the first two hypotheses. The data still shows no significant relation
between the degree of usage of the CCA and the liquidity measures, with an exception of CAC40, where the
higher proportion of trading at the CCA does reduce the bid-ask spread. It is also interesting to point out that
the explanatory power of the above estimation models is low, but is much higher for the large and very liquid
stocks, such as MIB30 and CAC40, than for the less liquid stocks. Probably large institutions prefer to
concentrate in these stocks, since they are much more liquidity oriented.
The next step is to understand the volume allocation decisions between the CCA and the continuous
phase. As mentioned before, when traders are faced with the option of trading either at the end of the
continuous phase or at the CCA, their decision to move or stay depends on the state of the book. If the book
at the end of the continuous phase is deep and the inside spread is tight, they can decide not to move and
Page 16 of 41
trade where they are, even though by moving to the CCA their performance could be evaluated at the closing
auction price. Consequently, if following an improvement in market quality at the end of the continuous
phase, most traders decide not to move to the CCA, we will not find any significant correlation between the
closing auction volumes and the changes in spreads and volatility at the end of the continuous auction
(results for H3 and H4); and this result would hold irrespective of the fact that it was precisely the
introduction of the CCA that induced the change in market quality. Clearly, traders who opt for the
continuous phase can take advantage of the discriminatory pricing rule which allows them to fully exploit the
enhanced state of the book.
A direct consequence of this process is that changes in volatility right at the end of the continuous
phase will affect the traders’ decisions to move to the CCA. More precisely, an increase in volatility during
the last minutes of the continuous trading will worsen the state of the book and thus induce traders to move
to the CCA. Moreover, traders will be induced to trade at the closing auction for another reason: higher
volatility will make the Reference Price noisier and hence less representative of the fundamental value of the
asset. If follows that during those days characterized by higher price volatility, traders will have more
incentive to move to the CCA. This process is summarized by hypothesis H5, which states that a large
absolute price change before the close should induce a greater trading during the CCA.
The following regression captures the variables that may influence market participants when they
make the volume allocation decisions between the continuous stage and the CCA:
Vca,t = a + c Rbca,t+ + d Rbca,t
- + z ZVolumet + e
where Vca,t is the trading volume at the CCA on day t, normalized by the same stock average trading volume
between 11:00am and 12:00am over the relevant period; Rbca,t+ is the return over the period 5.00pm-5:25pm
on the same day, when it is positive, and zero otherwise; Rbca,t- is the absolute value of the return over the
period 5.00pm-5:25pm on the same day when it is negative, and zero otherwise; ZVolumet is the Z score of
the trading volume on the specific day t between the open and 3.00pm (daily volume less the average volume
and divided by the standard deviation over the entire period). This is a control variable.
H5 predicts that c and d should be positive for the BIt market. Table 6 presents the comparison
between the two sets of results. For MIB30 c and d are indeed positive and significant, and for MIDEX they
are positive and significant for the Post-post period.
Observation of the Post-post period reveals results for the MIB30 stocks that are positive and
significant, but of a much smaller magnitude compared to the Post period. MIDEX stocks show no relation
between the previous return and the mid-day proportion of volume for the Post period.
The results for CAC40 are illuminating as well. In the context of the BIt , H5 is driven by the fact that
the Reference Price is determined by the last 10% of volume. In Euronext Paris the Reference Price is equal
to the Closing Auction Price, thus the connection between the price change prior to the close and the volume
at the CCA no longer exists. Table 6 shows that indeed this connection is not found in the data.
Page 17 of 41
Jointly, the evidence above provides support to the claim that the extent of trading during the CCA is
strongly affected by the pre-close price change for MIB30 stocks and the MIDEX stocks during the Post-post
period. This feature, that is found on BIt, but not on Euronext Paris, probably stems from the way the BIt
calculates the Reference Price.
[Insert table 6 here]
The evidence in this section shows that the introduction of the CCA has a profound effect on the very
end of the continuous trading phase. The most striking effects are the reduction in the bid-ask spread and
volatility, which significantly reduce the cost of immediacy. This effect is very localized in time, as there is
practically no effect on the market characteristics fifteen or more minutes prior to the close.9 We also show
that the way the Reference Price is calculated has a real influence on trading decisions: the proportion of
volume during the CCA on the Borsa Italiana is affected by the intraday absolute return, while the two are
unrelated on the Euronext.
The next section investigates the changes in the order aggressiveness as well as changes of order
submission strategies of different investor types stemming from the CCA introduction.
5. Traders' Strategies The order submission data that Borsa Italiana made available allows us to study the effect of the CCA
introduction on the order submission strategies during the last minutes of continuous trading. We also
observe the classification of traders into broad categories10, enabling us to characterize traders’ strategies by
their affiliation.
5.1 Order Aggressiveness – Aggregate Data
We have argued that several theories can explain the observed decline in the bid-ask spread during the
last minutes of trading that followed the introduction of the CCA. Foucault (1999) would attribute this to the
observed decline in volatility, Kaniel and Liu (2004) to the ability of the informed traders to extend the time
they can trade on their superior information, and Foucault, Kadan and Kandel (2005) to the increase in the
liquidity demanders’ patience after another trading opportunity is introduced. The three models offer
predictions regarding the order submission strategies of various traders.
We start by partitioning orders using a classification similar to the one proposed by Biais, Hillion and
Spatt (1995); we then aggregate the different order types into Aggressive, Neutral, and Non-Aggressive.
During the continuous trading phase this classification is based on the location of the order price relative to
the state of the book. During the CCA it is based on the order price relative to prices at the end of the
continuous trading phase. Table 7 presents the classification used.
9 This explains why Pagano and Schwartz (2003) do not find significant microstructure effects during the last 30 minutes of trading on Euronext Paris following the CCA introduction. 10 This dataset is available only after the CCA introduction.

Page 18 of 41
[Insert Table 7 here]
Foucault, Kadan and Kandel’s (2005) model focuses on the liquidity demanders and providers. Before
the CCA introduction, the former had to trade in the last few minutes of the continuous phase, thus their
impatience (cost of waiting) during this time was very high. After the CCA introduction, they were suddenly
presented with the option of trading at the CCA, which clearly reduced their demand for liquidity (reduced
the waiting costs) in the last minutes of the continuous phase. The immediate implication is that the
proportion of Aggressive trades should decline. The response of the liquidity providers to this change has to
be an increase in the aggressiveness of the limit orders, which implies that the proportion of the Non-
Aggressive orders should decline, while the proportion of the Neutral orders should increase. As a
consequence of the reduced bid-ask bounce, the model also predicts a lower volatility.
Foucault (1999) argues that the reduction in volatility makes the limit orders less costly, thus the
liquidity providers' costs decline and they become more willing to offer liquidity. This means that the
proportion of the Non-Aggressive orders should decline further and the proportion of the Neutral orders
should increase. The resulting reduction in the price of liquidity should increase the attractiveness of
submitting market orders for the liquidity demanders, thus increasing the number of these orders. This means
that the proportion of Aggressive orders should increase as well.
The predictions of Kaniel and Liu (2004) are similar to those of Foucault, Kadan and Kandel (2005).
The primary effect is on the impatient informed trader, who must submit market orders to benefit from his
short-lived information advantage. Once another option to trade becomes open to him, he starts submitting
limit orders (either Non-Aggressive or Neutral) to reduce the speed of information revelation. If the
proportion of informed traders is not trivial, then the proportion of the Aggressive orders should decline, and
the proportion of Neutral orders should increase. The liquidity providers should reduce the proportion of
Non-Aggressive orders and increase the proportion of the Neutral orders.
The overall predictions of these models are: during the last minutes of the continuous trading the
proportion of the Non-Aggressive orders should decline and the proportion of the Neutral orders should
increase. The prediction about the proportion of the Aggressive orders is ambiguous, since we don't know a
priori which effect dominates.
Table 8 presents the results on the order aggressiveness during the last five minutes of the continuous
trading phase. We partition the orders into Large, Medium and Small, since the order-submission strategy
may be quite different for orders of varying sizes. These partitions are stock-specific: the largest 25% of
orders, for each stock, are considered Large, the bottom 25% are considered Small, while the rest are
Medium. Of course, we cannot control for order splitting, so we take the distribution of orders as exogenous.
Table 8 Panel A reports the results for the MIB30 stocks. Following the introduction of the CCA,
Non-Aggressive orders (NAO) decrease from 49% in the Pre period, to 34% in the Post and to 37% in the
Post-post period. Neutral orders (NO) increase from 19% in the Pre period, to 30% and 28% in the Post and
Post-post periods, respectively. This result is consistent with both Foucault (1999), FKK’s (2003) and Kaniel

Page 19 of 41
and Liu (2004) theoretical predictions. The proportion of Aggressive Orders increases somewhat, suggesting
that the state of the book is the stronger factor affecting agents’ order-submission strategies. The
introduction of the CCA reduces the volatility, thus reducing the costs of submitting limit orders and
inducing liquidity providers to offer liquidity more aggressively. It follows that NAO become more
aggressive and eventually turn into NO. This improves the quality of the book and induces submission of
AO. Aggressive orders in fact increase over the three periods.
The reported results indicate the net effect of the CCA introduction on the Aggressive Orders. The
reduction of the AO initially induced by the introduction of the CCA fosters a more vigorous competition
among the liquidity suppliers and results in a smaller Bid-Ask spread. Lower cost of liquidity will make the
submission of the AO more attractive, and result in their increase, which will offset the initial effect to some
extent. Panel A shows that the reduction in the NAO and the increase in the NO are stronger for largest
orders.
Notice that the size of the largest Non-Aggressive orders declines dramatically. This suggests that
submitting these orders before the close of the continuous stage is no longer profitable. The results obtained
for the MIB30 stocks are substantially confirmed by the MIDEX stocks. Panel B shows that Non-Aggressive
orders decrease and Neutral orders increase over the sample periods; the pattern of Aggressive orders is
ultimately decreasing for the MIDEX stocks. Larger orders again show the largest change.
[Insert Table 8 here]
The analysis of order-submission strategies during the CCA is presented in Table 9. Results are not
directly comparable to those of Table 8, because the data for the Pre period is not available, and the
definitions of order aggressiveness are different. However, we can compare the order size, as well as the
evolution over time. Overall, the results from Table 9 show that traders’ confidence in the closing auction
increased and that traders became more aggressive over time. This result, which holds for both stock samples
(we do not have the order data from the CAC40), is especially evident in the most liquid MIB30 stocks.
Furthermore, Table 9 shows that orders’ aggressiveness increased principally for large orders: during the
Post period large aggressive orders made up 16% of the total large orders submitted at the closing, while
during the Post-post period this percentage increased to 43%. The average size of the MIB30 Non-
Aggressive and Aggressive Orders during the CCA is larger than the size of similar orders at the end of the
continuous phase. The difference increases dramatically in the Post-post period, indicating that traders feel
confident about the depth of the CCA to submit large aggressive orders. The MIDEX results are only slightly
different. While in the Post period the aggressive order size is also larger at the CCA than before it, the size
of orders actually declines in the Post-post period and the difference shrinks. The size of aggressive orders
remains larger at the CCA. Overall Tables 8 and 9 suggest that the aggregate results presented earlier in the
paper capture only part of a very significant impact of the CCA introduction on order submission strategies.
[Insert Table 9 here]

Page 20 of 41
To summarize, the results obtained for the two samples of stocks confirm the empirical implications of
the theoretical models. The agents’ longer trading horizon and the resulting reduction in volatility induced
liquidity suppliers to offer liquidity at better prices and resulted in lower bid-ask spreads. Hence, the overall
effect of the introduction of the CCA on the agents’ order submission strategies is an increase in their
aggressiveness both before the end of the continuous trading session and at the CCA.
5.2 Trader Identification
BIt data allows us to partition orders by the source of their arrival to the exchange. From this
classification we can deduce the probable type of traders that will submit them. Unfortunately, this data is
available only starting from the Post period, which is when the reporting began. This will only allow us to
make comparisons between the last two periods. BIt identifies orders as follows:
X1 are the orders submitted by a financial intermediary trading on his own account,
X2 are the orders submitted by a financial intermediary's customer account,
X3 are the orders submitted directly by an institutional or a professional retail investor,
X4 are the orders submitted directly by a retail investor.
Table 10 shows that during the continuous trading phase of both the Post and the Post-post periods
X3's average trade size is comparable to that of the retail investors (X4) and is well below that of the other
two types. During the CCA X3's trade size rises tenfold and becomes the largest of the four. Other
institutions also increase their trade sizes at the close, but not the retail investors. This could indicate the fact
that these institutions are very impatient to trade at the close. Mutual funds that adjust for their net flows of
capital could be an example.
[Insert table 10 here]
Table 10 indicates the proportion of orders submitted to the order book by various trader types. Notice
that the relative presence of retail investors on the market increases somewhat during the last 5 minutes of
trading and decreases once the closing auction is introduced. This result, which is even stronger in the Post-
post period, suggests that retail traders are probably more attracted by the liquidity offered by the continuous
auction than by the uniform pricing rule of the CCA. In the Post period, the intermediaries trading on their
own account increase their trading in the last 5 minutes, but this effect disappears a year later.
The next step is to show the relative aggressiveness of each trader’s type both at the end of the
continuous auction and at the closing call. We repeat the analysis presented in Table 8 by using traders’

Page 21 of 41
identification codes.
This final analysis is in progress.
6. Price Discovery
Pagano and Schwartz (2003) argue convincingly that price discovery for the less liquid stocks on the
Paris Bourse improved significantly following the introduction of the CCA. Replicating their extensive study
is not necessary and is outside the scope of this work. Nevertheless, we would like to establish the effect of
the CCA introduction on price discovery in various market segments and under a somewhat different price
determination rules using basic statistics. In particular, we are interested in the comparison between the
Reference Price (RP) and the Closing Auction Price (CAP). One should remember that these two prices are
the same at the Euronext, while at the BIt they are not, since the RP is the weighted average price over the
last 10% of the daily volume. A sharp change in the stock price over the later part of the day immediately
translates into a bias in the RP relative to the price based on “fundamentals”. The Closing Auction introduces
another opportunity to trade at the price close to fundamentals, which should be utilized more heavily during
the days of drastic price changes. Consequently, the RP should contain less noise after the introduction of the
CCA.
We proxy the noise in the close price by the Close-Open return, which we calculate in two ways. The
first proxy is based on the average absolute value of price changes, while the second is based on the variance
of these changes. Let us denote the first proxy by H(RP) and the second by V(RP). For all the sample periods
we calculate:
H(RP) = Average | ln(OPt+1/RPt) | / Average | ln (MPt+1/ MPt) | ;
V(RP) = Variance(ln(OPt+1/RPt)) / Variance( ln (MPt+1/ MPt)) ;
where OP is the opening price, and MP is the average price between 11 and noon. These are calculated for
each stock and then averaged across stocks within a segment. This proxy takes the average of the absolute
value of the Close to Open return and normalizes it by a similar measure calculated using the midday to
midday return. Based on the evidence presented earlier, we maintain that the latter are practically unaffected
by the CCA. H() is a modified version of the price discovery measure used in Barclay and Hendershott
(2003); while V() is a modified variance ratio. For the Post and Post-post periods we also calculate similar
measures for the Closing Auction Price:
H(CAP) = Average | ln(OPt+1/CAPt) | / Average | ln (MPt+1/ MPt) |
V(CAP) = Variance(ln(OPt+1/CAPt)) / Variance( ln (MPt+1/ MPt))
Table 11 presents the comparisons of these proxies across the sample periods for the two market
segments and CAC40. The horizontal comparison is across the time periods, whereas the vertical

Page 22 of 41
comparison is between the prices.
[Insert table 11 here]
The MIB30 stocks experience a significant improvement in both proxies of price discovery, which is
consistent with the findings of Pagano and Schwartz (2003). The change takes place immediately following
the CCA introduction, and the effect stays one year later. The MIDEX stocks instead do not seem to show
such an improvement; in fact one of the proxies shows a non-significant decline in price discovery. The
CA40 stocks show a significant improvement for only one measure.
The comparison between the RP and the CAP is interesting: while both the CAP and the RP prices
show an improvement as closing prices with respect to the Pre-auction period, in all cases the CAP price is a
worse predictor of the next day open, compared to the RP. For the MIB30 and the MIDEX stocks the
difference is statistically significant. The finding is surprising, and may be interpreted as an indication that
the RP should not be equalized with the CAP. However, it should be noted that the RP includes trades
executed in the CCA, and it became more precise following the CCA; therefore, equalizing the RP to the
CAP should make the CAP more efficient. The evidence from the CAC40 stocks indicates that the last price
of the day also became more informative (even though not statistically significantly) than the CAP following
the introduction of the CCA In the French market the RP and the CAP are the same. It may well be that the
price discovery is improved following the CCA introduction, but during the CCA, random liquidity demands
of institutions that submit large orders to get liquidity may actually introduce an additional noise into price.
Perhaps this is yet another example of how liquidity provision may clash with price discovery.
7. Conclusions In December 2001 Borsa Italiana, which operates as an order-driven market, introduced a closing call
auction at the end of the continuous auction market. The objective of this innovation in market design was to
increase the quality of the market at the end of the trading day. The Italian experiment was not isolated.
Practically all the main European exchanges introduced a closing call auction (e.g. Deutsche Börse,
Euronext, London Stock Exchange) and, more recently, the NASDAQ market have introduced a sort of
closing-batch auction at the end of the trading day.
In the call auction, consolidation of order flows may potentially reduce the price impact of a trade.
Furthermore, the enhancement of information revelation could improve the price discovery process and, by
reducing intraday volatility, result in increased price stability. Finally, comparing the two systems, one
should consider the relative benefits some traders could obtain by moving from the discriminatory pricing
rule of the continuous auction, to the uniform pricing rule, which governs the batch system.
The success of this change in market architecture depends on how effectively traders develop new
strategies to deal with this new trading opportunity.
Using data from both the Italian and the French stock markets, we show that the effects of the

Page 23 of 41
introduction of the call auction are concentrated in the very last minutes of the continuous phase. We observe
a significant reduction in the quoted spread, volatility, trading volume and average trade size.
We also find strong support for the empirical implications of the existing theoretical models (Kaniel
and Liu (2004), Foucault (1999) and Foucault, Kadan and Kandel (2005)). The introduction of the closing
auction makes liquidity demanders less impatient and induces liquidity suppliers to offer liquidity at
narrower bid-ask prices. The reduction in market orders and hence in the bid ask bounce reduces volatility;
this makes limit order submitters even more willing to supply liquidity. It follows that in terms of the
agents’ order submission strategies, Non-Aggressive orders decrease and orders submitted at or inside the
BBO increase.
Using a data set on the agents’ order submissions which allowed us to build the limit order book, we
tested these empirical implications. The results obtained for the different segments of the Borsa Italiana
strongly confirm these predictions.
Finally, we detect a strong increase in the average trade size at the CCA, compared to the end of the
continuous phase. We also find evidence of an improvement in the price discovery at the closing of the
market which is consistent with the findings of Pagano and Schwartz (2003) for Euronext. We believe that
this improvement can be further strengthened by equating the Reference Price with the CAP, as is done on
Euronext. This change would further increase the volume of trading at the CCA, and make the closing price
more efficient.

Page 24 of 41
BIBLIOGRAPHY Admati. A.. and P. Pfleiderer. (1988) “A Theory of Intraday Trading Patterns: Volume and Price
Variability” The Review of Financial Studies 1. Aitken. M., C. Comerton-Forde. and A. Frino. (2002). “Closing Call Auctions and Market Liquidity.”
working paper. University of New South Wales. Back K. and Baruch S. (2005) “Working Orders in Limit Order Markets and Floor Exchanges”mimeo,
Princeton University. Barclay M. and T. Hendershott (2003) “Price discovery and trading costs after hours” The Review of
Financial Studies. Biais B., Glosten L. and Spatt C. (2005) "Market microstructure: a survey of microfundations, empirical
results, and policy implications" Journal of Financial Markets, 8, 217-264 Biais B., Martimort D. and JC. Rochet (2000) "Competing mechanisms in a common value environment",
Econometrica, 78, 799-837. Brock. W. and Kleidon. A. (1992). “Periodic market closure and trading volume”. Journal of Economic
Dynamics and Control. Vol. 16 pp. 451-489 Cushing. D. and Madhavan. A. (2000). “Stock returns and trading at the close”. Journal of Financial
Markets. Vol. 3 pp. 45-67 Ellul. H. Shin and I. Tonks (2002). "Toward Deep and Liquid Markets: Lessons from the Open and the
Close at the London Stock Exchange", working paper, LSE. Foucault. T., (1999), “Order flow composition and trading costs in a dynamic limit order book”, Journal
of Financial Markets 2, 99-134. Foucault. T., O. Kadan. and E. Kandel. (2005). Limit Order Book as a Market for Liquidity, Review of
Financial Studies, November . Glosten L. (1994) “Is the Electronic Open Limit Order Book Inevitable?” Journal of Finance 49, 1127-
1161. Glosten L. and Milgrom P. 1985, “Bid, ask, and transaction prices in a specialist market with
heterogeneously informed traders”, Journal of Financial Economics, 13, 71-100 Hillion. P., and M. Souminen (2004). “The manipulation of closing prices”. Journal of Financial Markets.
Vol. 7 pp. 351-375. Hong. H. and Huang. J. (2000). “Trading and returns under periodic market closures”. Journal of Finance.
Vol. 55 pp. 297-354 Kaniel, R. and H. Liu, (2004) “So what orders do informed traders use?” Journal of Business Keim, D. and A. Madhavan, (1995), Anatomy of the Trading Process: Empirical Evidence on the
Behavior of Institutional Traders, Journal of Financial Economics, 37, 371-398. Madhavan. A.. and V. Panchapagesan. "Price discovery in auction markets: a look inside the black box".
(2001) The Review of Financial Studies. 13-3 pp.627-658. Pagano. M., and B. Schwartz (2003). "On the introduction of the closing auction at the Paris Bourse".
Journal of Financial Economics. Viswanathan S. and J. Wang (2002). “Market Architecture: limit-order books versus dealership markets”,
Journal of Financial Markets 5, 127-167.

Page 25 of 41
Table 1– Market closing methodologies and Reference Price determination in equity markets around the world in 2006
Exchange Closing Call
Auction Reference Price Determination
Comments
US and North America NYSE Partly* Market on Close NASDAQ Yes+ Closing auction price Auction introduced in April 2004 Toronto No Market on Close Europe Bolsa in Madrid Yes Closing auction price Borsa Italiana Yes Weighted Average VWAP of the last 10% of the daily
volume including the CA Euronext (Amsterdam, Brussels, Lison, Paris)
Yes Closing auction price
London Stock Exchange (SETS)
Yes Closing auction price
Deutsche Boerse (Xetra)
Yes Closing auction price
OMX – Stockholm Yes Closing auction price OMX – Copenhagen No Last Trade OMX – Helsinki No Last Trade Oslo Yes Closing auction price Wien Börse Yes Closing auction price Zurich Yes Closing auction price Other Countries Tokyo Yes “Itayose” method Orders can be submitted from 12:05
to 14:59:59 and have no time priority. Hong Kong No Median The system takes 5 equally spaced
snapshots between 15:59:00 and 16:00:00, and computes the median.
Tel Aviv Stock Exchange
No Weighted Average A procedure specifies the time frame (last 30 minutes) and the minimal amount over which the price is calculated.
* At the NYSE the closing price is set by the specialist who collects market-on-close orders sent him in advance both by the Opening Automatic Report System (OARS), and by floor brokers. The OARS calculates trading volume and imbalances at each available price and the specialist chooses the clearing price that minimizes the market imbalance. The specialists can also post proprietary orders, or in case of price changes which look anomalous with respect to the last closing price, he can halt trading and publicize information on the imbalance to attract new order flow. Notice that following the merger with Arcipelago, NYSE stocks closing prices are also set at the NYSE Arca Closing Auction. The design of the Arca Closing Auction differs slightly from the European one as the closing price is set to maximize executable volume and if more than one price achieves this goal, than the system chooses the price that is closest to the last closing price (http://www.archipelago.com/traders/auction.asp). +Two are the main differences between the design of the NASDAQ closing cross and the European closing auction: firstly, on the NASDAQ the pre-closing phase overlaps with the continuous auctions, whereas in Europe the pre-auction phase starts when the continuous section finishes; secondly, while the first two principles governing the price formation algorithm are the same as the European ones, the third and last one aims to minimize the distance of the equilibrium closing price with the prevailing best bid-ask midpoint.

Page 26 of 41
Table 2 - Allocation of Volume over the Trading day. Computations reported in this Table are performed as follows: firstly, for each stock , for each trading phase (opening, closing and continuous), and for each sample periods (Pre, Post and Post-post for both the MIB30 and MIDEX stocks, and Pre and Post for the CAC40 stocks) average trading volume is computed; secondly, the ratio between the average volume for each phase and trading period to the average volume for the whole trading day for the same trading period is computed; finally, the statistic obtained for each stock is averaged across the MIB30, MIDEX and CAC40 stocks. ** 1% significance; * 5% significance. Significance is relative to the Pre period, except for the % volume at the close.
% Volume at the Open % Volume during the Day % Volume at the Close
Segment Pre Post Post-
post
Pre Post Post-post Pre Post Post-
post
MIB30 1.07 1.52 1.28 98.9 95.7** 94.8** - 2.80 3.96**
MIDEX 1.58 1.38 1.45 98.4 95.6** 94.2** - 3.03 4.35*
CAC 40 3.43 3.90 96.57 92.4** 3.72

Table 3 - Comparisons of normalized values at various times across the three sample periods. Computations are for differences in normalized values of Volume, Volatility, Bid-Ask spread and Average Trade Size. Results (e.g. Volume) are obtained as follows: firstly, for each stock average volume is computed for every time interval reported below; secondly, daily values are averaged over each of the three sample periods (two for the CAC40 stocks) and this statistic is normalized to the average volume computed for the interval 11am-12am of the same sample period; finally, differences between the Pre and both the Post and the Post-post period (PP) are computed. Average Trade Size is the ratio between volume and the number of observations;
Quoted Bid-Ask spread (BA) is computed as:2/)( BidAsk
BidAsk+
−; Volatility is computed as 2
1
)log(100−
∗t
t
pp
, where is the spread midpoint. tp** 1% significance; * 5% significance.
Segment
Pre period Post and Post-post (CAC40)
10:00 10:05 10:00 10:05 am
10:20 -10:25 10:20 -10:25 am
2:00-2:05 2:00-2:05 pm
2:20 2:25 2:20 2:25 pm
5:05-5:10 5.00-5:05 pm 4:35-4:40 pm
5:20 -5.25 5.15-5.20 pm 4:50-4:55 pm
5:25 –5.30 5.20-5.25 pm 4:55-5:00 pm
Volume Post-Pre PP-Pre
0.010 0.013
0.016*
0.021 -0.002 0.002
-0.007 -0.000
-0.014 -0.015*
-0.051* -0.068**
-0.180** -0.158*
Volatility Post-Pre PP-Pre
0.090 -0.116
0.078 0.020
-0.113* -0.048
-0.128* -0.139*
-0.293*
-0.347** -0.542** -0.668**
-2.340** -2.820**
BA Spread Post-Pre PP-Pre
-0.016 -0.038
-0.011 -0.007
-0.008 -0.020
0.013 0.004
-0.020 -0.046
-0.050**
-0.052**
-0.136** -0.132**
MIB 30
Trade Size Post-Pre PP-Pre
-0.021 0.028
0.031 0.114
-0.085 -0.113
-0.085 -0.166**
-0.200** -0.260**
-0.242** -0.317**
-0.236** -0.232*
Volume Post-Pre PP-Pre
-0.014 0.005
-0.004 0.016
-0.025 0.020
-0.026**
0.005 0.084 -0.048
0.016 -0.025
-0.297**
-0.282**
Volatility Post-Pre PP-Pre
-0.194 -0.636**
-0.426 -0.691
-0.144 -0.040
-0.177* -0.118
-0.193 0.202
-0.322* -0.390*
-2.819** -3.423**
BA Spread Post-Pre PP-Pre
-0.063 -0.487
-0.086* -0.335
0.062* 0.002
0.018 0.016
0.040 -0.023
-0.027 -0.064
-0.213** -0.238**
MIDEX
Trade Size Post-Pre PP-Pre
-0.045 -0.067
0.044 0.016
-0.036 -0.066
-0.110 0.087
-0.992 -1.035
0.091 -0.097
-0.008 0.088
Volume Post-Pre
-0.067
0.007
-0.002
0.003
-0.002
-0.002
-0.242
Volatility Post-Pre
0.010
-0.527**
0.036
-0.002
-0.220*
-0.498**
-0.531
BA Spread Post-Pre
-0.081
-0.155**
-0.005
-0.015
-0.066*
-0.157**
-0.304**
CAC40
Trade Size Post-Pre
-1.248*
0.042
0.035
-0.091
0.073
-0.515**
-1.515
Page 27 of 41

Table 4 – Quoted Bid-Ask spread, Volume, Average Trade Size and Volatility during the last minute before the close of the Continuous Phase, normalized by the average spread during the interval 11:00am– 12:00am. Normalized values (e.g. Volume) are obtained as follows: firstly, for each stock average volume is computed for the last minute of the continuous trading phase; secondly, daily values are averaged over each of the three sample periods (two for the CAC40 stocks) and this statistic is normalized to the average volume computed for the interval 11am-12am of the same sample period. Average Trade Size is the ratio between volume and
the number of observations; Quoted Bid-Ask spread is computed as:2/)( BidAsk
BidAsk+
−; Volatility is computed
as ∑= −
∗T
t t
t Tpp
1
2
1
/)(log100 , where is the spread midpoint. P-values are reported. tp
MIB30 MIDEX CAC40 Variable
Period Value p-value Value p-value Value p-value
Pre 1.589 - 1.728 - 1.471 -
Post 1.177 0.000 1.497 0.031 0.996 0.000
Bid-Ask
Spread Post-post 1.138 0.000 1.448 0.003 - -
Pre 0.190 0.406 0.174
Post 0.071 0.000 0.123 0.000 0.067 0.000
Volume
Post-post 0.060 0.000 0.179 0.003
Pre 1.807 1.526 1.413
Post 1.522 0.002 1.525 0.993 1.655 0.245
Average
Trade
Size Post-post 1.408 0.000 1.372 0.126
Pre 11.854 11.934 4.057
Post 2.968 0.004 3.044 0.000 1.963 0.028
Volatility
Post-post 1.946 0.001 1.722 0.000
Page 28 of 41

Table 5: Tests of Hypotheses 3 and 4.
Panel A reports results for the following cross-sectional regressions for each sub-sample of stock over the three sample periods (pooled):
Srel = a0 + a1 DUMp + a2 DUMpp + b1 DUMp * CAVol + b2 DUMpp * CAVol + e
Vltrel = α0 + α1 DUMp + α2 DUMpp + β1 DUMp * CAVol + β2 DUMpp * CAVol + ε
Where Srel is the ratio Slast / S11-12 and Slast is the average Bid-Ask spread over the last minute of the continuous trading normalized to the average Bid-Ask
spread over the interval 11:00 am- 12:00 am denoted by S11-12 (both averaged over the entire period). Similarly, Vltrel is the ratio Vltlast / Vlt11-12 , with Vltlast equal to
the average Volatility over the last minute of the continuous trading normalized to the average Volatility over the interval 11:00 am- 12:00 am denoted by Vlt11-12
(both averaged over the entire period). CAVol is the average percentage (of the 11am-12am interval) of the daily volume traded at the CCA and DUMp is a dummy
variable that takes value 1 in the Post period and 0 otherwise, whereas DUMpp takes value 1 in the Post-post period and 0 otherwise.
Table 5 Panel A
Market Segment
a0
(STERR)
a1
(STERR)
a2
(STERR)
b1
(STERR)
b2
(STERR)
Adj R2
α0
(STERR)
α1
(STERR)
α2
(STERR)
β1
(STERR)
β2
(STERR)
Adj R2
1.589 -0.473 -0.510 0.255 0.165 0.535 7.4645 -4.656 -5.576 0.658 0.160 0.566 MIB30
0.034 0.113 0.105 0.422 0.262 0.393 1.219 1.139 4.543 2.821
1.728 -0.271 -0.428 0.161 0.341 0.098 11.934 -9.087 -10.260 0.782 0.109 0.324MIDEX
0.068 0.190 0.142 0.653 0.223 1.257 3.510 2.617 12.048 4.117
1.471 -0.469 -0.021 - 0.421 4.057 -4.541 -8.275 - 0.058CAC40
0.043 0.132 0.394 0.657 2.007 -6.015 -
Page 29 of 41

Panel B reports results for the following regressions for each sub-sample of stock using the panel data:
Srel,t = a0 + a1 DUMp + a2 DUMpp + b1 DUMp * CAVolt + b2 DUMpp * CAVolt + e
Vltrel,t = α0 + α1 DUMp + α2 DUMpp + β1 DUMp * CAVolt + β2 DUMpp * CAVolt + ε
Where Srel,t is the ratio Slast,t / S11-12 and Slast,t is the average daily Bid-Ask spread over the last minute of the continuous trading normalized to
the average Bid-Ask spread over the interval 11:00 am- 12:00 am, denoted by S11-12; the latter being averaged over the sample period. Similarly,
Vltrel,t is the ratio Vltlast,t / Vlt11-12 , with Vltlast equal to the average daily Volatility over the last minute of the continuous trading normalized to the
average Volatility over the interval 11:00 am- 12:00 am, denoted by Vlt11-12. CAVolt is the average daily volume (% of the 11am-12am interval)
traded at the CCA and DUMp is a dummy variable that takes value 1 in the Post period and 0 otherwise, whereas DUMpp takes value 1 in the Post-
post period and 0 otherwise.
Table 5 Panel B
Market Segment
a0
(STERR)
a1
(STERR)
a2
(STERR)
b1
(STERR)
b2
(STERR)
Adj R2
α0
(STERR)
α1
(STERR)
α2
(STERR)
β1
(STERR)
β2
(STERR)
Adj R2
1.584 -0.397 -0.432 -0.033 -0.048 0.051 11.812 -9.026 -9.879 0.767 0.122 0.002 MIB30
0.021 0.041 0.039 0.098 0.054 1.872 3.681 3.498 8.731 4.789
1.727 -0.189 -0.310 -0.099 0.002 0.012 12.412 -9.581 -10.878 0.000 0.000 0.008MIDEX
0.030 0.060 0.066 0.113 0.087 1.345 2.622 2.878 0.000 0.000
1.478 -0.412 -0.223 - 0.061 3.400 -1.637 -0.750 - 0.022 CAC40
0.030 0.059 0.114 - 0.201 0.397 0.765 -
Page 30 of 41

Table 6: Tests of Hypothesis 5. This table reports results for the following cross-sectional regression for each sub-sample of stock:
Vca,t = a + c Rbca,t
+ + d Rbca,t- + z ZVolumet + e
where Vca,t is the trading volume at the closing auction on day t, normalized by the same stock average trading volume between 11:00 am-12:00 am over the
relevant period; Rbca,t+(-) is the return over the interval 5.20 pm and 5:25 pm on the same day, when it is positive (negative), and zero otherwise; ZVolumet is the
standardized daily trading volume on the specific day t between the open and 15:00 (daily volume less the average volume and divided by the standard deviation
over the entire period).
Post period Post-Post period
Market Segment
a (STERR)
c (STERR)
d (STERR)
z (STERR)
Adj R2
a (STERR)
c (STERR)
d (STERR)
z
(STERR)
Adj R2
0.219 8.379 10.130 0.056 0.283 4.155 5.101 0.096 0.034 MIB30 0.007 2.475 3.280 0.006
0.077
0.013 1.844 2.062 0.015
0.267 -0.324 -1.486 0.092 0.338 5.044 2.239 0.116 0.059 MIDEX 0.015 0.771 0.953 0.013
0.055
0.026 1.124 0.962 0.023
0.287 -0.350 0.412 0.047 CAC40 0.016 0.350 0.534 0.008
0.051
Page 31 of 41

Table 7 This table Presents a classification of orders by their degree of aggressiveness during the continuous phase and during the call auction. The
continuous phase order classification is consistent with Bias, Hillion, and Spatt (1995). Note that these are orders submitted over the last 5 of the continuous trading. *On the Italian platform MO cannot walk up the order book unless specified by a special code (ECO); therefore MO submitted without such code are satisfied up to the amount of shares available at the best price on the opposite side of the book; the residual quantity being converted into limit orders (at the same best price) on their own side of the book. While aggressive MO (ECO) always increase the spread, MO may also reduce the spread.
Classification During the Continuous Phase During the Call Auction
Aggressive Orders
(AO)
Market Orders and Marketable limit orders (i.e. Limit Orders that are submitted at prices equal or higher than the best price on the opposite side of the order book.). The MO orders* increase the spread; the LO may increase or may reduce it.
Market buy (sell) Orders, or Marketable buy (sell) Limit Orders submitted at prices that are higher (lower) than the average ask (bid) prices computed over the last 5 minutes of the continuous trading.
Neutral Orders
(NO)
Limit Orders that are submitted at prices at or within the prevailing bid ask spread at the time of the order submission. These orders may reduce the spread.
Limit Orders that are submitted at prices between the average ask and bid prices computed over the last 5 minutes of the continuous trading.
Non-Aggressive Orders
(NAO)
Limit Orders that are submitted at prices below the current best price on the same side. These orders do not affect the spread.
Limit Buy (Sell) Orders that are submitted at prices that are higher (lower) than the average ask (bid) prices computed over the last 5 minutes of the continuous trading.
Page 32 of 41
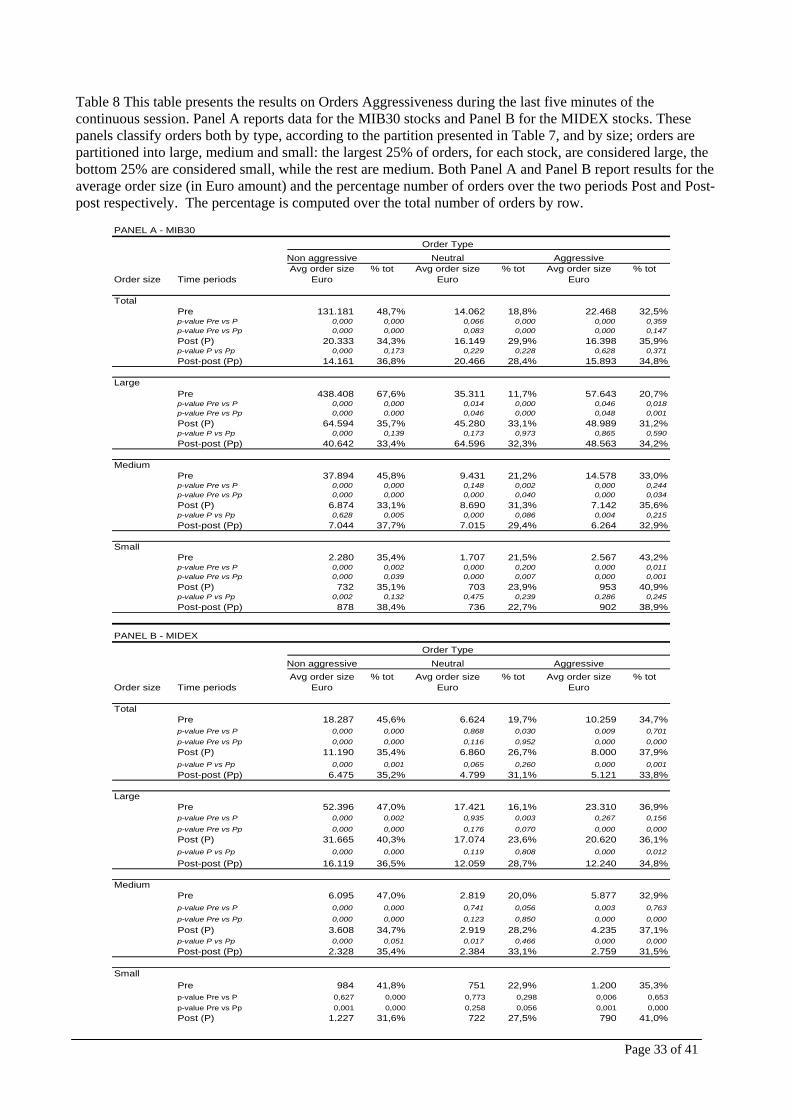
Table 8 This table presents the results on Orders Aggressiveness during the last five minutes of the continuous session. Panel A reports data for the MIB30 stocks and Panel B for the MIDEX stocks. These panels classify orders both by type, according to the partition presented in Table 7, and by size; orders are partitioned into large, medium and small: the largest 25% of orders, for each stock, are considered large, the bottom 25% are considered small, while the rest are medium. Both Panel A and Panel B report results for the average order size (in Euro amount) and the percentage number of orders over the two periods Post and Post-post respectively. The percentage is computed over the total number of orders by row.
PANEL A - MIB30Order Type
Non aggressive Neutral AggressiveAvg order size % tot Avg order size % tot Avg order size % tot
Order size Time periods Euro Euro Euro
TotalPre 131.181 48,7% 14.062 18,8% 22.468 32,5%p-value Pre vs P 0,000 0,000 0,066 0,000 0,000 0,359p-value Pre vs Pp 0,000 0,000 0,083 0,000 0,000 0,147Post (P) 20.333 34,3% 16.149 29,9% 16.398 35,9%p-value P vs Pp 0,000 0,173 0,229 0,228 0,628 0,371Post-post (Pp) 14.161 36,8% 20.466 28,4% 15.893 34,8%
LargePre 438.408 67,6% 35.311 11,7% 57.643 20,7%p-value Pre vs P 0,000 0,000 0,014 0,000 0,046 0,018p-value Pre vs Pp 0,000 0,000 0,046 0,000 0,048 0,001Post (P) 64.594 35,7% 45.280 33,1% 48.989 31,2%p-value P vs Pp 0,000 0,139 0,173 0,973 0,865 0,590Post-post (Pp) 40.642 33,4% 64.596 32,3% 48.563 34,2%
MediumPre 37.894 45,8% 9.431 21,2% 14.578 33,0%p-value Pre vs P 0,000 0,000 0,148 0,002 0,000 0,244p-value Pre vs Pp 0,000 0,000 0,000 0,040 0,000 0,034Post (P) 6.874 33,1% 8.690 31,3% 7.142 35,6%p-value P vs Pp 0,628 0,005 0,000 0,086 0,004 0,215Post-post (Pp) 7.044 37,7% 7.015 29,4% 6.264 32,9%
SmallPre 2.280 35,4% 1.707 21,5% 2.567 43,2%p-value Pre vs P 0,000 0,002 0,000 0,200 0,000 0,011p-value Pre vs Pp 0,000 0,039 0,000 0,007 0,000 0,001Post (P) 732 35,1% 703 23,9% 953 40,9%p-value P vs Pp 0,002 0,132 0,475 0,239 0,286 0,245Post-post (Pp) 878 38,4% 736 22,7% 902 38,9%
PANEL B - MIDEXOrder Type
Non aggressive Neutral AggressiveAvg order size % tot Avg order size % tot Avg order size % tot
Order size Time periods Euro Euro Euro
TotalPre 18.287 45,6% 6.624 19,7% 10.259 34,7%p-value Pre vs P 0,000 0,000 0,868 0,030 0,009 0,701p-value Pre vs Pp 0,000 0,000 0,116 0,952 0,000 0,000Post (P) 11.190 35,4% 6.860 26,7% 8.000 37,9%p-value P vs Pp 0,000 0,001 0,065 0,260 0,000 0,001Post-post (Pp) 6.475 35,2% 4.799 31,1% 5.121 33,8%
LargePre 52.396 47,0% 17.421 16,1% 23.310 36,9%p-value Pre vs P 0,000 0,002 0,935 0,003 0,267 0,156p-value Pre vs Pp 0,000 0,000 0,176 0,070 0,000 0,000Post (P) 31.665 40,3% 17.074 23,6% 20.620 36,1%p-value P vs Pp 0,000 0,000 0,119 0,808 0,000 0,012
Post-post (Pp) 16.119 36,5% 12.059 28,7% 12.240 34,8%
MediumPre 6.095 47,0% 2.819 20,0% 5.877 32,9%p-value Pre vs P 0,000 0,000 0,741 0,056 0,003 0,763p-value Pre vs Pp 0,000 0,000 0,123 0,850 0,000 0,000Post (P) 3.608 34,7% 2.919 28,2% 4.235 37,1%p-value P vs Pp 0,000 0,051 0,017 0,466 0,000 0,000Post-post (Pp) 2.328 35,4% 2.384 33,1% 2.759 31,5%
SmallPre 984 41,8% 751 22,9% 1.200 35,3%p-value Pre vs P 0,627 0,000 0,773 0,298 0,006 0,653p-value Pre vs Pp 0,001 0,000 0,258 0,056 0,001 0,000Post (P) 1.227 31,6% 722 27,5% 790 41,0%
Page 33 of 41

Table 9 Orders Aggressiveness: during the Closing Auction. Panel A reports the results for the MIB30 stocks and Panel B for the MIDEX stocks. Orders are classified by type (NAO, NO and AO) and by size (small, medium and large); they report results for the average order size (in Euro amount) and the percentage number of orders over the two periods Post and Post-post. The percentage is computed over the total number of orders by row.
PANEL A - MIB30Order Type
Non Aggressive Neutral AggressiveAvg Trade Size % tot Avg Trade Size % tot Avg Trade Size % tot
Order size Time periods (ATS) (ATS) (ATS)Euro Euro Euro
Totalpost 40.041 65,5% 6731 6,6% 21842 27,9%p-value P vs Pp 0,000 0,999 0,000 0,092 0,000 0,000post-post 21.164 42,5% 9046 5,2% 50078 52,4%
Largepost 85.064 80,4% 18450 4,2% 54068 15,5%p-value P vs Pp 0,000 0,152 0,002 0,000 0,000 0,000post-post 40.041 50,7% 28413 6,4% 135842 42,9%
Mediumpost 40.276 60,7% 4327 6,6% 16266 32,7%p-value P vs Pp 0,000 0,042 0,117 0,565 0,000 0,000post-post 20.930 37,9% 3392 4,6% 29450 57,5%
Smallpost 2.872 59,9% 561 9,0% 2343 31,1%p-value P vs Pp 0,742 0,000 0,246 0,330 0,000 0,000post-post 2.829 43,0% 470 5,0% 3811 52,0%
PANEL B - MIDEXOrder Type
Non Aggressive Neutral AggressiveAvg Trade Size % tot Avg Trade Size % tot Avg Trade Size % tot
Order size Time periods (ATS) (ATS) (ATS)Euro Euro Euro
Totalpost 37.690 63,0% 10311 13,5% 16093 23,5%p-value P vs Pp 0,000 0,000 0,000 0,021 0,000 0,000post-post 11.657 53,0% 3283 11,1% 8395 35,9%
Largepost 71.662 76,1% 22473 9,6% 31426 14,3%p-value P vs Pp 0,000 0,000 0,000 0,063 0,000 0,000post-post 21.334 66,0% 7522 8,1% 17649 26,0%
Mediumpost 40.722 61,9% 8222 12,8% 14008 25,3%p-value P vs Pp 0,000 0,000 0,000 0,323 0,000 0,000post-post 12.087 50,8% 2458 12,0% 6515 37,1%
Smallpost 5.894 51,8% 2030 18,6% 4195 29,6%p-value P vs Pp 0,000 0,001 0,000 0,001 0,000 0,000post-post 1.427 44,3% 451 12,5% 1341 43,2%
Page 34 of 41

Table 10 Orders by origin:MIB30 stocks. This table shows both the average order size and the % number of orders classified by their origin according to the following codes: X1 for intermediary on proper account; X2 for intermediary on customer account; X3 for institutional and retail investors via professional brokers and X4 for retail investors. The table shows results for both the closing auction (CA), and the 5 min intervals of the last 25 min of the continuous trading phase.
Time euro % Num euro % Num euro % Num euro % Num euro % Num euro % Num euro % Num euro % Num
5:00-05pm 68 713.6 10.7% 55 242.8 14.5% 47 538.9 35.0% 32 774.4 31.1% 18 763.7 22.0% 22 591.5 22.4% 18 107.3 32.3% 21 270.0 32.0%p-values P vs PP 0.116940 0.000207 0.439405 0.067700 0.963855 0.052974 0.191786 0.0300535:05-10pm 78 011.9 10.3% 55 271.0 14.1% 52 488.1 34.8% 38 178.8 30.6% 22 163.7 22.6% 24 543.4 22.3% 16 940.3 32.3% 20 719.2 33.0%p-values P vs PP 0.349645 0.000167 0.392960 0.110562 0.937608 0.088730 0.148727 0.0399075:10-15pm 76 579.9 9.8% 51 457.7 14.0% 53 589.5 34.1% 36 500.7 29.7% 30 129.8 23.7% 24 615.0 22.7% 17 655.5 32.3% 18 459.1 33.6%p-values P vs PP 0.203084 0.000228 0.876230 0.158154 0.291544 0.114782 0.146790 0.0461845:15-20pm 84 611.0 9.5% 58 182.4 13.3% 50 758.1 32.6% 40 034.0 30.0% 38 200.1 24.9% 23 107.2 22.6% 16 732.9 32.9% 19 584.0 34.1%p-values P vs PP 0.504045 0.000545 0.956333 0.131908 0.076093 0.169431 0.106613 0.0457165:20-25pm 188 089.3 13.8% 75 336.9 12.8% 66 175.6 30.3% 47 933.1 27.8% 30 941.6 21.7% 23 019.5 19.8% 17 050.0 34.2% 20 838.4 39.6%p-values P vs PP 0.017181 0.088240 0.684045 0.148227 0.196352 0.235317 0.082072 0.038732CA 236 096.2 10.9% 80 396.7 13.7% 131 190.7 33.2% 114 728.0 29.8% 300 186.0 23.0% 202 241.8 22.0% 16 730.4 32.9% 17 891.7 34.5%p-values P vs PP 0.114693 0.000150 0.457313 0.064177 0.946778 0.050909 0.174717 0.026821
MIB30: order size by origin of order flow (euro amount) and % number of orders by origin and time
Post (P) Post post (PP) Post (P) Post post (PP) Post (P)X1 X2
Post post (PP) Post (P) Post post (PP)X3 X4
X1: intermediary on proper account; X2: intermediary on customer account; X3: institutional investors + retail via professional broker; X4: retail investors
Page 35 of 41

Table 11- Price discovery proxies. This table shows values for the average of the absolute value of the Close to Open return (H(RP)) and the variance of the Close to Open return (V(RP) ), both normalized by a similar measure calculated using the midday to midday return. These indicators are computed both using the Reference Price (RP) as the closing prices, and using the closing auction price (CAP):
H(RP,CAP) = Average | ln(OPt+1/RPt, CAPt) | / Average | ln (MPt+1/ MPt) |
V(RP, CAP) = Variance(ln(OPt+1/RPt, CAPt)) / Variance( ln (MPt+1/ MPt))
where OP is the opening price, and MP is the average price between 11 and noon. These are calculated for each stock and then averaged across stocks within each segment. The table also reports results for both the difference (Diff.) between the two indicators within the Post and the Post-post periods, and the change in the value of each indicator across periods. We use *, and ** for the 5% and 1% significance. Market Segment
Proxy Pre Period I
Post Period II
Post-Post III
(II) – (I)
(III) – (II)
H(RP) 0.513 0.457 0.449 -0.07** -0.003 H(CAP) - 0.470 0.454 - -0.020 Diff. - -0.014* -0.005 - V(RP) 1.122 0.977 1.096 -0.20** 0.136* V(CAP) - 1.055 1.101 - 0.007
MIB30 Diff. - -0.078** -0.005 -
H(RP) 0.558 0.520 0.550 -0.037 0.018 H(CAP) - 0.554 0.601 - 0.039 Diff. - -0.034** -0.051 - - V(RP) 1.077 1.491 1.467 0.530 -0.172 V(CAP) - 1.904 2.366 - 0.261
MIDEX Diff. - -0.414 -0.899 - -
H(LP) 0.602 0.566 -0.037 H(CAP) 0.573 Diff. -0.008 V(LP) 0.888 0.325 -0.563** V(CAP) 0.334
CAC
Diff. 0.009 Figure 1 – Auction/last 5 minutes’ turnover as percentage of total daily turnover (May-June, 2004)
Page 36 of 41

Figure 2 Trading Volume over the last 10 minutes of the continuous trading phase for the three sample periods (Pre, Post and Post-post), scaled by the Trading Volume in the same stock during the 11am-12am interval averaged over the period. Normalized values are obtained as follows: firstly, for each stock average volume is computed for the last minute of the continuous trading phase; secondly, daily values are averaged over each of the three sample periods (two for the CAC40 stocks) and this statistic is normalized to the average volume computed for the interval 11am-12am of the same sample period. Notice that for CAC40 stocks, the closing auction was added up to the close of the continuous phase; for Borsa Italiana’s stocks, the closing auction replaced 5 minutes of the continuous phase and added up other 10 minutes.
0,00
0,05
0,10
0,15
0,20
0,25
0,30
0,35
0,40
1 2 3 4 5 6 7 8 9 1 11
Post-post periodPost periodPre period
0.00
0.05
0.10
0.15
0.20
0.25
0.30
0.35
0.40
0.45
0.50
1 2 3 4 5 6 7 8 9 10
Post-post periodPost periodPre period
VolumeClosing Auction
tocksPanel B- MIDEX s
VolumeClosing Auction
tocksPanel A - MIB30 s
0,00
0,05
0,10
0,15
0,20
0,25
0,30
0,35
0,40
0,45
1 2 3 4 5 6 7 8 9 10 11
Post period
Pre period
Closing Ae
uctionVolum
Closing Auction Volumes
CAC40D-Panels stock
Page 37 of 41

Figure 3 The Average Trade Size over the last 10 minutes of the continuous trading for the three sample periods (Pre, Post and Post-post), scaled by the Average Trade Size in the same stock during the 11am-12am interval averaged over the period. Normalized values are obtained as follows: firstly, for each stock average trade size is computed for the last minute of the continuous trading phase; secondly, daily values are averaged over each of the three sample periods (two for the CAC40 stocks) and this statistic is normalized to the average volume computed for the interval 11am-12am of the same sample period. Notice that for CAC40 stocks, the closing auction was added up to the close of the continuous phase; for Borsa Italiana’s stocks, the closing auction replaced 5 minutes of the continuous phase and added up other 10 minutes.
1,00
1,15
1,30
1,45
1,60
1,75
1,90
2,05
2,20
1 2 3 4 5 6 7 8 9 1 11
Post-post periodPost periodPre period
Closing Auction Siz
Average eTrade
Panel A - MIB30 stocks
1,00
1,15
1,30
1,45
1,60
1,75
1,90
2,05
1 2 3 4 5 6 7 8 9 10
Post-post periodPost periodPre period
Closing AuctionAverage Trade Size
Panel B - MIDEX stocks
1,00
1,20
1,40
1,60
1,80
2,00
2,20
2,40
2,60
2,80
3,00
1 2 3 4 5 6 7 8 9 10 11
Post periodPre periodClosing Auction Ats
Panel D- CAC40 stocks
Closing Auction ASizTrade
verage e
Page 38 of 41

Figure 4 Quoted Bid-Ask Spread over the last 10 minutes of the continuous trading for the three sample periods (Pre, Post and Post-post), scaled by the Bid-Ask Spread in the same stock during the 11am-12am interval averaged over the period. Normalized values are obtained as follows: firstly, for each stock Bid-Ask Spread is computed for the last minute of the continuous trading phase; secondly, daily values are averaged over each of the three sample periods (two for the CAC40 stocks) and this statistic is normalized to the average Quoted Bid-Ask Spread computed for the interval 11am-12am of the same sample period. Notice that for CAC40 stocks, the closing auction was added up to the close of the continuous phase; for Borsa Italiana’s stocks, the closing auction replaced 5 minutes of the continuous phase and added up other 10 minutes.
1.00
1.15
1.30
1.45
1.60
1.75
1 2 3 4 5 6 7 8 9 10 11
Post-post periodPost periodPre period
Panel A - MIB30
1,00
1,15
1,30
1,45
1,60
1,75
1,90
1 2 3 4 5 6 7 8 9 10 11
Post-post periodPost periodPre period
Panel B - MIDEX stocks
0,70
0,80
0,90
1,00
1,10
1,20
1,30
1,40
1,50
1 2 3 4 5 6 7 8 9 10
Post period
Pre period
Panel D - CAC40 stocks
Page 39 of 41

Page 40 of 41
1,00
3,00
5,00
7,00
9,00
11,00
13,00
1 2 3 4 5 6 7 8 9 10 11
Post-post periodPost period
Pre period
Panel B - MIB30 stocks
0,60
1,10
1,60
2,10
2,60
3,10
3,60
4,10
4,60
1 2 3 4 5 6 7 8 9 1 11
Post period
Pre period
Panel D - CAC40 stocks
1,00
3,00
5,00
7,00
9,00
11,00
13,00
1 2 3 4 5 6 7 8 9 10 11
Post-post periodPost periodPre period
Panel B - MIDEX stocks
Figure 5 Volatility over the last 10 minutes of the continuous trading for the three periods (Pre, Post and Post-post), scaled by Volatility in the same stock during the 11am-12am interval averaged over the period. Normalized values are obtained as follows: firstly, for each stock volatility is computed for the last minute of the continuous trading phase; secondly, daily values are averaged over each of the three sample periods (two for the CAC40 stocks) and this statistic is normalized to the average Volatility computed for the interval 11am-12am of the same sample period. Notice that for CAC40 stocks, the closing auction was added up to the close of the continuous phase; for Borsa Italiana’s stocks, the closing auction replaced 5 minutes of the continuous phase and added up other 10 minutes.

How to Close a Stock Market_FINAL September 26, 2006
Page 41 of 41
Appendix 1 - Institutional investors’ non-discretionary trading model Assume that there are three stages of trading during the day: Early, Late and Closing. Most of the trading is determined exogenously, however there are also the mutual funds (and other institutions), which have exogenous inflows and outflows and are settled at the Reference Price (RP). This price is determined as a weighted average price of the last 10% of trading volume. These institutions want to minimize the variance of the deviation between the price at which they trade and the RP (we assume that RP is determined in two later stages). By the time the fund has to make a decision of how much of his volume to trade at the close we assume that he already knows the price at the late period, the quantity traded at the late period and the total quantity it needs to trade. We let the exogenously given aggregate trading needs of the mutual funds be denoted by MFv~ . The fund
knows his own towards the end of the day (but no one knows MFiv MFv~ and they assume it to be unchanged
by their actions) and must decide how much of it to trade at the late stage, and how much to leave for the closing auction. and LV CV~ are exogenously given volume other than those of mutual funds at the two stages. The mutual funds try to decide on how to allocate their fixed amount between the trading stages. Mutual fund I is too small to influence the price, thus minimizes (we assume that they know the realization of ,
and at that stage): EV
LV MFiv
Notice that:
Assuming (for simplicity) that the close volume is always less than 10% of the daily volume, we can state that the mutual funds minimize:
Where
is the percentage of the daily volume executed at the CA time 10, and
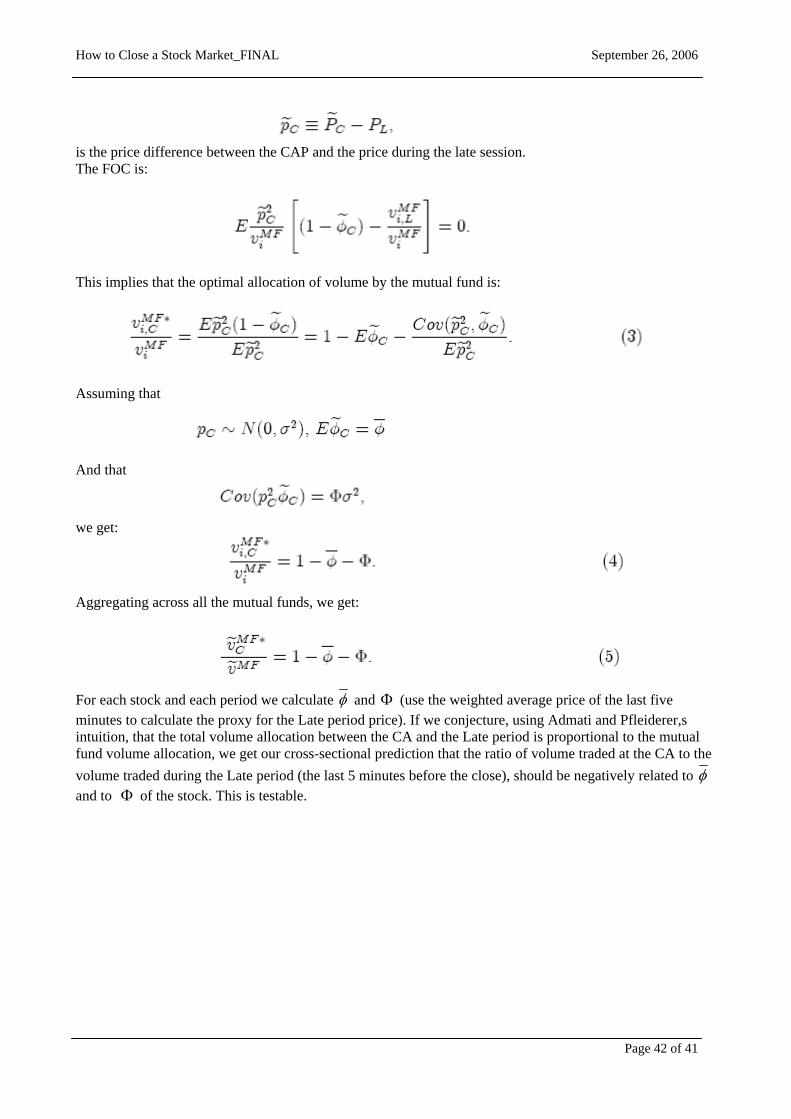
How to Close a Stock Market_FINAL September 26, 2006
Page 42 of 41
is the price difference between the CAP and the price during the late session. The FOC is:
This implies that the optimal allocation of volume by the mutual fund is:
Assuming that
And that
we get:
Aggregating across all the mutual funds, we get:
For each stock and each period we calculate φ and Φ (use the weighted average price of the last five minutes to calculate the proxy for the Late period price). If we conjecture, using Admati and Pfleiderer,s intuition, that the total volume allocation between the CA and the Late period is proportional to the mutual fund volume allocation, we get our cross-sectional prediction that the ratio of volume traded at the CA to the volume traded during the Late period (the last 5 minutes before the close), should be negatively related to φ and to of the stock. This is testable. Φ