how the financial crisis affects pensions and … · how the financial crisis affects pensions and...
TRANSCRIPT

How the Financial Crisis Affects Pensions and Insurance and Why the Impacts
Matter
Gregorio Impavido and Ian Tower
WP/09/151

© 2009 International Monetary Fund WP/09/151 IMF Working Paper Monetary and Capital Markets Department How the Financial Crisis Affects Pensions and Insurance and Why the Impacts Matter
Prepared by Gregorio Impavido and Ian Tower
Authorized for distribution by Inci Otker-Robe
July 2009
Abstract This paper discusses the key sources of vulnerabilities for pension plans and insurance companies in light of the global financial crisis of 2008. It also discusses how these institutional investors transit shocks to the rest of the financial sector and economy. The crisis has re-ignited the policy debate on key issues such as: 1) the need for countercyclical funding and solvency rules; 2) the tradeoffs implied in marked based valuation rules; 3) the need to protect contributors towards retirement from excessive market volatility; 4) the need to strengthen group supervision for large complex financial institutions including insurance and pensions; and 5) the need to revisit the resolution and crisis management framework for insurance and pensions.
This Working Paper should not be reported as representing the views of the IMF. The views expressed in this Working Paper are those of the author(s) and do not necessarily represent those of the IMF or IMF policy. Working Papers describe research in progress by the author(s) and are published to elicit comments and to further debate.
JEL Classification Numbers: G20, G23 Keywords: Pensions, insurance, financial crisis Author’s E-Mail Address: [email protected] and [email protected] The authors are grateful for comments received from Barry Johnston, Inci Otker-Robe, Alex Tieman and Christian Mulder.
2
Contents Page
I. Introduction ............................................................................................................................4
II. The Role of Pension Plans and Insurance Companies ..........................................................4
III. Key Pensions and Insurance Characteristics........................................................................6
IV. The Nature of Assets and Liabilities .................................................................................10
V. Sources of Vulnerability .....................................................................................................18 Asset shocks.....................................................................................................19 Liability shocks................................................................................................26
VI. Risk Sharing and Transmission Channels to the Rest of the Economy.............................30 A. Pensions ..................................................................................................................30 B. Insurance Companies ..............................................................................................42
VII. Policy Conclusions ...........................................................................................................45
References................................................................................................................................49 Tables 1. Asset Changes in Corporate Plans (Major Stock Indices) ..................................................20 2. Asset Changes in Mandatory DC Plans ..............................................................................21 3. Insurance Sector Announced Losses and Capital-raising to Date ......................................23 4. Liability Changes in Corporate Plans (Major Stock Indices) .............................................27 5. Funding Ratio Changes in Corporate Plans (Major Stock Indices) ....................................33 6. Composition of Household Financial Balance Sheet in Select OECD...............................36 7. 2008 Financial Crisis and Multi-funds in Latin America ...................................................37 8. Public Debt, Pension Spending and Implicit Pension Debt for Thirty Five Low and
Middle Income Countries for Various Years During the end-1990s and 2000 .................41 Figures 1. Role of Financial Assets in Overall ......................................................................................8 2. Assets in DB and DC Private Plans (OECD and Latin America).........................................9 3. Pension Assets as Percent of GDP in OECD Countries (2007) .........................................12 4. Pension Assets as Percent of GDP in Latin American Countries (06/2008) ......................13 5. Asset Allocation of OECD Private Pension plans (2006) ..................................................14 6. Asset Allocation (average) of Latin American Pension Plans (06/2008) ...........................15 7. Pension Fund Returns in Selected OECD Countries (January–October 2008) ..................19 8. Corporate Plan Assets in Major Stock Indices (January 2007–April 2009).......................20 9. CDS Spreads in the Insurance Sector .................................................................................24 10. Bloomberg Insurance and Bank Indices ............................................................................25 11. Corporate Plan Liabilities in Major Stock Indices (January 2007–April 2009) ................27
3
12. Changes in Accounting Funding Levels of Corporate Plans of Major Stock Indices (January 2007–April 2009) ................................................................................................33
13. Funding Ratios of U.S. State and Local Plans ...................................................................34 14. Minimum Pension Guarantees...........................................................................................39 Boxes 1. Insurance Companies’ Balance Sheets: The Importance of ALM......................................17 2. Insurance Companies Accounting and Solvency Requirements ........................................18 Annexes I. Liability Valuation Rules in Select OECD Countries .......................................................52 II. “Simpler” Presentation of FAS 87 ....................................................................................55

4
I. INTRODUCTION This paper discusses they key sources of vulnerabilities and transmission channels to the rest of the financial sector and real economy for the pension and insurance sectors associated with the global financial crisis of 2008. Given the heterogeneity of insurance and pensions arrangements, the objective of the paper is not to quantify the impact of the crisis on pension and insurance balance sheets. Given its findings, the paper also aims at drawing related policy implications. The paper focuses on OECD and Latin American countries as representative of a wide range of insurance and pension arrangements and for which data is more readily available. Within these countries, a wide range of arrangements of pension institution exists covering mandatory and voluntary plans, specialized pension annuity companies, pure asset management pension plans and other forms of plans providing a wide array of financial and biometric1 guarantees, and with very different actuarial, solvency and accounting standards (even within countries). Substantial heterogeneity exists also in the insurance sectors of these countries with large companies, part of large financial groups companies insuring a wide array of risks and providing different forms of financial guarantees. There is also a variety of approaches to measuring, managing and regulating insurance company solvency, while efforts continue (including the recently-agreed European Solvency II legislation) to develop more risk-based international standards. The paper is structured as follows. Section II discusses the institutional role of pension funds and insurance companies. Section III discusses the key pensions and insurance characteristics highlighting their differences and similarities. Section IV discusses the nature of the assets and liabilities in these two industries. Section V discusses the sources of vulnerabilities for insurance companies, defined benefit (DB) and defined contribution (DC) pension plans. Section VI discusses the key differences in risk sharing properties of insurance and pension arrangements, as well as transmission channels to the rest of the financial and real sectors. Policy conclusions follow in section VII.
II. THE ROLE OF PENSION PLANS AND INSURANCE COMPANIES Contractual savings (pension plans and life insurance companies)2 are an important vehicles for channeling personal sector savings. While pure life insurance pays out in case of death or disability, life insurers in most countries are now mostly engaged in long term contractual savings business, including savings for retirement. In many markets, life insurance companies are the major providers of annuities—the payout phase of retirement savings. In common with pensions, life insurance therefore enables households to smooth income and
1 Underwriting risks covering all risks related to human life conditions, e.g., death, disability, longevity, but also birth, marital status, age, and number of children (e.g., in collective pension schemes).
2 We exclude P&C insurers as they have very short term liabilities and do not typically provide savings products and financial guarantees.

5
consumption over the lifecycle. Without such products, precautionary savings might have to rise, affecting consumer behavior, and there could be adverse impacts on government finances associated with a need to strengthen social safety nets. Contractual savings promote more efficient risk diversification by the financial sector. Contractual savings can shift financial intermediation from banks to capital markets by increasing the demand for long-term financial assets. In particular, they are associated with an increase in stock market depth in countries where corporates rely more on capital market financing. They are associated with an increase in bond market depth in countries that where corporates rely more on bank financing. Also, pension plans lead to an increase in stock market depth and liquidity in countries in which pension contributions are mandatory, while these two effects are less clear in countries in which pension contributions are primarily voluntary (Impavido, Musalem and Tressel (2002b)). Contractual savings can improve the mitigation of firms’ and banks’ financial risks by increasing the availability of long term funds to them. Firms tend to supply more long term debt and banks tend to engage in more maturity transformation. In capital market based financial systems3, both the growth of financial savings and their portfolio choices are associated in increased debt finance. In these systems, contractual savings would hold larger shares of equities in their portfolios and firms tend to substitute equity finance for debt finance, mainly at the expense of short term debt finance4. The reduction in equity rationing can foster information disclosure and better corporate governance mechanisms on the stock market. In bank-based financial systems, only the growth of contractual savings is also associated with an increase in debt finance – and an increase in debt maturity. In these systems, contractual savings provide liquidity to banks and encourage them to supply long-term loans in proportion of total loans (Impavido Musalem and Tressel (2002a) and (2001)). These different channels suggest that banks and pension plans are complementary sources of finance for firms. The key role of insurance companies is to help other sectors manage risk. By transferring risks from the corporate and household sectors, insurance markets facilitate economic activity that could otherwise expose parties to unacceptable risk of loss (Das, Davies and Podpiera (2003)). Insurance contracts generally reference an event of loss to the insured party itself—and differ in this regard from derivatives that reference an underlying market price. But insurance companies also contribute to financial sector risk management, through reinsurance and credit protection products. Reinsurance companies function similarly in relation to primary insurers, enabling them to manage risk, for example by taking on losses above a certain level (catastrophic risk). 3 See Demirguc-Kunt and Levine (1999) for a definition. In bank-based systems banks play a leading role in mobilizing savings, allocating capital, overseeing the investment decisions of corporate managers, and providing risk management vehicles. In market/capital-based systems securities markets share center stage with banks in allocating savings to firms, exerting corporate control, and easing risk management.
4 Reflecting the longer term liability structure of contractual savings.
6
Finally, contractual savings can positively affect economic growth. They do so directly by raising capital accumulation and productivity (Demirguc-Kunt and Levine (1996), Levine and Zervos (1996), Neusser and Kugler (1998)) and when their impact is not offset by government dissaving (Samwick (1998) and Bailliu and Reisen (2000)). They can also affect growth indirectly by reducing firms’ and banks’ vulnerability which, in turn, can foster investments and growth by reducing the country risk premium and interest rates.
III. KEY PENSIONS AND INSURANCE CHARACTERISTICS Pensions and insurance companies are heterogeneous long term institutional investors. For instance, private pension plan managers take a variety of corporate forms. They can be separate corporate pension plan managers, life insurance companies (typically, in the OECD), multi or single-employer pension plans, banks, specialized asset managers (typically, in Eastern Europe and Latin America) and specialized pension annuity providers (typically, in Latin America). Their operational structure and characteristics are determined at the country level by the overall pension system design, regulations and traditions for insuring longevity risk. Despite the staggering heterogeneity of private pension plans’ industrial organization, their institutional investor role can be analyzed along in three key dimensions: (1) the mechanism used to finance retirement benefits, which is the dimension relevant for a discussion on risk sharing properties; (2) the degree of funding of pension liabilities, which is the dimension relevant for a discussion on financial stability, aggregate savings, growth and capital formation; and (3) the degree of actuarial fairness, which is another dimension relevant for a discussion on financial stability but also on labor market efficiency. Actuarial fairness, in turn, has two features: (3a) a macroeconomic feature that refers to the long-run financial viability of the plan; and (3b) a microeconomic feature that refers to the extent to which benefits are linked to contributions (this second feature is often referred to “intergenerational fairness” and is related to labor market participation incentives). DC pension plans are broadly plans where contributions are exogenous and benefits are endogenous. That is, the value of retirement benefits5 depends only on the level and timing of contributions as well as their compounded rate of return in the individual accounts during the working life. In traditional DC pension plans, contributors are often responsible for choosing plan managers6, asset allocation and fully bear the investment risk. They also fully bear any biometric risk7 (typically, longevity risk) unless they voluntarily or mandatory purchase an
5 Normally a final cash balance to be withdrawn in the form of a lump-sum, phased withdrawal or annuity, or any combination of these types of benefits.
6 Exceptions would include mandatory national provident funds very common in former British colonies where only one DC plan serves the labor force or the specific labor force group (civil servants, armed forces, et cetera).
7 See Footnote 1.

7
annuity from an annuity company. Because of these characteristics, the focus of analysis of DC plans is at the household level. However, important fiscal consequences arise from the explicit or implicit guarantees that governments provide to their mandatory systems. DB pension plans are plans where benefits are exogenous and contributions of the sponsor are endogenous. Benefits are typically linked to the individual workers’ career history and wage in the form of final salary or some form of career earning average. The sponsor of a DB plan underwrites the pension liability and fully absorbs the biometric risk8 and the financial risk. Hence, his contributions are endogenous (while the contributions of the workers are typically exogenously determined). Because of these characteristics, the focus of analysis of DB plans is on the solvency of the pension firms and its impact on the balance sheet of the sponsor. When the sponsor is the government, the solvency analysis equates to fiscal/debt stability analysis. The level of funding and the financing mechanisms of pension liabilities are often interrelated dimensions. Indeed they are also related to the actuarial fairness dimension. A DC plan is by definition fully funded and actuarially fair, both in the macro and micro senses. A DB plan, instead, can be funded or unfunded and at the same time have a benefit formula that is microeconomically actuarially fair or unfair and be macroeconomically (as defined before) balanced or unbalanced.9 Funding of liabilities, at the level of the whole pension system varies across countries. For instance, all countries in Eastern Europe and Central Asia (with the exception of Kazakhstan) that introduced DC plans also maintained a defined-benefit system. In Lithuania and Hungary, for example, less than 30 percent of the retirement income for retirees today comes from financial assets in individual accounts. Countries Chile, El Salvador, Mexico and Peru, have abolished they DB component of their pension system and the majority of retirement incomes comes from mandatory DC pensions (Figure 1).10 Within private pension plans, with the exception of Latin American and Eastern European countries, all other countries have both DB and DC plans (Figure 2).
8 See Footnote 1.
9 See Lindbeck and Persson (2004) for a detailed discussion of this taxonomy.
10 Notice that the figure approximates the DB/DC split in pension systems by looking at financial assets. Indeed, in many countries, DB plans are funded to a variable degree.

8
Figure 1. Role of Financial Assets in Overall Income Retirement Financing
0 2 5 5 0 75 10 0
B e lg iumN or w a y
S w i tz e rla n dC o s ta R ic a
G e rm a n yU r ug u a y A r ge n tin a
H u n g ar yB u lga r iaC a n a d aS w e d e n
L i thu a n iaU n i te d S ta te s
Ir e lan dE s to n iaP o la n d
A u s tr a l iaD om in ic a n R e p ub l ic
S lo v a k R e p u b l icN et h e rla n ds
La tv iaD e n m ar k
U ni t e d K in g d omIc e la n d
E l S a lv a d o rM e x ic o
P e ruC h ile
P riv a t e p en s io n s , p e r c en ta g e o f to ta l r e t i re m e nt p a c k a g e
M a n d a tor y de f ine d c o nt rib u t io nD ef in ed b e ne f itV o lu n ta ry p r iv a te p en s io n s
Source: OECD and AIOS.

9
Figure 2. Assets in DB and DC Private Plans (OECD and Latin America)
0% 20% 40% 60% 80% 100%
FinlandFranceKorea
NorwayPortugalCanada
United StatesTurkeyMexico
New ZealandIceland
ItalyDenmark
SpainSlovak Republic
PolandCzech Republic
SwitzerlandHungary
ChileBolivia
El SalvadorPerú
ColombiaUruguay
ArgentinaCosta Rica
R. Dominicana
DC DB
Source: Whitehouse (2007)
Pension systems will react differently to financial shocks since they have a mixture of DC and DB plans with varying degrees of funding. We would expect in general that larger the DC component and/or the higher the degree of funding in a pension system, the more relevant the analysis of the impact of financial shocks. For insurance companies, whereas in non-life insurance shareholders bear all the risks, in life insurance there may be risk-sharing. • In non-life insurance, underwriting and investment losses fall to shareholders. The
insurance company aims to make an underwriting profit (premium income less claims and expenses) and to use investment income to cushion against claims spikes.
• In life insurance, the development of savings and investment business has led to a proliferation of products and policies competing with mutual funds and other fund management services, often exploiting favorable tax treatment for insurance. Investment risk on such products (known as “unit-linked” or “market-linked”) falls wholly or partially to the policyholder. But many companies continue to offer guarantees to policyholders and these take a wide variety of forms including

10
minimum returns and fixed annuity rates as well as contractual terms such as early or regular withdrawal of funds on terms that give policyholders valuable options.
The legal, regulatory and accounting requirements for life insurance and pension funds are separate and distinct, although integrated regulators (e.g., the central bank in the Netherlands) may supervise both sectors. There are occasional proposals to harmonize standards—for example, a long term EU objective is to apply the new Solvency II directive for insurance to pension funds. For pension plans, accounting, solvency and financial disclosure standards vary across countries and vary also within countries.11
IV. THE NATURE OF ASSETS AND LIABILITIES Pension plans and insurance companies are vulnerable to shocks on both the asset and liability side of their balance sheets. In addition, pressures arise also on their income statements in period of economic slowdown. Finally, they share these risks with the rest of the financial sector and real sector through both asset and liability items (specific investment vehicles and product design). This section aims at explaining the similarities and differences in the nature of pension assets and liabilities and how risk sharing with other agents can take place before we assess in the next section the impact of the 2008 financial crisis. The nature of assets and liabilities differ substantially in pension plans and insurance companies. In general, the liability structure of insurance companies is far more complex than that of pension plans. Pension plans, (when they do) tend to insure primarily financial and biometric risks12 while insurance companies insure a wider range of risks as explained later. In both cases, asset liability management techniques are very important for the solvency of the entity. Pension plans liabilities typically take two forms: liability stemming from the insurance of biometric risks13 and liabilities stemming from the insurance of financial guarantees. Within biometric liabilities, longevity insurance is arguably the largest component. Liabilities are linked to the life expectancy of covered retirees and typically take the form of perpetuity coupons. These can be nominal or typically indexed to prices, wages or a combination of the two. As such, they expose the entity underwriting such liabilities to longevity, interest rate, inflation and wage risk. Financial guarantees are often issued by DB and hybrid plans but they are less common among DC (especially mandatory) plans. Financial guarantees typically take the form of minimum interest rate returns on pension policies and can be expressed in a variety of ways. More commonly, the provider would guarantee a minimum return and share excess returns 11 See the subsequent references to the differences between solvency and accounting standards for U.S. public plans and private sector corporate state plans.
12 See Footnote 1.
13 See Footnote 1.

11
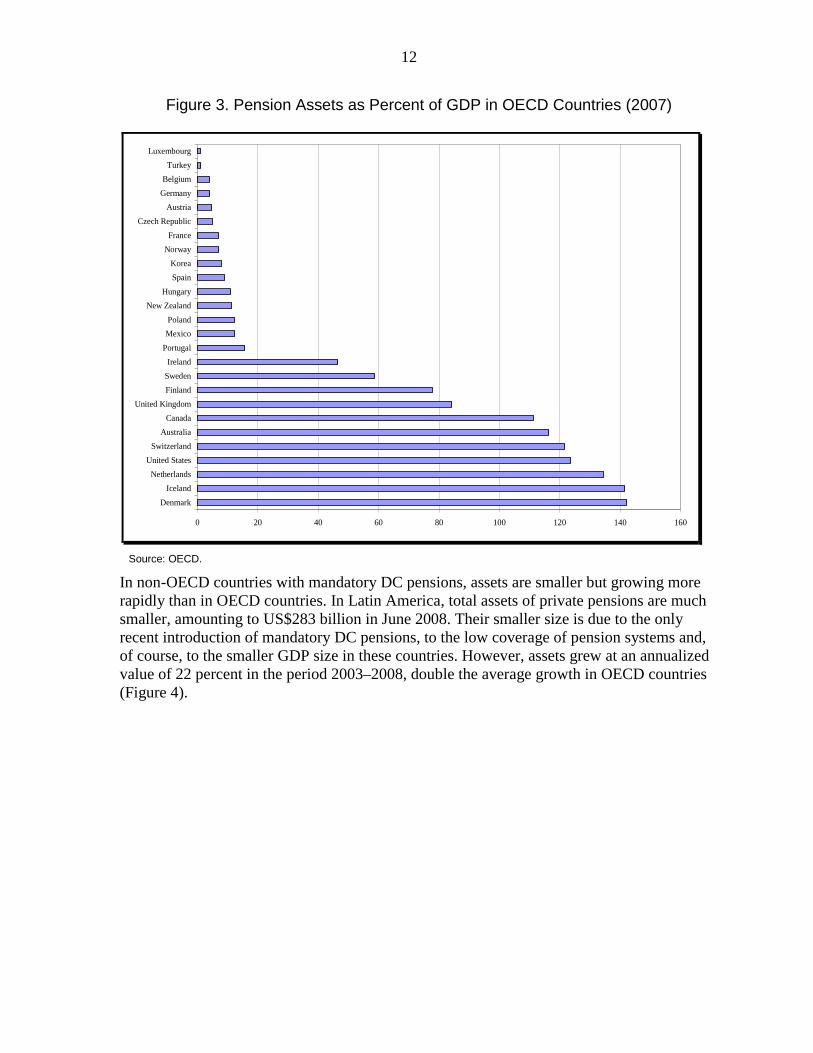
with participants through bonuses. Alternatively, providers of hybrid plans would offer to participants several investment options linked to an investment index and guarantee the return of the index. Pension providers share these risks with retirees through retirement product diversification. DB plans or annuity providers in DC plans provide a highly heterogeneous set of retirement benefits. In this area, product heterogeneity can be staggering. For instance, lump sums and phased withdrawals generally transfer longevity and investment risk from the provider to the retiree. Immediate premium nominal perpetuities transfer only inflation risk to the retiree. With-profit perpetuities share investment risk. Term annuities shift the toxic tail of longevity risk, as well as investment risk towards the end of life-cycle, to retirees. Longevity sharing perpetuities share longevity risk with the retiree by re-pricing annuities as a function of the mortality experience of the pool. There are many more types of retirement products in the market and often they come as a combination of the aforementioned basic types. The high degree of heterogeneity of retirement products and the general disconnection between the accumulation and the decumulation phase in mandatory DC pensions raise concerns about the ability of households to hedge annuitization risk (see later on the section on contagion channels). Pension providers share these risks also through the asset side of the balance sheet. For instance, by investing in CPI indexed government bonds, providers share inflation risk with the Government and therefore, future tax payers. Alternatively, by investing in mortality indexed instruments, they share longevity risk with the issuer.14 Finally, by investing in interest rate swaps to increase the duration of assets, or other derivatives, they share risks with other financial counterparts. While the feasibility of cross country comparisons of pension liabilities is severely impaired by the country specific assumptions embedded in valuations (different actuarial methods, discount rates and life tables) it is far easier to compare the importance of pension plans in terms of assets under management. Pension assets in OECD countries are large and rapidly growing. Assets managed by OECD private pension plan managers reached an absolute figure of US$18 trillion in 2007, representing around 65 percent of the total private pension assets arrangements.15 The U.S. pension market is the largest in the OECD, accounting for 58 percent of total assets. However, its share has been rapidly decreasing as a result of faster growth among pension funds in other OECD countries. Total pension funds assets grew on average 9 percent per year in the period 2003–2007. In relative terms, OECD pension assets represent 75 percent of area GDP (Figure 3).
14 Longevity-linked instruments are becoming an effective way to share the stochastic component of longevity risk (the systemic component can only be shared abroad). For more information, see Blake et al. (2006).
15 The difference is mainly accounted for by private pensions managed by insurance companies.
12
Figure 3. Pension Assets as Percent of GDP in OECD Countries (2007)
0 20 40 60 80 100 120 140 160
DenmarkIceland
NetherlandsUnited States
SwitzerlandAustralia
CanadaUnited Kingdom
FinlandSwedenIreland
PortugalMexicoPoland
New ZealandHungary
SpainKorea
NorwayFrance
Czech RepublicAustria
GermanyBelgium
TurkeyLuxembourg
Source: OECD.
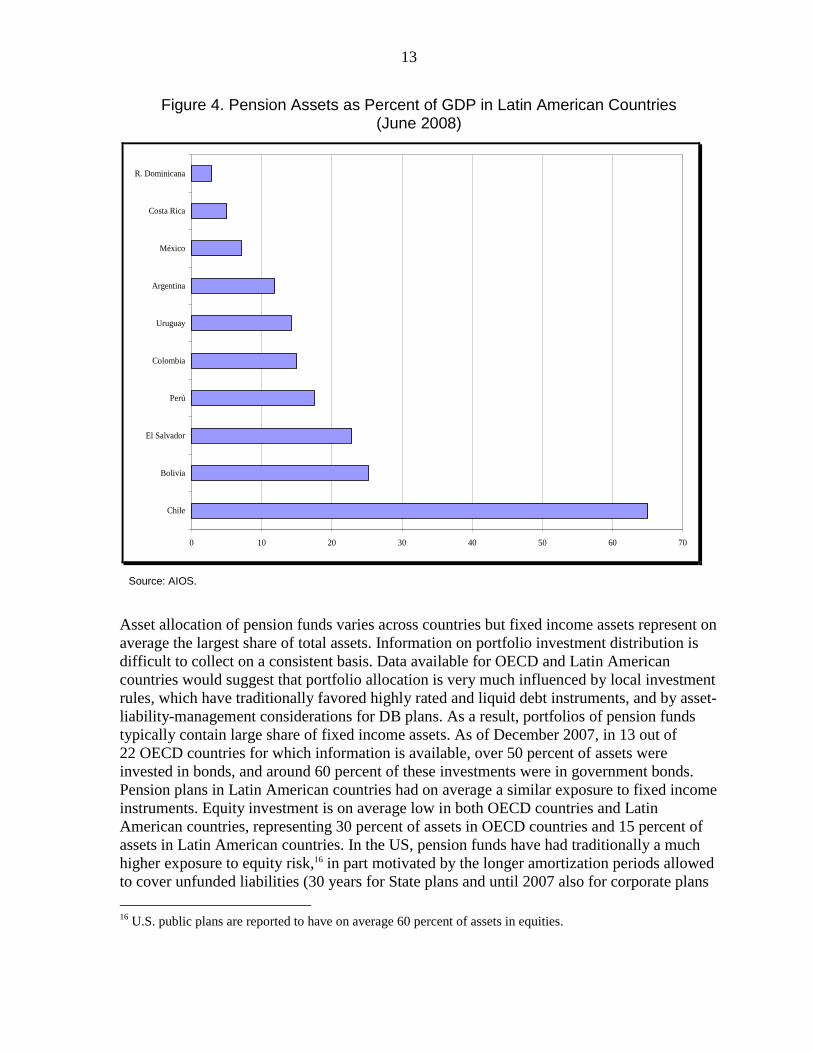
In non-OECD countries with mandatory DC pensions, assets are smaller but growing more rapidly than in OECD countries. In Latin America, total assets of private pensions are much smaller, amounting to US$283 billion in June 2008. Their smaller size is due to the only recent introduction of mandatory DC pensions, to the low coverage of pension systems and, of course, to the smaller GDP size in these countries. However, assets grew at an annualized value of 22 percent in the period 2003–2008, double the average growth in OECD countries (Figure 4).
13
Figure 4. Pension Assets as Percent of GDP in Latin American Countries (June 2008)
0 10 20 30 40 50 60 70
Chile
Bolivia
El Salvador
Perú
Colombia
Uruguay
Argentina
México
Costa Rica
R. Dominicana
Source: AIOS.
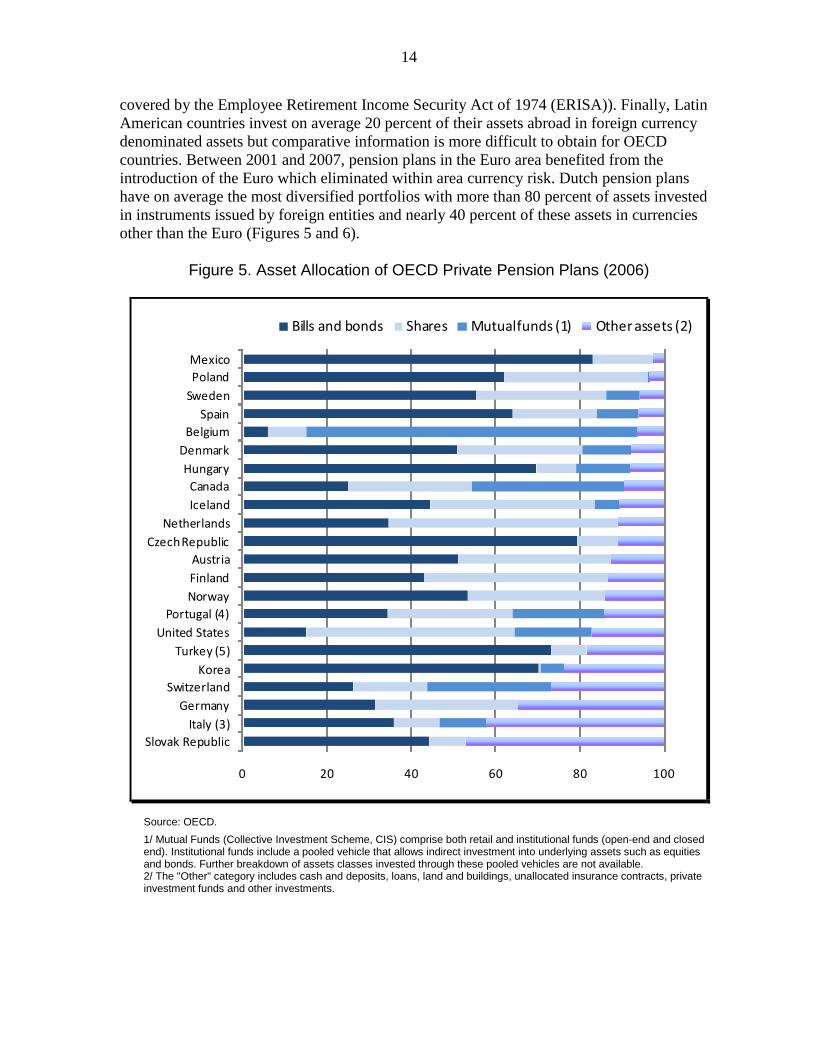
Asset allocation of pension funds varies across countries but fixed income assets represent on average the largest share of total assets. Information on portfolio investment distribution is difficult to collect on a consistent basis. Data available for OECD and Latin American countries would suggest that portfolio allocation is very much influenced by local investment rules, which have traditionally favored highly rated and liquid debt instruments, and by asset-liability-management considerations for DB plans. As a result, portfolios of pension funds typically contain large share of fixed income assets. As of December 2007, in 13 out of 22 OECD countries for which information is available, over 50 percent of assets were invested in bonds, and around 60 percent of these investments were in government bonds. Pension plans in Latin American countries had on average a similar exposure to fixed income instruments. Equity investment is on average low in both OECD countries and Latin American countries, representing 30 percent of assets in OECD countries and 15 percent of assets in Latin American countries. In the US, pension funds have had traditionally a much higher exposure to equity risk,16 in part motivated by the longer amortization periods allowed to cover unfunded liabilities (30 years for State plans and until 2007 also for corporate plans 16 U.S. public plans are reported to have on average 60 percent of assets in equities.
14
covered by the Employee Retirement Income Security Act of 1974 (ERISA)). Finally, Latin American countries invest on average 20 percent of their assets abroad in foreign currency denominated assets but comparative information is more difficult to obtain for OECD countries. Between 2001 and 2007, pension plans in the Euro area benefited from the introduction of the Euro which eliminated within area currency risk. Dutch pension plans have on average the most diversified portfolios with more than 80 percent of assets invested in instruments issued by foreign entities and nearly 40 percent of these assets in currencies other than the Euro (Figures 5 and 6).
Figure 5. Asset Allocation of OECD Private Pension Plans (2006)
0 20 40 60 80 100
Slovak RepublicItaly (3)
GermanySwitzerland
KoreaTurkey (5)
United StatesPortugal (4)
NorwayFinlandAustria
Czech RepublicNetherlands
IcelandCanadaHungaryDenmarkBelgium
SpainSwedenPolandMexico
Bills and bonds Shares Mutual funds (1) Other assets (2)
Source: OECD. 1/ Mutual Funds (Collective Investment Scheme, CIS) comprise both retail and institutional funds (open-end and closed end). Institutional funds include a pooled vehicle that allows indirect investment into underlying assets such as equities and bonds. Further breakdown of assets classes invested through these pooled vehicles are not available. 2/ The "Other" category includes cash and deposits, loans, land and buildings, unallocated insurance contracts, private investment funds and other investments.

15
Figure 6. Asset Allocation (average) of Latin American Pension Plans (June 2008)
36.4
15.48.4
14.5
3.2
20.9
1.2
Government Bonds Financial Institutions Non Financial Institutions Equities Mutual Funds Foreign Assets Other
Source: AIOS.
Pension plans make use of derivatives to hedge interest rate, FX and longevity risk as well as risks associated with financial guarantees. Derivative investment is likely to be of concern in OECD countries and in particularly among DB plans or plans with foreign currency exposure and as a way to increase the duration of assets. However, investment in derivatives is likely to be also speculative, as part of carving out strategies or alpha and beta portfolio management strategies. For instance, in relation to the recent financial crisis, market commentators argue that a list of U.S. pension funds have bought the last-to-be-paid "equity" tranches of CDOs including: the New Mexico Investment Council (US$522 million for 3 percent of its total fund); the General Retirement System of Detroit ($38.8 million); the Teachers Retirement System of Texas ($62.8 million); and CalPERS US$541 million. Over a decade, U.S. pension funds and endowments have bought 7 percent of all the "toxic waste" investment banks and hedge funds had on offer because of high returns. In general, the use of derivatives by pension funds is largely undocumented. As far as insurance sector is concerned, the structure of financial liabilities exposes companies directly to the crisis. Box 1 discusses the structure of insurance company balance sheets in detail. In relation to the financial crisis, a distinction can be drawn between:
16
• non-financial liabilities—the bulk of those of the non-life sector, whose liabilities are related to the likelihood and severity of loss events in the real economy and not to the crisis (and maybe not even to economic downturn); and
• financial liabilities—broadly the guarantees provided by life insurance companies on
savings products and credit protection business. Linked to movements in financial markets, these liabilities are the key source of vulnerability of the sector.
Insurance company assets are overwhelmingly marketable securities. Total assets of insurers worldwide are estimated by Swiss Re at around $18 trillion at end-2007. The majority are invested in high quality assets, in many jurisdictions according to the detailed requirements of the regulator. Although frequently held to maturity under asset-liability matching strategies, assets are accounted for under IFRS as Available for Sale. (Box 2 summarizes the international insurance company accounting and regulatory framework.) While recent accounting changes have blurred the distinction, a key difference between banks and insurance companies in relation to the recognition of losses on marketable securities is therefore that many more of the banks’ holdings are trading assets, where mark-to-market losses must be recognized in the income statement immediately. Life insurers’ assets are predominantly local currency. This reflects the domestic nature of life insurance markets as much as regulatory requirements. Non-life and especially reinsurance companies tend to have a wider range of non-local assets. Finally, reinsurance has a major impact on insurers’ balance sheets. The purchase of reinsurance creates a potential claim on the reinsurance company in case of a claim by the underlying insured party. Reinsurance is usually recognized as a reduction in liabilities and reinsurance recoverable (claims on reinsurers) as an asset. In some jurisdictions primary insurers are required by regulators to hold collateral from reinsurers (or, as in the United States, foreign reinsurers) as a condition of the recoverable being recognized. Amounts of reinsurance purchased vary greatly by company, business line and market conditions. While traditionally reinsurers covered non-life risks, life risks have been the major driver of recent market growth (IAIS 2008). Insurance company assets are mostly marketable securities with some alternative investments and limited structured finance. A key consideration, particularly in life insurance where policies can have 20 year terms or lifetime payouts (pension annuities) is matching assets to liabilities—for example, annuity liabilities with long duration assets. Derivatives are used, particularly in life insurance, and reinsurance, in life and non-life, to manage risks. (Some insurers have been large writers of credit derivatives—monoline insurers and AIG). Although such ALM techniques are improving, many insurance risks and longer term market risks cannot easily be hedged. Insurance company gearing is lower than that of banks, especially in non-life insurance. Non-life insurers in particular have low gearing—Swiss Re estimates that assets are on average only 2.5 times equity compared with 8 times equity for the insurance sector as a whole. Life

17
insurers with savings and investments business have much higher gearing—because more of their premium income is invested for long run returns rather than used to meet claims.
Box 1. Insurance Companies’ Balance Sheets: The Importance of ALM
Insurance companies differ from banks in being funded not by borrowings but by premiums charged to policyholders. The income from these payments is invested and used to pay claims as they arise. In the nature of insurance, which pools risks on the basis that only a minority will lead to loss and so to claims, liabilities are potentially many times higher than premium income. The reserves which insurers establish are estimates of expected future claims as well claims received but not paid—not dissimilar from provisions made by banks for expected losses (though traditionally insurance companies have reserved for expected losses plus a significant margin). Analysis of the financial strength of insurers needs to consider reserving as much as capital adequacy. In life insurance, the insurance element of a policy (which pays out on death or disability) is typically smaller than the savings element, where payouts are linked to market movements (“unit-linked” or “market-linked”) or to a guarantee—maybe a fixed amount at maturity or a rate of return or, on pensions policies, a guaranteed rate on the annuity to be purchased at the maturity of savings phase of the policy. (A single insurer can have a highly varied book of policies, reflecting many years of past policy design and marketing.) Guarantees are valued stochastically and the result reflected in the reserves. Capital is held in line with the regulatory required margin of solvency. A typical insurance company balance sheet is therefore: Liabilities Assets Unit-linked reserves 100 Unit-linked assets 100 Reserve for non-life risks 50 Bonds 180 Reserve for life risks 200 Equities 50 Reserve for guarantees 50 Cash and other assets 100 Margin for solvency (capital) 30 ___ Total 430 430 Note: In practice, most countries require life and non-life business to be carried out in separate legal entities to prevent contagion from major nonlife losses to the savings of life insurance policyholders.

18
Box 2. Insurance Companies Accounting and Solvency Requirements
There are no global standards for insurance company accounting and no global framework of minimum solvency (capital) standards, hampering cross-country comparability of the financial strength of insurance companies. International Financial Reporting Standards are applicable to insurance companies (see IFRS 4) but the framework covers mainly financial instruments (i.e., broadly the assets side) and disclosures (including sensitivity analysis) and not yet insurance contracts themselves (broadly the liability side), where in effect previous national standards continue to apply. The current IASB project, Insurance Contracts Phase II, will introduce a new approach to insurance liabilities, with a final standard due in 2011. A market consistent approach, similar to but not the same as that being proposed in the EU’s Solvency II Directive, is under discussion. IAS 39 (Financial Instruments) applies to insurers. Most classify investments as Available for Sale—profits and losses are accounted for as equity adjustments and recycled to profit and loss only on sale or impairment. Insurance companies’ approaches to impairment are key to the assessment of losses in the crisis. Regulators in many countries prescribe their own standards for accounting for regulatory purposes, which operate alongside the normal accounting standards. This is different from the banking sector where regulators currently tend to mandate the use of accounting standards subject to overrides (“prudential filters”). Insurance companies in Europe have developed their own accounting measures—Embedded Value (EV, most recently developed into MCEV—Market Consistent EV) to measure economic value and profitability for the purposes of reporting to investors. The measurement is not used in the United States, however. The International Association of Insurance Supervisors (IAIS) continues to develop a framework of principles for insurance company solvency assessment (most recently for example, on recognition of internal models), but has no detailed standards equivalent to Basel II. Consideration is now being given by the IAIS to the need for a new common framework for internationally active groups.
V. SOURCES OF VULNERABILITY
The sources of vulnerabilities differ between insurance and pension plans, given the different nature of their assets and liabilities. Pension plans are exposed to three major sources of vulnerabilities: those associated with (1) asset and liability shocks; (2) shocks to the income statement due to decreased investment income; and (3) shocks to contributions into the plan as a consequence of an economic

19
slowdown. These shocks have solvency and fiscal implications for DB plans (or DC with guarantees) and household balance sheet and fiscal implications when for DC plans (see section VI on contagion channels). Asset shocks
Private pensions in OECD countries reported US$4 trillion losses in asset values in the first 10 months of 2008. Pension funds in OECD countries have experienced on average a negative return of nearly 20 percent in nominal terms (22 percent in real terms) since the beginning of the year (see Figure 7). Most of the loss is accounted for by pension funds in the United States (US$2.2 trillion out of the total OECD loss of 3.US$3 trillion) due to their larger than average exposure to equity risk. Only four other OECD countries saw pension fund returns worse than minus 20 percent in nominal terms. In absolute terms, the second largest loss was the United Kingdom (US$0.3 trillion), followed by Australia (US$0.2 trillion). Including other private pension assets, such as those held under personal plans in the United States (i.e., IRAs) and in other countries, the loss increases to about US$5 trillion.
Figure 7. Pension Fund Returns in Selected OECD Countries (January–October 2008)
‐40
‐35
‐30
‐25
‐20
‐15
‐10
‐5
0
5
10
Real Nominal
OECD weighted average rates of return
Source: OECD Global Pension Statistics. Note: Data draw on official data received from OECD Working Party on Private Pensions Delegates (Austria, Belgium, Czech Republic, Denmark, Finland, Greece, Hungary, Ireland, Italy, Korea, Mexico, Poland, Portugal, Slovak Republic, Spain, Switzerland, and Turkey), various sources and OECD estimates. OECD average is an asset-weighted average.
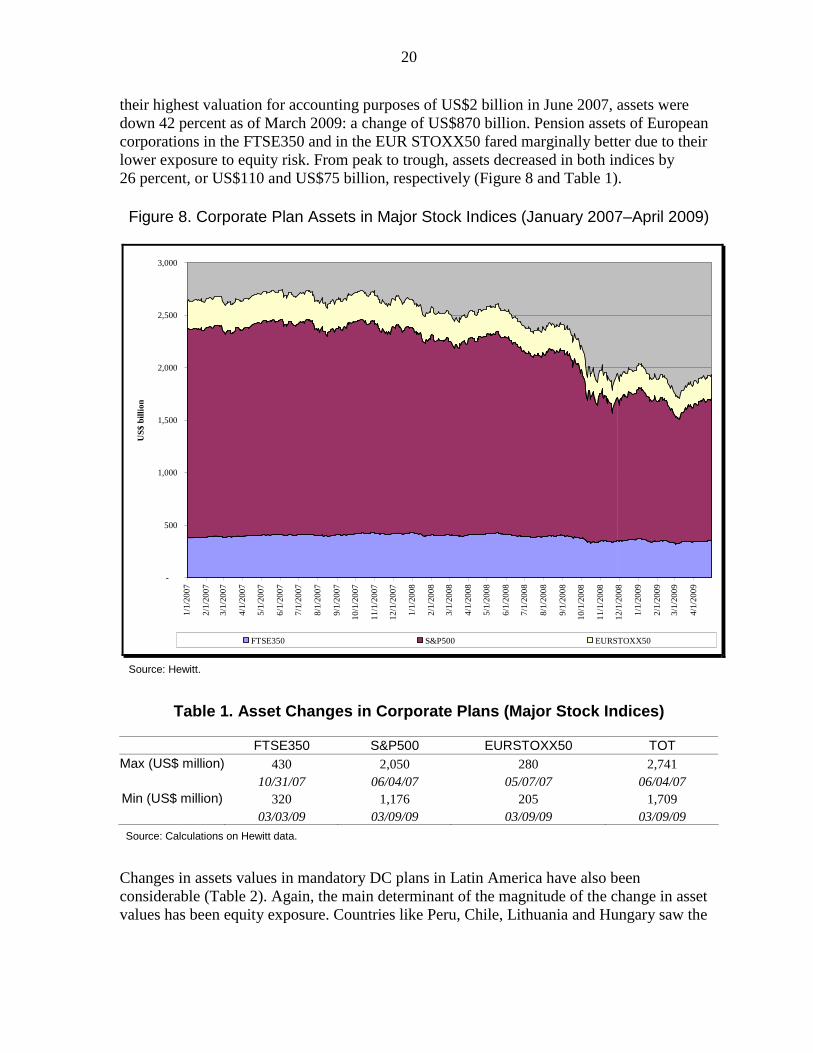
Pension plans of corporations in major stock indices lost around US$1 trillion in asset values between 2007 and the first months of 2009. During this period, both absolute and relative losses have been the largest among pension plans of corporations in the S&P500 index. From
20
their highest valuation for accounting purposes of US$2 billion in June 2007, assets were down 42 percent as of March 2009: a change of US$870 billion. Pension assets of European corporations in the FTSE350 and in the EUR STOXX50 fared marginally better due to their lower exposure to equity risk. From peak to trough, assets decreased in both indices by 26 percent, or US$110 and US$75 billion, respectively (Figure 8 and Table 1).
Figure 8. Corporate Plan Assets in Major Stock Indices (January 2007–April 2009)
-
500
1,000
1,500
2,000
2,500
3,000
1/1/
2007
2/1/
2007
3/1/
2007
4/1/
2007
5/1/
2007
6/1/
2007
7/1/
2007
8/1/
2007
9/1/
2007
10/1
/200
7
11/1
/200
7
12/1
/200
7
1/1/
2008
2/1/
2008
3/1/
2008
4/1/
2008
5/1/
2008
6/1/
2008
7/1/
2008
8/1/
2008
9/1/
2008
10/1
/200
8
11/1
/200
8
12/1
/200
8
1/1/
2009
2/1/
2009
3/1/
2009
4/1/
2009
US$
bill
ion
FTSE350 S&P500 EURSTOXX50
Source: Hewitt.
Table 1. Asset Changes in Corporate Plans (Major Stock Indices)
FTSE350 S&P500 EURSTOXX50 TOT Max (US$ million) 430 2,050 280 2,741
10/31/07 06/04/07 05/07/07 06/04/07 Min (US$ million) 320 1,176 205 1,709
03/03/09 03/09/09 03/09/09 03/09/09 Source: Calculations on Hewitt data.
Changes in assets values in mandatory DC plans in Latin America have also been considerable (Table 2). Again, the main determinant of the magnitude of the change in asset values has been equity exposure. Countries like Peru, Chile, Lithuania and Hungary saw the

21
largest changes in asset values even in conservative default options. Balanced funds decreased between 6 percent in Mexico and 34 percent in Peru.
Table 2. Asset Changes in Mandatory DC Plans
Growth Balanced ConservativeChile 13-Oct -46.1 -23.1 0Mexico 30-Sept -8.3 -6 -0.5Peru 10-Oct -47.8 -33.9 -14.5Uruguay 30-Sept -7.5 Croatia 30-Oct -14.1 Estonia 15-Oct -30.5 -20.9 -9.7Hungary 15-Oct -35 -18Lithuania 15-Oct -48.4 -32.6 -9.4Poland 30-Sept -17.4 Slovak Republic 13-Oct -12.4 -10.3 -2
Source: World Bank.
Life and non-life companies are exposed to different sources of financial strain. Financial strain at nonlife insurers is typically caused by higher than expected claims rather than investment losses. Life companies are exposed to insurance losses from unexpected rates of mortality due, for example, to a pandemic, or increased longevity but market risk is the main risk for many. In general, life companies (other than those with mostly unit-linked business where policyholders bear the market risk) are most exposed to: • a falling interest rate environment (reducing returns on assets/the discount rate on
liabilities); • periods of high market volatility (increasing the costs of guarantees); and • falls in equity or bond markets where the fall is driven, as at present, by increased
spreads rather than changes in the risk-free rate. While shareholders at non-life companies bear all investment risks, low gearing reduces the extent and severity of exposures. Non-life companies are less dependent on investment returns than life companies and tend to have lower risk investment profiles. Nonetheless, Swiss Re estimates that falls in investment values had driven a reduction in non-life companies’ total equity by between 10 percent and 15 percent up to Q3:2008 (Swiss Re (2008)). Further significant falls and greater recognition of investment losses in profits are likely in the Q4 and full year 2008 results. Given the loss-sharing features of many policies, investment losses at life insurance companies have more complex effects: • Losses on assets underlying unit-linked policies are borne by policyholders. Where
losses are large (and reputations are at stake), insurance companies may choose to

22
compensate policyholders—more often they will seek to deflect liability to advisers and distributors (some of them banks) who are likely to have made the original sale.
• Losses on certain other policies (for example “participating” or “with-profits”
policies) may also be passed to policyholders up to the point at which guarantees come into effect—which will vary by contract and company and depend to a large extent on the maturity profile of the policy book and the extent to which previous investment gains are available to absorb losses.
• Other losses will fall to insurers. The extent of guarantees in many markets and the
difficulties and expense of hedging has significantly exposed some life companies to further falls in asset values.
Insurers, with some significant exceptions. did not make major investments in structured finance. Some insurers have made losses on ABS holdings. Some established and have now reabsorbed SPVs. More significantly, a small group of insurers and reinsurers, including AIG, the monoline insurers and, to a much lesser extent, Swiss Re, extended their insurance business to write credit derivatives on structured finance assets, exposing themselves to major mark-to-market losses when these assets fell in value. Surveys by the International Association of Insurance Supervisors (IAIS) have suggested that when the crisis broke, holdings of ABSs were at most 2 percent of total insurance sector assets in any jurisdiction. Fitch estimates U.S. life companies’ holdings of U.S. sub-prime and Alt-A paper of $140 billion or 2.8 percent of total (end-2007) assets. Losses on sub-prime and Alt A RMBSs have therefore been low compared with those of banks. The key reasons for this include: • regulatory investment limits for insurance companies, which contributed, with
conservative investment policies, to insurers being less affected by direct exposure to the asset classes at the center of the crisis; and
• the prevailing differences in insurer and bank business models, which made insurers less likely than banks to package such assets into SPVs or other vehicles with the risk of having to reacquire the assets for their own balance sheet; or to be left with illiquid positions arising from what were intended only as short term trading book positions.
Life companies face losses on a wider range of asset classes than previously. In 2001–03, the most recent period of serious financial strain for life insurance, the pressures arose mainly from equity market falls. Many insurers, particularly in Europe, have since reduced exposure to equities. But life companies have experienced losses on bond portfolios due to widening corporate bond spreads and in some cases on alternative investment classes—which though limited by investment regulations, represent up to 5 percent of assets in some markets. IMF estimates are that potential writedowns by insurance companies on holdings of loans and securities originated in the United States, Europe and Japan at $301 billion, which compares with estimated total end-2007 equity of $2.2 trillion (IMF (2009)). Swiss Re has estimated that total life companies’ equity has fallen by between 15 percent and 20 percent up to Q3:2008—reflecting mainly asset write downs but also currency movements and other

23
factors. The European Central Bank put the fall in major insurance companies’ equity in the euro area in the same period at 17 percent (ECB (2008)). Total announced losses by insurers to date are around $225 billion. Of the total losses for the sector, half are losses believed to be related specifically to CDS contracts (and the variants of such contracts written by the monoline insurers). Only about $125 billion (the bulk of it for AIG), has been raised by insurance companies in new capital to date. Table 3 sets out details of the major losses and capital-raising.
Table 3. Insurance Sector Announced Losses and Capital-raising to Date
losses capital Worldwide 225.6 125.9Americas 192.5 113.6Europe 31.6 12.3Asia 1.4 0.0 Major losses by firm loss capitalAmerican International Group 87.0 91.8Ambac Financial Group 12.1 1.4AMB Gernerali Holding 7.8 0.0Hartford Financial 11.9 3.0Met Life 12.8 2.3Prudential Financial (US) 9.0 4.7Allstate Corp 7.2 0.0MBIA 5.6 1.0Allianz 7.3 2.0Swiss Re 6.4 2.6Lincoln National Group 4.5 0.0XL Capital 4.9 2.6Aegon NV 7.9 4.1Genworth Financial 4.6 0.0Principal Financial Group 4.5 0.0Can Financial 3.8 1.3Scottish Re Group 1.7 .1AXA 1.8 2.0Source: Bloomberg
While there has been only one significant failure of an insurer, others have received government funds. In Japan, the relatively small insurer Yamato Life, failed because of exposure to alternative investment vehicles. In the Netherlands, the ING Group (banking and insurance) has accepted a EUR10 billion capital injection and Aegon EUR 3 billion from the government to recapitalization fund. In the US, the Troubled Assets Relief Program (TARP) may be open to life companies subject to federal holding company regulation, although none has received funds yet. Clearly all these cases are dwarfed by the U.S. government support provided to AIG. As the following figures show, the markets have been concerned about the sector—reflected in CDS spreads (Figure 9 — the maximum is AIG) and share prices (Figure 10).

24
Figure 9. CDS Spreads in the Insurance Sector
Insurance CDS Spreads
0
500
1000
1500
2000
2500
3000
3500
400029
-Apr
-07
29-J
un-0
7
29-A
ug-0
7
29-O
ct-0
7
29-D
ec-0
7
29-F
eb-0
8
29-A
pr-0
8
29-J
un-0
8
29-A
ug-0
8
29-O
ct-0
8
29-D
ec-0
8
28-F
eb-0
9
29-A
pr-0
9
M aximum
AverageM inimum
Source: Bloomberg
25
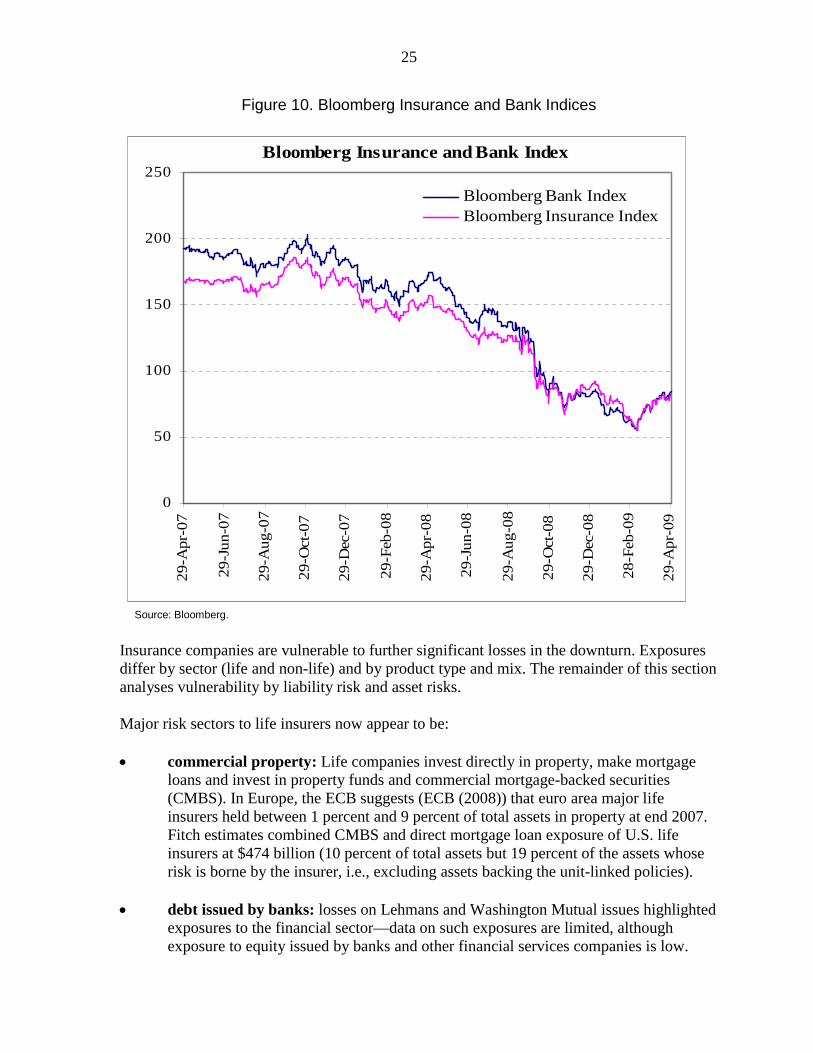
Figure 10. Bloomberg Insurance and Bank Indices
Bloomberg Insurance and Bank Index
0
50
100
150
200
25029
-Apr
-07
29-J
un-0
7
29-A
ug-0
7
29-O
ct-0
7
29-D
ec-0
7
29-F
eb-0
8
29-A
pr-0
8
29-J
un-0
8
29-A
ug-0
8
29-O
ct-0
8
29-D
ec-0
8
28-F
eb-0
9
29-A
pr-0
9
Bloomberg Bank IndexBloomberg Insurance Index
Source: Bloomberg. Insurance companies are vulnerable to further significant losses in the downturn. Exposures differ by sector (life and non-life) and by product type and mix. The remainder of this section analyses vulnerability by liability risk and asset risks. Major risk sectors to life insurers now appear to be: • commercial property: Life companies invest directly in property, make mortgage
loans and invest in property funds and commercial mortgage-backed securities (CMBS). In Europe, the ECB suggests (ECB (2008)) that euro area major life insurers held between 1 percent and 9 percent of total assets in property at end 2007. Fitch estimates combined CMBS and direct mortgage loan exposure of U.S. life insurers at $474 billion (10 percent of total assets but 19 percent of the assets whose risk is borne by the insurer, i.e., excluding assets backing the unit-linked policies).
• debt issued by banks: losses on Lehmans and Washington Mutual issues highlighted
exposures to the financial sector—data on such exposures are limited, although exposure to equity issued by banks and other financial services companies is low.

26
• Deterioration of corporate credit rating. The largest vulnerability of the life sector
is to deterioration in high rated corporate credit. The largest exposures globally are to corporates—in the United States, corporate bonds (including those issued by banks) account for 60 percent of the assets backing policies other than unit-linked. Insurers invest overwhelmingly in higher quality issuers and instruments. In the United States 96 percent of traded and 90 percent of non-traded bonds were investment grade at end-2007. While default losses experienced by U.S. life insurers are already at 2002 levels, the main impact has clearly been from rising spreads.
Liability shocks
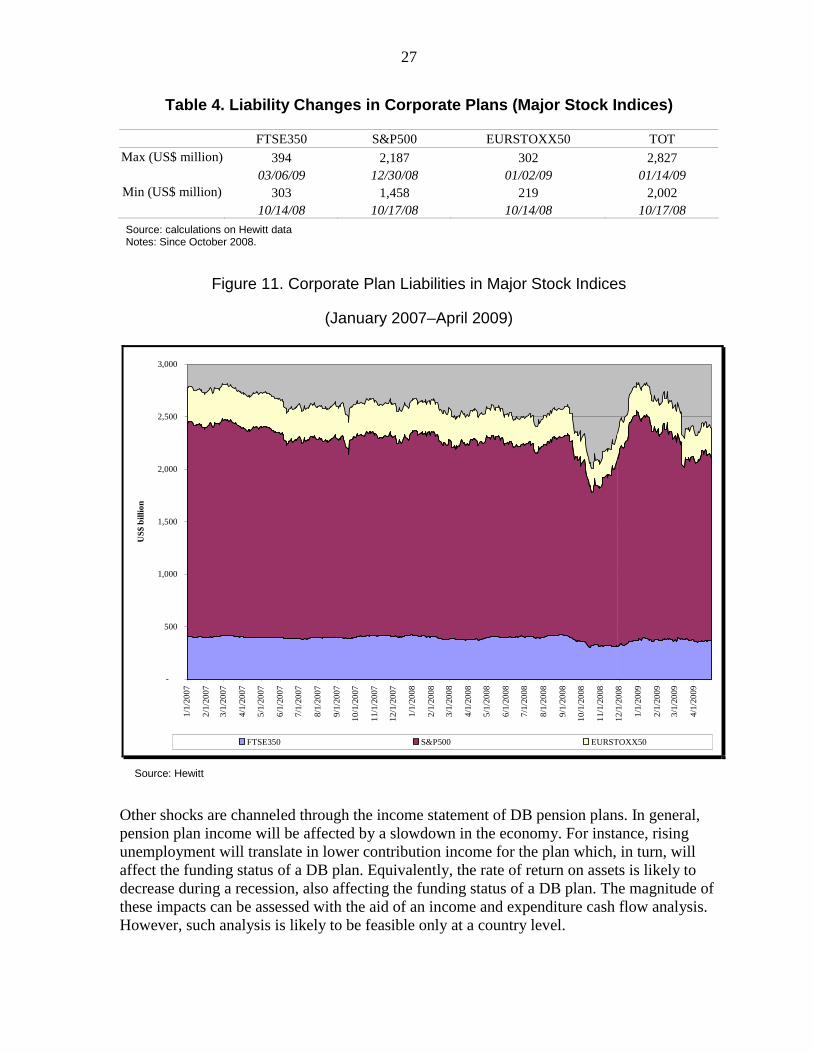
Valuation of DB liabilities is affected by the scope of valuation, the costing methods used for valuation, the term structure of the relevant interest rate used for discounting, and the locally prevailing accounting standards. These are highly heterogeneous both across and within countries. While it is understandable that standards vary across countries, it is disconcerting that standards also vary within countries. This is treated in slightly more details in the section on contagion channels. The value of liabilities for accounting purposes has been affected by the financial crisis. Figure 11 reports the changes in the value of liabilities for accounting purposes17 for pension plans of corporations in major equity indices as a function of the changes in the relevant yield curve. In general, accounting liabilities have dropped in October 2008 as credit markets froze and spreads on corporate debt increased. However, they have rapidly increased since then due to sharp drop in interest rates for all yield curves. For instance, short term U.K. yields decreased by 100–150 bps between August and December 2008 while long term yields decreased by 40–60 bps. As a consequence of yield movements, accounting liabilities of plans in the S&P500 index increased from a minimum of US$1.5 trillion to US$2.2 trillion by the end of 2008. Accounting liabilities of plans in the FTSE350 index increased from a minimum of US$300 billion to US$400 billion by March 2009. Finally, accounting liabilities of plans in the EUR STOXX50 index increased from a minimum of US$220 billion to US$300 billion by January 2009 (Table 4). Overall, liabilities increased by more than US$800 billion over the same period.
17 This method determines the amount of contribution expenses that the sponsor needs to transfer in the plan to fund liabilities. See later for the difference in valuation methods for accounting and solvency purposes.
27
Table 4. Liability Changes in Corporate Plans (Major Stock Indices)
FTSE350 S&P500 EURSTOXX50 TOT Max (US$ million) 394 2,187 302 2,827
03/06/09 12/30/08 01/02/09 01/14/09 Min (US$ million) 303 1,458 219 2,002
10/14/08 10/17/08 10/14/08 10/17/08 Source: calculations on Hewitt data Notes: Since October 2008.
Figure 11. Corporate Plan Liabilities in Major Stock Indices
(January 2007–April 2009)
-
500
1,000
1,500
2,000
2,500
3,000
1/1/
2007
2/1/
2007
3/1/
2007
4/1/
2007
5/1/
2007
6/1/
2007
7/1/
2007
8/1/
2007
9/1/
2007
10/1
/200
7
11/1
/200
7
12/1
/200
7
1/1/
2008
2/1/
2008
3/1/
2008
4/1/
2008
5/1/
2008
6/1/
2008
7/1/
2008
8/1/
2008
9/1/
2008
10/1
/200
8
11/1
/200
8
12/1
/200
8
1/1/
2009
2/1/
2009
3/1/
2009
4/1/
2009
US$
bill
ion
FTSE350 S&P500 EURSTOXX50
Source: Hewitt
Other shocks are channeled through the income statement of DB pension plans. In general, pension plan income will be affected by a slowdown in the economy. For instance, rising unemployment will translate in lower contribution income for the plan which, in turn, will affect the funding status of a DB plan. Equivalently, the rate of return on assets is likely to decrease during a recession, also affecting the funding status of a DB plan. The magnitude of these impacts can be assessed with the aid of an income and expenditure cash flow analysis. However, such analysis is likely to be feasible only at a country level.
28
Life insurance are exposed to lower discount rates on liabilities and increased volatility. Lower market (risk-free) interest rates reduce the rate at which life companies may discount liabilities, many of them longer term. Increased volatility increases the value of guarantees to policyholders, which also has to be reflected in life companies’ reserves. The actual impact and scale of the vulnerability varies considerably in line with the huge diversity of policy types and their variants available in the market. A key underlying development adding to insurance company vulnerability has been a growing involvement in retirement savings. In the United States in particular (but also Canada and Japan), annuity products, including the highly flexible “variable annuity” product common in the United States, have been the key growth area for insurers. In the U.S. reserves relating to annuities (totaling $2.5 trillion) now represent some two thirds of total reserves. To compete with 401(k) plans and other retirement products, insurers offer valuable guarantees—reflecting in part the strong influence on product design which sales staff have tended to exercise in many life insurance markets.18 These guarantees have become more costly to hedge in current market conditions. At many companies, these guarantees are associated with a high degree of equity market exposure. Life companies may also be exposed to worsening policy persistency and other policyholder behavioral effects. Policyholder behavior is a key determinant of risk in life insurance: • Economic downturn tends to lead to worsening persistency of business on the
books—i.e., policyholders in need of cash surrender policies early. Again, the impact of these factors will vary by market and many policies impose significant penalties on early termination.
• More generally, assumptions about policyholder behavior, for example when they
exercise options on policies with guarantees, may break down in a severe downturn.
• New business is likely to decline: it is estimated to have fallen significantly in some countries in 2008 (especially the United Kingdom—down 13 percent, and France—11 percent).
Non-life companies are less exposed. With limited financial liabilities, non-life companies are exposed to market developments mainly through the assets side. Non-life claims should in principle be unaffected by the crisis—and may even fall in line with lower levels of economic activity. Two significant exceptions are: • credit protection, where there are likely to be further losses at the U.S. mortgage
insurance companies and at trade credit insurers—and retail credit insurers; the monoline insurers have largely written down, restructured or commuted their
18 Guarantees typical on VA products include gguaranteed minimum account value or minimum income on annuitization (at a point many years into the future) and guaranteed minimum withdrawal benefits.

29
structured finance exposure but would suffer from any defaults or restructuring of United States municipal debt or project financing where they also have significant outstanding insurance; and
• liability classes such as Directors and Officers insurance (D&O). Estimates of likely
D&O claims resulting from suits against financial instructions have been rising as more actions are brought. Madoff-related losses are likely to generate still more cases. Total insurance sector D&O liabilities are hard to estimate and will take years to materialize. Estimates have been around $12 billion but these are now rising.
Non-life insurers are vulnerable to unexpectedly high insurance claims at the same time as they are suffering investment losses. But it is only in the United States, because of storm-related claims and credit losses in 2008, that major insurance losses have recently been experienced—the ratio of claims and expenses to premium income (the “combined ratio”) rose to as much as 105 percent in 2008 compared with 96 percent in 2007. Insurance rates have been hardening in the classes affected by recent losses, including U.S. property catastrophe and D&O, which will enable insurers (and reinsurers) to recover lost financial strength as well as compensating for reduced new business volume as demand for insurance slows with the wider economic downturn. Insurers have some exposure to liquidity risks, although much less than banks. Insurers have structurally low exposure to liquidity risk—because they are premium funded and claims are made as contracted rather than on demand, and because their assets are predominantly marketable. Insurers are not funded from wholesale money markets. There are, however, exposures from: • collateral calls in derivative business and securities lending (an issue at AIG); • market as opposed to funding liquidity—which is affecting insurance companies
invested in ABSs, for example; and • rising claims: it is possible—as experienced briefly by minor parts of the AIG group
immediately after the rescue—that claims could temporarily overwhelm available liquidity in what would be equivalent to a bank run.
Generally, these risks are moderate but they have tended to receive limited attention in insurance company risk management and the regulatory framework. While many insurers have been affected by reduced flexibility to manage risk and raise new capital, reinsurance markets remain strong. The recent development of insurance-linked securitization markets has helped companies manage risks, including the impact of catastrophes. Market growth has slowed significantly—and life risk securitization (including securitization of the embedded value in life books not recognized for regulatory and accounting purposes) has halted alongside the general fall in ABS markets. Insurers have much reduced access to new capital. However, reinsurance remains readily available.

30
VI. RISK SHARING AND TRANSMISSION CHANNELS TO THE REST OF THE ECONOMY
Contractual savings institutions function as shock absorbers in the economy. Because of the long term nature of liabilities, pension assets (both DB and DC) are totally illiquid for contributors until retirement. Also, sponsors can amortize over several years unfunded liabilities of DB plans. Life companies generally also have assets invested for very long periods, although policyholder access to their savings, other than for pension products, may be easier. In other words, contractual savings absorb financial shocks making the economy more resilient. At the same time, pension plans and insurance companies also have distinct risk sharing properties with the rest of the financial and real sectors. The channels of contagion differ due to either the different institutional/governance structures or the different investment and insurance products provided by insurance companies, DB plans and DC plans. For pension plans, if the objective of the plan is to keep the contribution rate constant, as in a DC plan, then pensions will depend on the future development of the economy. Future economic risks thus have to a considerable extent to be borne by pensioners. On the other extreme, an exogenous replacement rate plan (such as a DB plan), follows the policy to keep benefits constant. The non-stochastic nature of DB pensions might provide insurance against other old-age consumption risks but it means that the risks of adverse changes in the economic environment stay with the contributors (i.e., the younger generation).19 In insurance, as mentioned, policyholders may be fully protected from risk (especially so in non-life insurance but also in life insurance where policies have guarantees) but only to the extent that insurance companies have adequate resources to perform the shock absorbing function.
A. Pensions Four key transmission channels to the real sector and the rest of the financial sector can be identified for DB and DC plans. These are: (1) the impact of surplus volatility of DB plans on the balance sheet of the sponsors; (2) the impact of asset volatility on the balance sheet of households; )3) the financial stability impact of DB and DC plans with implicit or explicit government guarantees on the balance sheet of the government; and (4) the impact on the rest of the financial sector and economy from the plan investing activities. We will briefly discuss these four transmission channels in the rest of this section.
19 Hence, in order to effectively diversify macro risks, pension systems should have a combination of both DB and DC plans. As far as pension system design is concerned, it is in general advantageous to combine funded and PAYG systems, since they have different risk sharing characteristics, with respect to both market risk and political risk. It is probably a good idea to combine a DB component with a DC component so that economic risks can be shared both across and within generations.

31
The impact on the sponsor’s balance sheet DB pension plans transmit shocks to the rest of the economy through the balance sheet of the sponsor. This stems from the endogenous nature of sponsor’s contributions to maintain the financial viability (macro-actuarial fairness) of the plan. The extent to which this takes place will depend on the local valuation rules of assets and liabilities for accounting purposes.20 Valuation rules are highly heterogeneous across countries and this limits comparability of funding ratios. There is no such thing as accepted international standards for the valuation of assets and liabilities of DB pensions and every country has its own. On the liability side, valuation rules are very heterogeneous as shown in Annex I. In addition, jurisdictions have typically at least one standard for funding purposes and one for accounting purposes. The first standard is relevant for the pension regulator that is naturally concerned with the value of accrued benefits if the plan were to be terminated.21 The second standard is relevant to the sponsor as an ongoing enterprise and it includes salary projections22 (although some jurisdictions23 use this method for funding purposes). On the asset side, there is also a great deal of heterogeneity. While there is a tendency to move to marking to market asset values, many jurisdictions (including the United States) are allowed to smooth asset returns under specific circumstances. Indeed, smoothing of asset returns is being re-considered in many jurisdictions as a relief measure to diminish the volatility of sponsors’ contributions. Valuation rules are also heterogeneous within countries, as in the case of the United States. In addition to the difference between valuation for solvency and accounting purposes, valuation of liabilities in the United States change from plan to plan according to the costing methods, the discount factor, and the accounting standard used. • Costing methods: For instance, U.S. corporate plans covered by ERISA typically use
projected unit methods for valuing liabilities (although they can chose for a large set) while government plans typically use the more stringent entry age normal method. This method is more stringent than projected unit credit because it does not “back-load” the employer’s pension expense and thus results in a higher accrued liability at any point in time. Some state plans, and a slightly larger share of local plans, use other costing methods that can produce dramatically different measures of accrued liability. For example, the aggregate cost method, a common alternative, recognizes no unfunded liability.
20 For a discussion of the difference between valuation methods for funding and accounting purposes and for a comparative analysis of funding regimes in select OECD countries, see Pugh (2006) and (2008) and Yermo (2007). 21 This method is often referred to as accrued benefit obligation (ABO) method. 22 This method is often referred to as projected benefit obligation (PBO) method. 23 Spain, for instance.

32
• Discount factors. U.S. corporate plans under the ERISA Act can use a two year average simplified yield curve based on AA corporate bonds of appropriate duration. U.S. Public plans typically use a fixed rate, set on average at 8 percent.
• Accounting standards. Accounting of corporate plans is influenced by the standards set by the Financial Accounting Standard Board (FASB) while accounting of public plans is influenced by the Government Accounting Standard Board (GASB). Both boards are independent advisory with no enforcement duties/capacity but many State laws require compliance with GASB standards. FASB accounting standards (FAS 87) are responsible (Fore (2004) and Gold (2005)) for the excessive investment in equities (on average 60 percent of assets) of U.S. DB plans despite their liabilities having a fixed income nature. Three specific explanations have been put forward for this: (1) actuaries are allowed to assume the long rate of return on DB plan assets; (2) such rate of return does not reflect the risk profile of the investment portfolio and; pension asset volatility is not reflected in the sponsor income statement since returns are smoothed.24
Market based valuation methods lead to procyclical funding ratios and investment behavior by pension funds. The current application of IAS19 (FRS17 in the United Kingdom and FAS87 and SFAS158 in the United States) accounting standards (all based on different forms of market valuation principles) is the subject of much controversy. In addition to the heated debate about the right measure of liabilities (ABO versus PBO) accounting standards based on market valuation principles generate volatility in sponsor’s balance sheet and income statements. In particular, the removal of the smoothing options currently permitted by international accounting standards would cause the sponsor to inject extra contributions into the plan in the bad state of the world and would not necessarily encourage the sponsor to build-up additional funding buffer in the good state of the world. In addition, it could have an adverse impact on DB pension provisions, the application of efficient risk management strategies and could potentially lead to procyclical behavior by pension plans. Funding ratios of corporate plans worsened in the second half of 2008 and beginning of 2009. Figure 12 reports the changes in the funding levels for accounting purposes of pension plans of corporations in major equity indices during the last two years. Funding ratios of corporate plans in the FTSE350 index generally improved until the end of 2008 notwithstanding the large drop in asset values in the second half of 2008. The improvement in accounting funding ratio for pension plans of FTSE350 companies is due to a combination of factors which mainly include: an increase of 60 bps in corporate yields between September and October 2008 and an increase of more than 100 bps in index-linked gilt yields between September and December 2008. However, this trend was reverted in the first 4 months of 2009 when funding ratios for pension plans of FTSE350 companies decreased from 110 to 84 percent by the beginning of March. Instead, funding ratios of corporate plans in the
24 See appendix for a brief summary of the concerns related to FAS 87.

33
S&P500 and in the EUR STOXX50 sharply deteriorated already since the last part of 2008.25 Cumulatively, market volatility in the second half of 2008 and the first month of 2009 lowered funding ratios from a peak of 110 percent to 66 percent between September 2008 and March 2009 (Table 5).26
Table 5. Funding Ratio Changes in Corporate Plans (Major Stock Indices)
FTSE350 S&P500 EURSTOXX50 TOT Max (US$ million) 115 115 103 110
10/14/08 09/20/07 10/14/08 09/20/07 Min (US$ million) 84 61 70 66
03/06/09 03/05/09 03/09/09 03/06/09 Source: Calculations on Hewitt data.
Figure 12. Changes in Accounting Funding Levels of Corporate Plans of Major Stock Indices (January 2007–April 2009)
60
70
80
90
100
110
120
130
1/1/
2007
2/1/
2007
3/1/
2007
4/1/
2007
5/1/
2007
6/1/
2007
7/1/
2007
8/1/
2007
9/1/
2007
10/1
/200
7
11/1
/200
7
12/1
/200
7
1/1/
2008
2/1/
2008
3/1/
2008
4/1/
2008
5/1/
2008
6/1/
2008
7/1/
2008
8/1/
2008
9/1/
2008
10/1
/200
8
11/1
/200
8
12/1
/200
8
1/1/
2009
2/1/
2009
3/1/
2009
4/1/
2009
%
FTSE350 S&P500 EURSTOXX50
25 In the United States this was mainly due to the 170 basis points drop in the 30 year yield driven by the implementation of the zero interest rate policy and quantitative easing by the Fed and by the 65 basis points decline in the long-dated AA corporate bond spread.
26 The sharp asset decline in the United States is given by the above average exposure to equity risk. The average DB plan has an asset allocation of 60 percent in equities, 30 percent in fixed income, and 10 percent in other assets.
34
Source: Hewitt.
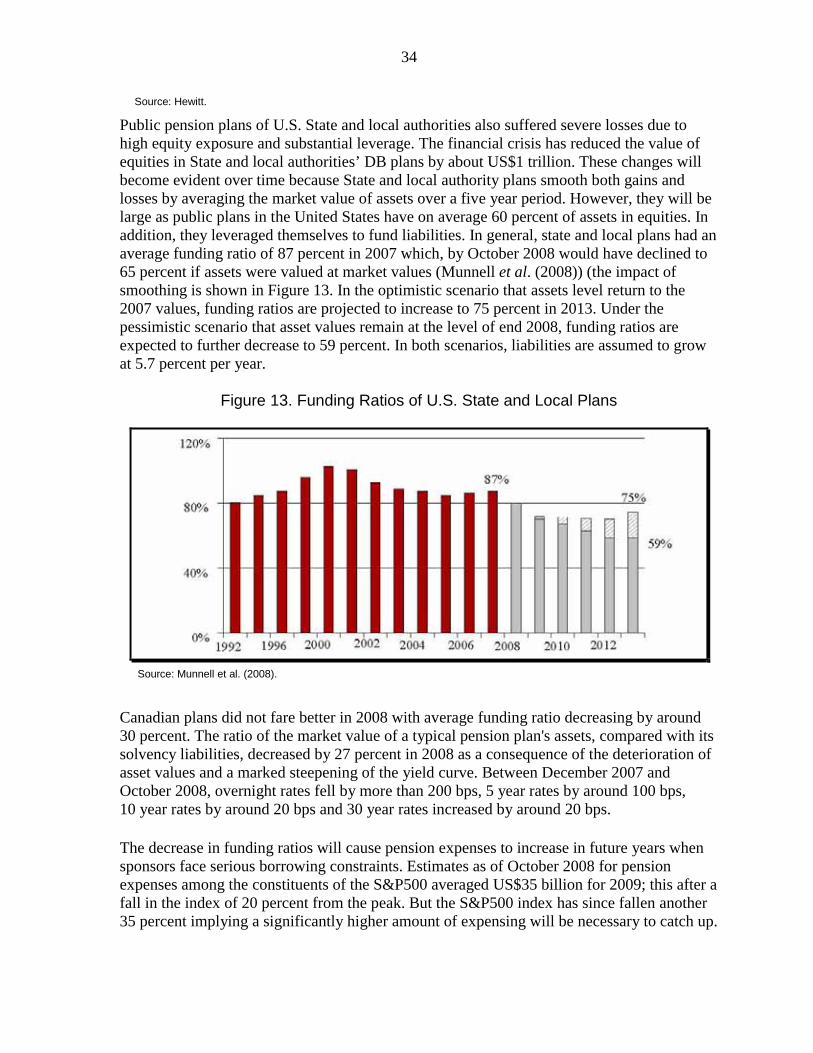
Public pension plans of U.S. State and local authorities also suffered severe losses due to high equity exposure and substantial leverage. The financial crisis has reduced the value of equities in State and local authorities’ DB plans by about US$1 trillion. These changes will become evident over time because State and local authority plans smooth both gains and losses by averaging the market value of assets over a five year period. However, they will be large as public plans in the United States have on average 60 percent of assets in equities. In addition, they leveraged themselves to fund liabilities. In general, state and local plans had an average funding ratio of 87 percent in 2007 which, by October 2008 would have declined to 65 percent if assets were valued at market values (Munnell et al. (2008)) (the impact of smoothing is shown in Figure 13. In the optimistic scenario that assets level return to the 2007 values, funding ratios are projected to increase to 75 percent in 2013. Under the pessimistic scenario that asset values remain at the level of end 2008, funding ratios are expected to further decrease to 59 percent. In both scenarios, liabilities are assumed to grow at 5.7 percent per year.
Figure 13. Funding Ratios of U.S. State and Local Plans
Source: Munnell et al. (2008).
Canadian plans did not fare better in 2008 with average funding ratio decreasing by around 30 percent. The ratio of the market value of a typical pension plan's assets, compared with its solvency liabilities, decreased by 27 percent in 2008 as a consequence of the deterioration of asset values and a marked steepening of the yield curve. Between December 2007 and October 2008, overnight rates fell by more than 200 bps, 5 year rates by around 100 bps, 10 year rates by around 20 bps and 30 year rates increased by around 20 bps. The decrease in funding ratios will cause pension expenses to increase in future years when sponsors face serious borrowing constraints. Estimates as of October 2008 for pension expenses among the constituents of the S&P500 averaged US$35 billion for 2009; this after a fall in the index of 20 percent from the peak. But the S&P500 index has since fallen another 35 percent implying a significantly higher amount of expensing will be necessary to catch up.
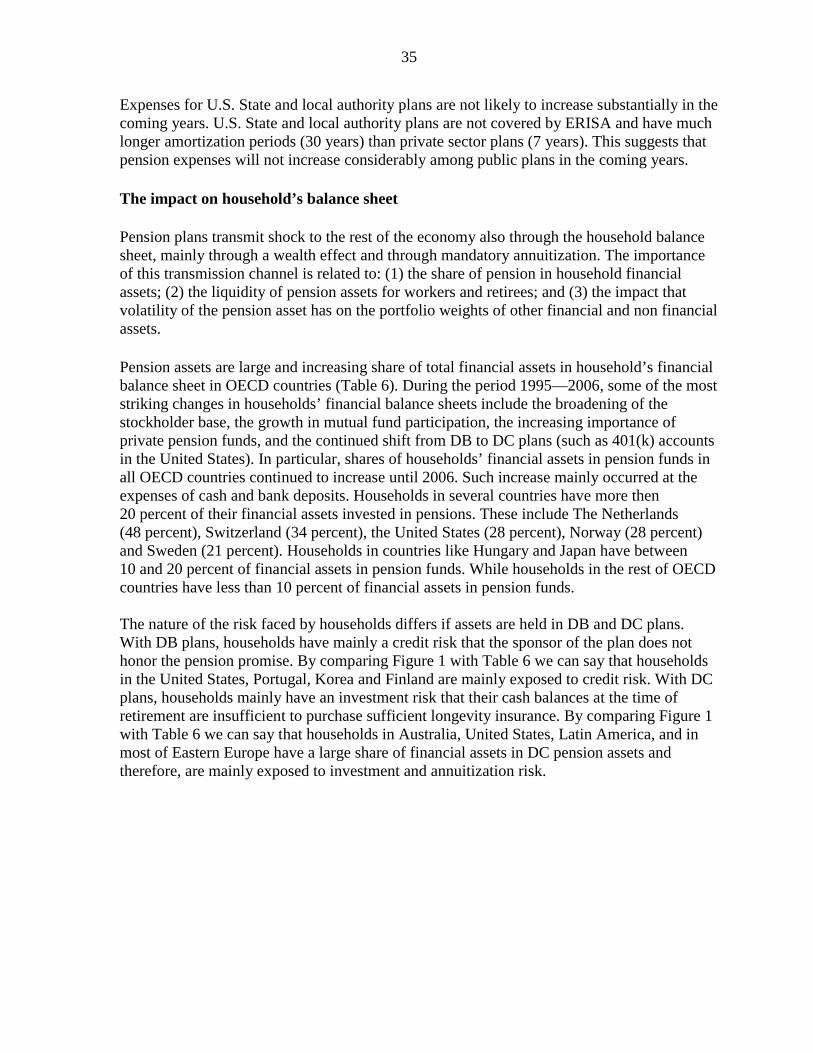
35
Expenses for U.S. State and local authority plans are not likely to increase substantially in the coming years. U.S. State and local authority plans are not covered by ERISA and have much longer amortization periods (30 years) than private sector plans (7 years). This suggests that pension expenses will not increase considerably among public plans in the coming years. The impact on household’s balance sheet Pension plans transmit shock to the rest of the economy also through the household balance sheet, mainly through a wealth effect and through mandatory annuitization. The importance of this transmission channel is related to: (1) the share of pension in household financial assets; (2) the liquidity of pension assets for workers and retirees; and (3) the impact that volatility of the pension asset has on the portfolio weights of other financial and non financial assets. Pension assets are large and increasing share of total financial assets in household’s financial balance sheet in OECD countries (Table 6). During the period 1995—2006, some of the most striking changes in households’ financial balance sheets include the broadening of the stockholder base, the growth in mutual fund participation, the increasing importance of private pension funds, and the continued shift from DB to DC plans (such as 401(k) accounts in the United States). In particular, shares of households’ financial assets in pension funds in all OECD countries continued to increase until 2006. Such increase mainly occurred at the expenses of cash and bank deposits. Households in several countries have more then 20 percent of their financial assets invested in pensions. These include The Netherlands (48 percent), Switzerland (34 percent), the United States (28 percent), Norway (28 percent) and Sweden (21 percent). Households in countries like Hungary and Japan have between 10 and 20 percent of financial assets in pension funds. While households in the rest of OECD countries have less than 10 percent of financial assets in pension funds. The nature of the risk faced by households differs if assets are held in DB and DC plans. With DB plans, households have mainly a credit risk that the sponsor of the plan does not honor the pension promise. By comparing Figure 1 with Table 6 we can say that households in the United States, Portugal, Korea and Finland are mainly exposed to credit risk. With DC plans, households mainly have an investment risk that their cash balances at the time of retirement are insufficient to purchase sufficient longevity insurance. By comparing Figure 1 with Table 6 we can say that households in Australia, United States, Latin America, and in most of Eastern Europe have a large share of financial assets in DC pension assets and therefore, are mainly exposed to investment and annuitization risk.
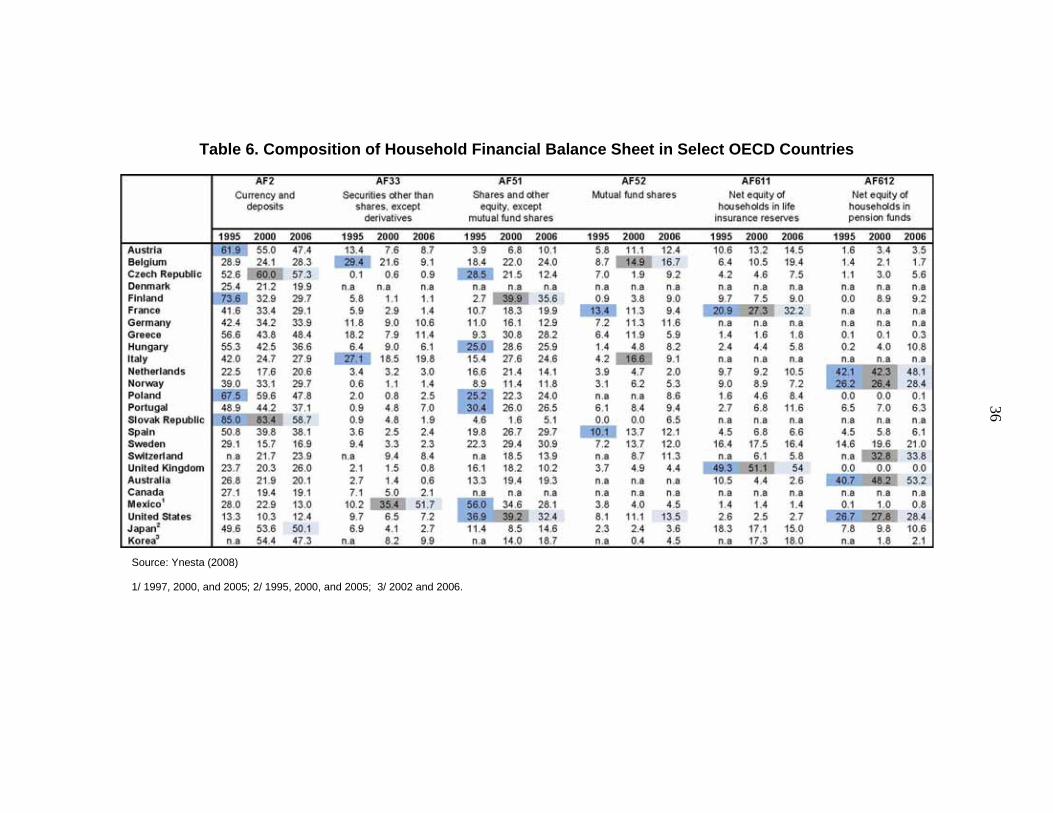
36
Table 6. Composition of Household Financial Balance Sheet in Select OECD Countries
Source: Ynesta (2008) 1/ 1997, 2000, and 2005; 2/ 1995, 2000, and 2005; 3/ 2002 and 2006.
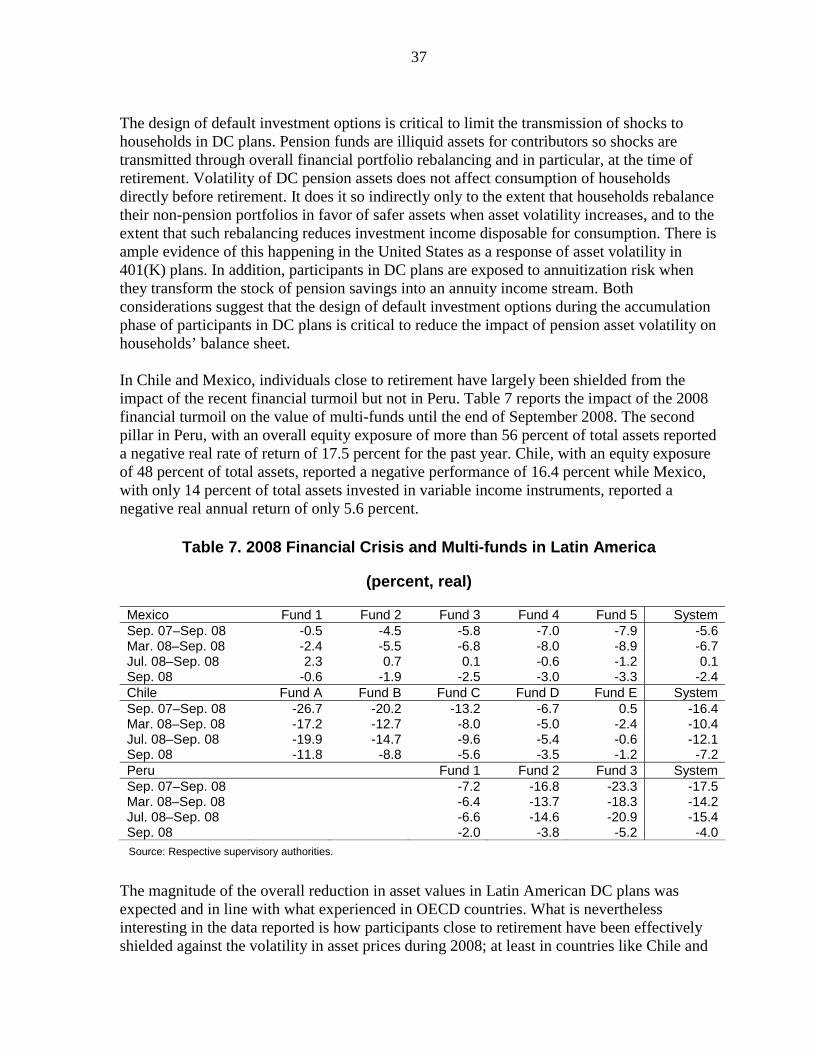
37
The design of default investment options is critical to limit the transmission of shocks to households in DC plans. Pension funds are illiquid assets for contributors so shocks are transmitted through overall financial portfolio rebalancing and in particular, at the time of retirement. Volatility of DC pension assets does not affect consumption of households directly before retirement. It does it so indirectly only to the extent that households rebalance their non-pension portfolios in favor of safer assets when asset volatility increases, and to the extent that such rebalancing reduces investment income disposable for consumption. There is ample evidence of this happening in the United States as a response of asset volatility in 401(K) plans. In addition, participants in DC plans are exposed to annuitization risk when they transform the stock of pension savings into an annuity income stream. Both considerations suggest that the design of default investment options during the accumulation phase of participants in DC plans is critical to reduce the impact of pension asset volatility on households’ balance sheet. In Chile and Mexico, individuals close to retirement have largely been shielded from the impact of the recent financial turmoil but not in Peru. Table 7 reports the impact of the 2008 financial turmoil on the value of multi-funds until the end of September 2008. The second pillar in Peru, with an overall equity exposure of more than 56 percent of total assets reported a negative real rate of return of 17.5 percent for the past year. Chile, with an equity exposure of 48 percent of total assets, reported a negative performance of 16.4 percent while Mexico, with only 14 percent of total assets invested in variable income instruments, reported a negative real annual return of only 5.6 percent.
Table 7. 2008 Financial Crisis and Multi-funds in Latin America
(percent, real)
Mexico Fund 1 Fund 2 Fund 3 Fund 4 Fund 5 SystemSep. 07–Sep. 08 -0.5 -4.5 -5.8 -7.0 -7.9 -5.6Mar. 08–Sep. 08 -2.4 -5.5 -6.8 -8.0 -8.9 -6.7Jul. 08–Sep. 08 2.3 0.7 0.1 -0.6 -1.2 0.1Sep. 08 -0.6 -1.9 -2.5 -3.0 -3.3 -2.4Chile Fund A Fund B Fund C Fund D Fund E SystemSep. 07–Sep. 08 -26.7 -20.2 -13.2 -6.7 0.5 -16.4Mar. 08–Sep. 08 -17.2 -12.7 -8.0 -5.0 -2.4 -10.4Jul. 08–Sep. 08 -19.9 -14.7 -9.6 -5.4 -0.6 -12.1Sep. 08 -11.8 -8.8 -5.6 -3.5 -1.2 -7.2Peru Fund 1 Fund 2 Fund 3 SystemSep. 07–Sep. 08 -7.2 -16.8 -23.3 -17.5Mar. 08–Sep. 08 -6.4 -13.7 -18.3 -14.2Jul. 08–Sep. 08 -6.6 -14.6 -20.9 -15.4Sep. 08 -2.0 -3.8 -5.2 -4.0
Source: Respective supervisory authorities.
The magnitude of the overall reduction in asset values in Latin American DC plans was expected and in line with what experienced in OECD countries. What is nevertheless interesting in the data reported is how participants close to retirement have been effectively shielded against the volatility in asset prices during 2008; at least in countries like Chile and
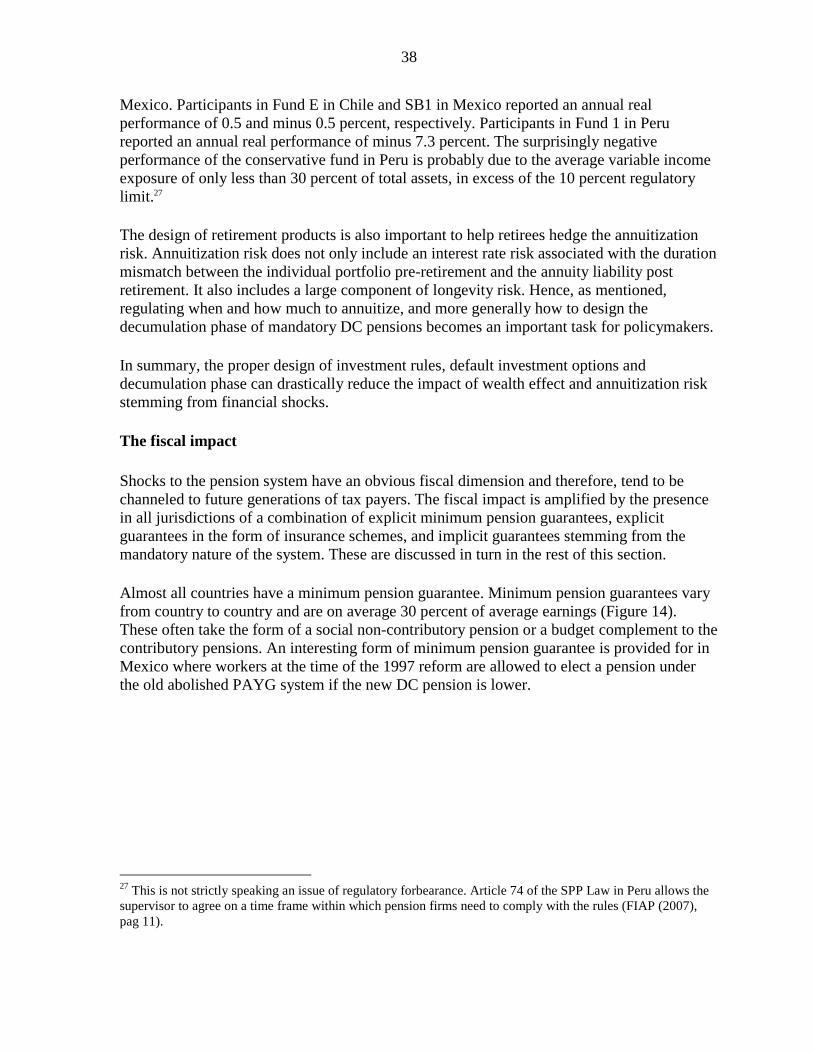
38
Mexico. Participants in Fund E in Chile and SB1 in Mexico reported an annual real performance of 0.5 and minus 0.5 percent, respectively. Participants in Fund 1 in Peru reported an annual real performance of minus 7.3 percent. The surprisingly negative performance of the conservative fund in Peru is probably due to the average variable income exposure of only less than 30 percent of total assets, in excess of the 10 percent regulatory limit.27 The design of retirement products is also important to help retirees hedge the annuitization risk. Annuitization risk does not only include an interest rate risk associated with the duration mismatch between the individual portfolio pre-retirement and the annuity liability post retirement. It also includes a large component of longevity risk. Hence, as mentioned, regulating when and how much to annuitize, and more generally how to design the decumulation phase of mandatory DC pensions becomes an important task for policymakers. In summary, the proper design of investment rules, default investment options and decumulation phase can drastically reduce the impact of wealth effect and annuitization risk stemming from financial shocks. The fiscal impact Shocks to the pension system have an obvious fiscal dimension and therefore, tend to be channeled to future generations of tax payers. The fiscal impact is amplified by the presence in all jurisdictions of a combination of explicit minimum pension guarantees, explicit guarantees in the form of insurance schemes, and implicit guarantees stemming from the mandatory nature of the system. These are discussed in turn in the rest of this section. Almost all countries have a minimum pension guarantee. Minimum pension guarantees vary from country to country and are on average 30 percent of average earnings (Figure 14). These often take the form of a social non-contributory pension or a budget complement to the contributory pensions. An interesting form of minimum pension guarantee is provided for in Mexico where workers at the time of the 1997 reform are allowed to elect a pension under the old abolished PAYG system if the new DC pension is lower.
27 This is not strictly speaking an issue of regulatory forbearance. Article 74 of the SPP Law in Peru allows the supervisor to agree on a time frame within which pension firms need to comply with the rules (FIAP (2007), pag 11).

39
Figure 14. Minimum Pension Guarantees
0 % 1 0 % 2 0 % 3 0 % 4 0 % 5 0 % 6 0 % 7 0 %
E s t o n i aM o r o c c oB u l g a r i a
C o s t a R i c aU r u g u a y
Ir a qS l o v a k i aH u n g a r y
U S AP o la n d
M e x ic oC r o a t i a
P e r uT u r k e y
T u n is i aU K
S p a inF r a n c e
E l S a lv a d o rA l g e r i a
S w i t ze r la n dJ o r d a n
L o u x e m b o u r gE g y p tB r a z il
P o r t u g a lC o l o m b i a
Ir a n
M i n i m u m P e n s i o n ( P e r c e n t A v e r a g e E a r n i n g s )
A v e r a g e
Source: World Bank (2008).

40
The value of minimum pension guarantees is difficult to assess but could be important. Minimum pension guarantees have the general effect of limiting the transmission of shocks from the pension system to the real sector by sharing risks with future generation of taxpayers. In other words, budget can function as an effective intergenerational risk sharing device. While risk sharing with future generations may be desirable (especially in the case of systemic shocks that cannot be effectively shared abroad even in an open economy) this creates a fiscal cost which is often contained even in the event of large shocks by stringent eligibility criteria. In general, we do not know much about the value of these off-balance sheet government items and from a fiscal surveillance perspective surveillance in this area appears warranted. Some countries offer insurance against the loss of assets in private defined-benefit plans due to employer insolvency.28 In case of employer insolvency, guaranteed benefits differ across countries, with the United States, United Kingdom, Sweden, and Germany offering relatively high amounts. The financial crisis has yet to lead to widespread claims on these schemes; however, it is possible that the shock may overwhelm those already in deficit and require government intervention. As a federal corporation, the U.S. Pension Benefit Guarantee Corporation (PBGC) represents a sizeable potential liability to the U.S. federal government, although legislation would be necessary for this liability to be significant. The United Kingdom’s Pension Protection Fund is not explicitly backed by taxpayers, but, should the balance on these schemes deteriorate further, pressures for government financial support may arise. Recent estimates suggest that potential costs to the government arising from deficits of the guarantee funds, as well from contingent liabilities of probable employer bankruptcies, would amount to 0.4 percent of GDP in the United States and 0.1 percent of GDP in the United Kingdom. These costs are likely to increase if the economic conditions deteriorate further (Gillingham et al. (2008)). Finally, governments mandate individuals to participate in the pension system and compulsion is often considered to generate an implicit government guarantee and although a very academic exercise for most countries, one can envisage a scenario where the government needs to bail out the pension system. In order to gauge the fiscal impact of pension system design characteristics and their reforms, a possible indicator worth monitoring (even if not on a high frequency basis) is some form of measure of the implicit pension debt (IPD). This represents a rough indicator of the accrued value the pension system liabilities and it is highly sensitive to the choice of the discount factor, so a range is usually provided. Table 8, reports recent IPD estimates for 35 low and middle income countries. 28 Implemented in 1961, Sweden’s guarantee scheme is the oldest and has been followed by the United States (1974), Germany (1974), Ontario, Canada (1980), Switzerland (1986), Japan (1989), and the United Kingdom (2005). Partly due to low pricing of premiums, weak funding rules, and limited adjustment for plan sponsor risk, guarantee schemes in the United States, the United Kingdom, and Ontario, Canada were in deficit in 2008. For a discussion about these insurance schemes, see Stewart (2007).
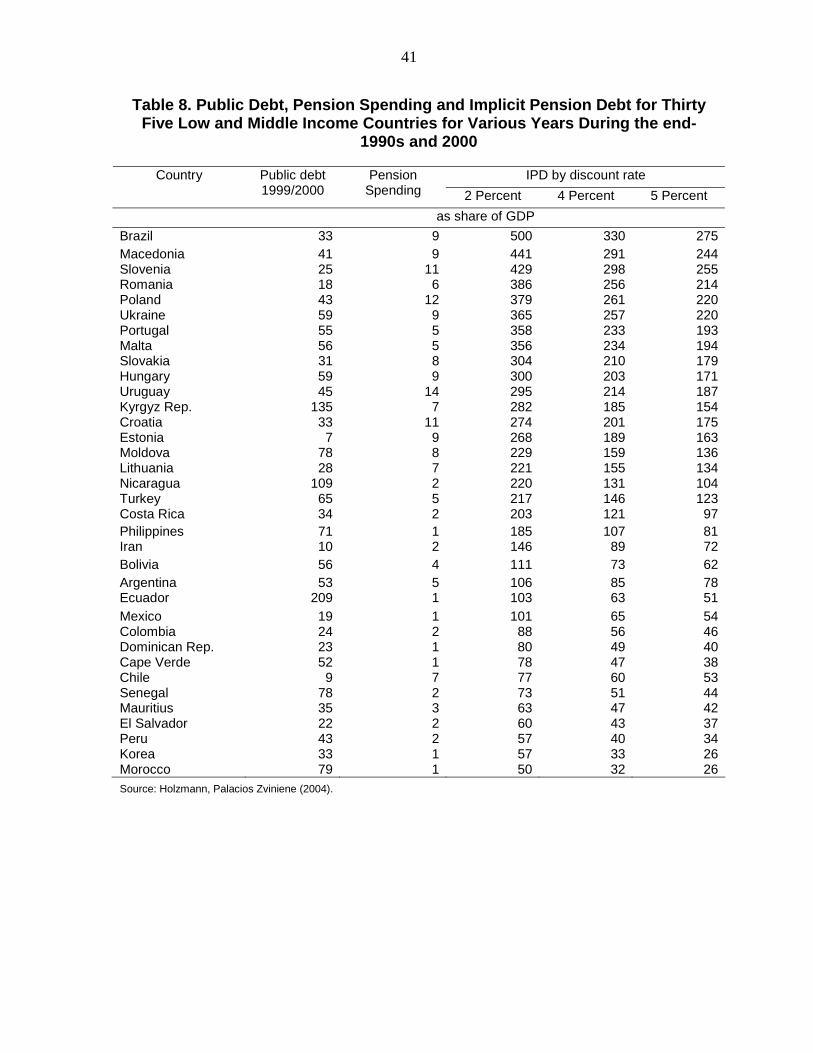
41
Table 8. Public Debt, Pension Spending and Implicit Pension Debt for Thirty Five Low and Middle Income Countries for Various Years During the end-
1990s and 2000
IPD by discount rate Country Public debt 1999/2000
Pension Spending 2 Percent 4 Percent 5 Percent
as share of GDP Brazil 33 9 500 330 275Macedonia 41 9 441 291 244Slovenia 25 11 429 298 255Romania 18 6 386 256 214Poland 43 12 379 261 220Ukraine 59 9 365 257 220Portugal 55 5 358 233 193Malta 56 5 356 234 194Slovakia 31 8 304 210 179Hungary 59 9 300 203 171Uruguay 45 14 295 214 187Kyrgyz Rep. 135 7 282 185 154Croatia 33 11 274 201 175Estonia 7 9 268 189 163Moldova 78 8 229 159 136Lithuania 28 7 221 155 134Nicaragua 109 2 220 131 104Turkey 65 5 217 146 123Costa Rica 34 2 203 121 97Philippines 71 1 185 107 81Iran 10 2 146 89 72Bolivia 56 4 111 73 62Argentina 53 5 106 85 78Ecuador 209 1 103 63 51Mexico 19 1 101 65 54Colombia 24 2 88 56 46Dominican Rep. 23 1 80 49 40Cape Verde 52 1 78 47 38Chile 9 7 77 60 53Senegal 78 2 73 51 44Mauritius 35 3 63 47 42El Salvador 22 2 60 43 37Peru 43 2 57 40 34Korea 33 1 57 33 26Morocco 79 1 50 32 26Source: Holzmann, Palacios Zviniene (2004).

42
The impact of trading patterns of pension plans Finally, pension plans can transmit shocks to the rest of the financial sector through their trading activities. This is especially an issue typical of DC systems with minimum return guarantees in the form of peer benchmarks. Such forms of guarantees are known to produce herding which becomes a concern for overall price stability when assets under management become large. For instance, there is evidence of both contemporaneous and dynamic herding among Chilean pension plans. Contemporaneous herding takes place when all pension funds buy and sell similar assets at the same time while dynamic herding takes place when asset classes bought at any given point in time are also bought in subsequent periods. Evidence of contemporaneous herding is found for all funds in domestic corporate bonds and quotas of domestic and foreign mutual funds. For the other assets, herding seems to occur only among the largest pension funds. Evidence of dynamic herding is found for domestic equities and foreign mutual funds. On average, the economic magnitude of herding is close to the evidence reported for mutual funds in developed countries but is still significantly higher in some asset classes. The high degree of herding can be explained by the fact that different pension funds arrive independently at the same conclusions regarding the optimal timing for trades that maximize long-term welfare of participants or that, most likely, they simply follow each others’ investment strategies. In addition to herding, momentum investment strategies can amplify price volatility. In the case of Chile, plans tend to buy government bonds, former pension system bonds and quotas of foreign mutual funds when lagged returns are positive. Yet, they tend to buy domestic equity when lagged returns are negative; i.e., following a contrarian strategy for this asset class. Possibly this relates to some degree of mean reversion in domestic equities.
B. Insurance Companies Implications for the non-insurance financial sector There are significant linkages between banks and insurers, although much less extensive than between banks. Because insurance companies are funded by premiums they have limited requirements for bank funding and the larger exposure is of insurers to banks (via market securities in the investment portfolio) rather than the reverse. But in complex markets there are other interlinkages, not all of which may be transparent or measurable, as evidenced by the experience of banks’ exposure to the monoline insurers. For example, there may be significant banking sector exposure to insurance groups at the holding company level or above resulting from highly leveraged acquisitions of insurance groups in recent years. Insurance companies and banks may be linked by membership of the same financial services group. Direct links are becoming fewer as banks and insurers divest of direct holdings (most recently Allianz’s disposal of Dresdner Bank) and focus bancassurance models on more flexible shared distribution strategies. Risks in direct links include:
43
• Financial contagions as losses in the insurance entity add to financial strains on the bank or group holding company or erode the confidence of depositors of the bank within the same group.
• Exposure to common management failings such as high risk investment strategies,
particularly in more integrated groups. More generally, assumed diversification benefits of combining banking and insurance, especially life insurance because of the significant market risk in business with guarantees, may prove illusory in stressed market conditions.
• Risk that a bank or insurance company under pressure will look for financial support
to the stronger balance sheet in the other sector. Banks and insurers may have significant cross-sector counterparty exposures on derivatives and complex hedging programs. The problems of the monolines and at AIG (though in the unregulated non-insurance part of the group) exposed large banking sector counterparty exposure to insurers in relation to credit derivatives. More commonly, insurance companies generate counterparty risks as buyers of interest rate and equity derivatives to hedge market risk exposures. In the United States, the complexity of variable annuity products—particularly the guaranteed minimum withdrawal benefits which give policyholder multiple options over extended periods—has stimulated banks and investment banks to structure tailored hedging programs. Insurance companies can transmit shocks via their investment decisions in capital markets. There is evidence from the equity markets fall in 2001–03 that life insurance companies contributed to a downward spiral in markets when limited equity disposals by major insurers seeking to bolster balance sheets led to further declines in the market requiring further disposals to prevent solvency margins from coming under pressure. In the current crisis, sales of equities and other instruments have been more widespread. Capital markets also trade insurance risks, although volumes are small. The growth in recent years of Insurance-Linked Securities (ILS) has widened the exposure of investors (mostly hedge funds and specialist investment vehicles) to insurance risks originated and managed by insurance companies. The amounts are relatively small—$39 billion outstanding at the end of 2007, around half of which was life insurance risks. But the effect is that catastrophic insurance losses can now be transmitted directly to investors without the cushion of the insurance company’s balance sheet. Implications for the real economy There could be serious impacts from insurance company failures. The impact of insurance company problems in the recent past has been less immediate and more indirect than those affecting banks, but insurance crises have also generally been isolated events rather than part of a wider crisis. In the current context, the likely impact of problems is less certain and maybe more severe. The main channels would be via reduced capacity of the economy to manage risk and on household sector confidence. There could also be fiscal implications.

44
Problems in non-life insurance, probably because of investment losses, could affect economic activity directly via loss of risk management capacity. In Australia in 2000-2001, for example, the failure of the HIH removed most capacity in builders’ warranties with a significant impact on construction activity. The likelihood of such disruption is clearly greater where a market is concentrated or the failure affects many firms. But in current market conditions, replenishment of any lost capacity may be harder or slower than normal. The rapid raising of new capital, including from private equity and hedge funds, which followed the $45 billion 2005 Hurricane Katrina losses would be impossible. The impact from life company problems could be more pervasive and long-lasting. The function of life insurance in cushioning policyholders with guarantees from the worst investment losses would be lost with the result that: • policyholders who have so far been protected from the erosion of wealth suffered by
mutual fund investors, unit-linked policyholders and pension plan holders exposed to the same underlying assets but without an insurance company guarantees could suffer sharp reductions in financial wealth;
• annuitants (i.e., those receiving benefits in retirement) would suffer immediate
reductions in their income; • there would be a wider impact on confidence in life insurance: the experience of
2001–3, when there no significant failures but discretionary benefits were severely reduced by many companies, suggest that this could be severe and prolonged; and
• there could be a substitution from insurance, even from existing policies as well as
new business, to other savings markets. This may be especially the case where insurance companies have structured products deliberately to resemble and compete with bank deposits from outside the banking regulatory framework. Even without an insurance company failure, in an environment of low returns there is a risk that insurance products will fail to compete with bank deposits, particularly where deposits are guaranteed by governments.
Estimating the scale of these effects is hard. The amount of household wealth in insurance assets varies by country. OECD data (see Table 6) point to a particular vulnerability in the United Kingdom and France, lesser but significant vulnerability elsewhere in Europe and in Asia but much less vulnerability in the United States. Most affected would be countries where insurance assets are both high and concentrated in products and policies with significant guarantees—the United Kingdom and France. As in banking, much would depend on how crisis were managed. • Many countries have some form of policyholder protection arrangements similar to
deposit insurance, although detailed provisions vary (for example, some countries

45
choose to cover only mandatory insurance classes—third party motor liability insurance policies in particular and not life insurance at all).
• Insurance company resolution procedures are underdeveloped or untested. Regulators in most countries would generally seek to maintain the continuity of existing insurance contracts, so as to avoid policyholders having to replace lost cover in an uncertain market. They would variously seek to take over and manage a failing company or transfer contracts to other companies or provide support through policyholder protection scheme resources, where available to ensure continuity of cover. They would seek to avoid liquidation as far as possible—which is generally regarded as likely to be hugely destructive of policyholder value.
There could also be fiscal impacts. Direct government support in the past for insurance companies has been limited compared with that for banks. But government intervention in insurance markets has been more frequent. In Australia, the government supported insurance provision directly after the HIH failure. In the US, in addition to the AIG support program insurance companies with some federal regulation are eligible for TARP (Troubled Asset Relief Program) funds.
VII. POLICY CONCLUSIONS The recent financial turmoil has generated large losses in both the insurance and pension industries. Large unfunded liabilities have been created in DB plans which will be recognized over the next few years in jurisdictions that use smoothing techniques. Private pensions in OECD countries reported US$4 trillion in losses in asset values in the first 10 months of 2008. Including other private pension assets in voluntary personal plans in the United States (such as IRAs) and in other countries, the loss increases to about US$5 trillion. At the same time, the reduction in yields has increased the valuation of liabilities for accounting purposes, especially in the last months of 2008. Available data for corporate plans in the S&P500, STOXX50 and FTSE350 show that aggregate accounting surpluses have decreased in absolute terms from US$246 billion on September 20, 2007 to minus US$860 billion on March 2, 2009. In relative terms, this equates to a relative change in aggregate funding ratios from 110 percent to 67 percent. Mark-to market losses have been generated in DC plans. Again, the largest impact has taken place in plans with high equity exposure and in aggressive funds. In mandatory DC systems, losses amount to 30–50 percent in aggressive funds and 0–5 percent in conservative funds. Exceptions are countries like Hungary, Peru, Estonia and Lithuania where even conservative funds, designed to protect individuals close to retirement, have a large equity component. Finally, insurance sector and regulation appear to have held up well so far. Regulatory limits on eligible assets appear to have reinforced conservative investment approaches that prevented excessive exposure to ABS. The FSF April 2008 paper on Enhancing Market and Institutional Resilience identified only the regulation of monoline insurers as an area for
46
consideration and improvement. More generally, past concerns about potential insurance sector weakness have not so far materialized—in particular, the reinsurance sector has been robust. However, international discussion of lessons has been increasing in the wake of the AIG events and increased losses due to asset market falls. While we cannot conclude that pension and insurance sectors are in distress comparable to the banking sector, the impact of the financial crisis on the insurance and pension industries has highlighted important policy areas where the Fund should be involved. These include, but are not necessarily limited to: (1) the heterogeneous valuation, funding, accounting and disclosure standards of pension plans and insurance companies; (2) their procyclicality and the need for countercyclical policy responses; (3) the need to help countries monitor the contagion channels to the real and rest of financial sectors, including the fiscal channel; and (4) strengthen group-wise supervision, especially as far as insurance companies are concerned. For instance, minimum funding target rules for DB plans and the trend towards market based valuation methods amplify the contagion of shocks to the real sector by requiring sponsors to meet targets in a procyclical and volatile fashion. This suggests that shocks should be offset, as it happened in the past, by countercyclical policy responses which relax regulatory requirements without endangering the long term viability of the pension plan. For DC plans, asset shocks are transmitted to the real sector through two main channels: (1) a wealth effect for all cohorts; and (2) an annuitization risk for the retiring cohort. With the first channels, asset volatility, encourages workers to rebalance their non-pension financial assets and impacts aggregate savings and consumption. In additions, shocks are amplified by the herding behavior of pension plans, the market based valuation methods of assets and by the high frequency disclosure needed for promoting healthy competition. With the second channel, retirees are exposed to volatility in the purchasing power of their cash balances just before retirement. This suggests that increasing attention should be given to policies aimed at finding a reasonable compromise between information disclosure and frequency of asset valuation on one hand, and the wealth effect on the other hand. In addition, specific policies aimed at reducing annuitization risk could be pursued. These could include: (1) re-evaluating the design of default investment options; (2) introducing regulatory requirements for investing cash balances in long term bonds and/or deferred annuities towards retirement; and (3) revisiting the role for life-time minimum rate of return guarantees. Finally, contagion to the real sector is provided by the fiscal channel. Governments systematically provide minimum pension guarantees, they often require insurance of defined benefits, they have an implicit liability associated to the mandatory nature of pension systems and provide some form of policyholder protection arrangements. The fiscal impact of the current financial turmoil related to pension and insurance is not known in a systematic way across countries. This is mainly due to the very heterogeneous system of government guarantees, safety nets and eligibility rules. Regarding pensions, recent estimates for the United States and the United Kingdom suggest that potential costs to the government arising from deficits of their guarantee funds, as well from contingent liabilities of probable employer bankruptcies, would amount to 0.4 percent of GDP in the United States and

47
0.1 percent of GDP in the United Kingdom. Regarding insurance the same applies and the fiscal impact would depend on how the crisis were managed. These costs are likely to increase if the economic conditions deteriorate further. For insurance companies, risk transfer from other regulated sectors has been an issue. The credit risk transfers from banks to insurers (specifically the monolines and AIG), far exceeded the capacity of the insurance regulatory framework to capture the risks. While insurance regulation cannot work on its own in this regard —and should continue mainly to address risks in the insurance business model—it should also cater for concentrations of banking-type risks, through both appropriate rules and effective supervision.
Unsupervised risk transfers from other regulated sectors has highlighted the need to strengthen group supervision. Insurance regulation continues to be influenced by the traditional focus on the solo company. This has served regulators well in recent events—at AIG, the solo entities have been found to be relatively strong, although significant losses on securities lending were incurred in the regulated insurance entities. But there has not always been sufficient focus on risks to the insurance companies from activities elsewhere in the group—the holding company, banking and unregulated parts of the group. Insurance regulators should at least assess group risks and undertake full consolidated supervision where taking the group lead supervisor role. Finally, international solvency standards for the insurance sector could also be reviewed. Only in Europe, with the Solvency II directive, is there a prospect of international standards akin to Basel II in the foreseeable future. Because there is no standard, there is also no common language for measuring, analyzing and comparing insurer financial strength—other than ratings. The crisis has sharpened appreciation of the additional transparency which such a standard might bring. As in banking, there is a also need to consider potentially procyclical elements of insurance financial regulation—for example in stress-based or claims-based solvency and reserving requirements; and to address unnecessary incentives for cross-sectoral regulatory arbitrage. In particular, there is a need to revisit the resolution and crisis management framework for insurance. This would include reviewing powers to intervene and the circumstances in which access to central banks or government bailout could be made available. Regulators should be clear on the impact of failures. Crisis readiness should be viewed within the IAIS requirements (and so FSAPs) as one of the preconditions to effective supervision. There is also a need to revisit the desirability of supervising large insurance groups more similarly to major banking groups. The same tools could apply: colleges of regulators to focus international information-sharing and coordination of regulation; effective consolidated supervision, global reporting and stress testing etc. Finally, there is a need to include major insurance groups in any new macroprudential framework. This may mean, for example, aligning insurance company reporting requirements and supervision with the need for authorities to monitor overall financial conditions in the economy, including trends in leverage; more sharing of information and

48
analysis with central banks, including of insurers in system wide stress testing, and an increased focus on regulatory arbitrage involving insurers.

49
REFERENCES
Bailliu, J. and H. Reisen, 2000, Do Funded Pensions Contribute to Higher Aggregate Savings? A Cross-country Analysis, in H. Reisen Pensions, Savings and Capital Flows— From Ageing to Emerging Markets, OECD, pp. 113-131.
Blake, D., A.J.C. Cairns and K. Dowd, 2006, Living with Mortality.
Coronado, J., O.S. Mitchell, S.A. Sharpe and S.B. Nesbitt, 2008, Footnotes aren’t enough: the impact of pension accounting on stock values. Journal of pension economics and finance: 7(3): 257-276.
Das, U., N. Davies and R. Podpiera, 2003, Insurance and Issues in Financial Soundness, IMF
Working Paper No. 03/138, July, (Washington: International Monetary Fund). Demirguc-Kunt, A., and R. Levine, 1996, Stock Markets, Corporate Finance, and Economic
Growth: An Overview, The World Bank Economic Review, Vol. 10, No 2. Demirguc-Kunt, A., and R. Levine, 1999, Bank-Based and Market-Based Financial Systems:
Cross-Country Comparisons, World Bank Policy Working Paper No. 2143. Draghi, M., F. Giavazzi and R.C. Merton, 2003, Transparency, risk management and
international financial fragility. Financial Stability Review, Bank of England. European Central Bank, 2008, Financial Stability Review, ECB, December.
Evans, J., M. Orszag and J. Piggott (eds), 2008, Pension Fund Governance: a Global Perspective on Financial Regulation (Edward Elgar Publishing).
Fore, D., 2004, Changes in Accounting Practices Will Drive Pension Paradigm Shift. Pension
Research Council Working Paper PRC WP 2004-8. Gillingham, R., A. Leive, and A. Tuladhar (2008) Fiscal Implications of the Financial Crisis:
Effects Through the Pension System. Mimeo. Gold, J., 2005, Accounting/actuarial bias enables equity investment by defined benefit plans.
North American Actuarial Journal: 1-25. Holzmann, R., R. Palacios and A. Zviniene, 2004, Implicit Pension Debt: Issues,
Measurement and Scope in International Perspective. WB Social protection WP 0403. International Association of Insurance Supervisors, 2008, Global Reinsurance Market
Report, 2007, International Association of Insurance Supervisors, December 2008. Impavido, G., 2008, Efficiency and Performance of Bulgarian Pension Funds. IMF Working
Paper 08/268 (Washington: International Monetary Fund).
50
Impavido, G., A.R. Musalem and T. Tressel, 2002a Contractual savings and firms’ financing choices. In S. Devarajan and F. H. Rogers eds.: World Bank Economists’ Forum. Volume II (World Bank, Washington D.C.)
———, 2002b, Contractual Savings Institutions and Banks’ Stability and Efficiency. World
Bank Policy Research Working Paper 2751. Impavido, G., C. Thorburn and M. Wadsworth, 2004, A Conceptual Framework for
Retirement Products: Risk Sharing Arrangements Between Providers and Retirees. World Bank Policy Research Working Paper 3208.
Impavido, G., E. Lasagabaster and M. García-Huitron, 2009, Competition and Strategic Asset
Allocation Policies for Mandatory DC Pensions: New Policy Directions. Mimeo. International Monetary Fund, 2009, Global Financial Stability Report, April.
Levine, R., and S. Zervos, 1996, Stock Market Development and Long-Run Growth, The World Bank Economic Review, Vol 10, No 2.
Lindbeck, A. and M. Persson. 2004. The Gains from Pension Reform. Journal of Economic
Literature. Vol. XLI (March 2003) pp. 74–112. Munnell A.H., J.P. Aubry and D. Muldoon, 2008, The Financial Crisis and State/Local
Defined Benefit Plans. Center for Retirement Research at Boston College. November, Number 8–19.
Musalem, A.R. and R. Palacios (eds), 2004, Public Pension Fund Management. World Bank
publication. Neusser and Kugler, 1998, Manufacturing Growth and Financial Development: Evidence
from OECD Countries, Review of Economics and Statistics, 80, 638-646. Organization for Economic Cooperation and Development, 2008a, Private Pensions and the
2008 Turmoil in Financial Markets. ———, 2008b, Pension market in focus. Issue 5, December 2008.
Pugh, C., 2006, Funding Rules and Actuarial Methods. OECD Working Papers on Insurance and Private Pensions, No. 1.
———, 2008, Comparative Funding Regimes. Paper for the Ontario Expert Commission on
Pensions. Pugh, C. and J. Yermo, 2008, Funding Regulations and Risk Sharing, OECD Working
Papers on Insurance and Private Pensions, No. 17.

51
Rocha, R. and C. Thorburn, 2008, Developing Annuity Markets. The experience of Chile. World Bank publication.
Samwick, A., 1998, Is Pension Reform Conducive to Higher Saving? Paper presented at the
World Bank Saving Workshop, September 1998. Stewart, F., 2007, Benefit Security Pension Fund Guarantee Schemes, OECD Working
Papers on Insurance and Private Pensions, No. 5. Swiss Re, 2008, Global insurance review 2008 and outlook 2009: Weathering the Storm,
Swiss Reinsurance Company Special Report, December 2008. World Bank, 2007, Upgrading the Governance and Investment Process of the Social
Insurance Fund of Cyprus. World Bank Technical Assistance Report. World Bank, 2008, The Financial Crisis and Mandatory Pension Systems in Developing
Countries. World Bank Social Protection Note. Whitehouse, E., 2007, Pensions Panorama. World Bank publication. Yermo, J., 2007, Reforming the Valuation and Funding of Pension Promises: are
Occupational pension Plans Safer?, OECD Working Papers on Insurance and Private Pensions, No. 13.
Ynesta, I., 2008, Household wealth composition across OECD countries. In OECD (2008)
Financial Market Trends.

52
ANNEX I
Table 9. Liability Valuation Rules in Select OECD Countries

53

54
Source: Pugh and Yermo (2008).

55
ANNEX II
A “SIMPLER” PRESENTATION OF FAS 87
In the United States, accounting standards for DB pension funds make it problematic to assess performance of sponsor companies. FAS 87, introduced in 1986, standardized actuarial assumptions for valuing pension liabilities and defined a new way for reporting pension assets and liabilities on the balance sheet of the sponsor and pension expenses on the income statement of the sponsor.29
A. Balance Sheet
FAS 87 directs public companies in the United States to report only the net difference between the pension assets and liabilities as a corporate asset or liability. This is contrary to a more transparent principle that would require reporting the gross assets and gross liabilities as two separate items. The accounting treatment of a DB pension plan is not very different from the treatment of an off-balance sheet log-term swap derivative contract in which the company receives the total return on the pension asset portfolio and pays a fixed rate of interest in return applied to a notional amount equal to pension liabilities.
B. Income Statement
The surplus income (loss) from the DB plan can be accounted for as operating income (loss) for the sponsor in excess of what is needed to match the increase in plan liabilities. Such excess can be credited as an intangible asset called “prepaid benefit expenses” and sponsor’s shareholders can draw on this intangible asset to top up the company’s net income. This intangible asset is not credited to the plan assets. How is this excess return calculated? The measure of the pension expense reflected in the income statement of the sponsor is called “net periodic pension cost” (NPPC) and is calculated as the annual accrued costs of the pension plan (essentially the present value minus the “expected return on the plan assets”. This is calculated as the product of: (1) the assumed (by the actuary) long-run rate of return on the plan assets (and typically different30 from the rate used to discount liabilities); and (2) the “market related value” (MRV) which can be either (2a) the fair market value of assets or (2b) a 5-year moving average of the true market value. Since the assumed return is not risk adjusted, FAS 87 guides the actuary to ignore the risk profile of the underlying portfolio when assuming the expected return on
29 This appendix has a mere illustrative purpose to provide a sense of the financial stability concern related to the relationship between U.S. corporates and NBFI institutions like DB plans. It a summary of Draghi et al. (2003), Coronado et al. (2008) and Fore (2004) and it is not representative of the many treatments of the same the subject.
30 The average plan in the United States uses 9 percent as expected return on assets and uses 7 percent to discount liabilities.

56
assets. As a consequence of all this, the actual return on pension plan assets does not show through the sponsor’s financial statement.31
31 This is considered the principal cause of the equity bias (60 percent on average) of U.S. DB pension plans (Fore (2004) and Gold (2005)).