how teens use media - nmprevention.org · how teens use media a nielsen report on the myths and...
TRANSCRIPT
How teens use…
TV, Online and Mobile Video
Internet
Mobile Phones
Games
Movies
Music
Advertising
INSIDE:
June 2009
How Teens Use MediaA Nielsen report on the myths and realities of teen media trends
1
Teens watch less online video than most adults, but the ads are highly engaging to them: Teens spend 35% less time watching online video than adults 25–34, but recall ads better when watching TV shows online than they do on television.
Teens read newspapers, listen to the radio and even like advertising more than most: Teens who recall TV ads are 44% more likely to say they liked the ad.
Teens play video games, but are as excited about play-along music games and car-racing games as they are about violent ones: Just two of their top five most-anticipated games since 2005 are rated “Mature.”
Teens’ favorite TV shows, top websites and genre preferences across media are mostly the same as those of their parents: For U.S. teens, American Idol was the top show in 2008, Google the top website and general dramas are a preferred TV genre for teens around the world.
Ephebiphobia is the irrational fear of youth, rooted in the Greek “ephebos” for youth, and “phobos,” for, well, phobia. While the term was coined just 15 years ago, a curiosity and mystique around youth and their behavior has long been a cultural obsession. Consider these Newsweek covers over the decades: “Let’s Face It: Our Teenagers Are Out of Control” in 1954; “The Teenagers: A Survey of What They’re Really Like” in 1966; “The Secret Life of Teens” in 1999 and “Why Teens Do Stupid Things” in 2006, reflecting society’s long-held view that teens are downright troublesome—or a form of alien life.
In media and marketing, ephebiphobia shows up in the constant and frenetic quest to understand how teens use media, made murky by assumptions that teens somehow behave radically differently than their parents and other consumers.
We sometimes fall prey to the notion that teen habits are changing so quickly and dramatically that they run counter to broader cultural trends, are unknowable and unmeasurable, constantly evading our understanding and engagement.
The fact is, teens are unique, but they are not as bizarre and outlying as some might presume. Sure, they are the digital natives, super-communicators and multi-taskers we hear so much about, but they are also the TV viewers, newspaper readers and radio listeners that some assume they are not. What we have found, across a variety of studies, is that teens embrace new media not at the cost of traditional media, but in supplement to it. Taken on whole, teens exhibit media habits that are more similar to the total population than not.
Globally, there are more than 1.2 billion people ages 10–19, according to the U.S. Census. Of those, there are about 33 million teenagers ages 13–19 in the United States. Beyond sheer mass, this demo-graphic wields tremendous influence—on their peers, their parents and the culture at large. As well, the formative nature of their years has implications for everything from consumer packaged goods marketing to the democratic process.
Understanding the reality of how teens use media is critical—not just for business, but for civic, cultural and social pursuits. This paper examines teens in the U.S. and in many of the international markets that Nielsen measures. Our findings challenge a whole host of assumptions about the media habits of this generation—offering a few surprises as we separate myth from reality.
Executive SummaryIt’s easy to get caught up in the hype around teenagers. The notion that teens are too busy texting and Twittering to be engaged with traditional media is excit-ing, but false.
To develop the best strategy around teens and media, start by challenging popular assumptions about teens. Don’t focus on the outliers, but on the macro-level trends of media and preferences for the segment. The averages will show you that teens can often be reached by the same means as their parents.
In this report, “How Teens Use Media,” we debunk the myths and give you the hard facts.
Teens are NOT abandoning TV for new media: In fact, they watch more TV than ever, up 6% over the past five years in the U.S.
Teens love the Internet…but spend far less time browsing than adults: Teens spend 11 hours and 32 minutes per month online—far below the average of 29 hours and 15 minutes.
Introduction
In a word, teens are “normal.”
It’s true: the media universe is expanding for teens. Social networks play an in-creasingly important role (about half of U.S. teens use Facebook) and now many teens access the Web over their phones (37% in the U.S.) Teens time-shift video with DVRs and they place-shift on their video MP3 players. Yet teens are not unique in this media revolution. The media experience has evolved and cross-platform engagement will be criti-cal to reaching all consumers, not just teens. Media innovations have impacted everyone’s experience—not just the High School Musical set.
So don’t reconfigure the playbook. Discard the assumption that, as a rule, teens are “alien” and plan for them as you would any demographic segment—with careful attention and calculus, not panic. Keep your eye on the averages, keep your head on your shoulders, and before you rewire your system, remind yourself: Teens are people, too.

2
Of course there is no “typical” teen-age consumer, just as really there is no typical consumer overall. The segmented behavior of extreme teen users, teens of different races or genders and teens in different regions, internationally and domestically, is poorly represented by averages. But what averages conceal in variation, they make up for it in perspec-tive. A summary view of media behavior is particularly useful when examining teens, since you may know or envision outliers of this segment and mistake their behavior as representative.
A Day in the LifeFirst, let’s look at a snapshot of how a typical teen might spend a media day, based on a variety of Nielsen sources:
Video consumption, led by TV viewing, is the centerpiece of teen media consumption.
Figure 1: A Day In The Life^
Media Consumption of a Typical U.S. Teenager as measured by Nielsen
TV 3 hours,
20 minutes
PC 52 minutes including
applications
Mobile Voice 6 minutes
Video on an MP3 Player
1 in 4 watched
DVR 8 minutes
Internet 23 minutes
Text-Messages 96 sent or received
Audio-Only MP3 Player
1 in 2 used
DVD 17 minutes
Online video If they watched,
watched 6 minutes
Mobile video If they watched, watched for 13
minutes
Newspaper 1 in 4 read
Console Gaming 25 minutes
PC Games 1 in 10 played,
today
Mobile Web 1 in 3 used
Movie Theater Went once in the
past 5 weeks
^For directional purposes only, this table estimates daily U.S. teen media use across a variety of platforms based on a range of Nielsen sources from 2008 and Q1 2009. Details of these estimates are contained in the body of this paper.Source: The Nielsen Company
More Focused Than You ThinkMyth: Teens use media—10 screens at a time
Reality: Teens are more likely than adults to use their media one at a time
Popular opinion is that teen media consumers are constantly surrounded by multiple media, but the image of the “typical” teen listening to an iPod, watch-ing TV, texting and browsing the Internet all at the same time, it turns out, is grossly misrepresentative.
In 2007, Ball State University’s Center for Media Design conducted an obser-vational study of teen media use, “High
School Media Too,” (2007). In the study, researchers found that 23% of the media time among observed teens was concur-rent media exposure, where two or more media were in simultaneous use. Put dif-ferently, 77% of the time observed, teens were consuming media they were using just one at a time.
This level of concurrent use is lower than Ball State researchers saw in older media consumers in the now famous Middletown Media Studies research, also a product of the Center for Media Design. There, 31% of adult media time was concurrent exposure.
While teens do multi-task in their media experience, their concurrent behavior may actually be lower than it is among adults. The myth that concurrent exposure is the norm, for teens in particular, sets an important framework as we explore the breadth of the teen media experience.

3
The most popular genres for U.S. teens are Evening Animation, Participation/Variety and General Drama. Family Guy and American Dad drive the animation category, while the huge popularity of American Idol, the top U.S. show for teens in 2008, has everything to do with Participation/Variety’s performance. Idol was the top U.S. program among teens in 2008—as it was for everyone else.
Video: Boob Tube or YouTube?Myth: Teens are abandoning TV for new media
Reality: Wrong. They’re watching more TV than ever
Hands down, television is still the dominant medium of choice for teenagers. Nielsen’s most recent A2M2 Three Screen Report showed that the typical teen tele-vision viewer watched 104:24 (hh:mm) of television per month in the first quarter of 2009. While less than the average for all television viewers (153:27), it tops Nielsen estimates of teen Internet use over the course of a month (11:32).
Figure 2: Daily U.S. Teen (12–17) Television Viewing—2003–2008
Figure 3: Share of Teen (12–17) Video Minutes—TV and Online, Nielsen Convergence Panel—Q4 2008
The evidence that TV wins any day of the week is stark: Nielsen’s Convergence Panel, which looks at both the TV viewing and online behavior of panelists, showed that in Q4 2008, 92% of teen viewing was live TV, 5% was DVR and 3% was online video streaming.
In the U.S., there’s been a slight shift in teen TV viewing from broadcast to ad-supported cable. In 2003, there were 19 broadcast TV programs with a teen AA% (“rating,” or percent of teens watching during the average minute) of 4.0 or greater. In 2008 there were just two. In 2003, four of the top five televi-sion networks for teens were broadcast networks (FOX, WB, UPN, Disney, NBC), but in 2008 FOX was the only broadcast network to remain in that lineup (even with the merger of WB and UPN to CW). In 2008, the top U.S. networks for teens in terms of AA% were FOX, Nick-At-Nite, Nickelodeon, Disney and Adult Swim.
Source: The Nielsen Company
Source: The Nielsen Company NPOWER, 2003–2008

4
On a self-reported basis, 73% of teens who use DVRs say they “always” skip commercials, though it is likely they are exaggerating. In the same survey, 69% of total DVR users said they too always skip commercials, but a Nielsen metered analysis of 2008 DVR viewing determined that the typical DVR user actually watches about 40% of the commercials.
At 17 minutes per day, teens average about the same amount of DVD viewing as the overall TV audience (which aver-aged 16 minutes of DVD viewing per day in 2008). Teens still buy DVDs, the typical
TV Makes the World Go RoundMyth: U.S. teens are the world’s couch potatoes
Reality: Far from true…South Africans and Indonesians take the prize
Compared to teens in other markets where TV viewing is measured electronically by Nielsen, U.S. teens actually watch less television per day than most. In South Africa, teens averaged more than five hours per day of TV viewing. In Taiwan, teens averaged just two hours and 47 minutes.
In terms of genre, Reality or Participation/Variety programs are universally appeal-ing to teenagers across the markets we measure, while Sports and Information (news) are almost universally absent among the top three rated genres. Drama, in the form of general drama, soap operas and Telenovelas, tends to be more popular with teen viewers than comedy on a global basis.
DVR: To Timeshift—Or Not?Myth: Avid commercial skippers, teens favor the DVR
Reality: Teens prefer their TV live
Thirty-five percent of U.S. teens had a DVR in their household as of May 2009, comparable to total U.S. penetration (32%). Yet even for DVR-owning teens, just a small percentage of total TV viewing is time-shifted.
Of those teens with a DVR, 41% say they record at least one program a day (compared to 54% of total TV viewers). The typical U.S. teen watched about eight minutes of DVR playback per day in 2008, less than the U.S. average of about 12 minutes.
Teens watch more commercials, even when time shifting, than you might think.
Figure 4: Daily Teen TV Viewing by Market—2008
U.S. teens actually watch less television per day than most.
U.S. teenager purchased more than eight DVDs in 2008, but rental services are popular in teen households: in 2008, 40% of teen households said their home sub-scribed to at least one video rental service, compared to 25% of the total population.
Beyond the television set, teens are in-creasingly watching video on the “second” and “third” screens of online and mobile, a growth of the video experience that will drive greater reach and frequency for marketers while expanding the teen engagement opportunity.
Source: The Nielsen Company Note: teen age range varies in some markets.

5
popular source for online video. Second in popularity, “Search Engines/Portals & Communities—Member” (member pages) had 3.5 million teen viewers in May 2009, driven by the success of Fox Interactive Media’s MySpace video audience of 2.4 million teens, and Facebook, with a video audience of 1.5 million.
What’s more, teen online video fare is not limited to user-generated content. “Enter-tainment—Videos/Movies” also includes Hulu, the increasingly popular online video library which allows teens to catch up on favorite shows from NBC, FOX, ABC and other networks. Hulu was the sixth most popular destination for online video among teens and second most popular in terms of minutes of use. “Entertainment-Broadcast Media” includes broadcaster
Online VideoMyth: Teens are driving the growth of online video
Reality: They watch less online video than their elders
Twelve million U.S. teens, or about two-thirds of those online, watched online video in May 2009. It’s clear that online video is becoming an important part of the overall teen viewing experience. Year over year, the audience grew 10% and the average number of minutes increased a stunning 79%: to three hours and six minutes per month. Torrid growth, yes, but the average teen still lags behind viewing of adults 18–24, adults 25–32 and adults 35–44.
As with Internet access at large, discussed in more detail later in this paper, the gap between teen and adult time spent is less an indication of lackluster interest and more a function of access. Unlike adults, many of whom spend hours of the work day with a broadband Internet connec-tion, much of a teen’s waking moments are spent in the classroom, at extracur-ricular activities, at a part-time job and moving about an otherwise hyper-social high school ecosystem. Ball State Uni-versity’s Center for Media Design’s “High School Media Too” (2007) also illustrated this point: In their study, teen participants spent 40% of their waking day in school activities, 19% with media and the rest with a wide variety of non-media extra-curricular and home activities. Given the reality of a typical teenager’s day, it is less shocking to see how they lag in time spent with both online video and Internet use more broadly.
When they’re tuned in online, the top category of online video for teens is “Entertainment—Videos/Movies” watched by more than 10 million U.S. teens in May 2009. This category is driven largely by the successful reach of YouTube, the most popular source overall for online video for U.S. teens. Social networks are also a
Figure 5: Monthly Time Spent Watching Online Videos by Age, Amongst Viewers (hh:mm:ss)—May 2009
Figure 6: Top Site Categories for Online Video Consumption by Unique Audience (000)—Online Video Users 12–17—May 2009
websites, another favorite source of online video for teens, with more than 1.2 million unique teen visitors. About half of these teens say they rewatch programs that they already saw on TV.
Source: The Nielsen Company
Source: The Nielsen Company
6
Beyond what we generally think of as the “three screens,” there is another promi-nent source for video consumption among teens: MP3 players. Globally, 34% of teens have access to an MP3 player that can also play video. Teen access to such devices is considerably higher than aver-age in the U.S., where 66% of teens say there is an MP3 player in their household that can also play video. All said, 28% U.S. teens say they watch video on an MP3 player daily. As is the case on phones, music videos are the most popular form of video content for teen use of video MP3 players.
Some teens subscribe to mobile video services through their carrier (about 43% say they subscribe to mobile video), but a larger portion of teens (68%) say they access mobile video through mobile Web (note that the two means are not mutu-ally exclusive). The growth of Internet access to mobile video reflects a larger trend in mobile video adoption, away from subscription-based video content and toward “free” mobile Web or application access. This trend has made mobile video more accessible to teens.
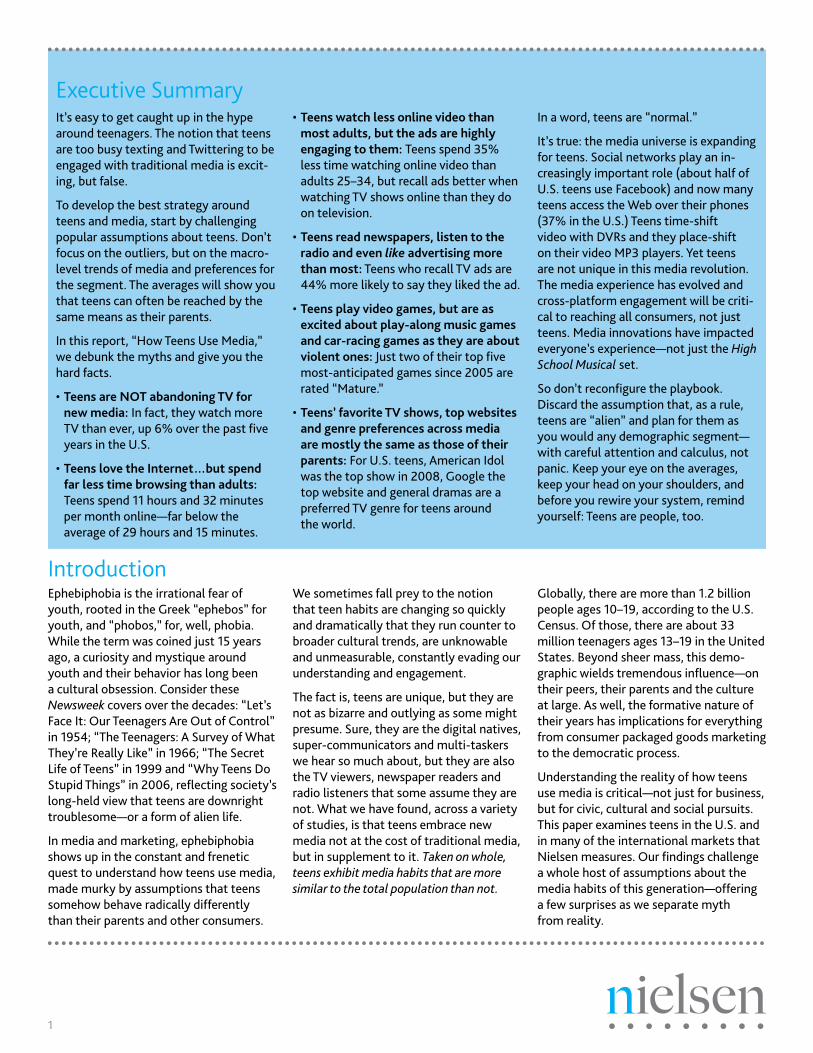
On their phones, the most popular video content for teens is “Music.” Fifty-four percent of teen mobile video users in Q1 2009 watched music content on their phone. Comedy, User-Generated, Sports and Animated content round out the most popular genres of third-screen viewing among teens.
Video on the GoMyth: Due to expense, mobile video is beyond a teen’s reach
Reality: Teens make up 20% of the mo-bile video audience and watch more than the average user
Beyond the first and second screens, teens are increasingly watching video on their phones. Improved access to mobile video through mobile Web has helped this audi-ence to be early adopters of this otherwise cost-prohibitive video platform.
When we think of mobile video we think expensive phones and premium plans: a combination reserved mostly for the enterprise-user or extravagant. But as mobile video is increasingly available over mobile Web and on a broad range of phones, even teens are tuning in.
In the first quarter of 2009, 18% of U.S. teens 13–17 with mobile phones watched some form of video content on their phone. The experience has been much more popular with teen males, who make up 73% of the teen mobile video audi-ence. Teens who watch mobile video do so more than the average user—watching six hours and 30 minutes a month compared to just three hours and 37 minutes for the typical user.
Figure 7: Top Genres of Mobile Video Consumption by Reach—Mobile Video Viewers Ages 13–17—Q1 2009
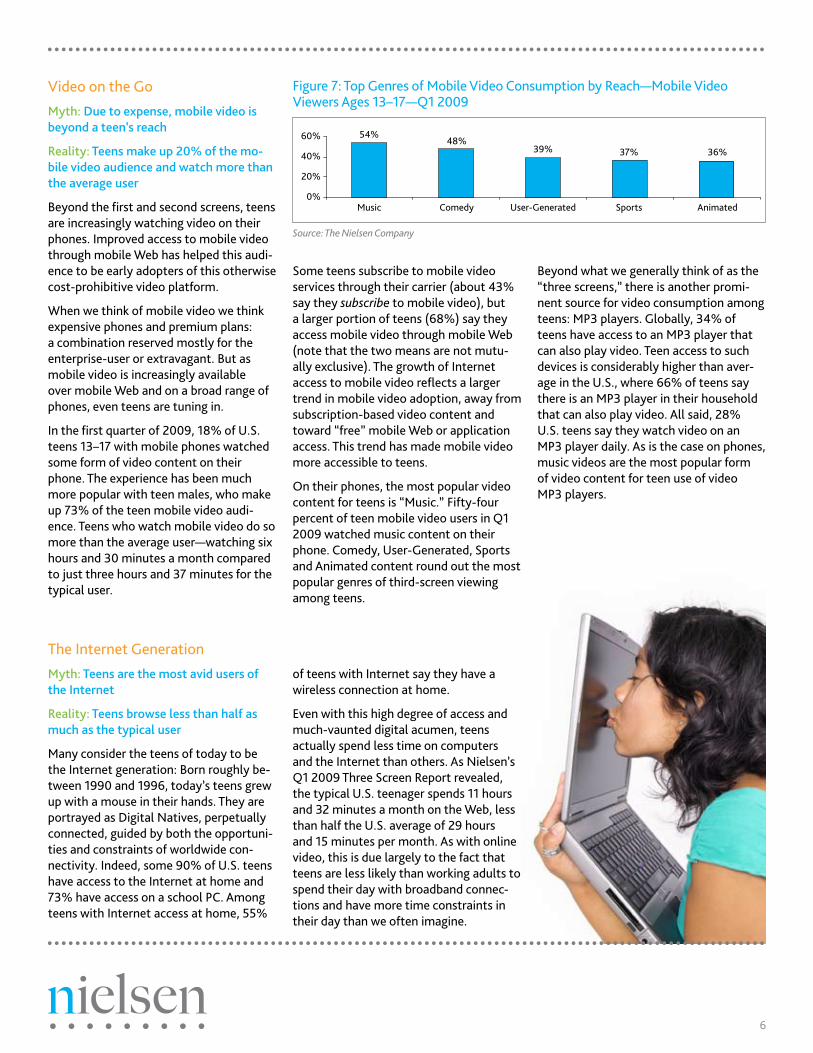
The Internet GenerationMyth: Teens are the most avid users of the Internet
Reality: Teens browse less than half as much as the typical user
Many consider the teens of today to be the Internet generation: Born roughly be-tween 1990 and 1996, today’s teens grew up with a mouse in their hands. They are portrayed as Digital Natives, perpetually connected, guided by both the opportuni-ties and constraints of worldwide con-nectivity. Indeed, some 90% of U.S. teens have access to the Internet at home and 73% have access on a school PC. Among teens with Internet access at home, 55%
of teens with Internet say they have a wireless connection at home.
Even with this high degree of access and much-vaunted digital acumen, teens actually spend less time on computers and the Internet than others. As Nielsen’s Q1 2009 Three Screen Report revealed, the typical U.S. teenager spends 11 hours and 32 minutes a month on the Web, less than half the U.S. average of 29 hours and 15 minutes per month. As with online video, this is due largely to the fact that teens are less likely than working adults to spend their day with broadband connec-tions and have more time constraints in their day than we often imagine.
Source: The Nielsen Company

7
When you add in the time spent on ap-plications that use the Internet, though, teen PC time spent increases. Overall, U.S. teens averaged 24 hours and 54 minutes per month using the Internet and applica-tions in March 2009. Compared to teens in other markets in which Nielsen tracks PC activity, U.S. teens use the Web and applications more than average, though considerably less than Brazilian teens.
Myth: Teens use the Internet in wildly different ways than adults
Reality: Teens flock to many of the same categories and sites as adults
Across the markets, teen Internet use looks a lot like the Internet use of adults. The most popular categories for teens in most markets are general interest portals and search—the same as for their elders.
Member communities (social networks and blogs) also consistently rank among the most popular categories for teens. Within this category, MySpace and Facebook are critical elements of the teen experience. In the U.S., nearly half of online teens 12–17 visited MySpace and Facebook in May 2009 (45% and 44%, respectively). All said, teens 12–17 ac-counted for 28% of MySpace’s page views and 12% of Facebook’s during the month.
Teens are prolific online publishers, too. Sixty-seven percent of teen social networkers say they update their page at least once a week. And teens look to their social networks for much more than gossip and photo-sharing: to teens, social networks are a key source of information and advice in a critical developmental period: 57% of teen social networkers said they looked to their online social network for advice, making them 63% more likely to do this than the typical social networker.
Figure 8: Average Monthly Time Spent Using Internet—U.S. (hh:mm:ss)—Q1 2009
Figure 9: Average Monthly Time Spent on Internet and Applications— Persons 12–17 (hh:mm:ss)—March 2009
Figure 10: Top Web Brands by Reach—Teens 12–17—March 2009
In all of the markets in which Nielsen tracks Internet use, Google was the top Web brand visited by teens in March 2009. Yahoo!, YouTube and MSN are also broadly top performers among teen Internet users.
Source: The Nielsen Company
Source: The Nielsen Company
Source: The Nielsen Company
8
Mobile: Always ConnectedMyth: The only way to reach teens over their phone is texting
Reality: Teens text at incredible rates, but are early adopters of all mobile media
Increasingly, the mobile phone plays a critical role in the media lives of teens. In the U.S., 77% of teens already have their own mobile phone. Another 11% say they regularly borrow one.
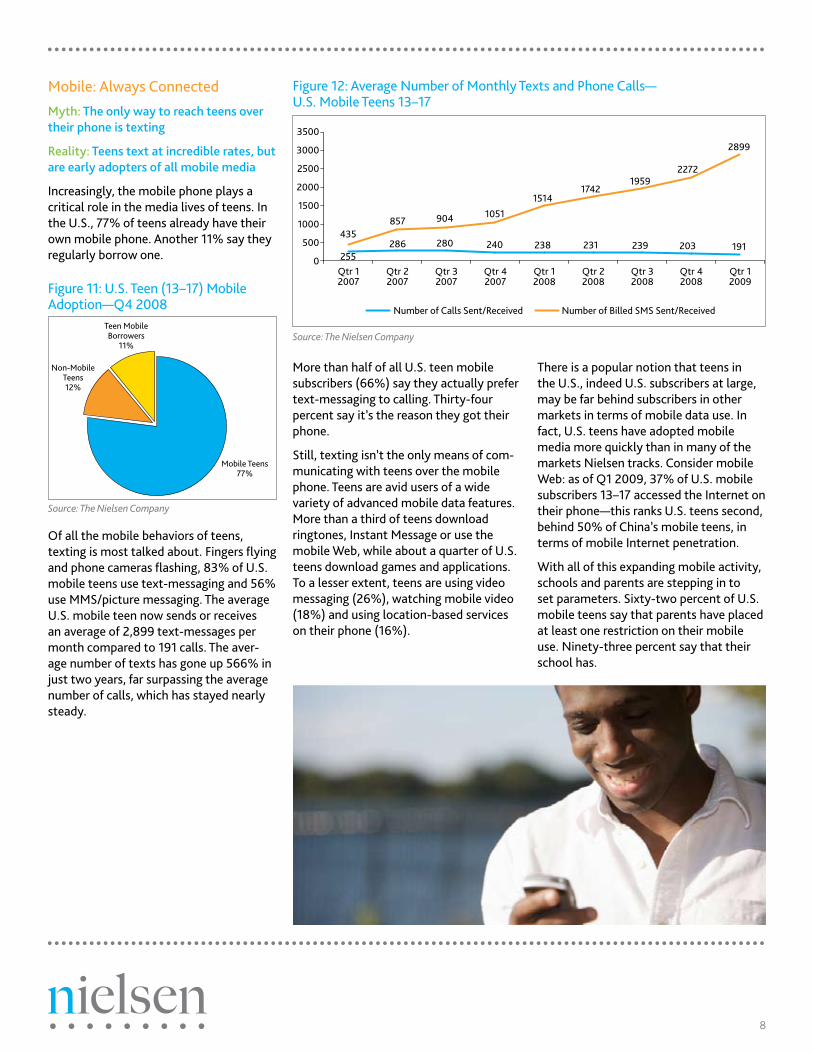
Figure 11: U.S. Teen (13–17) Mobile Adoption—Q4 2008
Figure 12: Average Number of Monthly Texts and Phone Calls— U.S. Mobile Teens 13–17
Of all the mobile behaviors of teens, texting is most talked about. Fingers flying and phone cameras flashing, 83% of U.S. mobile teens use text-messaging and 56% use MMS/picture messaging. The average U.S. mobile teen now sends or receives an average of 2,899 text-messages per month compared to 191 calls. The aver-age number of texts has gone up 566% in just two years, far surpassing the average number of calls, which has stayed nearly steady.
More than half of all U.S. teen mobile subscribers (66%) say they actually prefer text-messaging to calling. Thirty-four percent say it’s the reason they got their phone.
Still, texting isn’t the only means of com-municating with teens over the mobile phone. Teens are avid users of a wide variety of advanced mobile data features. More than a third of teens download ringtones, Instant Message or use the mobile Web, while about a quarter of U.S. teens download games and applications. To a lesser extent, teens are using video messaging (26%), watching mobile video (18%) and using location-based services on their phone (16%).
There is a popular notion that teens in the U.S., indeed U.S. subscribers at large, may be far behind subscribers in other markets in terms of mobile data use. In fact, U.S. teens have adopted mobile media more quickly than in many of the markets Nielsen tracks. Consider mobile Web: as of Q1 2009, 37% of U.S. mobile subscribers 13–17 accessed the Internet on their phone—this ranks U.S. teens second, behind 50% of China’s mobile teens, in terms of mobile Internet penetration.
With all of this expanding mobile activity, schools and parents are stepping in to set parameters. Sixty-two percent of U.S. mobile teens say that parents have placed at least one restriction on their mobile use. Ninety-three percent say that their school has.
Source: The Nielsen Company
Source: The Nielsen Company

9
At home, 24% of teen mobile subscribers said they were not allowed to use the phone at dinner, 22% were required to make certain grades, 21% had a limited number of minutes and 13% had a limited number of text-messages. At school, 77% of mobile teens say they are not permitted to use their phone in class and 50% are restricted from using it during assemblies.
As teens around the world continue to adopt mobile phones, mobile media and messaging, marketers will be paying attention. Mobile marketing offers the most personal and direct form of engage-ment for an audience that, as this paper demonstrates, is spread broadly across the media ecosystem. Moreover, teens seem to be particularly open to the idea of mo-bile advertising. A 2008 study by Nielsen found that teen mobile media users were roughly three times as receptive to mobile advertising as the total subscriber population: just over half of teen mobile media users considered themselves open to mobile advertising.
Figure 14: Teen (13–17) Mobile Internet Penetration by Market—Q1 2009
Figure 13: Mobile Media Use by U.S. Teen 13–17 Mobile Users—Q1 2009
Source: The Nielsen Company
Source: The Nielsen Company

10
In terms of genre, comedy films reign with U.S. teenagers. Eighty five percent of U.S. teens say they are fans of the comedy genre, followed closely by Action & Adventure (80%) before falling off to Sci-Fi (52%) and Suspense or Mystery (51%). Only about half of U.S. teen movie goers say they are fans of horror, anima-tion, drama and family movies. Romance
TheatricalMyth: The silver screen is too old-fash-ioned and expensive for today’s teens
Reality: Teens go to the movies more than any other age group
Even with all the in-home and portable video options available, teens still love the Big Screen. Offered a range of in- and out-of-home viewing options, teens said they prefer seeing movies in the theater. Thirty-two percent of U.S. teens ages 12–17 said they prefer the movie theater above DVDs (24%), renting online (7%) and Movies On Demand (5%).
Overall, U.S. teens watched an average of 31.4 movies in 2008 via all means (compared to 25.3 for all consumers). Of those, the typical teen saw 10.8 movies in the theater—the highest average theatrical viewing of any age group. Put differently, teens made up 14% of the theatrical movie going audience in 2008 and 20% of the critical “heavy” movie-going segment who saw more than 10 theatrical films in 2008.
Figure 15: Movie Genre Preferences—U.S. Teens 12–17—2008
movies don’t get much love from teens—just 39% like romantic comedies and only about a quarter enjoy general romance movies.
R-rated comedies have grown popular even with female teens: 79% of males 17–24 and 70% of females 17–24 saw at least one R-rated comedy in 2008, and they want more. Fifty-seven percent of males 17–24 and 44% of females 17–24 agreed with the statement, “Can’t Wait for the Next One.”
As 3D movies gains some traction, many believe teens present a strong market for these films. In 2008, 27% of teens saw at least one 3D movie, compared to 21% of all movie goers. The experience resonated: 64% of teens who saw at least one 3D movie said the experience was better than a 2D film and 75% they have a definite interest in seeing more films in 3D.
Source: The Nielsen Company
11
Myth: Teen gamers spend all their time playing “Mature” shooter games
Reality: Just two of the top five “most anticipated” games among teens since 2005 were rated Mature
Of the top five most anticipated video games among teens since 2005, just two were rated Mature by the ESRB (Entertain-ment Software Rating Board), two were rated Teen and one was rated Everyone. The most anticipated video game among gamers 13–17 since 2005 has been Halo 3, a first-person shooter game rated Mature by the ESRB. At its peak, 61% of active gamers said they had a definite interest in Halo 3. The other Mature rated game in the top five was Grand Theft Auto IV which, with a 37% “definite interest” among teens, tied Guitar Hero: Aerosmith (rated Teen) for the second most antici-pated video game. Mario Party 7 (33%) and Guitar Hero: World Tour (32%) round out the list of the five most anticipated games. Play-along music and fantasy driving games, it turns out, are as relevant to the teen gaming experience as first-person shooter games.
Though 25 minutes is a daily average, gaming tends to be a more sporadic activ-ity than, say, TV viewing. When teens do sit down to play—they play for a while. Nielsen estimates that the typical teen console gamer will use a console just seven days out of the month, but do so for more than an hour each session. Xbox 360 is the most popular video game console among teens—accounting for 29% of all their minutes of play.
Handheld video game systems are also popular with teens, particularly in the U.S. Globally, 30% of teens have access to a handheld video game system. In the U.S. penetration of these devices is much higher: 73% of U.S. teens had a portable gaming device in their household in 2008.
Understanding what teens play on their video game systems might change the perspective on teen gaming. The notion that teens spend all of their gaming time as first person shooters is false. Indeed, teens spend just some of their time shoot-ing one another up.
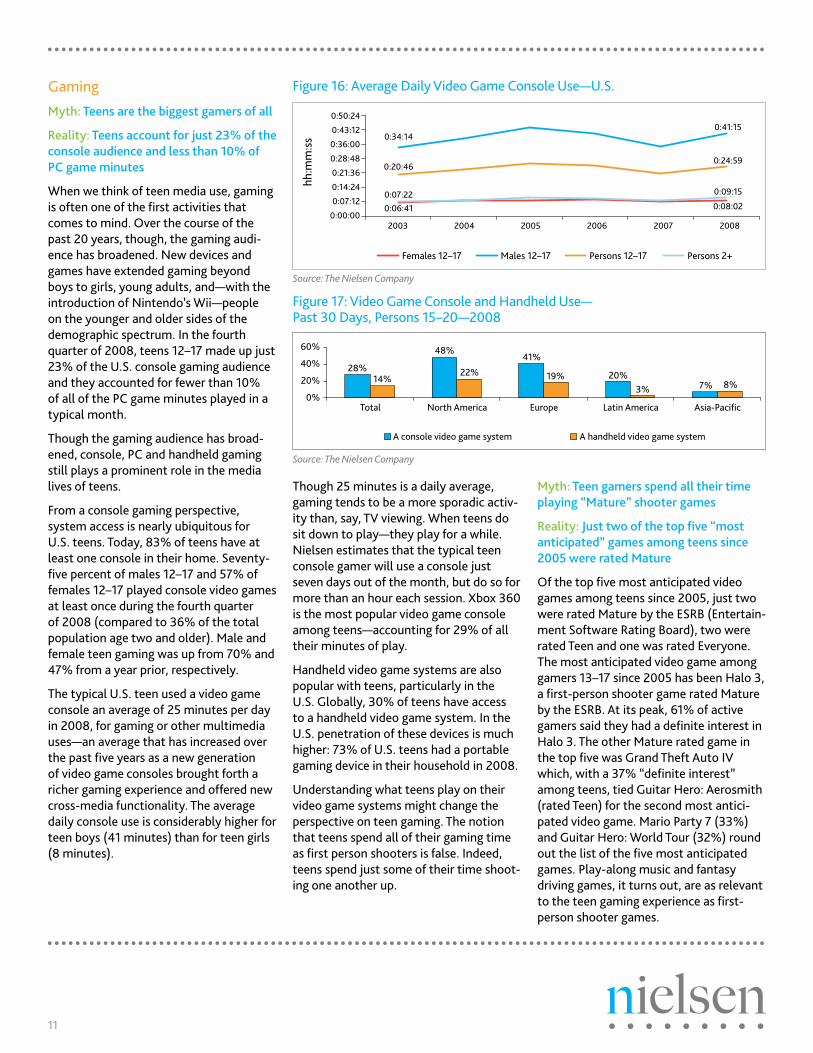
GamingMyth: Teens are the biggest gamers of all
Reality: Teens account for just 23% of the console audience and less than 10% of PC game minutes
When we think of teen media use, gaming is often one of the first activities that comes to mind. Over the course of the past 20 years, though, the gaming audi-ence has broadened. New devices and games have extended gaming beyond boys to girls, young adults, and—with the introduction of Nintendo’s Wii—people on the younger and older sides of the demographic spectrum. In the fourth quarter of 2008, teens 12–17 made up just 23% of the U.S. console gaming audience and they accounted for fewer than 10% of all of the PC game minutes played in a typical month.
Though the gaming audience has broad-ened, console, PC and handheld gaming still plays a prominent role in the media lives of teens.
From a console gaming perspective, system access is nearly ubiquitous for U.S. teens. Today, 83% of teens have at least one console in their home. Seventy-five percent of males 12–17 and 57% of females 12–17 played console video games at least once during the fourth quarter of 2008 (compared to 36% of the total population age two and older). Male and female teen gaming was up from 70% and 47% from a year prior, respectively.
The typical U.S. teen used a video game console an average of 25 minutes per day in 2008, for gaming or other multimedia uses—an average that has increased over the past five years as a new generation of video game consoles brought forth a richer gaming experience and offered new cross-media functionality. The average daily console use is considerably higher for teen boys (41 minutes) than for teen girls (8 minutes).
Figure 16: Average Daily Video Game Console Use—U.S.
Figure 17: Video Game Console and Handheld Use— Past 30 Days, Persons 15–20—2008
Source: The Nielsen Company
Source: The Nielsen Company

12
Not totally lost to digital, radio is still the primary source of music consumption for 16% of teens and a secondary source for 21% of teens, globally. Considering that teens may find themselves in older cars not yet equipped to play from their MP3 player and that radio still serves as an information source for local social happenings of extra relevance to teens, some degree of radio listenership should be expected. And while not the most popular source of audio consumption, radio preferences can still give us a broader perspective into the musical tastes of today’s teens.
In the U.S., a 2008 study by Scarborough Research showed that “Pop Contemporary Hit Radio” was the most popular format among older teens 18–20 (listened to by 40% of this segment), followed by Rhyth-mic Contemporary and Country.
Music & RadioMyth: With MP3 players and PCs, teens no longer rely on radio
Reality: Radio is the top source of music consumption for 16% of teens globally and the secondary source for another 21%.
It’s sometimes said that “music defines a generation.” If that is the case, it may not be the genre of music, but the mode of consumption that defines today’s teenagers. While radio, records, 8-tracks, cassettes and CD players had their gen-erations, this is the generation of the MP3 player. Already today, the MP3 player is the top method of music consumption for teens around the world. Thirty-nine percent of teens globally say it is their primary method of listening to music, fol-lowed not by CDs or radio, but the home computer, which is the primary source of music for 33% of teens globally. Forty-five percent of teens globally say they listen to five or more hours of music per week on their computer; 12% say they listen to 20 hours or more.
Figure 18: Top Methods of Teen Music Consumption—Globally, Persons 15–20—2008
Figure 19: Portable Media Device Use by Region—Past 30 Days, Persons 15–20—2008
Figure 20: Top Ten Radio Formats— U.S. Persons 18–20—2008
Format ListenPop Contemporary Hit Radio 40%Rhythmic Contemporary Hit Radio 33%
Country 20%Urban Contemporary 18%Alternative 16%Hot AC 12%Active Rock 11%Adult Contemporary 10%Classic Rock 9%Album Oriented Rock 7%
Source: Scarborough Research
The News/Information radio genre performs relatively poorly with 18–20 year-olds. Just 4% of persons 18–20 said they listened to News/Information sta-tions in 2008, compared to 20% of the total population.
Beyond digital tracks and broadcast, many teens still purchase music in hard formats, as well. Whether it’s the allure of the album art and lyric book or an affinity for still owning music in a physical form, 75% of teens globally say they listen to at least some CDs each week, according to a 2008 global survey by Nielsen. Twenty-percent still listen to five hours or more. Around the world, the typical teen purchased more than three CDs in 2008, though the average was less in North America, where the typical teen purchased just over two, on average.
Globally, nearly half of teens (44%) use a music-only MP3 player and a quarter say they use one that plays both music and video. In North America, teen use of MP3 players that also play video is slightly higher, where 40% of teens do so.
Source: The Nielsen Company
Source: The Nielsen Company

13
Figure 22: Top Advertiser Categories Across 14 Teen Magazines
Product Category2008-$$$ (Millions)
APPAREL $40,048FRAGRANCES-WOMEN $14,634
ENTERTAINMENT SFTWRE $13,956
SPORTING FOOTWEAR $9,998
STORE-DEPT $8,634STORE-APPAREL $8,592SHOES $8,190LIPSTICK $6,384ANTIPERSP-DEOD $5,010MASCARA $4,949Total Among These Categories $120,396
Total Within These Publications $247,556
Source: The Nielsen Company
NewspapersMyth: Teens wouldn’t know a newspaper if the paperboy hit them in the face
Reality: More than a quarter of U.S. teens say they read a daily newspaper and more than a third say they read on Sunday
As some newspapers shut down and pundits predict the downfall of others, a popular perception is that a new genera-tion of media consumers can be blamed for the decline and fall of print media.
It’s true, older teens 18–20 measured by Scarborough Research were less likely to read a daily paper than average, but still more than a quarter (29%) of U.S. persons 18–20 say they read a daily newspaper on an average day. About a third, 34%, say they read a paper on an average Sunday.
AdvertisingMyth: Most advertising to teens is for junk-food and entertainment
Reality: Advertisers are more likely to target teens with messages about health and beauty
Teens are a natural focus for many marketers: with both direct expendable income and a substantial amount of influ-ence over household purchases, engaging teens around a brand can have a substan-tial impact.
In order to get a better understanding of which advertisers and categories have been trying to reach teenagers, on one medium at least, we analyzed the top advertising spenders in 2008 across 14 teen-centric magazines in the U.S. The results show that, contrary to the notion that teens are being bombarded with mes-sages about junk food and entertainment, the highest concentration of advertising to teens is around “image” products such as apparel and beauty. All together, Nielsen estimates that more than $240 million were spent across these 14 teen magazines in 2008. Apparel advertisers spent the largest share, $40 million.
Figure 21: Newspaper Readership— U.S. Persons 18–20—2008
Beyond the top categories advertising to teens in these publications, we looked also at the top individual advertisers. The top 10 advertisers in these teen publica-tions spent a combined $70 million to reach this audience in 2008. Procter & Gamble, no doubt hoping to earn CPG customers for life, spent an estimated $16.7 million across these 14 teen-centric publications. The U.S. Government, which Nielsen estimates spent more than $5 million to reach teens across these 14 publications, was also among the top ten advertisers. The government’s investment to reach teens was spread across anti-drug campaigns ($2.6 million), military recruit-ment ($2.4 million) and environmental protection ($59,000).
Source: Scarborough Research

14
teen, teens tend to “like” TV spots more than adults. Average appeal levels among teen brand recallers are 44% higher than they are among older viewers. Teens tend to like TV ads more than adults—making them a discerning but winnable advertis-ing audience.
Figure 25: Advertising Brand Recall Product Categories with Greatest Teen Skew
Category Demo IndexHair Products & Accessories 140
Games & Toys 131Cosmetics & Beauty Aids 130Confectionery & Snack Foods 128
Men’s Toiletries & Skin Care 120
Source: Nielsen IAG, Primetime Broadcast + Cable, 9/22/08–5/10/09 ABC, CBS, CW, FOX, NBC, A&E, BRV, COM, DISC, ESPN, FOOD, FX, HIST, HGTV, LIFE, MTV, NAN, SCIFI, SPEED, TBS, TLC, TNT, USA, VH1 Index: P13–17 vs. A18+, then adjusted by baseline demo difference
Some categories of advertising had more success than others in connecting with teens during the 2008–2009 Television season. Examining advertiser categories to determine which categories were most effective at overcoming the recall gap between teens and Adults 18+, Nielsen found that hair products & accessories, games & toys, cosmetics, candy and men’s toiletries did the best job of breaking through the clutter to teen viewers.
Product placement, or branded entertain-ment, may also prove to be an effective means of reaching teens. Overall, Persons 15–24 recall branded entertainment at slightly lower rates than Adults 25+, but are just as likely to associate the integrat-ed brand (Brand Linkage). What’s more, younger viewers are significantly more likely to cite an improved opinion of inte-grated brands compared to older viewers. The much higher Brand Opinion improve-ment for P15–24 compared to Adults 25+ is driven largely by young males.
During the 2008/2009 TV season (through May 3), Nielsen found that teens 13–17 were 16% less attentive to television programming, on average, than Adults 18+. This engagement measure was true for both entertainment and sports programs.
Across networks and programs tracked, the CW’s One Tree Hill had the highest levels of program engagement among teens in the 2008–2009 television season. Teen viewers of One Tree Hill were 54% more engaged with this program than the average across programs measured. Right with One Tree Hill are other programs that are less focused on the teen audience. ABC’s Desperate Housewives, for instance, was the third most engaging program among teens. Put differently, many teens are highly engaged in programming about people their parents’ age.
Teen engagement with television advertis-ing is also lower than it is among adults. Teen Ad Recall across programs measured was 19% below Adults 18+ during the 2008–2009 TV season. Brand recall was 31% lower and message recall 38% lower.
Figure 24: Program Engagement Broadcast/Cable TV Series Ranking Highest among Teens
Program Network IndexOne Tree Hill CW 154Heroes NBC 152Desperate Housewives ABC 152
Privileged CW 150Real Housewives of Orange County
BRAVO 148
Source: Nielsen IAG, Primetime Broadcast + Cable Regularly Airing Primetime Series, 9/22/08–5/3/09, Persons 13–17 ABC, CBS, CW, FOX, NBC, A&E, BRV, COM, DISC, ESPN, FOOD, FX, HIST, HGTV, LIFE, MTV, NAN, SCIFI, SPEED, TBS, TLC, TNT, USA, VH1
There is good news for marketers, though, in terms of message impact. Once an ad breaks through the clutter to reach a
Figure 23: Top Advertiser Parent Companies Across 14 Teen Magazines
Parent Company2008-$$$ (Millions)
PROCTER & GAMBLE CO $16,68
LOREAL SA $9,898JOH A BENCKISER GMBH $8,109
LVMH MOET HENNESSY LOUIS VUITTON SA
$7,165
NIKE INC $5,743JOHNSON & JOHNSON $5,174
US GOVERNMENT $5,114WALT DISNEY CO $4,396ESTEE LAUDER COS INC $4,175
ICONIX BRAND GROUP INC $3,766
$70,227
Source: The Nielsen Company
Though these findings represent just a small sliver of overall teen-targeted advertising expenditures globally, they are an indication of the large sums of money being spent to reach teens and the types of brands going after them.
Messaging To TeensMyth: Traditional advertising doesn’t resonate with teens
Reality: Once an ad breaks through the clutter, teens are much more likely to “like” an advertisement than their older counterparts
To get a sense for how effective advertising is among teenagers, Nielsen IAG, Nielsen’s advertising engagement consultancy, looked at measures of engagement among teenagers. Nielsen IAG measures program and advertising engagement by surveying television viewers the day after viewing about what they remember seeing on TV.

15
Economic ImpactMyth: Teen media use is insulated from economic impact
Reality: In the context of the economy, many teens say they are spending less on entertainment
As with adults, the economy is having an impact on how teens consume me-dia. Nielsen’s latest Global Consumer Confidence Index showed that 76% of teens across 50 countries think their country’s economy is in a recession—on par with adults, at 77%. In the midst of that recession, 69% say they’ve changed their spending in some way, and for many, that’s entertainment spending. After new clothes, teens are most cutting back on entertainment: 51% say they reduced spending on out-of-home and 23% say they’ve reduced spending on in-home entertainment.
A recent Nielsen home entertainment survey looked more closely at U.S. teen cutbacks: in 2008, a large segment of teens say they bought fewer MP3s, DVDs,
message from an in-stream advertisement viewed during a full episode online, com-pared to a commercial airing on linear TV (for the same brand or product). As the media landscape continues to broaden, it
Young females are +6 points higher, while young males are +19 points higher. This younger demo may consider TV product placements to be more of the “norm”, view them as a way of determining which products are considered “trendy”, and may be generally more impressionable than their older counterparts who have already established brand preferences.
As teens increasingly access made-for-TV content not just on television, but online, Nielsen IAG also is analyzing the differ-ences in program and advertising engage-ment across the channels. There’s early indication that, for teens, advertisements seen while watching full episodes online can actually be more effective than com-mercials airing on linear TV, in terms of recall. Specifically, Nielsen IAG finds that, on average, teens are 146% more likely to recall the advertised brand and key
Figure 26: Integrated Product Placement (IPP) Performance Norms: P15–24 vs. A25+
won’t be enough to understand how teens spend their time. Increasingly, measures of engagement and effectiveness will help us put cross-platform consumption in greater context.
spent less on video games and went to the movies less than in 2007, as a result of the economy.
Thankfully for the entertainment indus-try, this cautious frugality may not stick. Our Global Consumer Confidence Index showed that just 7% of teens said they’d stick with reductions in at-home enter-tainment spending once the economy improves. Seventeen percent said they’d
stick with their reductions in out-of-home entertainment, both to a lesser extent than adults.
Overall, teens around the world are more confident about the economy than any other age group. For the time being, though, their perception of recession, across almost all markets we measure, has led teens to tighten their entertainment wallets just as adults have.
Figure 27: Self-Reported Media Spending vs. 1 Year Prior—U.S. Teens 13–17—2008
Source: Nielsen IAG
Source: The Nielsen Company

16
About The Nielsen CompanyThe Nielsen Company is a global informa-tion and media company with leading market positions in marketing and con-sumer information, television and other media measurement, online intelligence, mobile measurement, trade shows and business publications (Billboard, The Hollywood Reporter, and Adweek). The privately held company is active in more than 100 countries, with headquarters in New York, USA.
For more information, please visit www.nielsen.com
About This ReportThe data and insights in this report are compiled from a range of Nielsen resources including The Nielsen Company’s Television, Online and Telecom practices, Nielsen IAG, Nielsen NRG, Nielsen Games, Nielsen Monitor-Plus, Scarborough Research and Nielsen’s biannual global survey of consumers across 50 countries. For more information, contact your Nielsen client services representative or:
Nic Covey Director of Insights The Nielsen Company
+1 312-385-6718
Not So AlienThere is a thread the runs across the myths dispelled by our teen research: when it comes to media, teens are not as radically different as some think.
Not only are teens a measurable and reachable segment, but they can be reached and engaged in ways very similar to their parents.
The overall media experience is rapidly evolving, to be sure, but in this rising tide of innovation all demographic boats are rising. Today’s teens are different than previous generations—social networking and time-shifting, relying on MP3s and mobile Internet, not because they are uniquely wired but because they are an artifact of larger, demographically broader shifts in media behavior. Teens are wildly different—not from other consumers today, but from teens of generations past.
To best engage this segment in market-ing, civic and cultural pursuits, you must discard the notion that they are alien. Instead, examine the nuances of their media behavior as you would any demo-graphic segment. The result will be less ephebiphobia for an industry and for teens it could mean the terms of engagement they so often want: to be treated more like adults.
Copyright © 2009 The Nielsen Company. All rights reserved. Printed in the USA. Nielsen and the Nielsen logo are trademarks or registered trademarks of CZT/ACN Trademarks, L.L.C. Other product and service names are trademarks or registered trademarks of their respective companies. 09/291