how stuff spreads: how video goes viral
TRANSCRIPT
How Stuff Spreads Francesco D’Orazio, @abc3d #SMWF NYC pulsarplatform.com Based on a study by Francesco D’Orazio (@abc3d) and Jess Owens (@hautepop)
Why do we share?!

Emotion is the trigger
Relevance to our community provides validation
(topicality)
Relevance to our community provides validation
(timeliness)

Gatekeepers activate the communities within the audience
and escalate the diffusion
So given the right content, audience relevance and influencer
push, virality should always happen in the same way.
Except it never does
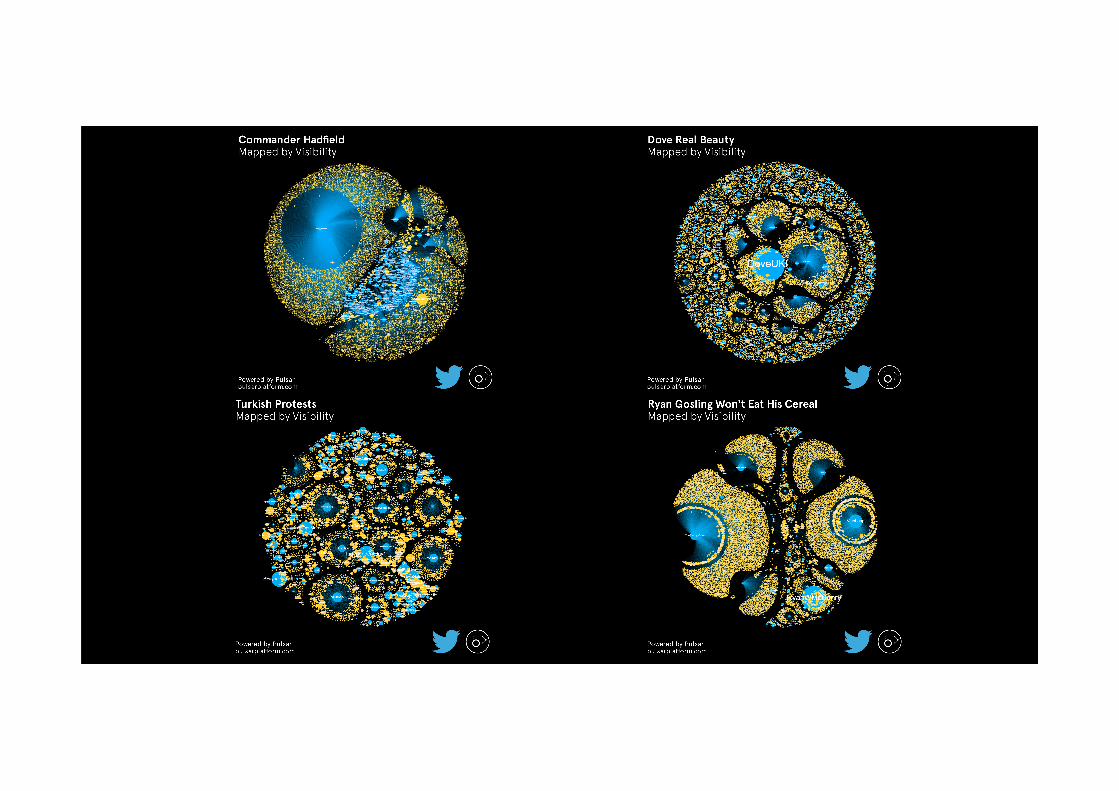
We looked at 4 memes that have “gone viral”:
a music video, an ad, a citizen journalism video, a web series
0
10,000
20,000
30,000
40,000
50,000
60,000
11-May 18-May 25-May 01-Jun 08-Jun
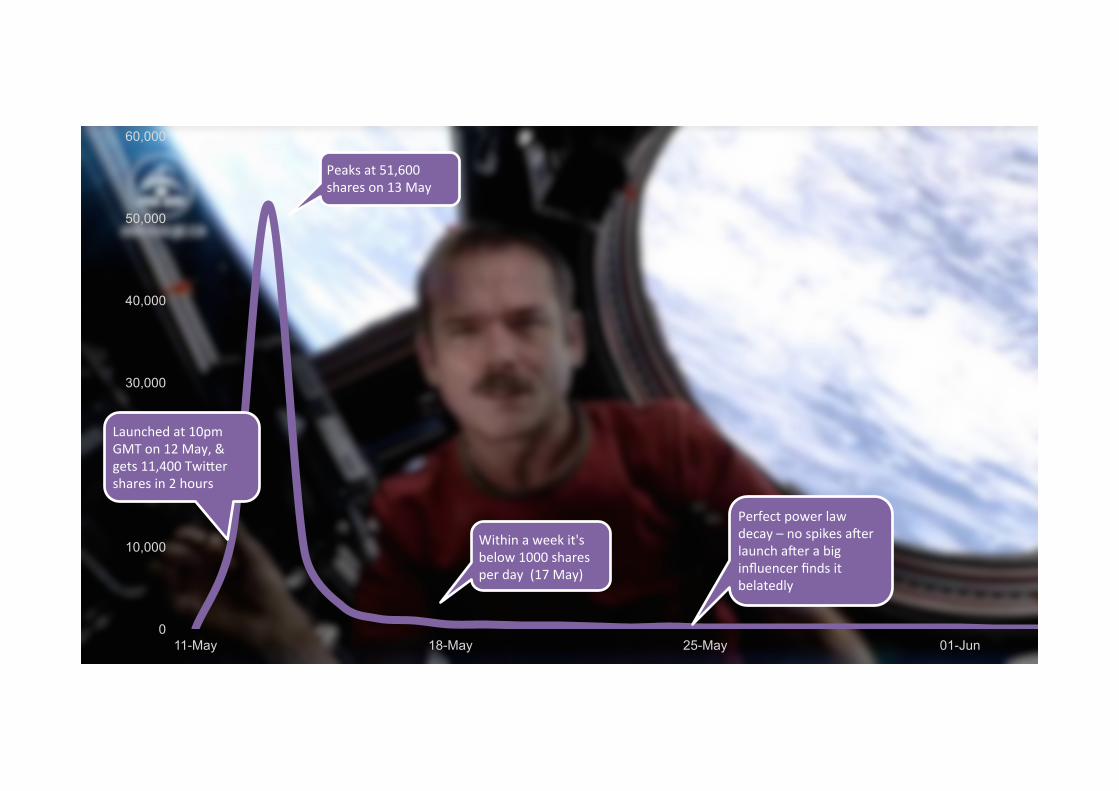
Launched at 10pm GMT on 12 May, & gets 11,400 Twi<er shares in 2 hours
Peaks at 51,600 shares on 13 May
Within a week it's below 1000 shares per day (17 May)
Perfect power law decay – no spikes aLer launch aLer a big influencer finds it belatedly

0
2,000
4,000
6,000
8,000
10,000
12,000
14,000
15-Apr 22-Apr 29-Apr 06-May 13-May 20-May 27-May 03-Jun 10-Jun
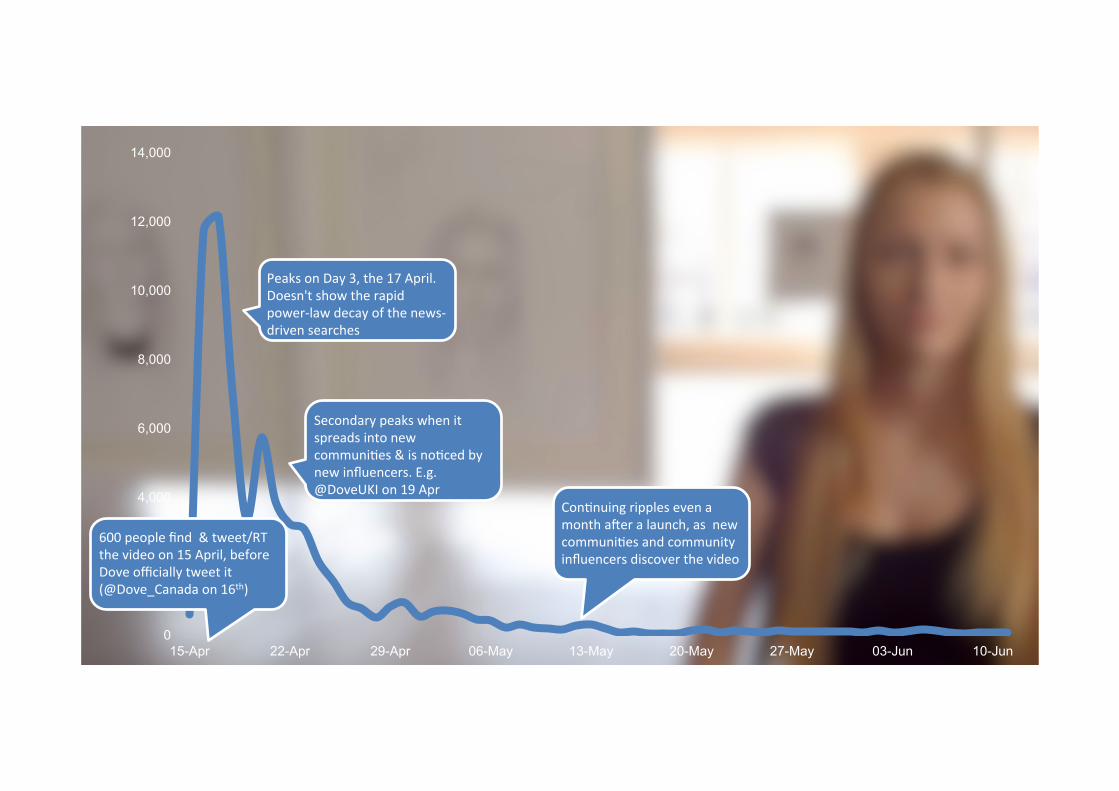
ConPnuing ripples even a month aLer a launch, as new communiPes and community influencers discover the video
600 people find & tweet/RT the video on 15 April, before Dove officially tweet it (@Dove_Canada on 16th)
Peaks on Day 3, the 17 April. Doesn't show the rapid power-‐law decay of the news-‐driven searches
Secondary peaks when it spreads into new communiPes & is noPced by new influencers. E.g. @DoveUKI on 19 Apr
0
2,000
4,000
6,000
8,000
10,000
12,000
01-Jun 08-Jun 15-Jun 22-Jun
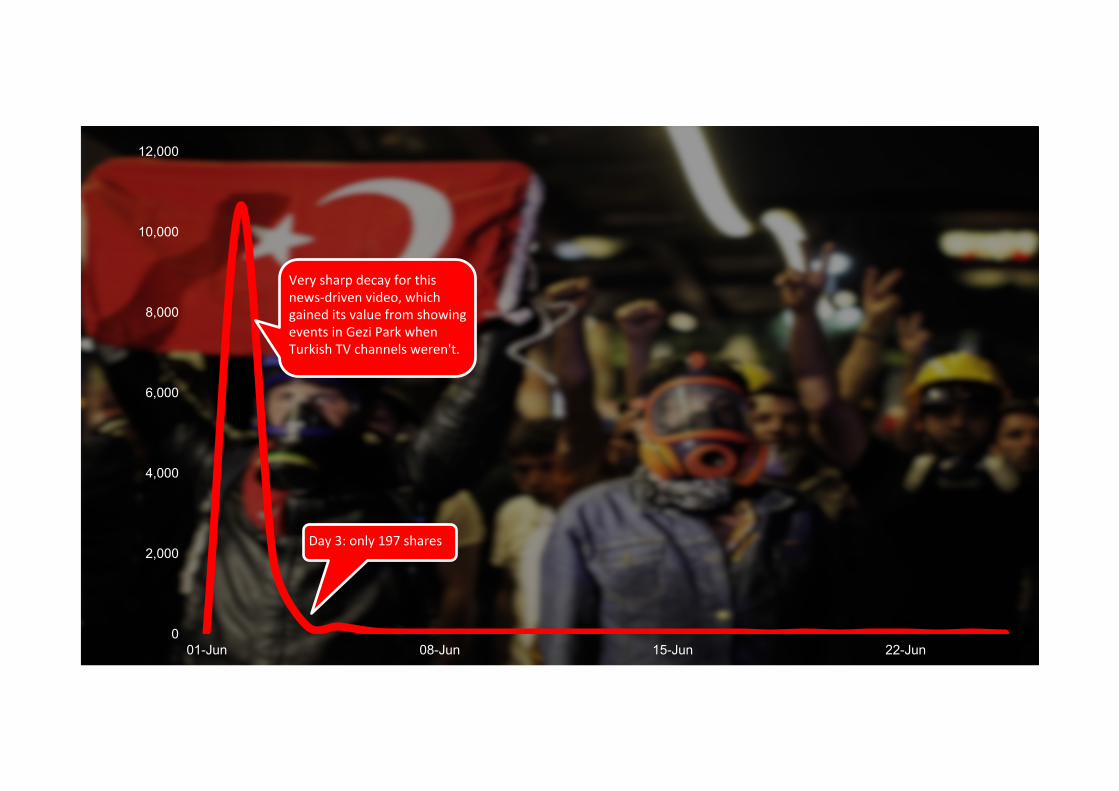
Very sharp decay for this news-‐driven video, which gained its value from showing events in Gezi Park when Turkish TV channels weren't.
Day 3: only 197 shares
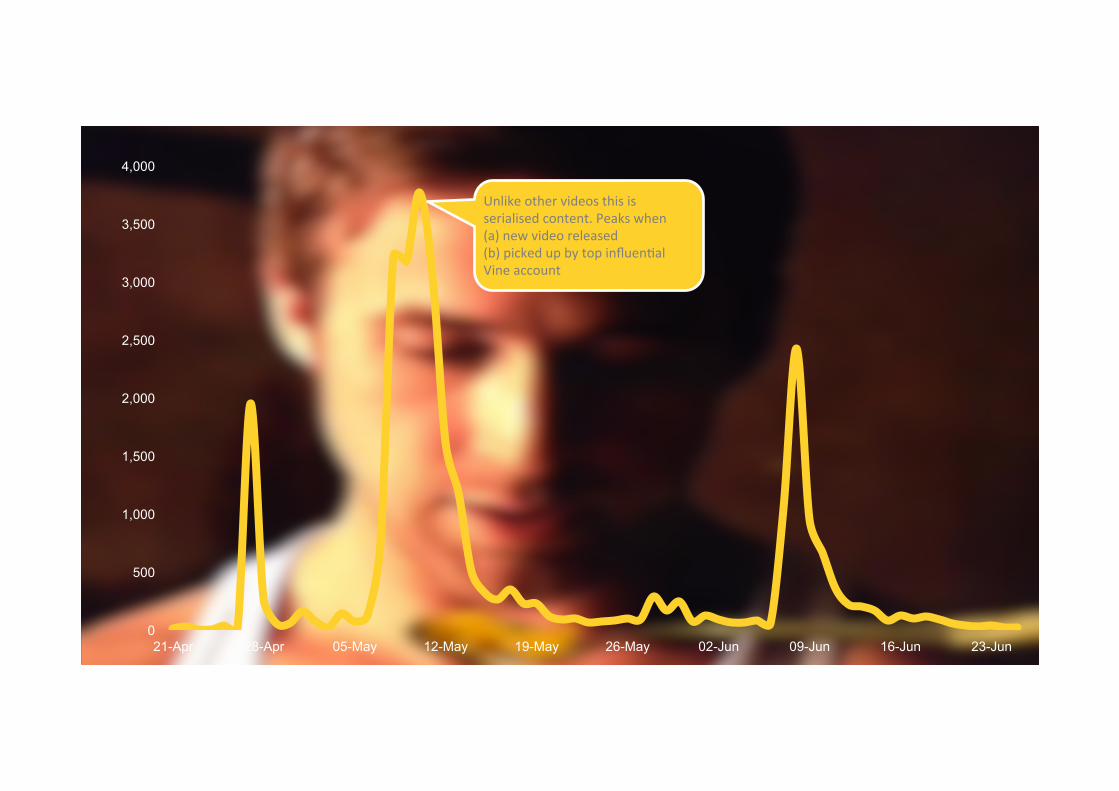
0
500
1,000
1,500
2,000
2,500
3,000
3,500
4,000
21-Apr 28-Apr 05-May 12-May 19-May 26-May 02-Jun 09-Jun 16-Jun 23-Jun
Unlike other videos this is serialised content. Peaks when (a) new video released (b) picked up by top influenPal Vine account

@abc3d | PulsarPlatform.com
Virality Quantified!Which variables are best for identifying a viral phenomenon?
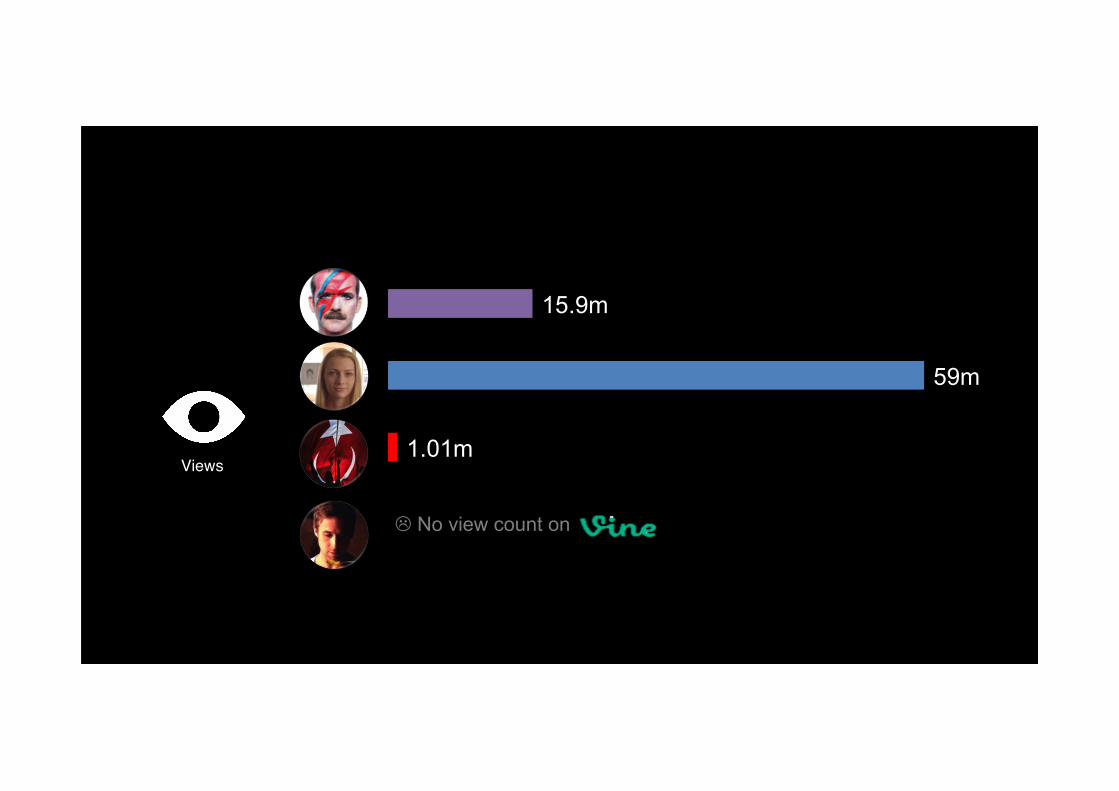
15.9m
59m
1.01m
L No view count on
Views

81,200!Tweets!
64,900!Tweets!
12,940!Tweets!
30,280!Tweets!
75,067!Unique Authors!
62,324!Unique Authors!
11,868!Unique Authors!
27,993!Unique Authors!
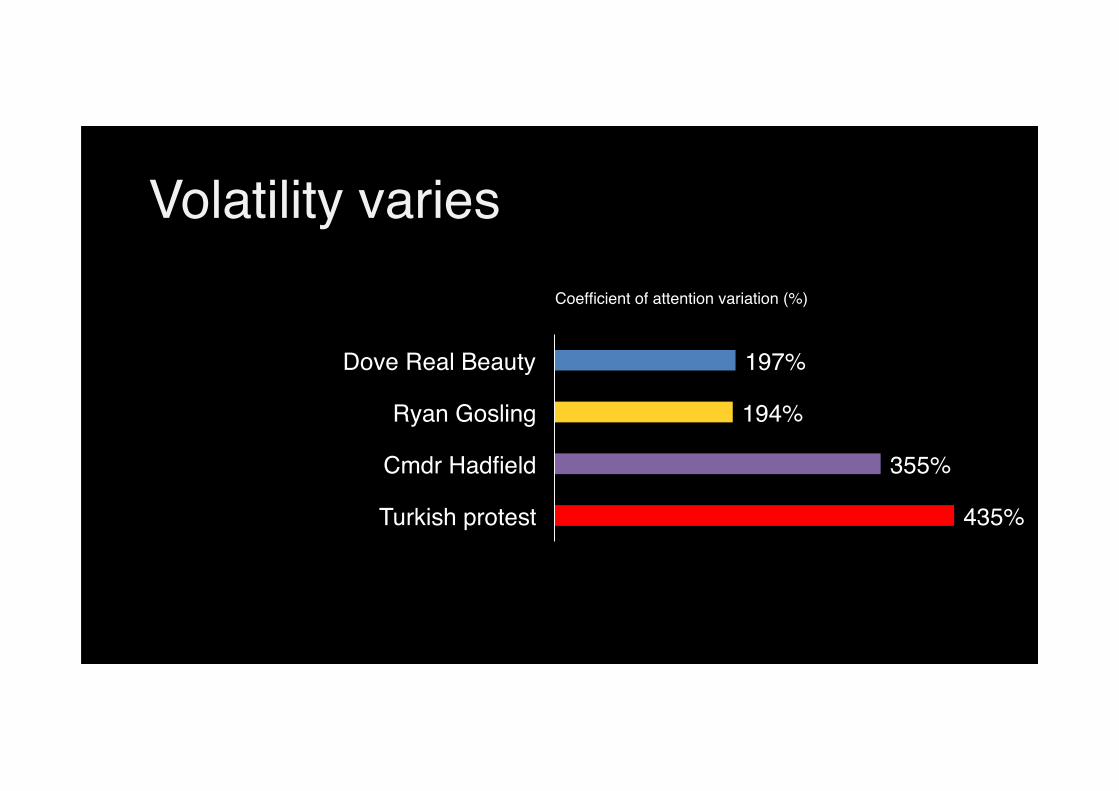
197%!
194%!
355%!
435%!
Dove Real Beauty!
Ryan Gosling!
Cmdr Hadfield!
Turkish protest!
Coefficient of attention variation (%)!
Volatility varies!
0
10000
20000
30000
40000
50000
60000
1 8 15 22 29 36 43 50 57
Commander Hadfield Dove Turkey Ryan Gosling
Days since video launch
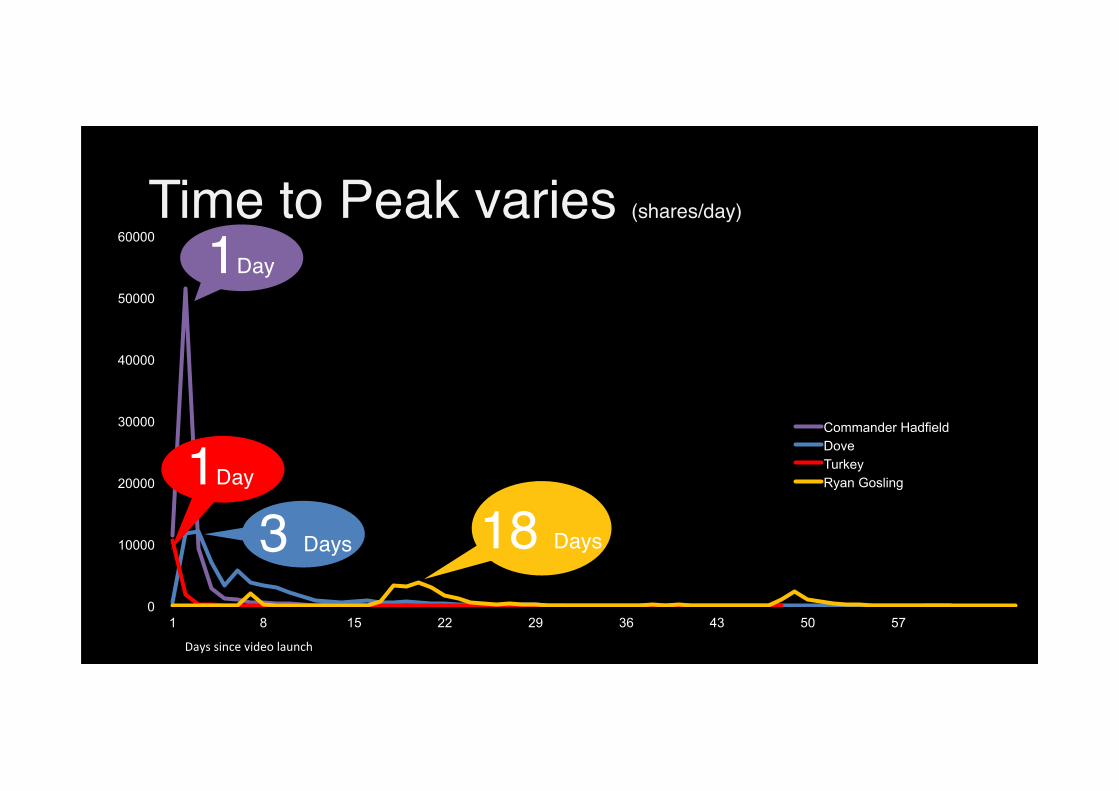
1Day!
1Day!
3 Days! 18 Days!
Time to Peak varies (shares/day)!
!
0
1000
2000
3000
4000
5000
6000
7000
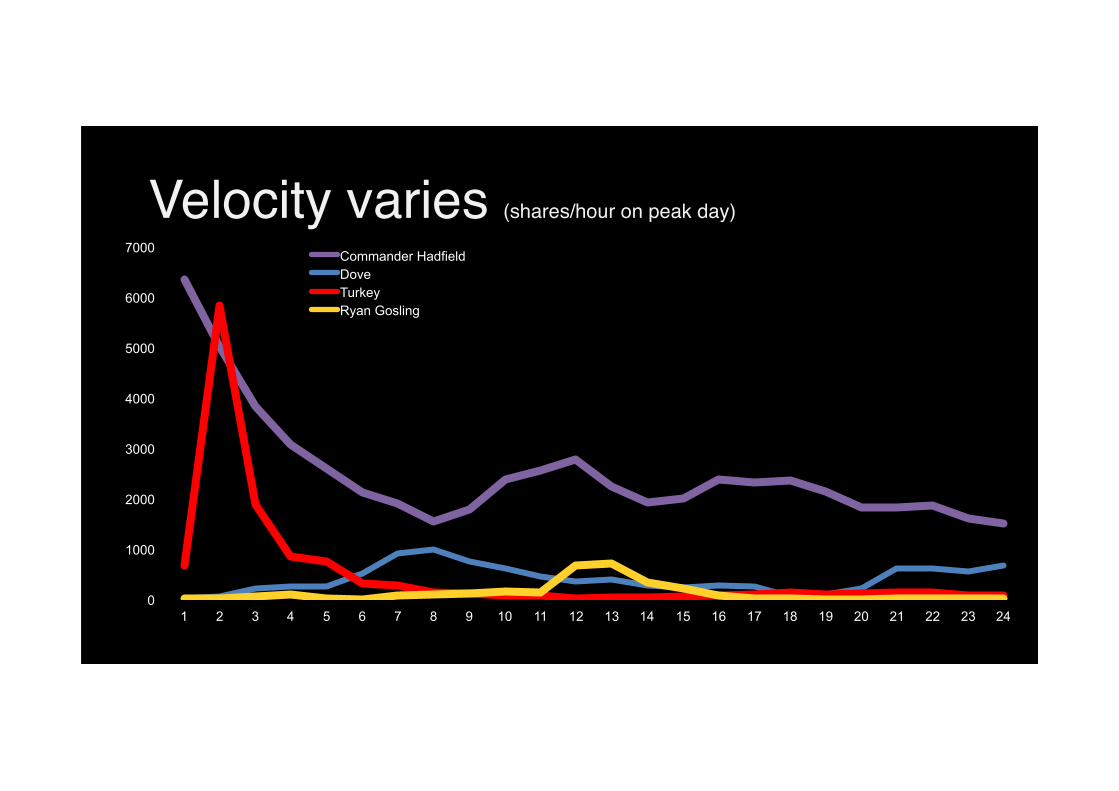
1 2 3 4 5 6 7 8 9 10 11 12 13 14 15 16 17 18 19 20 21 22 23 24
Commander Hadfield Dove Turkey Ryan Gosling
Velocity varies (shares/hour on peak day)!
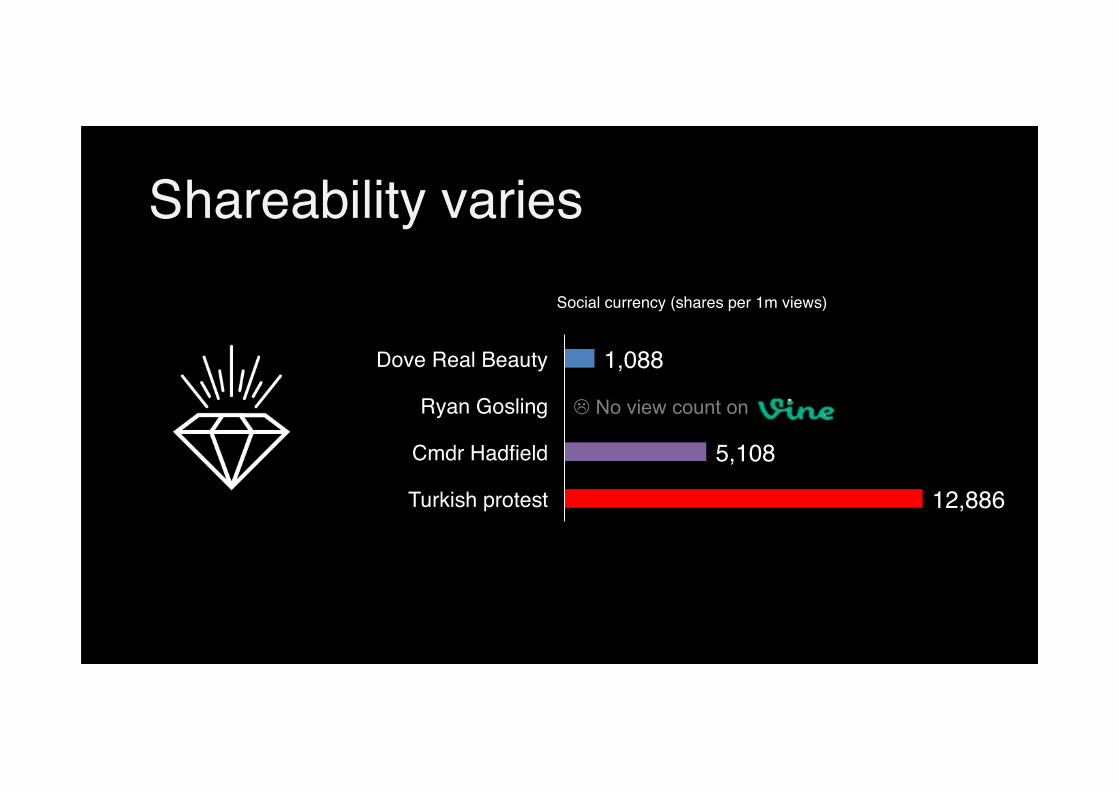
1,088!
5,108!
12,886!
Dove Real Beauty!
Ryan Gosling!
Cmdr Hadfield!
Turkish protest!
Social currency (shares per 1m views)!
Shareability varies!
L No view count on
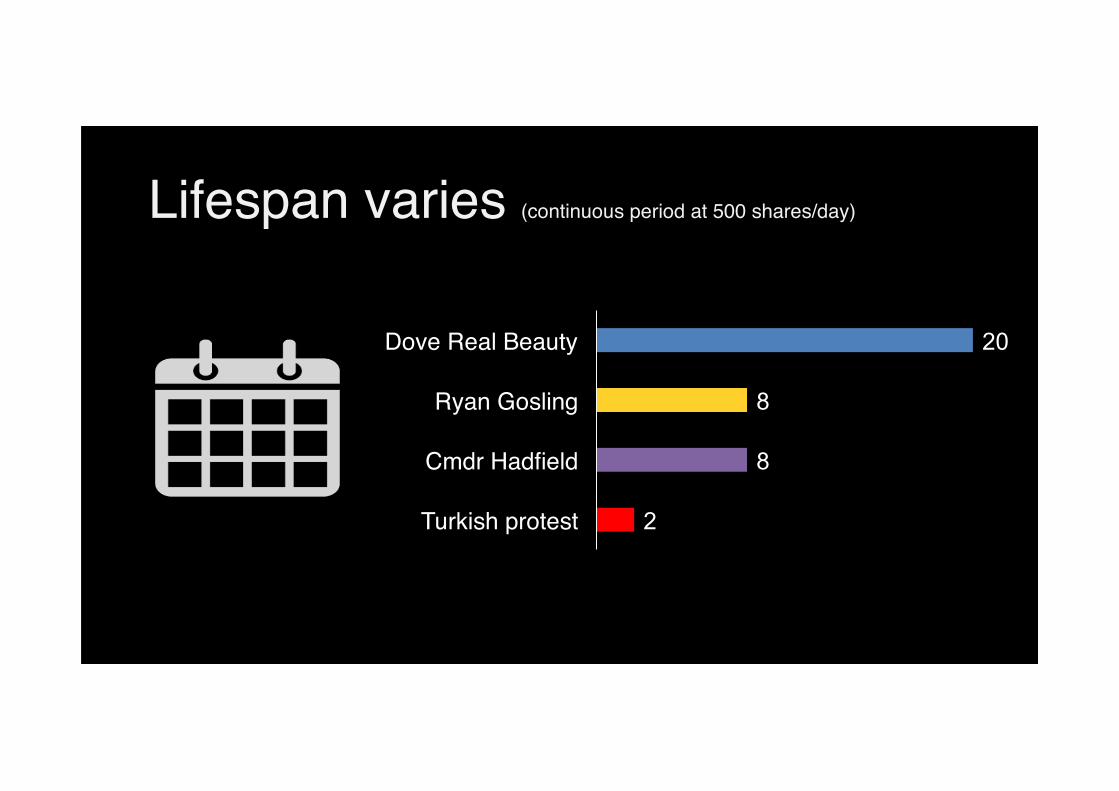
20
8
8
2
Dove Real Beauty!
Ryan Gosling!
Cmdr Hadfield!
Turkish protest!
Lifespan varies (continuous period at 500 shares/day)!
Although none of the variables alone
proved useful to identify a viral phenomenon, all of them correlate around
two main models of viral spread

Spikers vs Growers! High Volatility"Fast to Peak High Velocity High Shareability Shorter Lifespan
Lower Volatility"Slower to Peak Lower Velocity
Lower Shareability Longer Lifespan

But what makes a meme spread along the
first or the second model?
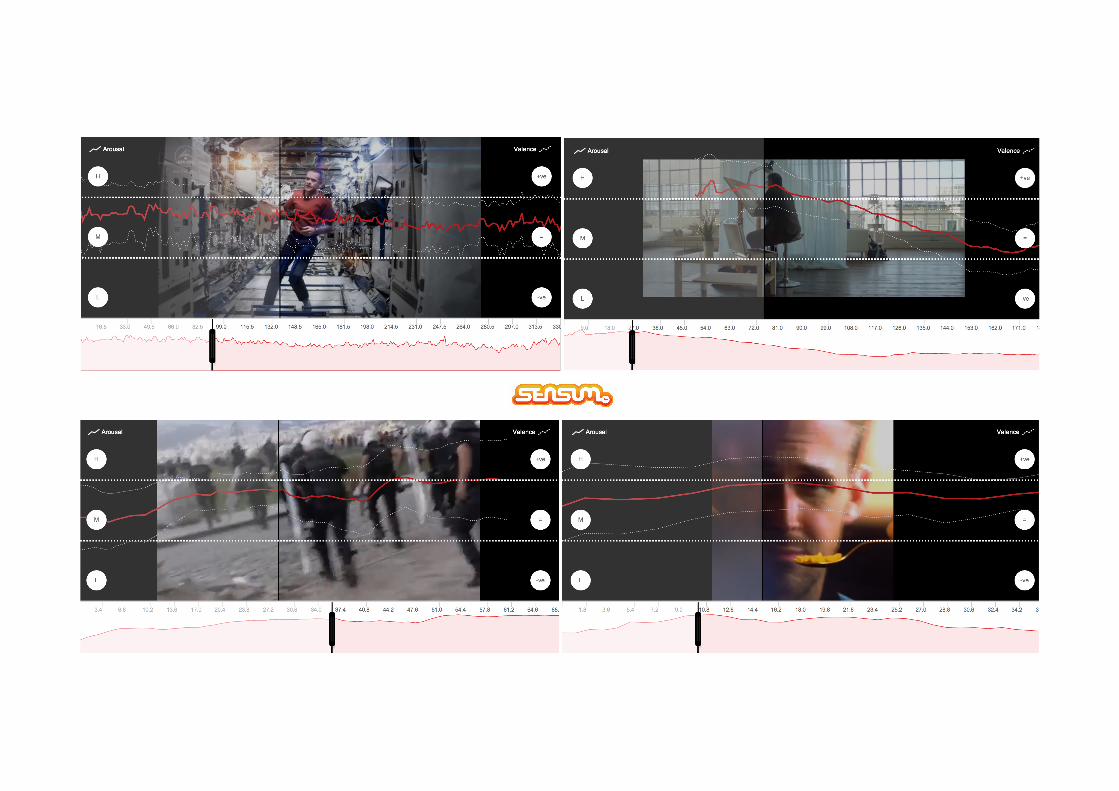
All the videos stimulated a similar higher than average
emotional reaction."
(52-56/100 Sensum Score / Based on GSR).
So can the audience composition instead explain why
memes develop along one of the other model?
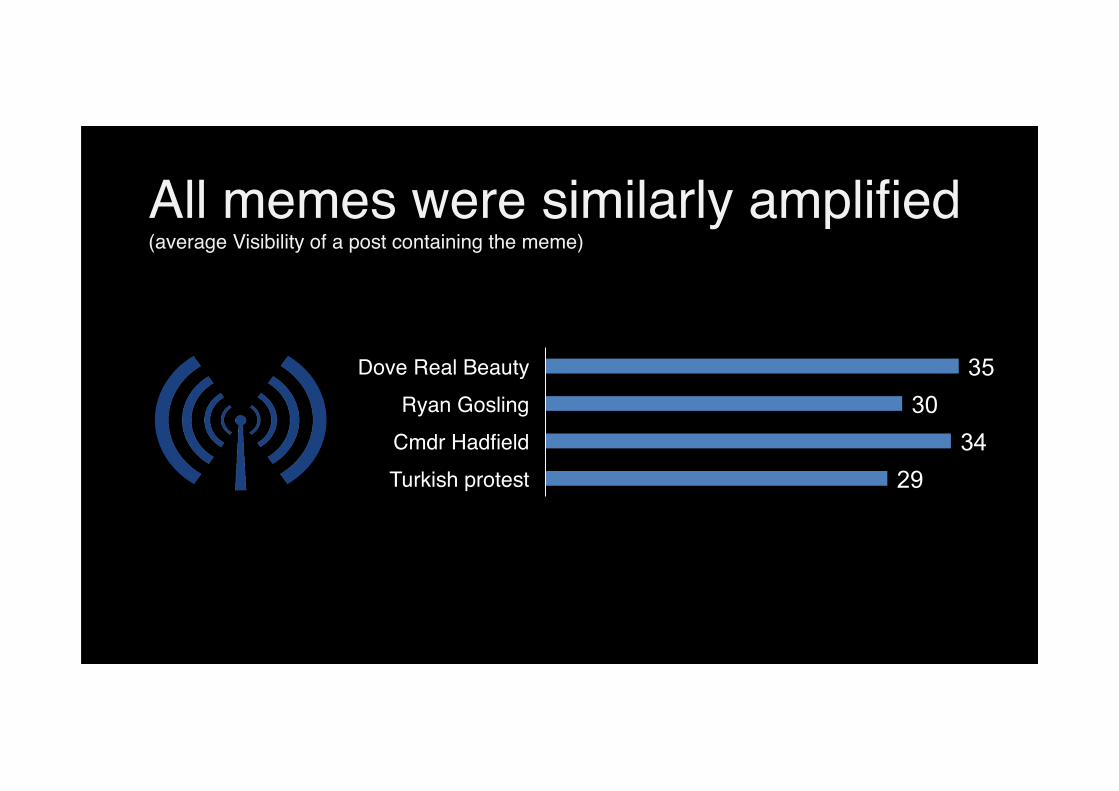
35 30
34 29
Dove Real Beauty!Ryan Gosling!
Cmdr Hadfield!Turkish protest!
All memes were similarly amplified (average Visibility of a post containing the meme)!
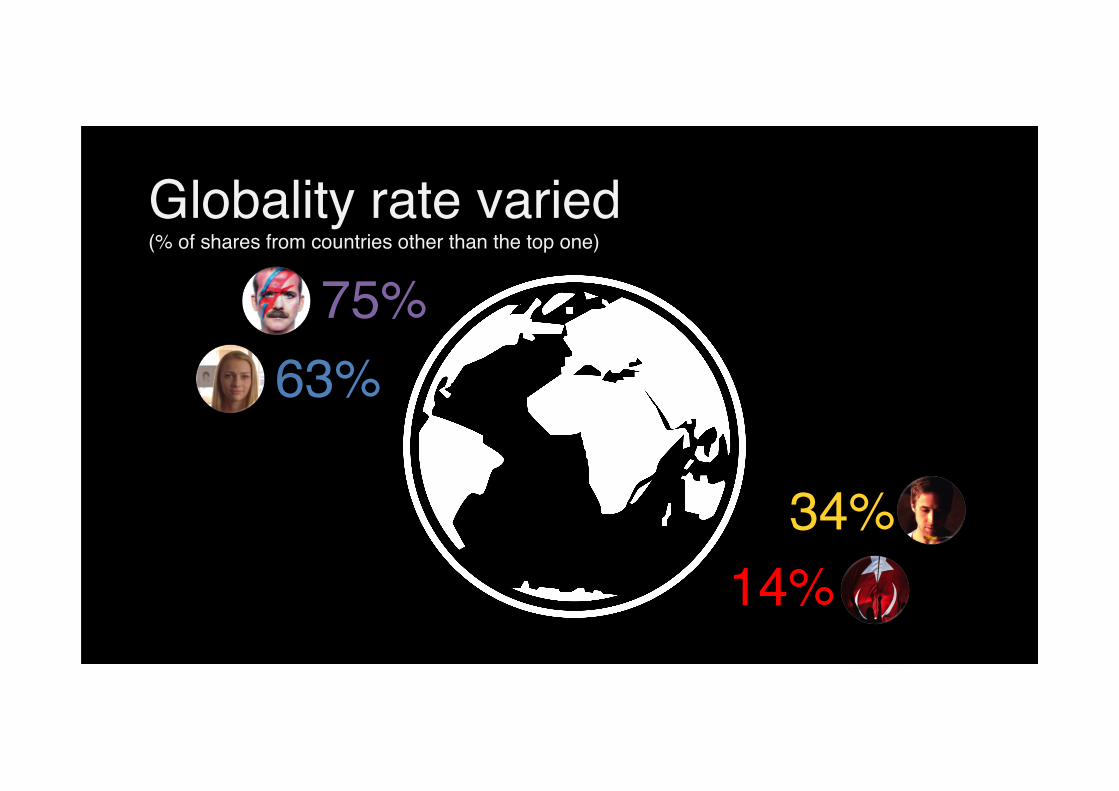
75%!
63%!
14%!
34%!
Globality rate varied!(% of shares from countries other than the top one)!
Since both Amplification and Globality
seemed not to correlate with one or the other model of virality we then looked at the
demographics engaged with each meme
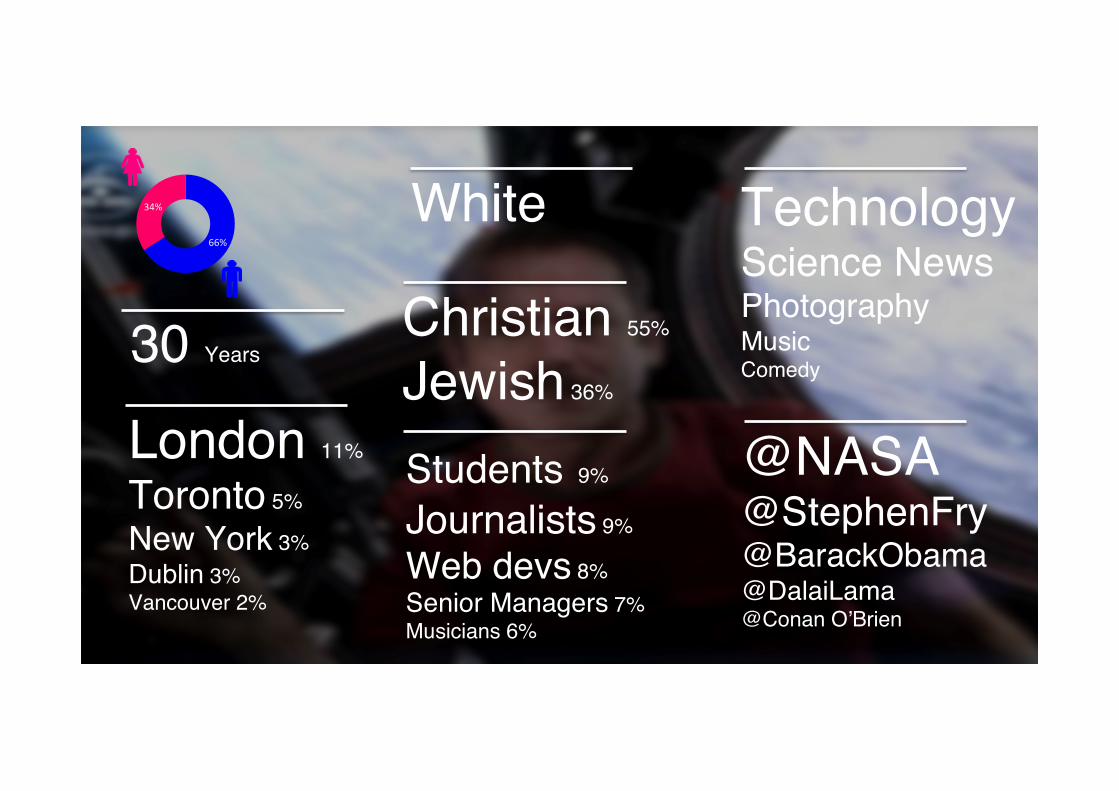
30 Years!
66%
34% White!
Christian 55%!
Jewish 36%!!
Students 9%!
Journalists 9%!
Web devs 8%!Senior Managers 7%!Musicians 6%!!
@NASA!
@StephenFry!
@BarackObama!@DalaiLama!@Conan O’Brien!!
Technology!Science News!
Photography!Music!Comedy!!
London 11%!
Toronto 5%!
New York 3%!Dublin 3%!Vancouver 2%!!
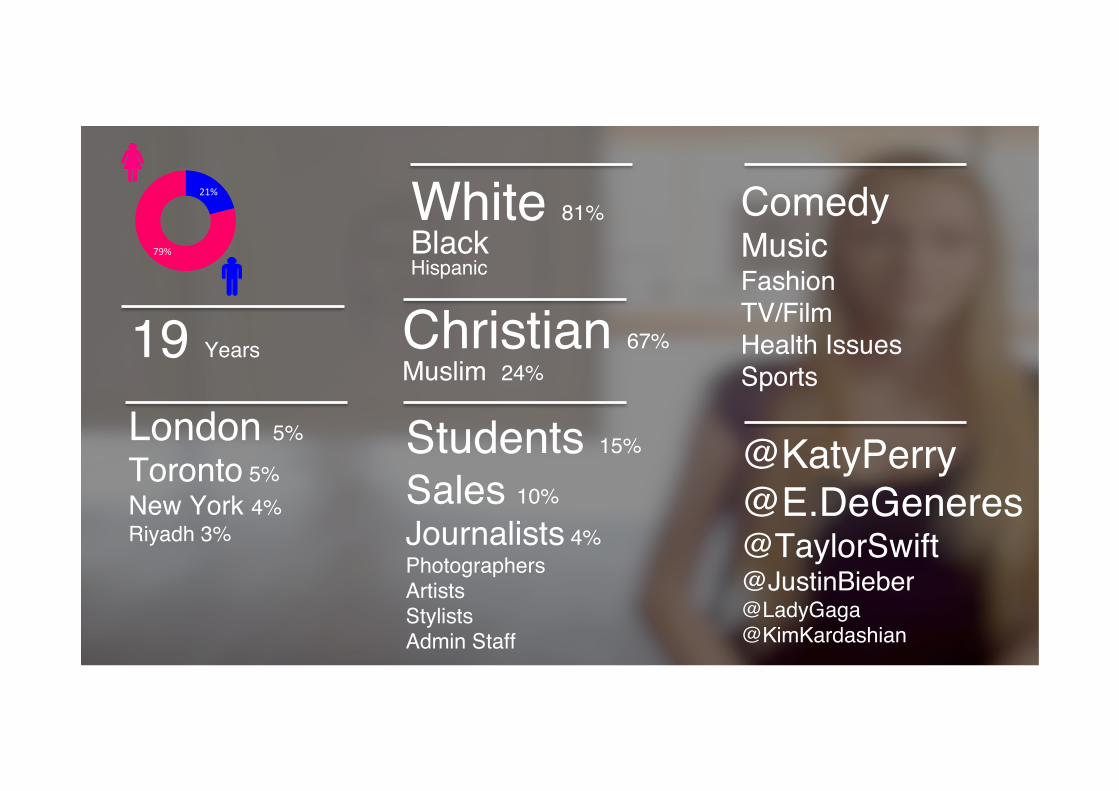
19 Years!
21%
79%
White 81% !Black!Hispanic!!
Christian 67%!Muslim 24%!!
Students 15%!
Sales 10%!
Journalists 4%!Photographers!Artists!Stylists!Admin Staff!
@TaylorSwift!@JustinBieber!@LadyGaga!@KimKardashian!!
Comedy!
Music!Fashion!TV/Film!Health Issues!Sports!!London 5%!
Toronto 5%!New York 4%!Riyadh 3%!
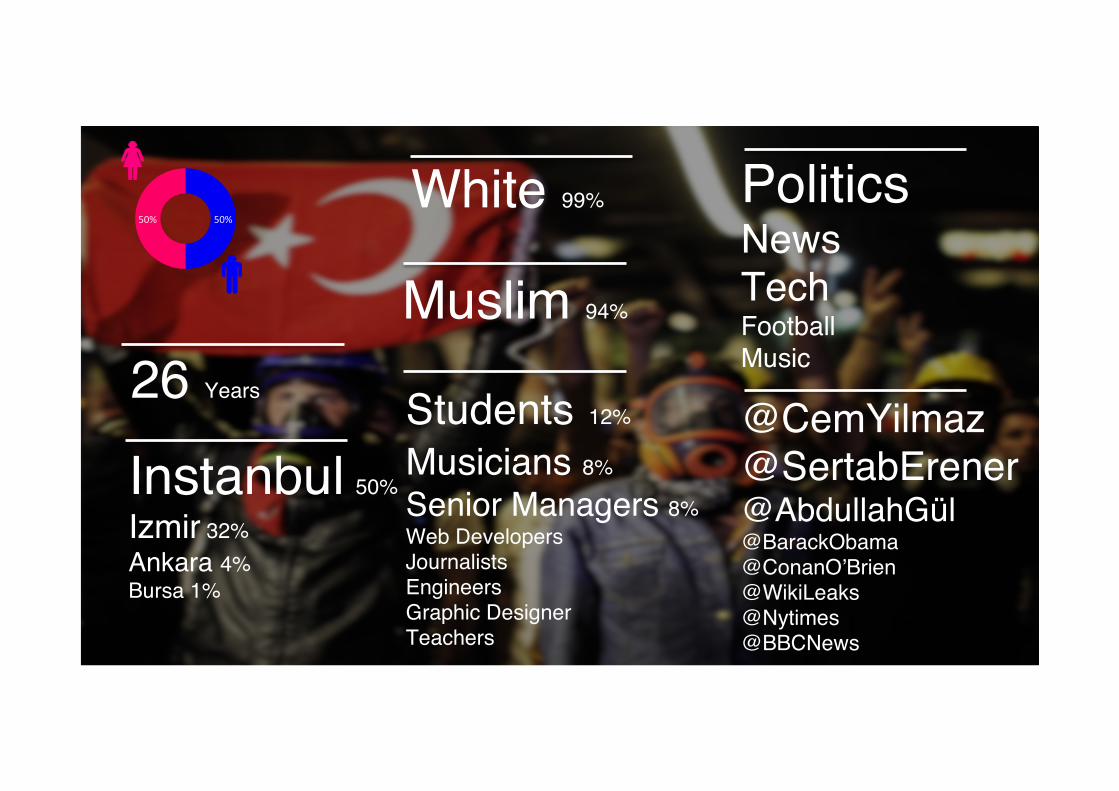
26 Years!
50% 50% White 99% !
Muslim 94%!!
Students 12%!
Musicians 8%!
Senior Managers 8%!Web Developers!Journalists!Engineers!Graphic Designer!Teachers!
@CemYilmaz!@SertabErener!@AbdullahGül!@BarackObama!@ConanO’Brien!@WikiLeaks!@Nytimes!@BBCNews!!
Politics!News!Tech!Football!Music!!
Instanbul 50%!
Izmir 32%!Ankara 4%!Bursa 1%!
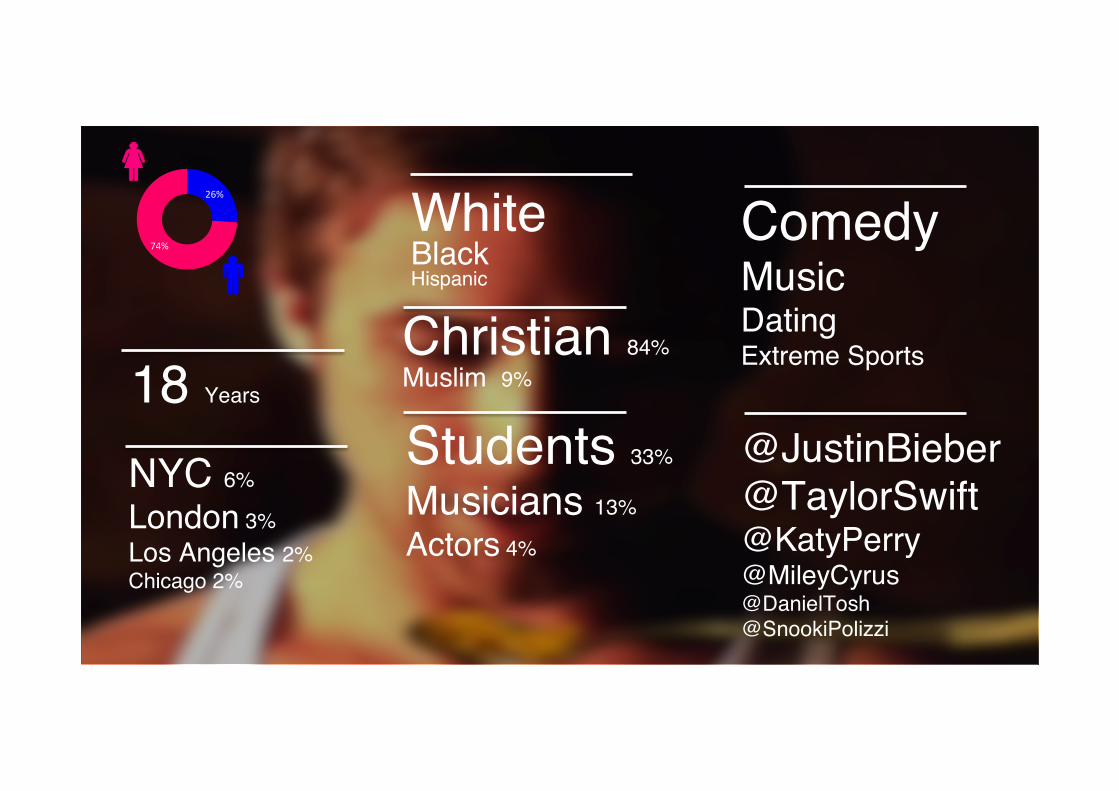
18 Years!
26%
74%
White !Black!Hispanic!!
Christian 84%!Muslim 9%!!
Students 33%!
Musicians 13%!
Actors 4%!
@JustinBieber!@TaylorSwift!@KatyPerry!@MileyCyrus!@DanielTosh!@SnookiPolizzi!!
Comedy!Music!
Dating!Extreme Sports!!
NYC 6%!
London 3%!Los Angeles 2%!Chicago 2%!
As we couldn’t find any correlation between demographic traits and virality models we then turned to the structure of
the audience by mapping the social graph (followers/friends) of the people who shared the meme
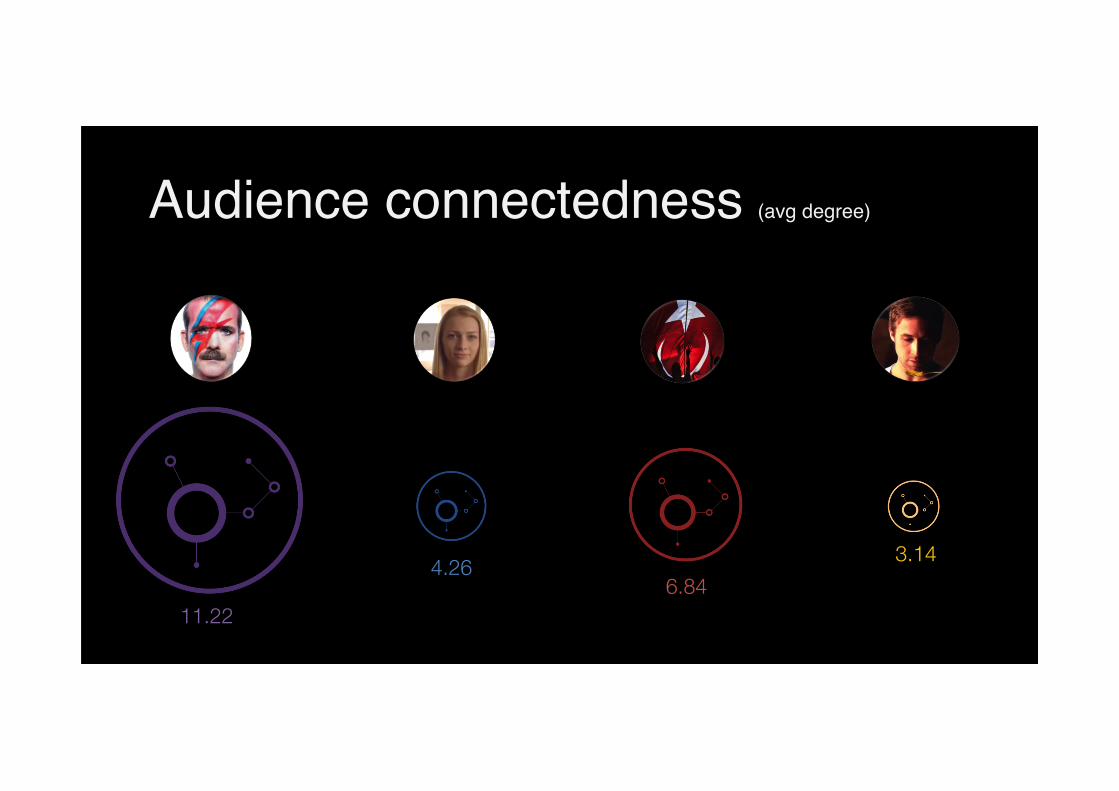
11.22 6.84
Audience connectedness (avg degree)!
4.26 3.14

Highly connected audiences (higher average degree in the audience network)
make the meme spread faster
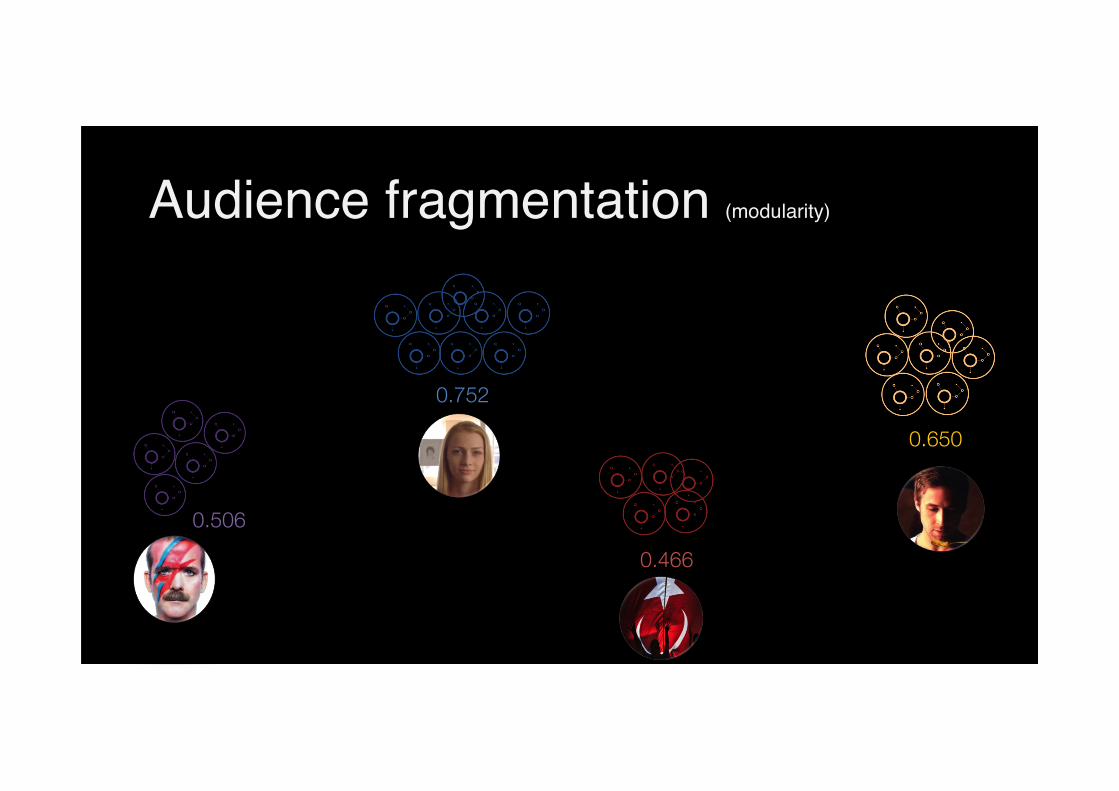
0.506
0.466
Audience fragmentation (modularity)!
0.752
0.650
High audience fragmentation into sub-communities (high modularity of the audience
network) makes the meme spread slower
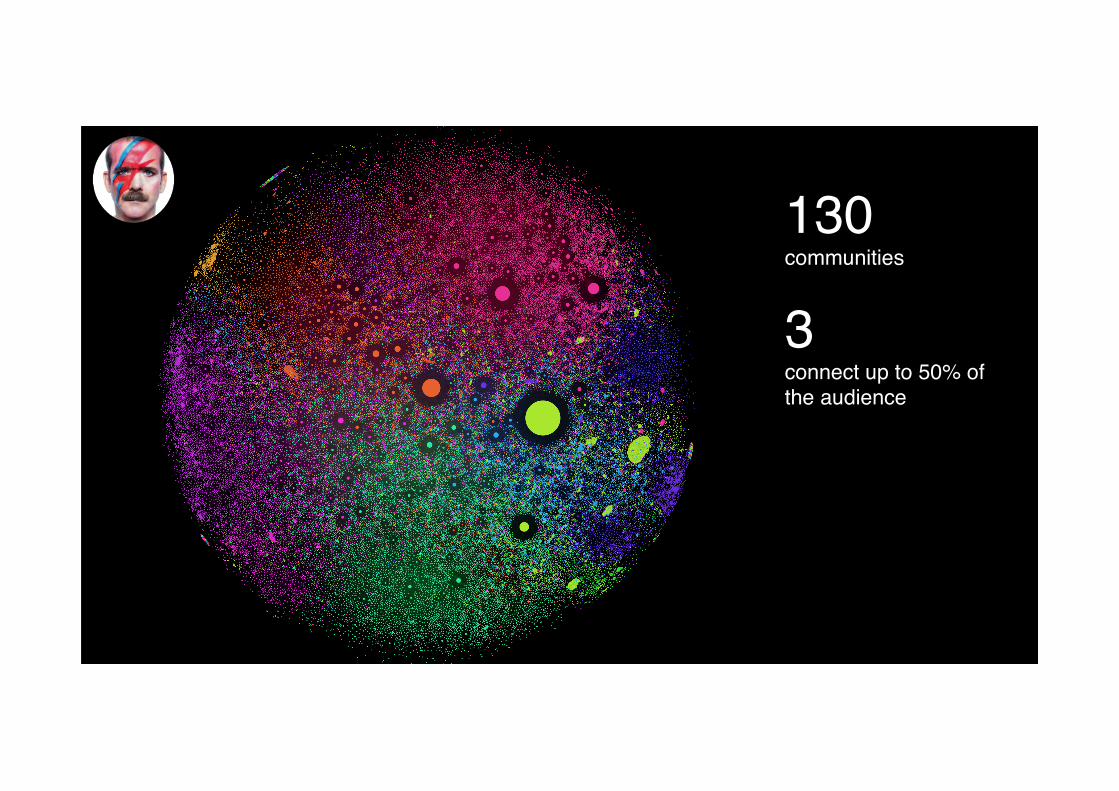
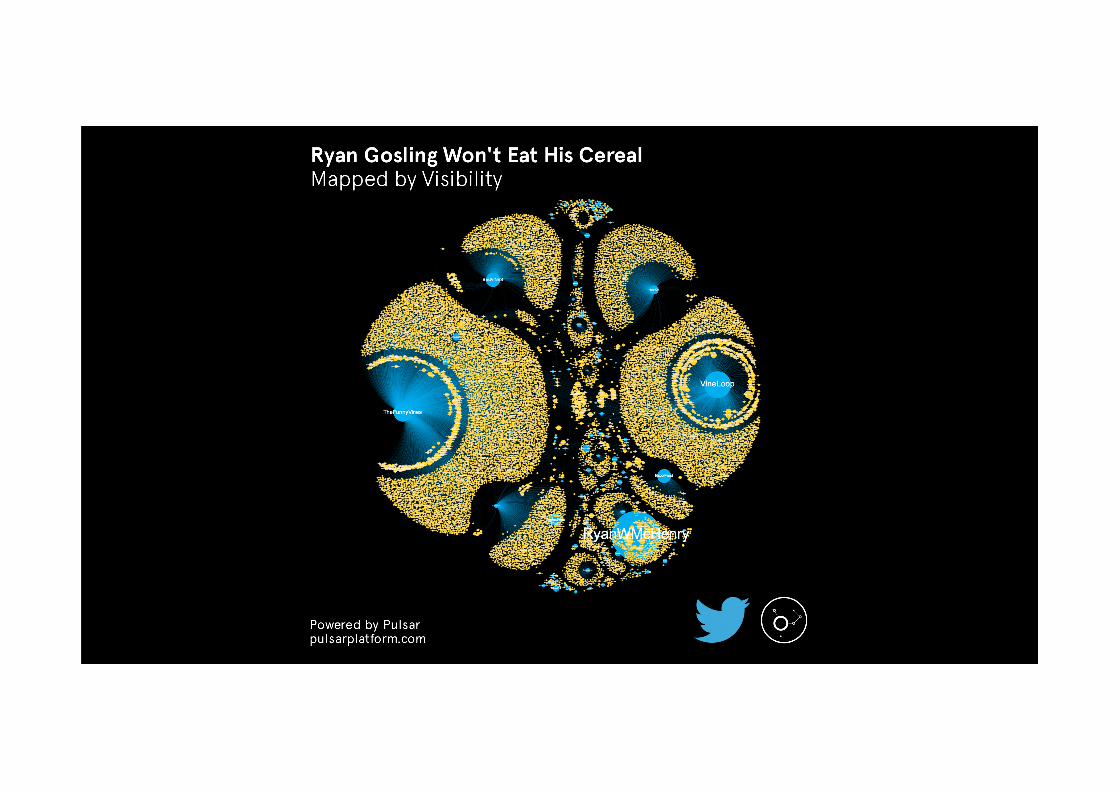
130 communities!!
3 !connect up to 50% of the audience!
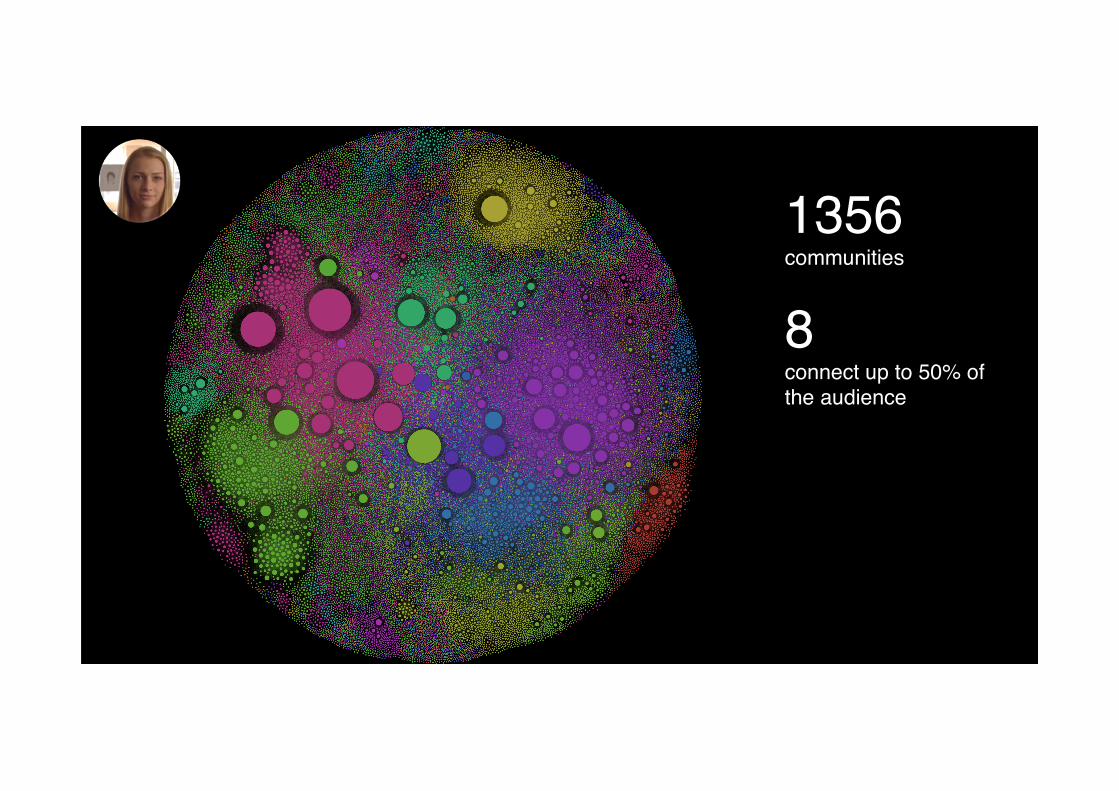
1356!communities!!
8 !connect up to 50% of the audience!
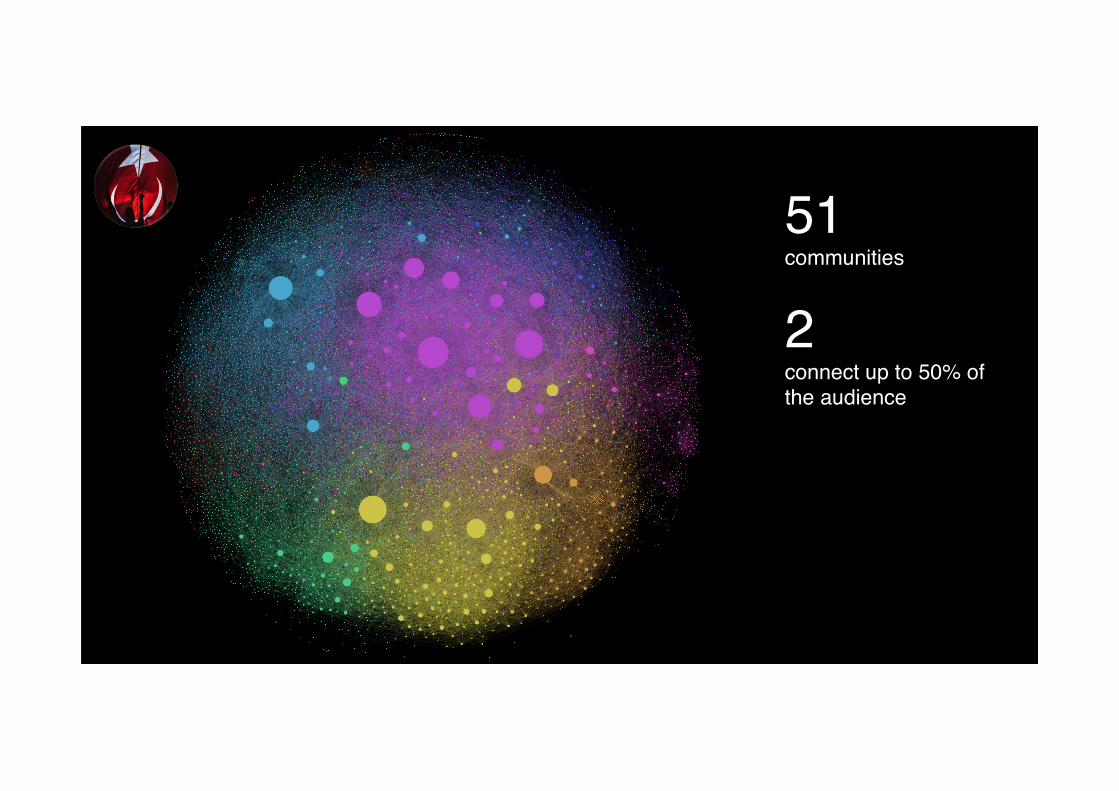
51!communities!!
2!connect up to 50% of the audience!!
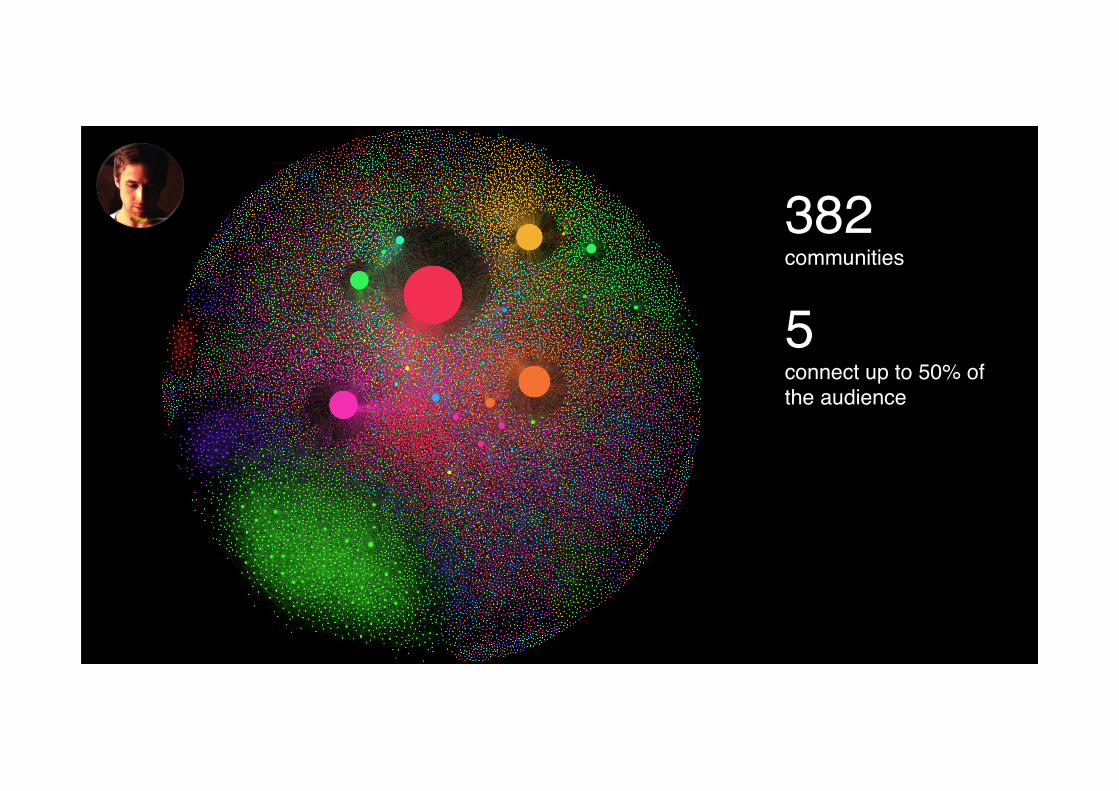
382!communities!!
5 !connect up to 50% of the audience!!
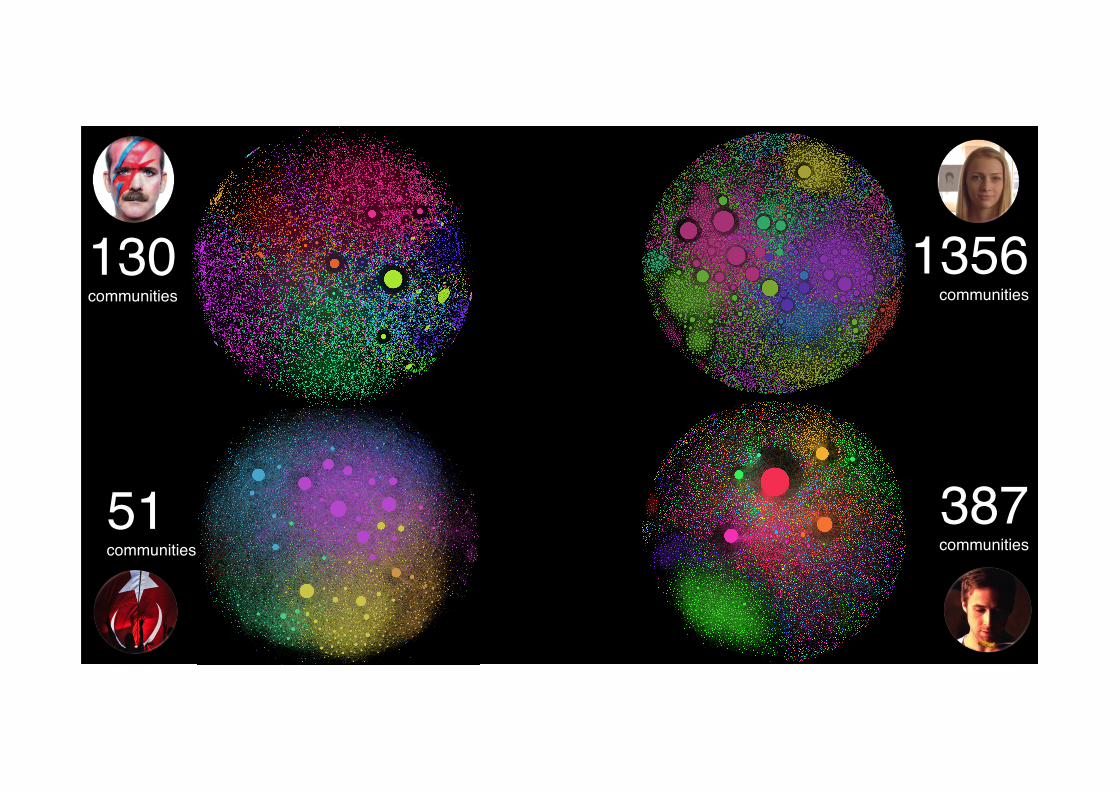
130!communities!
51!communities!!
1356!communities!
387!communities!
But what is causing higher or lower fragmentation within an audience?
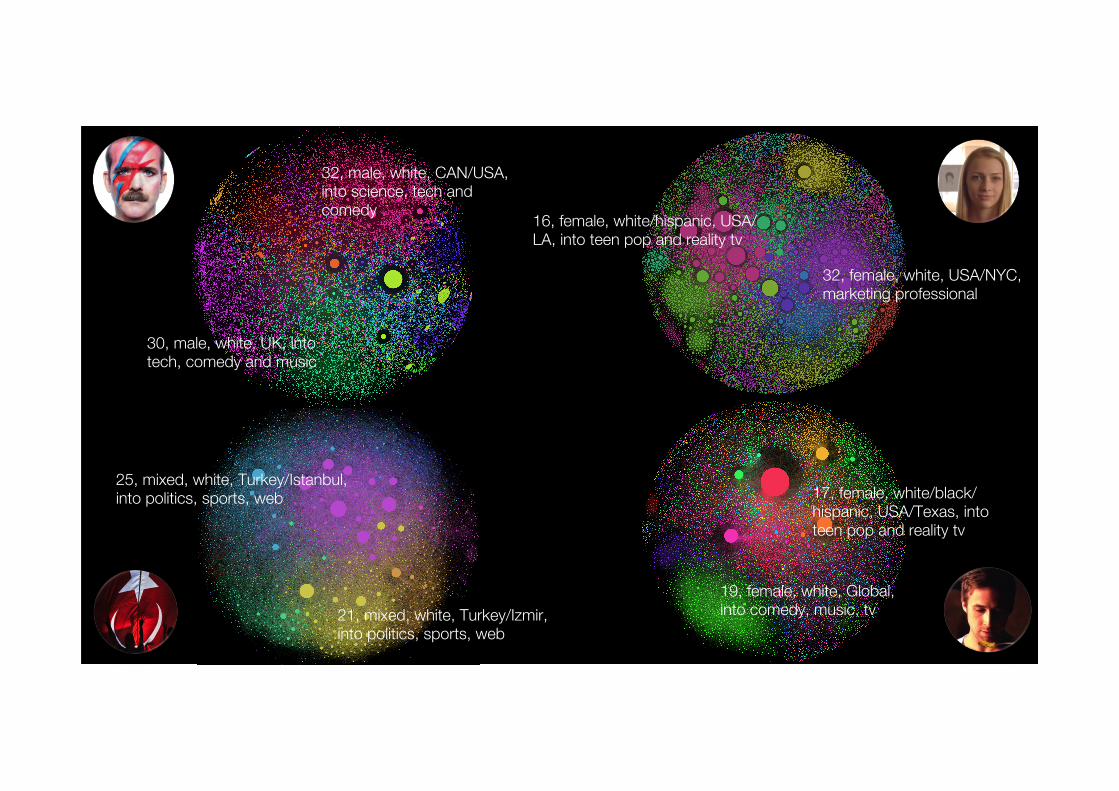
32, male, white, CAN/USA, into science, tech and comedy
30, male, white, UK, into tech, comedy and music
32, female, white, USA/NYC, marketing professional
16, female, white/hispanic, USA/LA, into teen pop and reality tv
25, mixed, white, Turkey/Istanbul, into politics, sports, web
21, mixed, white, Turkey/Izmir, into politics, sports, web
17, female, white/black/hispanic, USA/Texas, into teen pop and reality tv
19, female, white, Global, into comedy, music, tv
High demographic diversity correlates with high modularity and slower meme velocity
So, what’s the point?!
There is no such thing as “virality”


“Virality” is a relative concept depending on the audience of reference
“Virality” is not just a property of the content, it’s also a property of the audience.
Or as Jonah Peretti put it, Virality is 50% great content
and 50% distribution
Great content spreads fast or slow depending on the shape of your audience and how you are leveraging it with your
distribution strategy
The audience you are trying to reach is fragmented into sub-communities of age, profession, interest

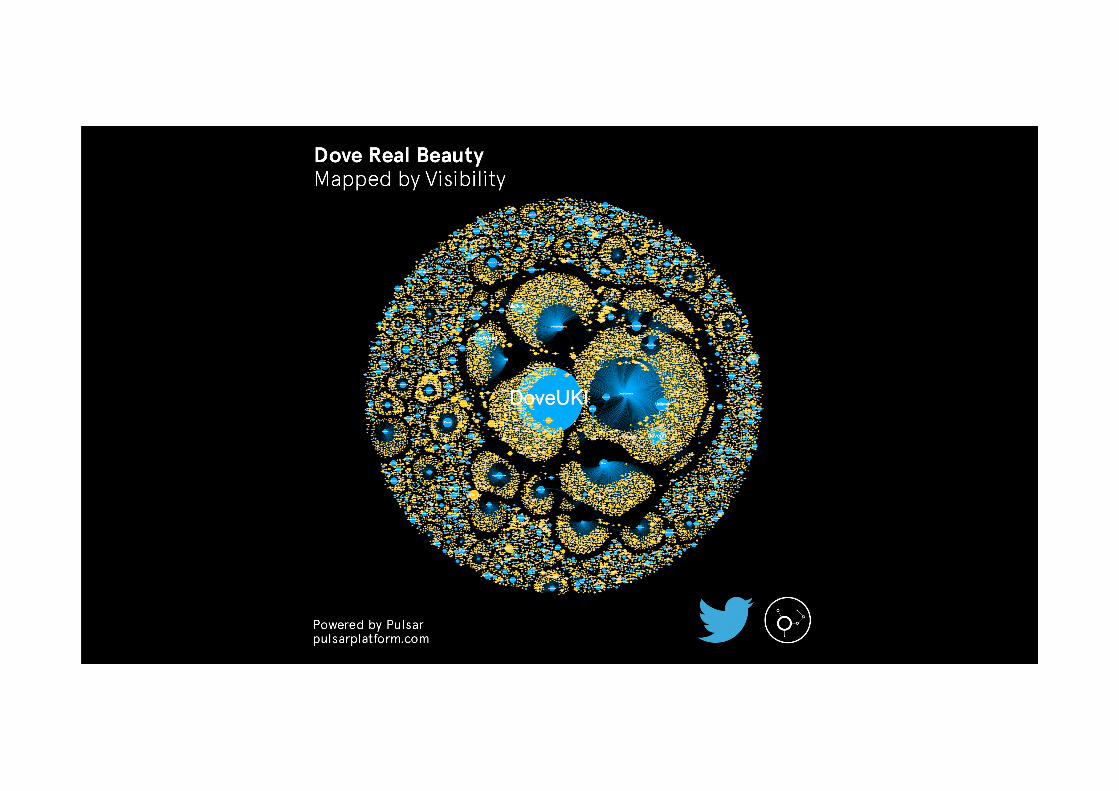
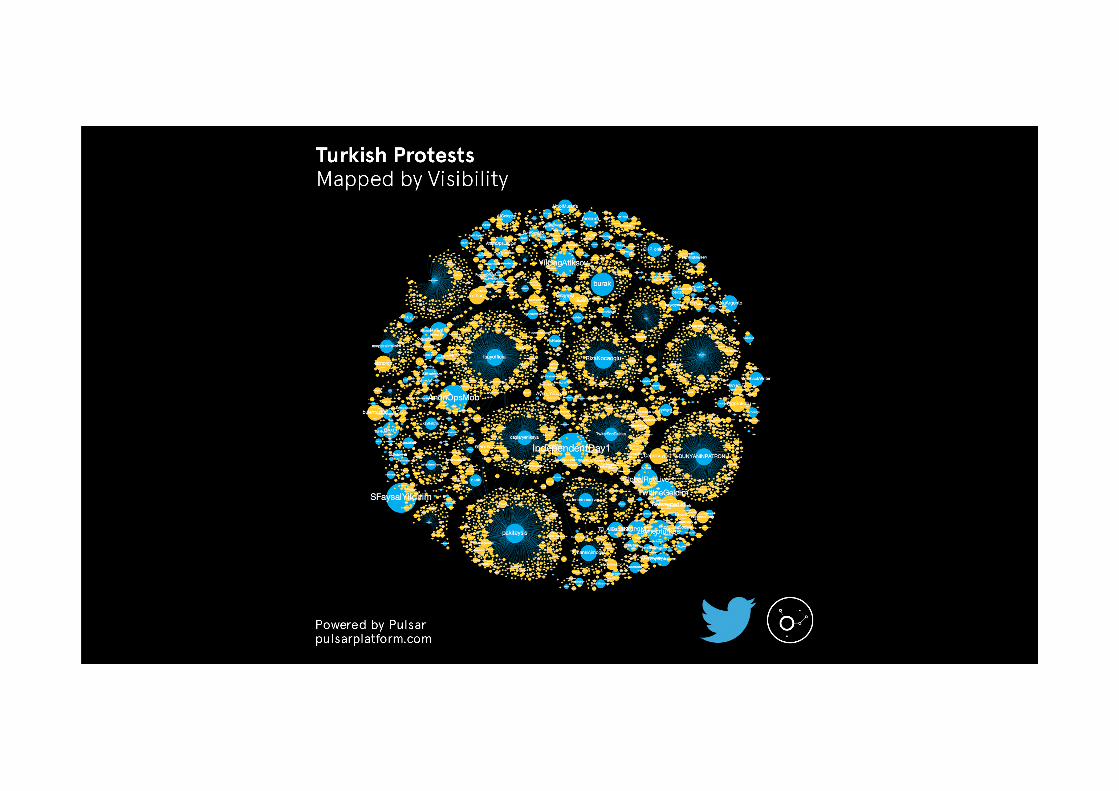
Using network analysis you can identify these communities by mapping the social graph of your target audience
The broader the appeal of your content the more fragmented your audience is going to be
The more fragmented the audience, the more targeted the distribution needs to be
Wide appeal = Grower = spend more on seeding strategy to connect communities and sustain diffusion over time
Narrow appeal = Spiker = spend more on community
management to absorb + amplify impact

So if you want your content to go viral, don’t just put the video out there and see what happens…
Study your target audience and plan your distribution strategy based on a community-map, not just on a list of
“influencers” (who might all be part of the same community)

Thank You!Francesco D’Orazio, @abc3d #SMWF NYC pulsarplatform.com Based on a study by Francesco D’Orazio (@abc3d) and Jess Owens (@hautepop)