how social status and scarcity affect the distribution of ...wow4/papers/dexelle_wow4.pdfcomments of...
TRANSCRIPT

0
Water Sharing in Rural Africa:
The Behavioral Relevance of Scarcity and Social Status
Ben D’Exelle ac, Els Lecoutere b and Bjorn Van Campenhout c
ABSTRACT
Making use of a repeated distribution game experiment, we investigate how African
peasants distribute and enforce water access in irrigation schemes. Two questions are
addressed. First, we investigate the influence of scarcity by comparing a treatment of
abundant water availability with a treatment where water is insufficient for both players
to reach a minimum production threshold. Second, we study to what extent social
status influences distribution and enforcement of water access. For this, we
complement the experimental data with data from a social status ranking exercise.
JEL classification: D74, C93
Keywords: Distribution of irrigation water; Social status; Scarcity; Field experiment; Tanzania
a Radboud University, Center for International Development Issues, The Netherlands
b Ghent University, Department of Third World Studies, Conflict Research Group, Belgium
c University of Antwerp, Institute of Development Policy and Management, Belgium

1
1. Introduction1
Rural African societies are characterized by strong egalitarian norms. Highly personalized
and intense interaction stimulates interpersonal comparison, so that economic differentiation
arouses strong feelings of envy (Platteau and Abraham, 2002). To the extent that this
induces people with individual progress to share their surplus with the rest of society2, this
may be advantageous for the poorest sectors of society. However, it may also hamper
individual progress and hence be inimical to economic growth. With increasing outside
opportunities (e.g., education, market opportunities) the costs of such system in terms of lost
opportunities for individuals and the wider society may become extraordinary large. When
disadvantages outweigh advantages egalitarian norms may lie at the basis of a real poverty
trap.
The prevalence of strong egalitarian norms may hamper economic growth in at least two
ways. First, people may try to evade their sharing obligations and prefer investments of
which the returns are non-sharable. By limiting the range of investment options, this may
then hamper economic growth (di Falco and Bulte, 2009). Second, when distributing
resources, egalitarian norms may make people refrain from keeping larger than equal
shares to themselves, even in absence of zero-sum situations (i.e. when keeping larger
than equal shares does not affect the share of others). Sticking to the equal split may
therefore lead to large forgone benefits. This will be the key entry-point of the paper.
To improve our understanding of the conditions that induce people to prefer equal
sharing above individual progress in absence of negative-sum situations and thereby forgo
1 We acknowledge financial support from the Institute of Development Policy and Management (University of Antwerp), Ghent University, MICROCON and the Fonds voor Wetenschappelijk Onderzoek. We are also grateful for the support by Incomet 2001 and the excellent field support by Charles Kyando. This research received research clearance from the Tanzania Commission for Science and Technology (COSTECH) and the Mufindi district council. We also benefitted from comments of Rembert De Blander and Franz Palm, as well as participants at the 2009 CSAE Conference at Oxford University.
2 For a more elaborated view on the economy of village societies see Platteau (2006) who models them through repeated play of social exchange games
2
large efficiency gains, a thorough comprehension of the behavioral complexity of distribution
processes in these societies is essential. In this paper, we look at distributive behavior in
rural African societies, and how it is shaped by two variables we expect to have strong
behavioral relevance in these societies. First, the prevalence of sharing norms does not
imply absence of social differentiation. Despite relatively low economic differentiation in rural
African societies, substantial differentiation tends to exist on social status. As sharing
economic surplus with others is a highly praised behavior, it provides the basis of social
prestige and esteem (Platteau and Abraham, 2002). To the extent that social status
influences one’s agency and capabilities it may be behaviorally relevant for the distribution
and enforcement of economic resources. Second, rural Africa is not only confronted by
persistent and widespread poverty, it regularly faces acute resource scarcity due to climate
shocks, collapsing markets, etc. Increased resource scarcity may increase competition and
justify deviations from equal sharing.
In this study, we translate this setting to the distribution of irrigation water in rural
Tanzania. 76.2% of the population is dependent on agriculture in this country (World Bank,
2007). A controlled water supply is essential for agricultural production. Irrigation water is
mostly distributed through informal irrigation schemes3.
Recent case studies on informal irrigation schemes in Eastern Africa (Fleuret, 1985;
Adams et al., 1997; Potkanski and Adams, 1998; Maganga, 2002; Cleaver and Toner, 2006;
Carlsson, 2003; Juma and Maganga, 2005) indicate that the distribution and enforcement of
access to irrigation water tends to be rooted in local power structures, shaped by political
and/or socio-economic privileges. This justifies our focus on the behavioral influence of social
status in such setting. Also scarcity is a very relevant element in irrigation schemes. Tropical
climate in sub-Saharan Africa typically consists of an alternation of wet and dry seasons. In
the dry season, water levels drop drastically and may be insufficient to sustain a minimal
production for all irrigation users. This may induce upstream irrigation users to keep more
3 These are defined as locally constructed gravity flow systems diverting water from a river into a system of canals (Mkavidanda and Kaswamila, 2001; Majule and Mwalyosi, 2003).

3
than equal water shares. Moreover, climate change is thought to bring about increasing
water scarcity (IPCC, 2008), tightening competition, and potentially leading to higher
incidence of resource conflicts. These forecasts add to the need to comprehend how people
appropriate and enforce entitlements to irrigation water under scarcity.
To comprehend the complex interaction between the decisions of upstream water users
on irrigation water extraction (which has direct consequences for the water availability of
downstream users) and the reaction of downstream users, we organized a field experiment.
In subsequent rounds, a permanent upstream user is asked to decide on the number of
hours to make use of a constant (irrigation) water flow. After each distribution decision, the
downstream user has the ability to remain silent, to react in the form of expressing
(dis)satisfaction or to engage in costly punishment of the upstream user. To study how social
status influences water distribution and enforcement in rural Africa, we complement the data
from the distribution experiment with data from a social status ranking exercise. To study the
effect of scarcity, we compare between a treatment with abundant water availability and a
treatment where water is insufficient for both players to reach a minimum production
threshold.
The distribution game experiment we used bears considerable resemblance to the
intensively studied ultimatum game (Güth et al., 1982). Several extensions to the basic
ultimatum game have looked at the importance of individual heterogeneity in culture (Henrich
et al., 2004), age (Murnighan and Saxon, 1998; Harbaugh et al., 2002) and gender (Cox and
Deck, 2006). Up to now almost no attention has been paid to heterogeneity in social status4
in experimental distribution games. An interesting exception is a study of Ball and Eckel
(1998). They artificially introduced social status in ultimatum games by randomly assigning
participants a high or low social status, which is publicly known. Our setup, however, uses
real-life heterogeneity in social status.
4 Social status can be defined as the honor or prestige attached to one’s social position, that is the position one occupies within a vertical social hierarchy in a society (Lindemann, 2007). This overlaps largely but not necessarily with economic positions.

4
Another innovation is the simulation of scarcity within a distribution setting. Up to our
knowledge no experimental studies have allowed for this possibility. Where people need a
minimum share to guarantee income, scarcity may increase competition, leading to more
unequal distributions and higher rates of rejection. However, because of the repeated
character of our game rotation strategies may again equalize shares over time.
The main results are the following. We observe that the equal split of irrigation water
prevails in the abundance treatment. Even in a treatment that simulates acute water scarcity,
equal sharing remains the most preferred option, despite the very high foregone efficiency
gains. At the same time, however, the average number of hours for the upstream user is
significantly higher in the scarcity treatment, which leads to a higher proportion of unequal
distributions. This in turn entails higher dissatisfaction rates by downstream users, but leaves
punishment rates unaffected. Furthermore, rotation significantly increases under the scarcity
treatment.
With respect to the individual behavior of downstream users, in both treatments more
disadvantageous inequality increases the likelihood that downstream users opt for the
punishment strategy. In the scarcity treatment this effect is weaker for downstream users
with lower social status. In the scarcity treatment more disadvantageous inequality also
increases the likelihood of remaining silent versus expressing satisfaction, effect which is
again lower for low status players. Finally, in the scarcity treatment downstream users with
lower social status are less inclined to express dissatisfaction in comparison with remaining
silent, irrespective of the distribution decision of the upstream user. This suggests
downstream users with lower social status are less capable of or used to open discussion.
With respect to the individual behavior of upstream users, three groups can be
distinguished. One group sticks to the altruistic strategy, whereas another group perseveres
with the selfish strategy, irrespective of the reaction of downstream users. A third group
rotates between both strategies. The latter two groups are more prominent among users of
higher social status.

5
2. Research design
In this section, we describe the main features of our research design, which basically
consists of a social status ranking exercise, followed by a distribution game experiment.
Thereafter, we elaborate the main research hypotheses we will address.
2.1. Research instruments
In a first visit to the irrigation systems in the selected Tanzanian villages, we conduct a social
status ranking exercise. In each irrigation scheme, we invite twenty individual irrigation users.
With the support of the local executive officer, we look for participants with very different
socio-economic characteristics, in an attempt to maximize diversity. The participants are
randomly divided in four groups. Each group is asked to rank all members of the irrigation
scheme5 according to their social status. To avoid embarrassment, overestimation or
underestimation of one’s own social status, the participants are not expected to rank
themselves. For detailed instructions and procedures of this ranking exercise we refer to
appendix 1.
In a second visit, we conduct a repeated distribution game experiment of water
resources between upstream and downstream users. The upstream water user takes as
much water as he/she wants from a constant water flow, and what is left flows to the
downstream water user. In particular, the upstream user decides how many hours in a day
(of a maximum of 12 hours) s/he takes water from the irrigation canal. While the upstream
user taps water, there is assumed to flow no water to the downstream user. There is a direct
relation between water use and income, represented by the production function in Table 1.
As irrigation-dependent production requires a critical water input, this production function is
characterized by a threshold. This represents a minimum water condition below which
5 Most irrigation schemes can be attributed to a specific village or neighborhood and can be easily demarcated. The participants of the ranking exercise are asked to confirm that the irrigation users identified on a previously elaborated map are well known to them. The ones that are not known are not ranked.

6
production is equal to a low level irrespective of the exact water input. In addition, above this
critical water input, production shows decreasing marginal returns.
We compare an ‘abundance’ treatment with a ‘scarcity’ treatment. With water scarcity,
the water flow is reduced (approximately half as large as in the abundance treatment), so
that more hours are needed to reach the minimum production threshold. At the same time,
beyond this threshold, declines in marginal returns are less drastic with increasing number of
hours of water use. Parameters are so that, in the abundance treatment, total water
availability is sufficient for both water users to reach the minimum threshold water input,
whereas in the scarcity treatment, total water availability is insufficient for both users to reach
this threshold.
Table 1. Production function
Abundance treatment Scarcity treatment
Hours upstream user upstream downstream upstream downstream
0 50 500 50 350 1 50 500 50 325 2 50 475 50 300 3 50 450 50 250 4 175 425 50 200 5 250 375 50 125 6 325 325 50 50 7 375 250 125 50 8 425 175 200 50 9 450 50 250 50
10 475 50 300 50 11 500 50 325 50 12 500 50 350 50
After each decision made by the upstream user, the downstream user can react in the
following ways. First, (s)he can make use of a mediator who punishes the upstream water

7
user6. The cost of relying on the mediator is 30 TSH for the downstream user, whereas it
reduces the payoff of the upstream user by 100 TSH. Second, if not using the punishment
option, (s)he leaves individual pay offs unaffected and (s)he can choose between one of the
following communication options: communicate satisfaction, communicate dissatisfaction or
communicate nothing (and thus not react at all). Including different communication options
allows us to study more subtle behavioral reactions. We expect to observe some
heterogeneity within these non-punishment options, possibly related to varying individual
social status. This distribution game is repeated during five rounds in the abundance
treatment and ten rounds in the scarcity treatment.
2.2. Research hypotheses
Assuming (common knowledge of) narrow material self-interest, the only pure strategy
equilibrium of our distribution game is the following. As punishment is costly for both water
users, a downstream user would always refrain from punishing the upstream user
irrespective of the distribution. Consequently, the upstream user, anticipating this, will
appropriate as much water as to maximize her pay-off (i.e. at least 11 hours in the
abundance treatment and 12 hours in the scarcity treatment).
Such equilibrium, however, has been consistently refuted by numerous ultimatum game
experiments, where the mean of the proposals is around 40% of the available amount and
the mode is the equal split. At the same time, most offers of less than 20% are rejected by
the responder (Camerer and Thaler, 1995; Henrich et al., 2004). Recent models of inequity
aversion (e.g. Fehr and Schmidt, 1999; Bolton and Ockenfels, 2000) and reciprocal fairness
(e.g., Dufwenberg and Kirchsteiger, 2004; Falk and Fischbacher, 2006) have rationalized
such behavior. The results of ultimatum game experiments in small-scale communities,
bundled in Henrich et al. (2004), and Platteau (2000) who pointed to strong egalitarian norms
6 We do not frame it as direct punishment, which would be a too intrusive mechanism in these societies. Instead, downstream users are told they can rely on a local mediator who would then punish the upstream user.

8
in African rural societies, make us expect that also in our distribution game experiment many,
if not the majority, participants will opt for equal sharing7.
There may, however, be a significant difference between a situation where water is
abundantly available and a situation of water scarcity. Not only are the stakes lower in the
latter situation, which may influence the range of acceptable offers (on this see e.g.
Cameron, 2007). More importantly, however, is the fact that in times of scarcity water levels
are insufficient for both water users to reach the critical water input. The upstream user could
still propose the equal split, but the opportunity cost of doing so (in terms of foregone
efficiency gains) would be much larger than in the abundance treatment. People may not
only look at their share relative to the share of others, but also what they could have
obtained, i.e. what they give up if maintaining equality. This may induce upstream users to
keep more than equal water shares. This is the first hypothesis that we will test in the
empirical section (hypothesis 1).
Yet, thanks to the repeated character of the distribution game, rotation as to whom
receives a share beneath the critical water input, may again equalize the returns over time.
By elevating the received water for one of the irrigation users above the minimum threshold,
such strategy may lead to substantial efficiency gains. Whether people give up short term
equality to increase the cake and follow certain rotation schemes is then expected to depend
on trust and reciprocity between the agents involved. As only in the scarcity treatment such
rotation increases efficiency (in the abundance treatment the equal split is also the most
efficient one for society), we expect this strategy to be most prevailing in this treatment
(hypothesis 2).
Besides the influence of scarcity on people’s behavior, it seems intuitive that people’s
behavior also differs in dependence of their individual social status. We are confident that we
are able to test such influence in a controlled behavioral experiment. As indicated by
7 This may be even more the case in Tanzania, where socialism and the legacy of President Nyerere have put a lot of emphasis on an egalitarian society and possibly solidified egalitarian sharing norms.

9
Cardenas and Ostrom (2004) and Cardenas (2003), people who participate in behavioral
experiments together with others whom they interact with in daily life, tend to bring their
relative socio-economic position into the game.
Social status may be active in different and competing ways. For downstream users, we
distinguish between the influence it exerts on their satisfaction levels and the influence on the
actual decisions they make. First, as downstream users with lower social status have often
an economically less favorable position, following general fairness principles they may only
be satisfied with proportionally larger shares of the water resources in order to correct initial
inequalities. At the same time, however, lower social status may involve lower self-esteem
and pride. Following the study of Pillutla and Murnighan (1996) who rationalize rejection
behavior in ultimatum games as a result of ‘wounded pride’, downstream users with lower
social status may remain satisfied with shares higher social status users would be
dissatisfied with. The latter will be tested as hypothesis 3.
Second, social status may not only influence satisfaction levels of downstream users, but
also their ultimate decisions. Downstream users with lower social status may be less used to
open discussion and their lower social status may go with a feeling of powerlessness to
successfully influence other people. This makes them more reluctant to directly communicate
dissatisfaction or to use the punishment option (hypothesis 4).
Social status may also influence the behavior of the upstream user. Ball and Eckel
(1998) who randomly assigned participants in ultimatum games a high or low (publicly
known) social status found that the generosity of both high and low social status proposers
increases with the social status of the respondent. This suggests that people find that high
social status respondents ‘deserve’ more, and/or that they expect them to ‘demand’ more.
Although the participants in our distribution game do not know whom they are paired with
(and thus do not know the social status of their opponent), such effect might still be at work,
as someone who perceives him/herself as having a relative low social status is more likely to
expect his/her opponent to have a higher social status.

10
The behavior of upstream users may also directly depend on their own social status.
Higher social status may induce them to be less generous. This is suggested by recent
experimental studies that focused on power and economic endowments, both different from
social status, yet strongly correlated with it. Armantier (2006) found in a repeated ultimatum
game with endowment inequality between proposers and respondents that rich proposers
were less generous. Participants with higher endowments have a better fall-back position
which gives them more bargaining power. Similarly, Hoffman and Spitzer (1985) found that
more powerful participants claim larger shares. They introduced power through a separate
game prior to the real bargaining game, which made participants earn the position of first
mover. Together, the evidence of both studies makes us expect that upstream users with
higher social status will be less generous than upstream users with lower social status. They
may also be less responsive to the reaction of downstream users. In particular, as
punishment reduces their pay-off they may persevere at keeping high shares to compensate
the lost income from being punished (hypothesis 5). Besides influencing the generosity of
distribution decisions, social status may also go together with certain propensity to follow
rotation strategies. In particular, upstream users with higher social status may be more
inclined to follow certain rotation in water distribution (hypothesis 6). Not only is their social
status often associated with leadership in the village which gives them certain responsibility
for the collective welfare. The generally better economic conditions they face may also make
them less vulnerable to possible defection by distrustful downstream users.
3. Results
In this section, we will present the main empirical results. The experiment was conducted in
Mufindi district, which is located in the Southern Highlands in Tanzania. Five irrigation
systems where traditional irrigation is practiced were selected. These irrigation systems are
11
located in the lowlands of the district which is characterized by a semi-arid climate8. In this
region agricultural income is highly dependent on irrigation water access, the more so in the
dry season when water becomes scarce (Mkavidanda and Kaswamila, 2001; Majule and
Mwalyosi, 2003; United Republic of Tanzania, 2006).
In total 156 irrigation users participated in 13 different sessions, distributed over the five
irrigations systems. We did not allow more than 14 participants in each session, so that we
could provide additional assistance to illiterate participants during the explanation of the
instructions9. Within these instructions we also included several control questions and
examples to ensure participants’ understanding. One third of the participants (52) were
female and average earnings were 2460 TSH, equal to 1.37 US$, i.e. around two days
average income. After the experiment, the participants were asked how much the experiment
reminded them of in real life. Only a limited 8.3% of the participants did not recognize
anything at all from real life. More detailed experimental procedures and the instructions can
be found in Appendix 2.
The rest of this empirical section is structured as follows. We start with a study of the
treatment effects in the decisions of both upstream and downstream water users. Thereafter,
we look more closely at the individual behavior of the downstream user. We end with some
explanatory models on the distribution behavior of upstream users.
3.1. Treatment effects
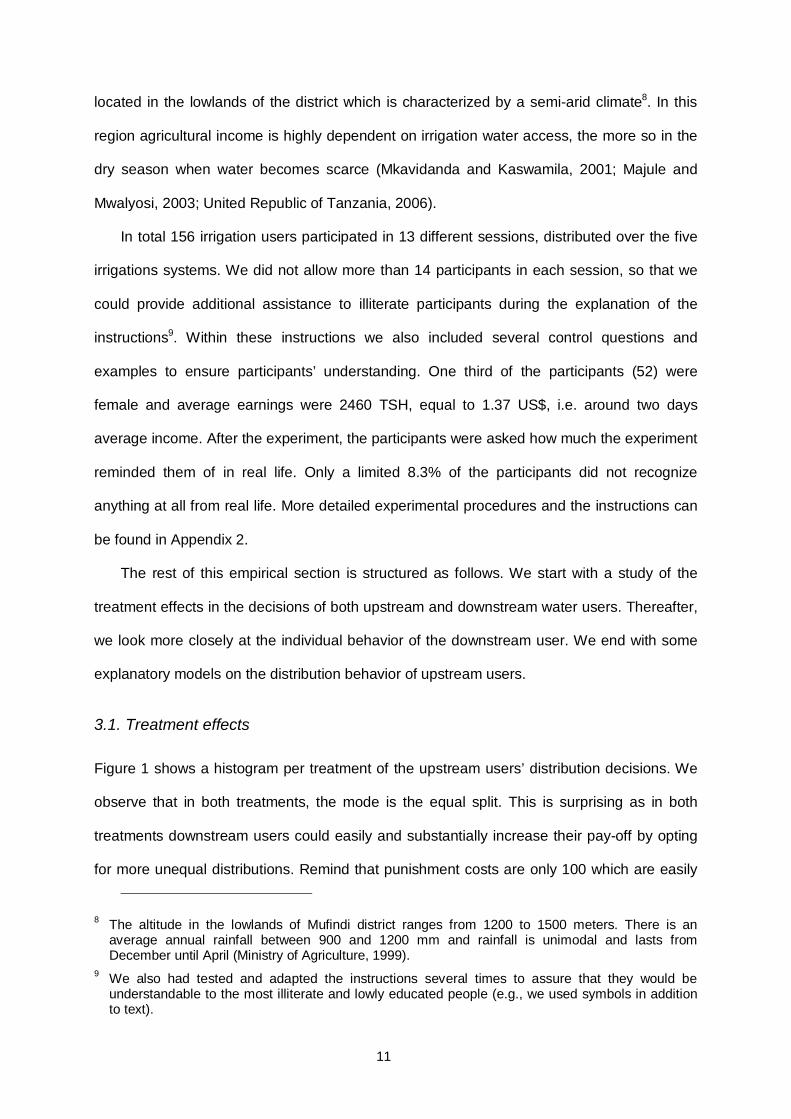
Figure 1 shows a histogram per treatment of the upstream users’ distribution decisions. We
observe that in both treatments, the mode is the equal split. This is surprising as in both
treatments downstream users could easily and substantially increase their pay-off by opting
for more unequal distributions. Remind that punishment costs are only 100 which are easily
8 The altitude in the lowlands of Mufindi district ranges from 1200 to 1500 meters. There is an average annual rainfall between 900 and 1200 mm and rainfall is unimodal and lasts from December until April (Ministry of Agriculture, 1999).
9 We also had tested and adapted the instructions several times to assure that they would be understandable to the most illiterate and lowly educated people (e.g., we used symbols in addition to text).
12
offset by opting for at least 8 hours of water use. Also note that in a considerable amount of
cases the upstream user gives more to the downstream user than what he/she keeps. This is
even the case in the scarcity treatment. This strongly contrasts with the results of ultimatum
game experiments with Northern university students where such generous offers are very
rare (Camerer and Thaler, 1995). A plausible rationale for these offers lies in the efficiency
gains from rotation. However, even in the abundance treatment, where rotation is not
profitable, we observe considerable generosity. As will be shown further in this paper, these
offers are most frequent among the upstream users of lower social status.
We also observe that the distribution in the scarcity treatment is skewed to the right
relative to the abundance treatment10. To test whether upstream users make more use of the
irrigation system in the scarcity treatment, as measured in number of hours, we compare the
average number of hours per participant between both treatments. According to a Wilcoxon
signed ranks test, upstream users make significantly more use of the water flow in the
scarcity treatment (two-sided P = .000). This confirms hypothesis 1.
Figure 1. Hours of water for upstream user
05
1015
2025
3035
0 1 2 3 4 5 6 7 8 9 10 11 12 0 1 2 3 4 5 6 7 8 9 10 11 12
Per
cent
10 Punishment costs have a higher weight in the scarcity treatment where pay-offs are lower. The average number of hours water use by the upstream user may therefore be underestimated.
Mean = 5.75
St.dev. = 2.39
N = 390
Mean = 6.57
St.dev. = 2.67
N = 780
(a) Abundance (b) Scarcity
13
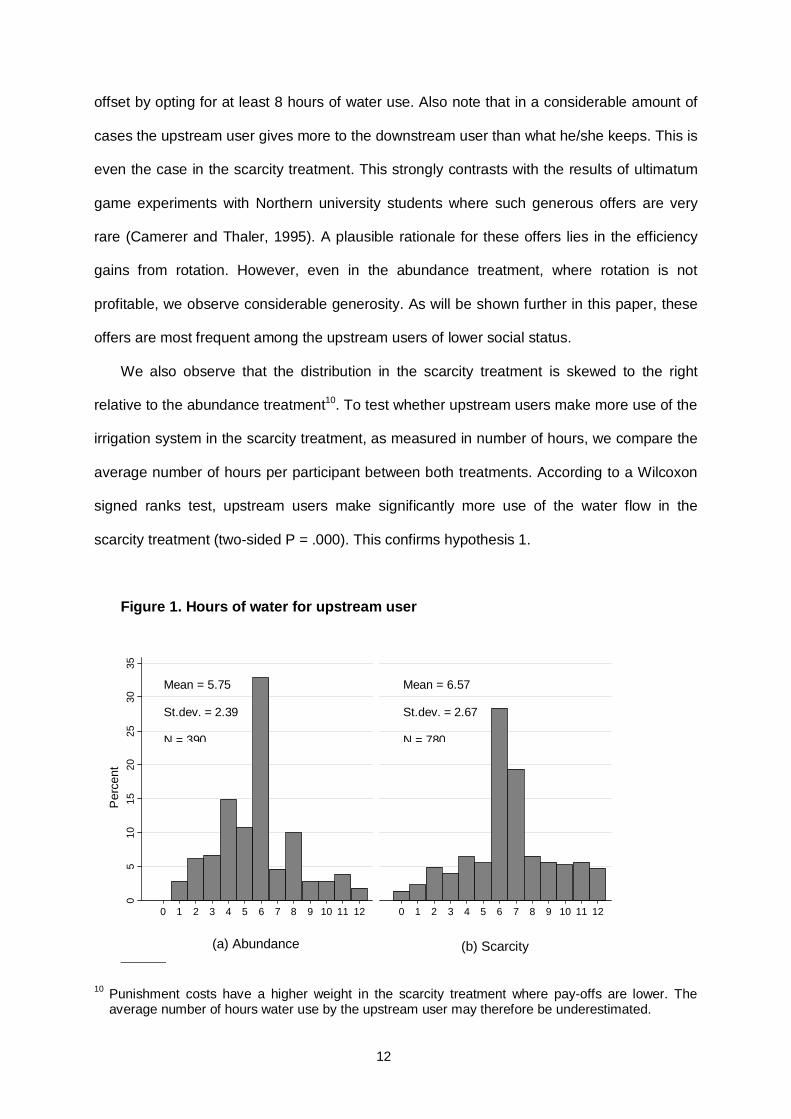
Given the predominance of the equal split and for sake of simplifying the analysis, we group
the distribution decisions into the following strategies. ‘Equal split’ distributions, where both
users make equal use of the water flow; ‘altruistic’ distributions, where the upstream user
makes less use of the water flow (in number of hours) than the downstream user; and
‘selfish’ distributions, where the upstream user makes more use of the water flow than the
downstream user. Furthermore, to look at the importance of rotation, we classify the
distribution decisions where upstream users switch from an altruistic distribution to a selfish
distribution or vice versa, into a separate ‘rotation’ strategy. Figure 2 presents the proportion
of each of these types of strategies for each round.
Figure 2. Evolution of upstream users’ strategies
0.2
.4.6
.81
Pro
porti
on
1 2 3 4 5 6 7 8 9 10 11 12 13 14 15Round
Rotation SelfishEqual split Altruism
Variation within each treatment is limited. No clear evolution in the strategies is observed
over time. Comparing strategies between both treatments, however, we observe that the
proportion of altruistic distributions decreases substantially in the scarcity treatment, whereas
the proportion of selfish distributions increases. To test whether these differences are
statistically significant, we calculate for each upstream user the proportion of each of these
strategies per treatment. Comparing the proportions of the altruistic distributions between

14
both treatments and applying a Wilcoxon signed ranks test, we observe that proportions of
altruistic distributions are significantly lower in the scarcity treatment (two-sided P-value =
.003). We also observe that proportions of selfish distributions are significantly higher in the
scarcity treatment (two-sided P-value = .015), whereas the proportions of equal split
distributions are significantly lower (two-sided P-value = .075). These tests provide further
support for hypothesis 1.
It is remarkable that this reduction in the frequency of the equal split strategy is so
limited, as equal sharing in the scarcity treatment makes upstream users forego very large
efficiency gains. It seems the very prominent egalitarian norms in the Tanzanian society
make upstream users reluctant to deviate from the equal split. Yet, successful rotation can
substantially increase the total pie while being equally fair, if well understood by both parties
(i.e. if looked at from a broader time frame). Our results show that in the scarcity treatment a
small proportion of upstream users opt for a rotation strategy. According to a Wilcoxon
signed ranks test the frequency of the rotation strategy is significantly higher in the scarcity
treatment than in the abundance treatment (two-sided P-value = .007). This confirms
hypothesis 2.
We now look at the reaction of the downstream user. Figure 3 shows the proportion of
each of the possible reactions per round. We observe that in less than 20% of the cases
downstream users rely on punishment. Moreover, around half of the downstream users
express satisfaction in the abundance treatment, percentage which decreases in the scarcity
treatment.
In general, variation within treatment is limited and no clear evolution is observed over
time. Differences between treatments, however, are more substantial. To test whether the
frequencies of the downstream user’s strategies differ between both treatments, we calculate
the proportion of each of these strategies per downstream user in each of both treatments
and apply a Wilcoxon signed ranks test. We observe that downstream users express
significantly less often their satisfaction (two-sided P-value = .009) in the scarcity treatment
and significantly more often their dissatisfaction (two-sided P-value = .076). The frequency of
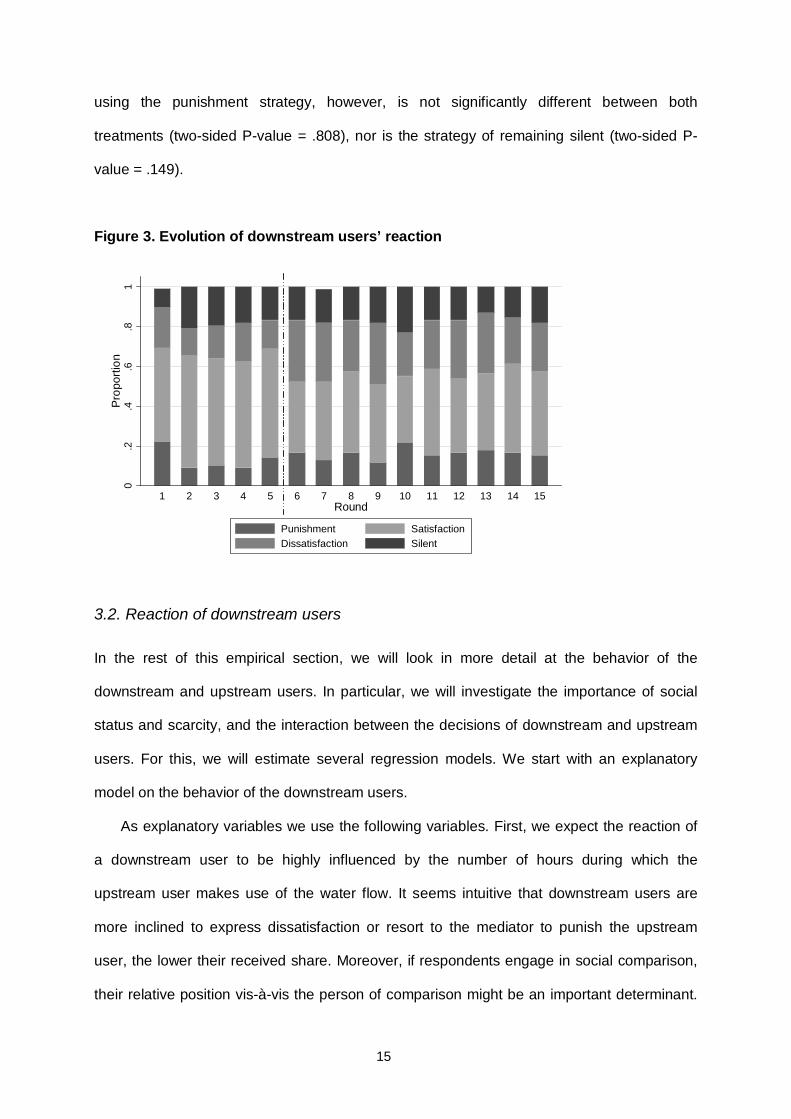
15
using the punishment strategy, however, is not significantly different between both
treatments (two-sided P-value = .808), nor is the strategy of remaining silent (two-sided P-
value = .149).
Figure 3. Evolution of downstream users’ reaction
0.2
.4.6
.81
Pro
porti
on
1 2 3 4 5 6 7 8 9 10 11 12 13 14 15Round
Punishment SatisfactionDissatisfaction Silent
3.2. Reaction of downstream users
In the rest of this empirical section, we will look in more detail at the behavior of the
downstream and upstream users. In particular, we will investigate the importance of social
status and scarcity, and the interaction between the decisions of downstream and upstream
users. For this, we will estimate several regression models. We start with an explanatory
model on the behavior of the downstream users.
As explanatory variables we use the following variables. First, we expect the reaction of
a downstream user to be highly influenced by the number of hours during which the
upstream user makes use of the water flow. It seems intuitive that downstream users are
more inclined to express dissatisfaction or resort to the mediator to punish the upstream
user, the lower their received share. Moreover, if respondents engage in social comparison,
their relative position vis-à-vis the person of comparison might be an important determinant.

16
More specifically, it may be important whether the inequality is advantageous or
disadvantageous for the downstream user. Inequality is advantageous respectively
disadvantageous if the number of hours of water use for the downstream user is larger
respectively lower than the number of hours for the upstream user. The behavioral influence
of advantageous or disadvantageous inequality is expected to work through feelings of guilt
and envy (see e.g. Fehr and Schmidt, 1999).
To study the influence of guilt and envy, we therefore add the following two explanatory
variables. To control for the influence of guilt we add a variable that is equal to the number of
hours left for the downstream user minus the hours used by the upstream user if this
difference is positive. Otherwise this measure is zero. To control for the influence of envy we
add a variable that is equal to the number of hours used by the upstream user minus the
hours left for the downstream user if this difference is positive. In the case it is negative (and
inequality is thus advantageous for the downstream user), the measure for envy takes the
value zero.
Second, we expect an important influence of social status11. Downstream users with
different social status may show different behavior when asked to react to the upstream
user’s distribution. In particular, we expect downstream users to be more reluctant to openly
protest against the distribution decisions of upstream users. This may translate into a lower
likelihood of punishment and a higher likelihood of remaining silent versus expressing
dissatisfaction. To control for the relative social status we calculated a variable ‘social status
rank’. As described before, in each irrigation scheme we let four different groups rank all
water users of the irrigation scheme (excluding the members that belong to the same ranking
group), with a higher rank number indicating a lower social status (rank 1 = highest social
status; rank 2 = lower social status; etc.). For each member the average of the given rank
11 Social status and sex are considerably correlated. On average women have a higher social status rank than men: 1.156 versus 0.921. According to a t-test of equality of means this difference is statistically significant (t = -4.918; two-sided P = .000).
17
numbers was calculated. We normalized this value by dividing it by the mean rank per
irrigation scheme. As a result, most values are between 0.5 and 1.5.
Third, the influence of envy or guilt may also differ between downstream users of
different social status. For example, downstream users with lower social status may be less
envious than downstream users with higher social status. To control for such an effect, we
add an interaction variable between the individual social status rank and the envy and guilt
variables.
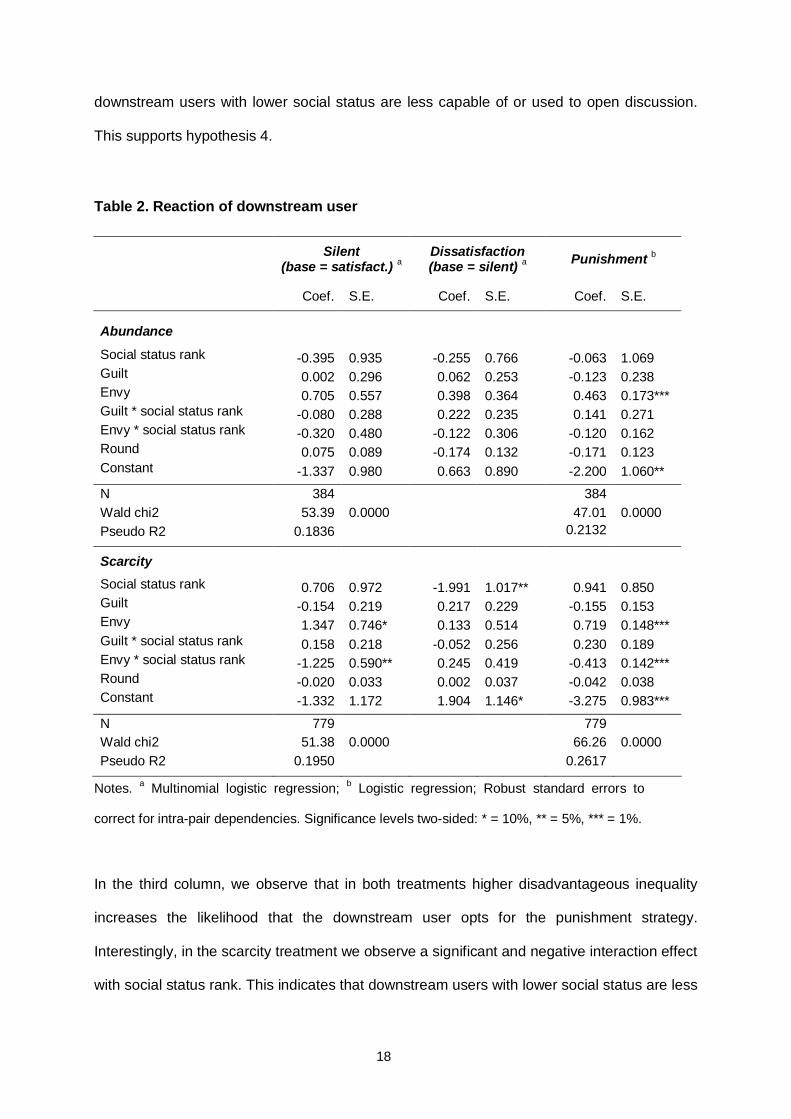
To study the likelihood of each of the available options, we proceed in the following way.
First, we distinguish between the punishment option and the three non-punishment options,
as only punishment directly influences the pay-offs of the agents involved. To study the
likelihood of punishment by the downstream user we estimate a standard logit regression.
Second, to analyze the relative likelihood of the three non-punishment options we estimate a
multinomial logistic regression. We are interested in what influences the likelihood of
remaining silent in comparison with expressing satisfaction, and the likelihood of expressing
dissatisfaction in comparison with remaining silent. Table 2 shows the results.
The first two columns present the results of the multinomial logit regression. The results
in the first column indicate that in the scarcity treatment higher disadvantageous inequality
increases the odds ratio of remaining silent versus expressing satisfaction. As indicated by
the negative interaction term with the social status rank, this effect is lower up to almost non-
existent for downstream users with a social status lower than the village average, i.e. those
with normalized rank higher than 1. Assuming that remaining silent is not interpreted as an
expression of protest against the decision made by the upstream user this result suggests
downstream users with lower social status are more inclined to agree with disadvantageous
water access. This confirms hypothesis 3.
In the second column, we observe that in the scarcity treatment downstream users with
lower social status are less inclined to express dissatisfaction in comparison with remaining
silent, irrespective of the distribution decision of the upstream user. This suggests
18
downstream users with lower social status are less capable of or used to open discussion.
This supports hypothesis 4.
Table 2. Reaction of downstream user
Silent (base = satisfact.) a
Dissatisfaction (base = silent) a Punishment b
Coef. S.E. Coef. S.E. Coef. S.E.
Abundance Social status rank -0.395 0.935 -0.255 0.766 -0.063 1.069 Guilt 0.002 0.296 0.062 0.253 -0.123 0.238 Envy 0.705 0.557 0.398 0.364 0.463 0.173*** Guilt * social status rank -0.080 0.288 0.222 0.235 0.141 0.271 Envy * social status rank -0.320 0.480 -0.122 0.306 -0.120 0.162 Round 0.075 0.089 -0.174 0.132 -0.171 0.123 Constant -1.337 0.980 0.663 0.890 -2.200 1.060**
N 384 384 Wald chi2 53.39 0.0000 47.01 0.0000 Pseudo R2 0.1836 0.2132
Scarcity Social status rank 0.706 0.972 -1.991 1.017** 0.941 0.850 Guilt -0.154 0.219 0.217 0.229 -0.155 0.153 Envy 1.347 0.746* 0.133 0.514 0.719 0.148*** Guilt * social status rank 0.158 0.218 -0.052 0.256 0.230 0.189 Envy * social status rank -1.225 0.590** 0.245 0.419 -0.413 0.142*** Round -0.020 0.033 0.002 0.037 -0.042 0.038 Constant -1.332 1.172 1.904 1.146* -3.275 0.983***
N 779 779 Wald chi2 51.38 0.0000 66.26 0.0000 Pseudo R2 0.1950 0.2617
Notes. a Multinomial logistic regression; b Logistic regression; Robust standard errors to
correct for intra-pair dependencies. Significance levels two-sided: * = 10%, ** = 5%, *** = 1%.
In the third column, we observe that in both treatments higher disadvantageous inequality
increases the likelihood that the downstream user opts for the punishment strategy.
Interestingly, in the scarcity treatment we observe a significant and negative interaction effect
with social status rank. This indicates that downstream users with lower social status are less

19
sensitive to disadvantageous inequality. This provides further support for hypotheses 3 and
4.
3.3. Distribution behavior of upstream users
We will now investigate in more detail the strategies followed by the upstream users12. Table
3 shows the spearman correlation coefficients between social status rank and the individual
proportion of each strategy per upstream user (over all periods), separately for each
treatment. These correlations are significant for the altruistic strategy, but not for each of the
other strategies. Thus, upstream users with a higher social status rank (i.e. lower social
status) tend to opt more frequently for the altruistic strategy. This correlation is weaker in the
scarcity treatment.
Table 3. Correlations between strategy frequency and social status rank
Altruism Equal split Selfish Rotation
Abundance 0.314 (.006) -0.135 (.248) -0.157 (.177) -0.145 (.214)
Scarcity 0.200 (.085) -0.154 (.188) 0.109 (.353) -0.091 (.435)
N = 75; two-sided P-values between parentheses.
Up to now we have only looked at correlations between social status and average behavior
over all rounds. Upstream users, however, may change their strategies in response to the
reaction of downstream users. To have an idea of the frequency of strategy changes, we
elaborate a cross table of the distribution decision in the current and the previous period
(Table 4).
In the abundance treatment we observe a considerable number of strategy changes from
a selfish distribution to the equal split. In particular, 27.94% from all selfish distributions
12 For the rest of this section we look at strategy choice instead of the exact number of hours water use. Given the prominence of equal sharing in Tanzania, it is important to know whether upstream users keep more, equal or less water than the downstream user.

20
changed into an equal split distribution in the subsequent period, whereas only 12.90% of
equal split distributions changed into a selfish distribution. In the scarcity treatment, we
observe a considerable proportion of strategy changes from altruistic distributions to selfish
distributions (27.61%), and a considerable lower proportion of changes in the other direction
(15.27%). Part of this can be attributed to a rotation strategy. Also in the scarcity treatment,
the same table shows that strategies are frequently changed from the equal split to selfish
distributions (20.00%), whereas less frequently in the other direction (14.18%).
Table 4. Frequency of strategy changes
Abundance treatment
Altruism (t) Equal split (t) Selfish (t) Total
Altruism (t-1) 78.75% 11.25% 10.00% 100.0%
Equal split (t-1) 10.75% 76.34% 12.90% 100.0%
Selfish (t-1) 8.82% 27.94% 63.24% 100.0%
Scarcity treatment
Altruism (t) Equal split (t) Selfish (t) Total
Altruism (t-1) 61.94% 10.45% 27.61% 100.0%
Equal split (t-1) 8.11% 71.89% 20.00% 100.0%
Selfish (t-1) 15.27% 14.18% 70.55% 100.0%
We are now ready to elaborate a more complicated regression model on strategy choice that
controls for state dependence in the strategy choice and the influence of punishment by the
downstream, and their interaction with social status. For this, we estimate a regression model
on the strategy used by the upstream user. As there are three possible strategies we
estimate a multinomial logit regression, which has the following form:

21
jijiijiijijit
itj XtptYtptYtY
'3
'32
'31
'1
2
11)1(1)1()1(log
itjjiiijiiijii tptYXtptYXtYX 3'3
'2
'3
'1
'1
' 11)1(1)1()1(
for 3,1j (1)
The index j refers to the strategy chosen by the upstream user, with 1 = altruism, 2 = equal
split and 3 = selfish. itj is the probability that individual i opts for strategy j in period t. The
reference strategy is the equal split.
As explanatory variables we use the following variables. First, upstream users may take
account of the strategy they chose in the previous round. For instance, they may stick to the
same strategy, or they may follow certain rotation. To control for this we use the dummy
variables )1('1 tYi and )1('
3 tYi , which are equal to one when the strategy chosen in the
previous period was the altruistic strategy and the selfish strategy, respectively. Second, it
may be important whether the strategy in the previous round resulted in punishment. To
control for this, we split up the dummy variables for the strategy chosen in the previous round
in dependence of whether or not this strategy made the downstream user opt for
punishment, i.e. 11 tpi in case of punishment. As with the altruistic and equal split
strategies punishment is very uncommon13, we only did so for the selfish strategy. This
allows us to study the effectiveness of punishment in changing upstream users’ strategies.
Third, upstream users with varying social status may differ in distribution decisions. Following
the previously stated hypothesis 5, we expect upstream users with higher social status to be
generally less generous. To test this, we add a variable that indicates the social status rank
of each upstream user. Fourth, social status may also interact with the other control
variables. In particular, the influence of the strategy chosen in the previous period may be
13 Whereas the punishment rate is 32.12% when the selfish strategy is followed, punishment rates are only 4.68% and 2.01% when respectively the altruistic and equal split strategies are followed.

22
different between upstream users of different social status. Upstream users with lower social
status may for instance be less inclined to opt for rotation. They may also react differently to
being punished when having followed a selfish strategy in the previous round. To control for
such effects, we add interaction terms between social status and each of the three above
defined dummies (selfish strategy - punishment; selfish strategy - no-punishment; altruistic
strategy).
In a first model we pool all observations and estimate a standard multinomial logit model.
However, as observations are not independent, we cluster observations per participant and
correct standard errors for non-independencies within each cluster. The results of this model
are shown in the first column of Table 4, separately for each treatment. Yet, as we also have
an autoregressive part in our model, following this estimation method leads to biased
coefficients. To deal with this, we estimate a dynamic multinomial logit random effects model.
Basically, we split up the error term of equation 1 in an unobserved individual specific
random effect that is time-invariant and a time-dependent error term.
jijiijiijijit
itj XtptYtptYtY
'3
'32
'31
'1
2
11)1(1)1()1(log
itjijjiiijiiijii tptYXtptYXtYX 3'3
'2
'3
'1
'1
' 11)1(1)1()1(
for 3,1j (2)
The random effects approach also requires the specification of the relation between the initial
observations 1tYij for 3,1j and the unobserved heterogeneity i and observables iX .
For this, we use a reduced form approximation to the initial sample observation (Heckman,
1981) of the following form:
jiijjii
ji X 1'
12
1log
for 3,1j (3)
23
In this model the random effects are assumed to arise from a multivariate distribution. To
obtain the marginal distribution of the response it is necessary to integrate out the random
effects. The integration, however, does not have a closed-form solution when the random
effects are multivariate normal. There are many methods for performing numerical integration
to approximate the marginal distribution, but they are all computationally intensive. An
alternative approach uses Markov chain Monte Carlo (MCMC) simulation to estimate
parameters of such model (Haynes et al., 2008). We implemented such approach using
WinBUGS software (Spiegelhalter et al., 1998) which implements MCMC simulation using
the Gibbs Sampler. The results of this model are shown in the second column of Table 5,
separately for each treatment. Comparing the estimation results of both models we observe
considerable differences. As the pooled model produces biased coefficients we only discuss
the results of the MCMC model.
We observe that in the abundance treatment upstream users with lower social status (i.e.
higher social status rank) are more inclined to opt for the altruistic strategy instead of the
equal split. This is consistent with our previous analysis. We also observe that having chosen
the selfish strategy and being punished induces upstream users to choose this strategy
again. For upstream users with lower social status this effect is lower, up to even the
opposite (for instance when having a social status rank of 1.5). Thus, punishment is effective
in making low social status users abandon the selfish strategy, whereas for high social status
players it has an adverse effect. This confirms hypothesis 5.
In the scarcity treatment we observe that having chosen the altruistic strategy in the
previous round increases the odds of choosing that strategy again versus choosing the equal
split. This state dependence is invariant to social status, as indicated by the insignificant
coefficient of the interaction term with social status rank. Some people are simply more
generous than others and remain so in all rounds. Moreover, taking account of the
coefficients of the dummy for having chosen the altruistic strategy in the previous round and
the interaction with the social status rank, we observe that having chosen the altruistic
strategy in the previous round increases the odds of choosing the selfish strategy for high

24
social status users but it reduces the odds ratio for users of low social status. This indicates
rotation is most likely followed by users of high social status.
Also in the scarcity treatment, choosing the selfish strategy in the previous round and not
being punished increases the odds ratio of sticking to the selfish strategy versus the equal
split. Taking account of the interaction term with social status we also observe that for high
social status users it increases the odds ratio of choosing the altruistic strategy versus the
equal split, whereas for low social status users it reduces this odds ratio. This suggests that
under upstream users with higher social status at least two groups can be distinguished. One
group tends to stick to the selfish strategy. The other group switches to the altruistic strategy,
probably because of their interest to stimulate rotation. This is corroborated by the fact that
this effect is only observed in the scarcity treatment, where rotation increases the size of the
cake.
Being punished after having chosen the selfish strategy, leads to a similar pattern in this
treatment. The effects are somewhat stronger as indicated by the larger coefficients in case
of punishment in comparison with non-punishment. Moreover, the significant interaction
terms with the social status rank once again indicate opposite dynamics for low and high
social status users. Consequently, different types of upstream users can be distinguished.
Being punished after having chosen the selfish strategy stimulates some upstream users
with high social status to opt for the selfish strategy again, whereas it induces low social
status users to alter their strategy. Other upstream users with high social status change their
selfish strategy into an altruistic strategy.
What do these results tell us with respect to hypotheses 5 and 6? The influence of social
status on the sensitivity for punishment is mixed, so that hypothesis 5 is only partly
confirmed. With respect to hypothesis 6, we observe that in the scarcity treatment having
chosen the altruistic strategy increases the odds ratio of choosing the selfish strategy and
vice versa. Moreover, the negative interaction terms with social status indicate that rotation is
more likely with higher social status upstream users. This confirms hypothesis 6.

25
Table 5. Strategy choice of the upstream user
Abundance Scarcity
Pooled a MCMC Pooled a MCMC
Coef. S.E. Coef. S.E. Coef. S.E. Coef. S.E.
Altruism (t > 1)
Social status rank 2.534 1.070** 5.366 2.216** 2.120 1.127* 4.239 1.819** Selfish + pun. 5.560 1.937*** 5.373 4.722 9.059 3.081*** 6.618 2.574** Selfish + pun. * soc. stat. -4.839 1.541*** -6.630 5.210 -6.203 2.573** -5.653 2.206** Selfish + no pun. 2.762 2.160 3.146 3.552 5.069 1.298*** 4.122 1.956** Selfish + no pun. * soc. stat. -1.804 2.080 -3.078 3.544 -2.820 1.326** -3.573 1.835* Altruism 6.672 2.239*** 3.816 2.663 6.199 1.929*** 3.873 2.302* Altruism * soc. stat. rank -2.807 1.915 -2.191 2.210 -1.988 1.759 -2.488 2.038 Period 0.058 0.154 -0.076 0.212 0.030 0.034 0.043 0.065 Constant -4.592 1.367*** -2.070 15.170 -4.521 1.154*** -6.554 7.989
Altruism (t = 1) Social status rank 3.911 2.260* 3.729 2.245* Constant -9.625 15.410 -5.161 8.478
Selfish (t > 1)
Social status rank 1.905 1.071* 2.377 1.745 2.428 1.096** 4.218 1.580*** Selfish + pun. 7.092 2.064*** 7.043 2.743** 8.420 3.041*** 5.840 2.292** Selfish + pun. * soc. stat. -4.362 1.746** -5.787 2.571** -4.861 2.595* -5.082 1.923*** Selfish + no pun. 4.032 1.579** 3.403 2.344 5.080 1.525*** 2.732 1.496* Selfish + no pun. * soc. stat. -1.221 1.633 -1.877 2.345 -2.021 1.469 -2.231 1.441 Altruism 5.237 2.115** 5.589 3.058* 6.238 1.602*** 4.790 1.967** Altruism * soc. stat. rank -3.803 1.988* -4.434 2.803 -3.790 1.560** -4.012 1.802** Period 0.211 0.151 0.175 0.197 0.033 0.031 0.041 0.057 Constant -4.462 1.274*** 27.44 6.848** -3.973 1.087*** -17.470 6.219***
Selfish (t = 1) Social status rank -1.830 1.709 1.096 1.777 Constant 34.05 7.003** -13.040 6.371**
Sigma 1 10.41 7.268 4.577 3.805 Sigma 2 1.452 2.081 7.595 3.736** Sigma 3 3.526 3.546 3.485 3.126
N 286 286 666 666 Wald chi2 125.2 124.26 Prob > chi2 0.000 0.0000 Pseudo R2 0.366 0.2910
Notes. Multinomial logistic regression with equal split as base category. a Standard errors are
corrected for intra-pair dependencies. Significance levels two-sided: * = 10%, ** = 5%, *** = 1%.
26
4. Conclusion
In this paper we experimentally studied the interaction between the decisions of upstream
and downstream users in irrigation schemes. In subsequent rounds, a permanent upstream
user is asked to decide on the number of hours to make use of the (irrigation) water flow.
After each distribution decision, the downstream user has the ability to remain silent, to react
in the form of expressing (dis)satisfaction or to engage in costly punishment of the upstream
user. To study how social status influences water distribution and enforcement we
complement the data from the distribution experiment with data from a social status ranking
exercise. To study the effect of scarcity, we compare between a treatment with abundant
water availability and a treatment where water is insufficient for both players to reach a
minimum production threshold.
The main results are the following. We observe that the equal split of irrigation water
prevails in the abundance treatment. Even in a treatment that simulates acute water scarcity,
equal sharing remains the most preferred option, despite the very high foregone efficiency
gains. At the same time, however, the average number of hours for the upstream user is
significantly higher in the scarcity treatment, which leads to a higher proportion of unequal
distributions. This in turn entails higher dissatisfaction rates by downstream users, but leaves
punishment rates unaffected. At the same time, rotation significantly increases under the
scarcity treatment.
With respect to the individual behavior of downstream users, in both treatments more
disadvantageous inequality increases the likelihood that downstream users opt for the
punishment strategy. In the scarcity treatment this effect is weaker for downstream users
with lower social status. In the scarcity treatment more disadvantageous inequality also
increases the likelihood of remaining silent versus expressing satisfaction, effect which is
again lower for low status players. Finally, in the scarcity treatment downstream users with
lower social status are less inclined to express dissatisfaction in comparison with remaining

27
silent, irrespective of the distribution decision of the upstream user. This suggests
downstream users with lower social status are less capable of or used to open discussion.
With respect to the individual behavior of upstream users, three groups can be
distinguished. One group sticks to the altruistic strategy, whereas another group perseveres
with the selfish strategy, irrespective of the reaction of downstream users. A third group
rotates between both strategies. The latter two groups are more prominent among users of
higher social status.
5. References
Adams, W., Watson, E., Mutiso, S., 1997. Water, rules and gender: Water rights in an
indigenous irrigation system, Marakwet, Kenya. Development and Change 28, 707-730.
Armantier, O., 2006. Do wealth differences affect fairness considerations? International
Economic Review 47(2), 391-429.
Ball, S., Eckel, C., 1998. The economic value of status. Journal of Socio-Economics 27(4),
495-514.
Bolton, G., Ockenfels, A., 2000. ERC - A theory of equity, reciprocity and competition.
American Economic Review 90, 166-93.
Camerer, C., Thaler, R., 1995. Anomalies: ultimatums, dictators and manners. Journal of
Economic Perspectives 9(2), 209-219.
Cameron, L.A., 2007. Raising the stakes in the ultimatum game: experimental evidence from
Indonesia. Economic Inquiry 37(1), 47-59.
Cardenas, J.-C., 2003. Real wealth and experimental cooperation: experiments in the field
lab. Journal of Development Economics 70(2), 263-289.
Cardenas, J.C., Ostrom, E., 2004. What do people bring into the game? Experiments in the
field about cooperation in the commons. Agricultural Systems 82, 307-326.
Carlsson, E., 2003. An investigation into informal property rights institutions Governing water
resources”, chapter 7 in: To Have and to Hold: Continuity and change in property rights

28
institutions governing water resources among the Meru of Tanzania and the BaKgatla in
Botswana; 1925-2000, PhD Thesis, Lund University, Sweden,
www.ekh.lu.se/sekh/papers/EllenCarlsson.pdf
Cleaver, F., Toner, A., 2006. The evolution of community water governance in Uchira,
Tanzania: The implications for equality of access, sustainability and effectiveness.
Natural Resources Forum 30, 207-218.
di Falco, S., Bulte, E., 2009. The dark side of social capital: Kinship, consumption and
investment, paper presented at CSAE conference 2009.
Dufwenberg, M., Kirchsteiger, G., 2004. A theory of sequential reciprocity. Games and
Economic Behavior 47, 268-298.
Eckel, C., Grossman, P., 2001. Chivalry and solidarity in ultimatum games. Economic Inquiry
39(2), 171-88.
Eckel, C., Grossman, P. (forthcoming). Men, women and risk aversion: Experimental
Evidence. In: Plott, C., Smith, V. (Eds.). Handbook of Experimental Results. New York:
Elsevier.
Falk, A., Fischbacher, U., 2006. A theory of reciprocity. Games and Economic Behavior 54,
293-315.
Fehr, E., Schmidt, K.M., 1999. A theory of fairness, competition and cooperation. Quarterly
Journal of Economics 114(3), 817-68.
Fleuret, P., 1985. The social organisation of water control in the Taita Hills, Kenya, American
Ethnologist 12, 103-118.
Güth W., Schmittberger, R., Schwarze, B., 1982. An experimental analysis of ultimatum
bargaining, Journal of Economic Behavior and Organization 3, 367-388.
Harbaugh, W., Krause, K., Liday, S., 2002. Bargaining by children, University of Oregon
Economics Department Working Papers.
Haynes, M., Western, M., Yu, L., Spellak, M., 2008. Analysing nominal data from a panel
survey: Employment transitions of Australian women, discussion paper.
29
Heckman, J., 1981. The Incidental Parameters Problem and the Problem of Initial Conditions
in Estimating a Discrete Time-Discrete Data Stochastic Process, Chapter 4 in: Manski, C
and McFadden, D. (eds) Structural Analysis of Discrete Data, MIT Press, Cambridge,
MA.
Henrich, J., Boyd, R., Bowles, S., Camerer, C., Fehr, E. and Gintis, H. (2004). Foundations
of human sociality: Economic experiments and ethnographic evidence from fifteen small-
scale societies. Oxford University Press.
Hoffman, E., Spitzer, M., 1985. Entitlements, rights, and fairness: An experimental
examination of subjects’ concepts of distributive justice. The Journal of Legal Studies
14(2), 259-297.
IPCC, 2008. Climate change and water, Intergovernmental Panel on Climate Change
Juma, I., Maganga, F., 2005. Current reforms and their implications for rural water
management in Tanzania, paper presented at the International Workshop on African
Water Laws: Plural Legislative Frameworks for Rural Water Management in Africa, Zuid-
Afrika, Johannesburg, International Water Management Institute, 26-28 januari 2005.
Lindemann, K., 2007. The Impact of Objective Characteristics on Subjective Social Position.
Trames 11, 54-68.
Maganga, F., 2002. The interplay between formal and informal systems of managing
resource conflicts: Some evidence from South-Western Tanzania. The European Journal
of Development Research 14(2), 51-70.
Majule, A., Mwalyosi, R., 2003. Enhancing agricultural productivity through sustainable
irrigation. A case of Vinyungu Farming System in selected Zones of Southern Highlands,
Tanzania. A chapter of Research paper Submitted to ENRECA, University of Dar es
Salaam.
Ministry of Agriculture, 1999. Agro-ecological Zones and Farming Systems of the Southern
Highlands of Tanzania, United Republic of Tanzania.
Mkavidanda, T., Kaswamila, A., 2001. The role of traditional irrigation systems (vinyungu) in
alleviating poverty in Iringa rural district, Tanzania, REPOA Research Report, 01(2).

30
Murnighan, J., Saxon, M., 1998. Ultimatum bargaining by children and adults. Journal of
Economic Psychology 19, 415-445.
Ostrom, E., 1990. Governing the commons: The evolution of institutions for collective action.
New York: Cambridge University Press.
Pillutla, M.M. and Murnighan, J.K., 1996. Unfairness, anger, and spite: Emotional rejections
of ultimatum offers. Organizational Behavior and Human Decision Processes 68(3), 208-
224.
Platteau, J.P., 2000. Institutions, Social Norms, and Economic Development, Routledge
Platteau, J-Ph., Abraham, A., 2002. Participatory development in the presence of
endogenous community imperfections. Journal of Development Studies 39(2), 104-136.
Platteau, J.Ph., 2006. Solidarity norms and institutions in village societies: Static and
dynamic considerations. In: Kolm, S.C., Ythier, J.M. (Eds.). Handbook of the Economics
of Giving, Altruism and Reciprocity. Vol. I. Amsterdam: North-Holland, 819-886.
Potkansky, T., Adams, W.M., 1998. Water scarcity, property regimes and irrigation
management in Sonjo, Tanzania. Journal of Development Studies 34(4), 86-116.
Solnick, S., 2001. Gender differences in the ultimatum game. Economic Inquiry 39(2), 189-
200.
Spiegelhalter, D., Thomas, A., Best, N., 1998. WinBUGS: Bayesian inference using Gibbs
Sampling, Manual version 1.2, Imperial College, London and Medical Research Council
Biostatistics Unit, Cambridge.
United Republic of Tanzania, 2006. National sample census of agriculture 2002/2003. Small
holder agriculture, Volume II: Crop sector – National report.
World Bank, 2007. World Development Report 2008: Agriculture for development. World
Bank: Washington D.C.
31
Appendix 1: Social status ranking exercise
For the social status ranking exercise, we started with explaining the participants that there may be differences among people with respect to social status. Furthermore, one’s individual social status in society might influence one’s capability to attain his/her needs and influence others (thereby already introducing the correlation with power). Feedback by the group confirmed that the ‘social status’ concept was well understood and relevant. Secondly, inspired by an exercise used to measure subjective social status14, the concept of a hierarchy according to social status was represented by a ladder. If one is high on the ladder one has a high social status, low on the ladder means one is low in the social status hierarchy. An example of a ladder with four rungs was presented on a flipchart, indicating ‘high’ on top, and ‘low’ below15. The participants, divided in four randomly composed mixed groups, were then asked to rank all farmers that were identified cultivating a plot in the irrigation scheme according to their social status. For that purpose, the names of all irrigation users were copied on four sets of cards, and four flipcharts with ladders were distributed. As an illustration, the facilitator ranked the four members of the research team on the ladder on the example flipchart. He did this randomly but hypothetically matched a higher social status to the ones he put high on the ladder. After this example, the four groups separately ranked all identified farmers by putting the cards of the respective farmers on the ‘social status ladder’ on the rung matching his/her relative social status. To avoid embarrassment, overestimation or underestimation of one’s own social status, the participants were not expected to rank themselves. Therefore, in each group, the cards with names of the group members were put aside and not ranked. The research team members monitored each group to check if the exercise was well understood and if all understood the ‘social status’ concept as defined. They also made sure that nobody dominated the group and every group member could participate. When a group finished, one research team member collected the piles the group had put on the ladder, indicating the rung on the cards. The ranked cards were put in sealed envelopes to assure the ranking of the participants would remain confidential and was used for research purposes only. By observing the groups at work during the ranking exercise, it can generally be concluded that the level of consensus was relatively high. In a few occasions, there was fear for domination of one group member, but the research team intervened swiftly and tried to correct the situation by probing for more intervention of the other members or by emphasizing there is no single correct ranking but the ranking as seen by the group is of importance for us. In the ex-post group discussion on advantages and disadvantages from being high, respectively low in the social status ranking, consensus was relatively high.
14 To measure subjective social status though, people are asked to rank themselves on a ladder. In epidemiology and health psychology subjective social status is seen a relevant correlate to various health conditions. It is defined as ‘‘a person’s belief about his location in a socio-economic status order’’ (Davis, 1956 in Singh-Manoux et al., 2003).
15 During the ranking the groups were allowed to neglect some rungs when they thought less then four categories where distinguishable according to social status. They were also allowed to add more rungs, i.e. categories.
32
Appendix 2: Experimental procedures and instructions
[When people enter the meeting room, they are asked for their name. We have a list of invited candidates, a sample chosen from previously identified households by the irrigation mapping exercise. Their name is marked and they are given a sticker with an identity letter, which we ask them to stick on their shirt. It is explained that this identity letter is unique and allows us to identify them during the exercise while guaranteeing complete confidentiality. This is important, as they are able to earn real money in the exercise. They are asked to take a seat in the meeting room. Further instructions will be given once sufficient people have shown up.]
“Thanks for your interest. We are from the universities of Gent and Antwerp (Belgium) and we are making a study on local economic development and poverty. This study is important as it might help policymakers who are interested in combating poverty and stimulate economic development. We have been here in this village before to do an irrigation mapping exercise and a survey, in which many of you probably participated”.
“You are now invited to participate in a new exercise, which allows you to earn real money. How much you earn depends on the decisions you will be asked to make, as well as the decisions of other people in the village. Like in real life, the harvest you can get from irrigated farming depends on your decisions but also on decisions of other users of water.”
“Participation is voluntary. Your decisions will be dealt with in a confidential way, i.e. nobody in the village will ever know your individual decisions, or the money you will have earned. The money you earn will be paid out to you privately and confidentially after the exercise. During the whole exercise, you are not allowed to communicate with the other participants.”
Part one – Water abundance treatment (5 rounds)
“In part 1 of the exercise, you are matched with one other person. Imagine that you and the other person are both connected to the same irrigation channel. One person is located immediately ‘upstream’ of the other person. We call the first person the ‘upstream person’, whereas we refer to the second person as the ‘downstream person’. Later we will inform you whether you are an upstream or a downstream person. It is important that you realize that you will never get to know the identity of this other person you are matched with. Nor will the other person ever get to know your identity.”
“As the water flow passes first by the upstream person, this person has the possibility to distribute the water flow between him/herself and the downstream person. He/she does this in the following way. We assume there is a constant flow of water and the upstream person has to decide how many hours he/she will extract water from the irrigation channel, from a total of 12 hours per day for each day of the month. It is important to realize that the downstream user cannot make use of the irrigation channel while the upstream user makes us of it. This means that the downstream user can only make use of the irrigation channel during the hours the upstream user does not make use of it. For instance, if the upstream user decides to use the water channel during 10 hours every day of the month, the downstream user will only be able to make use of the water channel during the remaining 2 hours each day of the month.”
[Distribute decision cards for first exercise. Stick flipchart with decision card on the wall]
“To make decisions in the exercise you will make use of decision cards. On the decision card you received we will do a first exercise together. We pretend you all are an upstream user now. And you have to decide on the number of hours to make use of the water in the irrigation channel per day for a whole month. On the decision card, you observe 12 dots, representing the maximum number of hours one can make use of the irrigation channel. To make a decision you need to color the number of dots equal to the number of hours during which you wish to make use of the irrigation channel.”
[They keep the decision card. Distribute the production table for the abundance treatment. Stick flipchart with production table on the wall]
33
“The hours of water and thus the amount of water one is able to extract from the irrigation channel to irrigate his/her plot determines his/her income. The more water one uses on his/her plot, the more s/he can harvest and earn. How much one can earn is indicated in the production table. You observe three columns. In the first column, you observe the entire range of decision options for the upstream user. He can choose between 0 and 12 (included) number of hours (number of black dots) making use of the irrigation channel. The second column indicates the harvest and profit of the upstream user for a chosen number of hours. E.g if the upstream user decides to make use of the irrigation channel during 8 hours, s/he will obtain an income of 425 TSH from the harvest of the irrigated field. This means that the downstream user can only make use of it during the remaining 4 hours and will obtain an earning of 175 TSH. Another example: if the upstream user takes water during 6 hours every day, the downstream user will remain with 6 hours per day in that month. The upstream user will then earn 325 TSH, the downstream user 325 TSH. It is important that you realize that you can earn real money. The total you earn will be paid out to you after the end of the exercise.”
“In the production table, you also observe that there is a minimum required amount of water, equal to a flow of 4 hours per day, below which harvest is extremely low. In other words, if any of both users uses less than the minimum required water quantity, his/her production will be very low; he will only get 50 TSH. Above this threshold, harvest drastically increases, and the more water one uses, the higher his/her income.”
“Now look at the decision card: chose a number of hours of water you want to use and color the number of dots. Look on the production table how much the upstream user can earn if s/he gets that number of hours of water. And write this on the decision card.”
[They now write on the decision card; they color dots to choose hours of water]
“Now look at the third column of the production table which indicates the harvest and profit the downstream user will obtain. Write down the earnings of the downstream user on the decision card now.”
[Show the second part of the decision card on flip chart].
“After the upstream user made the decision on the hours of water he/she will use and wrote down his/her earnings and the earnings for the downstream user, the decision card will be given to the downstream user. He/she will then know the decision made by the upstream user. The downstream user knows that next month the upstream user will have to make a new distribution decision again. So, the downstream user may find it important to give his reaction regarding the decision made by the upstream user. The downstream user can take four different actions. First, he/she may decide to communicate to the upstream water user that he/she is satisfied with the amount of water and with the harvest he/she obtains. Second, he/she may decide to do nothing. Third, he/she may decide to communicate to the upstream water user that he/she is dissatisfied with the amount of water and with the harvest obtained. Fourth, the downstream user may decide to go to a mediator who punishes the upstream water user. The mediator punishes the upstream person by giving him/her a fine, which reduces his/her earnings by 100 TSH. The downstream user, however, has to pay a cost for resorting to the mediator (such as transport costs, ‘judicial’ cost, time…), of 30 TSH.”
“After the downstream user decides on his/her reaction to the upstream user, the decision card is returned to the upstream user. This person will look at it and then make a decision on the water distribution for the next month.
[Distribute an ‘example’ decision card with 8 dots colored]
“We now distributed an example of a decision card. Imagine that you are a downstream user and, this month, the upstream user left a certain number of hours of water per day for you, the downstream user. You know that the upstream user will distribute water again next month. Now decide on your reaction to the distribution made by the upstream user. Mark an X under the action you want to take.”
[Distribute ‘example’ decision card with 12 dots for the upstream user and where a downstream user decided to punish the upstream user via the mediator]
“We now distributed an example of a decision card where an upstream user decided to use 12 hours of water. The downstream user was not happy with this. He called in a mediator for which he paid 30 TSH which he/she has to pay from his/her earnings. Calculate now how much remains for this downstream user.”

34
“At the same time, the upstream user was given a fine of 100 TSH which will be deduced from his/her earnings. Calculate now how much remains for the upstream user.”
Before the start of the experiment
[Distribute ID cards, which show ID letter and upstream/downstream role]
“It is important that you do not show to any one what is written on your ID card. And it is important to keep this card because you will need it to be paid out after this exercise. On the ID card you received you see your ID letter, the same as on your sticker, and you see if you are an upstream or a downstream user. Upstream users will have a triangle symbol on their ID cards, downstream users a square symbol.”
“Before starting with the exercise, we emphasize once again that it is important that you realize that you will never get to know the identity of the other person you are matched with, nor during nor after the exercise. Nor will the other person ever get to know your identity. We also ask you to give each other sufficient privacy, when taking decisions. Make sure that other people do not see the decision you write on the decision cards. Communication is not allowed during the exercise. If you have a question, please raise your hand, so that one of us can come to you to answer your question in private.”
“You will now do the same exercise as we did together: some of you are upstream users, others are downstream users. You will be so for the rest of the exercise. Each upstream user is matched with one downstream user. You will be matched with the same person during the rest of the exercise. The upstream users will decide several times on the number of hours they will use water from the irrigation channel. The upstream users will write down their earnings and the earnings for the downstream user. Thereafter, the downstream users receive the decision card and will then decide on how to react to the decision made by the upstream user. After that, the decision card will go back to the upstream user, so that he/she will get to know the reaction of the downstream user. Thereafter, the upstream user will decide again on water distribution for the next month. This exercise will be repeated several times.”
“The upstream persons (those with a triangle symbol on the ID card) are now asked to take a seat on the other side of the room. After everyone is seated again we will give you further instructions.”
[Upstream and downstream users are seated back-to-back. We assure that there is sufficient space between each participant to guarantee privacy and to make copying from each other difficult. Once everybody is seated again, we start with the first round of the experiment.]
Part two – Water scarcity treatment (10 rounds)
[Distribute new production table and collect the old ones].
“We now inform you that rainfall has dropped drastically, which results in water scarcity. This means that from now on the water flow has drastically decreased. Consequently, people will need more time for the same amount of water to come through to their plot. And thus you need more hours per day to get a good harvest and high earnings. It also means that you need at least 7 hours to obtain a good harvest and high earnings. All these differences are taken up in the new production table.”