how should automated vehicles communicate critical
TRANSCRIPT

94
How Should Automated Vehicles Communicate Critical Situations? AComparative Analysis of Visualization Concepts
MARK COLLEY, Institute of Media Informatics, Ulm University, GermanySVENJA KRAUSS, Institute of Media Informatics, Ulm University, GermanyMIRJAM LANZER, Institute of Psychology and Education, Dept. Human Factors, Ulm University, GermanyENRICO RUKZIO, Institute of Media Informatics, Ulm University, Germany
Passengers of automated vehicles will likely engage in non-driving related activities like reading and, therefore, be disengagedfrom the driving task. However, especially in critical situations such as unexpected pedestrian crossings, it can be assumedthat passengers request information about the vehicle’s intention and an explanation. Some concepts were proposed for suchcommunication from the automated vehicle to the passenger. However, results are not comparable due to varying informationcontent and scenarios. We present a comparative study in Virtual Reality (N=20) of four visualization concepts and a baselinewith Augmented Reality, a Head-Up Display, or Lightbands. We found that all concepts were rated reasonable and necessaryand increased trust, perceived safety, perceived intelligence, and acceptance compared to no visualization. However, whenvisualizations were compared, there were hardly any significant differences between them.
CCS Concepts: • Human-centered computing→ Human computer interaction (HCI); Haptic devices; User studies.
Additional Key Words and Phrases: Autonomous vehicles; interface design.
ACM Reference Format:Mark Colley, Svenja Krauß, Mirjam Lanzer, and Enrico Rukzio. 2021. How Should Automated Vehicles Communicate CriticalSituations? A Comparative Analysis of Visualization Concepts. Proc. ACM Interact. Mob. Wearable Ubiquitous Technol. 5, 3,Article 94 (September 2021), 23 pages. https://doi.org/10.1145/3478111
1 INTRODUCTIONAutomated vehicles (AVs) are expected to change traffic [20], the interaction between driver (or, in future,passenger) and vehicle [20], and the activities the passenger engages in [79] profoundly. Expected benefits suchas increased safety [20, 77] can only be achieved if the automation is trusted and, therefore, remains engaged [33].However, people worry about the reliability of automated cars [3, 55]. Low trust in the AV can lead to decreasedusage of its functionality and, ultimately, to low adoption. Therefore, prior work evaluated several transparentdesigns and showed their benefits [12, 58, 108]. Several visualization concepts such as a tablet- or augmentedreality (AR)-based [12, 108] as well as lightband-based [58] visualizations were proposed. Displaying relevantinformation in critical situations seems necessary [102]. However, the question remains which informationto display in which situation [102] and which visualizations are suited best to calibrate user trust in the AV.Therefore, we analyzed designs from prior work regarding how information is (spatially related to the outside
Authors’ addresses: Mark Colley, [email protected], Institute of Media Informatics, Ulm University, Ulm, Germany; Svenja Krauß,[email protected], Institute of Media Informatics, Ulm University, Ulm, Germany; Mirjam Lanzer, [email protected],Institute of Psychology and Education, Dept. Human Factors, Ulm University, Ulm, Germany; Enrico Rukzio, [email protected],Institute of Media Informatics, Ulm University, Ulm, Germany.
Permission to make digital or hard copies of all or part of this work for personal or classroom use is granted without fee provided thatcopies are not made or distributed for profit or commercial advantage and that copies bear this notice and the full citation on the first page.Copyrights for components of this work owned by others than the author(s) must be honored. Abstracting with credit is permitted. To copyotherwise, or republish, to post on servers or to redistribute to lists, requires prior specific permission and/or a fee. Request permissions [email protected].© 2021 Copyright held by the owner/author(s). Publication rights licensed to ACM.2474-9567/2021/9-ART94 $15.00https://doi.org/10.1145/3478111
Proc. ACM Interact. Mob. Wearable Ubiquitous Technol., Vol. 5, No. 3, Article 94. Publication date: September 2021.

94:2 • Colley et al.
world – called registration type and their target audience. Registration type is divided into contact analog (directlyspatially related), angle analog (the visualization points in the direction of the spatial object), and unregistered(no spatial connection). Subsequently, we implemented representatives of these three registration types in avirtual reality (VR) simulation. Additionally, we propose a Priority-based concept (see Section 4). Displayingthe priority an AV attributes to objects can provide transparency in the decision process and reassures the userof detecting an object (see [13]). We then compared these in a within-subjects experiment (N=20), includinga Baseline with no visualization. As critical situations, we employed unexpected crossings of an older person,a child, and a dog. Generally, a visualization was found highly necessary and increased, in line with previouswork, trust, perceived safety, perceived intelligence of the AV, and provided high usability. However, we foundalmost no significant differences between the visualizations for the dependent measures, suggesting that how therelevant information is displayed is of minor importance.
Contribution Statement: This work provides a literature analysis regarding communication between an AV andthe passenger. In a VR study (N=20), we compared representatives of such visualizations and a novel Priority-based concept. Our results are in line with previous work suggesting individual concepts, highlighting theneed for communication. However, our results of the comparison of different proposed and one newly definedvisualizations indicate that the differences in visualization only play a minor part. Our work helps to safelyintroduce AVs, calibrate trust in them, and maximize their usage to benefit from their expected benefits.
2 RELATED WORKBefore classifying related work, we present an overview of the effects of system transparency and visualizationsin manually driven and AVs.Visualizations in the context of manual driving are used to provide additional driving-relevant information.
Various technologies are used, for example, ambient light [65]. In their work, Matviienko et al. indicated differentinformation via brightness progression. For example, in one proposed light pattern (LP6), approaching a destinationwas indicated by moderate pulsing, a request to be ready was accompanied by fast pulsing, and the informationthat the driver should turn was indicated by moderate blinking [65]. Another example of such a lightband-conceptprovided information on overtaking-safety [59]. Other work focused on providing relevant information at thetake-over request from automated to manual driving [45, 63, 100]. Lorenz et al. [63] compared visualizing a lane.Red indicated where not to drive, green where it is safe to drive. Green led to more consistent steering behavior.Kim et al. [45] highlighted a vehicle and then let the driver indicate their fitness to overtake.The focus of this work, however, is automated driving. An essential aspect towards the usage of an AV is
trusting it. Distrusting the AV can lead to decreased usage [68] and, therefore, the anticipated advantages can notcome into effect [33, 72]. However, overtrust in automated systems can lead to disengagement in the surveillancetask and, ultimately, to fatal consequences [71]. The state in which the projected match with the actual capabilitiesis called “calibrated trust” [68]. Such trust can be established before, during, or after using such a system [34].System transparency was shown to build and maintain trust in AVs [12, 22, 32, 48, 51]. Kraus et al. [51] showedthat providing high system transparency can even prevent trust decrease after a malfunction. Frison et al. [23]showed that also the user experience influences trust in AVs.Currently, the question arises which information should be displayed during an automated journey [12, 48,
58, 102, 109]. Wintersberger et al. interviewed 56 people about automated rides. They conclude that there is “aninverse correlation between situational trust and participants’ desire for feedback” [109, p.1 ]. They also found sixthemes for information that should be provided: Predictability, impact, object characteristics, spatial properties,regulations, and visibility.Wiegand et al. [102] identified 17 relevant situations and, for these, conducted a think-aloud study with 26
participants. For unexpected driving behavior, they found the six main concerns in emotion and evaluation,
Proc. ACM Interact. Mob. Wearable Ubiquitous Technol., Vol. 5, No. 3, Article 94. Publication date: September 2021.

How Should Automated Vehicles Communicate Critical Situations? A Comparative Analysis of Visualization Concepts • 94:3
interpretation and reason, vehicle capability, interaction, future driving prediction, and explanation requesttimes [102]. While some of their situations will become less of a problem with more advanced technology (e.g.,abrupt stop at right turn, long wait at an intersection to turn left, unnecessary lane change, strong brakes andquick decisions, car is very slow), others are scenario-dependent and are only partially addressable by improvingAV’s capabilities: Reluctant turn right due to a pedestrian (scenario 2 [102]), another car stopping, a child crossing(scenario 9 [102]). Koo et al. [48] focused on the information content (intention and explanation) in a semi-autonomous vehicle. Providing the explanation lead to the highest trust; combining both messages lead to thesafest driving behavior. The authors argue that combining both messages could lead to cognitive overload. Inan AV, however, this likely is not a problem as the passenger is not involved in the driving task, which frees upcognitive resources. Löcken et al. [58] used the earlier mentioned idea of ambient light to increase user experienceand trust during an automated journey. Eighteen participants experienced three scenarios: a crossing pedestrian,a crossing cyclist, and a vehicle coming out of a parking lot. The authors compared whether only showing theconflict (in red) or showing their trajectory (in grey) on a simulated LED strip increased trust and user experience.They found that trust and all subscales were significantly higher in the conflict plus intention condition thanthe baseline. However, they found almost no effects between the conflict only and the conflict plus intentioncondition. Wintersberger et al. [107] investigated visual-olfactory reliability displays showing that including thismodality is a viable additional communication option.
3 CONCEPT CLASSIFICATIONTo gather a clear picture of visualizations regarding AVs, we classified prior work. The dimensions we usedare Target Automation Level and Registration Type. Target Automation Level refers to the intended audienceof the visualization. This is broadly distinguished into manual and automated driving. We included manualdriving as numerous concepts were proposed for manual driving and to gain a broader picture of concepts.Take-over scenarios were included in the manual driving column (e.g., [45, 63, 100]). The Registration Typerefers to the location of information visualization. Contact Analog [81] (also called world-fixed [25, 96]) visualelements refer to a display directly corresponding to the relevant physical position. If there is no connectionbetween a visual element and the physical environment, the corresponding registration type is Unregistered [80](also called screen-fixed [26]). Angle Analog visual representations refer to pointing towards objects (that couldeven be outside of the driver’s field of view; e.g., [92]). Often, concepts include technical prerequisites such asAR windshield [12] or lightbands [58]. Registration Type was, therefore, included as a technology-independentclassification that incorporates information about relevant objects via placement (except for Unregistered).
In Table 1, we show the classification of prior work. We included work that focused on visualizing informationregarding objects (or proposals, for example, [9] in manual driving) to the human user in a vehicle (excludingwork for airplanes such as [64]) and presented a study or a prototype. Work focusing on, for example, designspaces [28, 103], general requirements for such communication [102], patents, or simulators to evaluate suchdesigns (e.g., [75]) was excluded as were workshop submissions due to their non-archival state and reducedreview rigor. Additionally, publications had to be in English to ensure comprehensibility both for the authorsand the readers. We started with defining relevant keywords for the search in numerous databases (e.g., ACMDigital Library, ScienceDirect, Google Scholar) but quickly found that there was no uniform set of keywords (e.g.,Augmented Reality, Driver Assistance, Ambient Light; see also [85]). Therefore, we started with a set of knownpublications (called “query articles” [38]) relevant to the topic and analyzed their references and work citingthem (backward and forward citations [36]). These query articles were: [12, 32, 58, 60, 81, 102, 105, 108]. For thefound relevant work, we repeated this process. In total, we repeated the process three times. If work includedaspects that fit into multiple cells, these were populated individually. No time constraints were defined.
Proc. ACM Interact. Mob. Wearable Ubiquitous Technol., Vol. 5, No. 3, Article 94. Publication date: September 2021.

94:4 • Colley et al.
Table 1. Classification of prior work regarding information visualization in manual and automated driving.
Registration Type Manual Driving Automated Driving
Contact Analog 29: [2, 7, 8, 11, 14, 26, 35, 37, 45–47, 52, 54, 57, 63, 66, 69, 70, 73, 74, 78, 80–82, 87, 89, 90, 112, 113]
6: [12, 15, 56, 96, 108, 110]
Angle Analog 11: [5, 9, 17, 27, 42, 59, 61, 65, 70, 92, 104] 3: [58, 60, 105]Unregistered 19: [1, 4, 7, 26, 30–32, 41, 43, 53, 57, 66, 67, 80, 83, 89, 100, 108, 111] 4: [15, 56, 96, 108]Total 59 13
We found that most work until now focused on manual driving (59/72 or 81.94%). For each RegistrationType, publications were found. In both manual and automated driving, most publications utilize contact analogregistration. This is followed by unregistered visualization. Angle analog was used least. Additionally, threepublications in automated driving include visualizations from both the contact analog and the unregisteredregistration type (i.e., [15, 56, 108]). Regarding the reported results, all publications claim to increase trust in someway. Comparability is, however, problematic as different scenarios and different information were employed. Forexample, Wintersberger et al. [108] highlighted vehicles in fog in a simulation, Löcken et al. [58] showed conflictswith bicyclists, cars, and pedestrians in clear conditions in videos, and Colley et al. [12] visualized pedestrianintention in a simulation. However, we found no comparative study. Therefore, we compared one prototype ofeach registration type category displaying similar information in the same scenarios.
4 IMPLEMENTATION
Fig. 1. The interior of the simulated Tesla X alongside the visualizations: Head-Up Display with the message “Vehicle brakes,child on street” (1), AR with the message “Vehicle brakes, dog on street” (2), Lightband (3), and Priority with the message“Vehicle brakes, blind person on street” (4).
Proc. ACM Interact. Mob. Wearable Ubiquitous Technol., Vol. 5, No. 3, Article 94. Publication date: September 2021.
How Should Automated Vehicles Communicate Critical Situations? A Comparative Analysis of Visualization Concepts • 94:5
For the comparison, we implemented a VR simulation including traffic and pedestrians using Unity [93] andthe asset Windridge City [94]. Participants sat on a seat with a fan in front of them to reduce simulator sickness(see Figure 3a; [18]). In the simulated ride, the participant sits in a Tesla X model (see Figure 1). The modelincludes a retracted steering wheel, as it is likely that the possibility to drive manually will be present until fullautonomy (SAE Level 5) is reached. To compare the visualizations, three crossing scenarios were encounteredper ride: a child going for a ball, a person with a visual impairment, and a dog. These partly resemble previousscenarios in which an explanation was seen as helpful [58, 102]. While a child was mentioned by Wiegand etal. [102], a pedestrian with a visual impairment or a dog were not yet mentioned. The scenarios meet all exceptthe visibility criteria by Wintersberger et al. [109]. The order of the encounters was fixed per but varied betweenconditions to minimize learning effects. All visualizations display the AV’s intention and reasoning (see [48])and had the same activation times (17m prior to the situation). The compared visualizations (see Figure 1) arebased on previous work but had to, due to the differences in the concepts, be redesigned to be appropriate for thescenarios:
Head-Up Display: The vehicle is equipped with an approximately 20cm wide Head-Up Display, showing unreg-istered information in the form of a warning symbol (see attention-based specific warning visualizations [106]).Compared to the attention-specific warning by Winkler et al., we included text for the AV’s intention andreasoning (see [48]).AR: A recognized critical situation is visualized by encircling the causing object in turquoise, resembling the
contact analog registration type as the circle and text move along with the object. Turquoise is a typical colorproposed for AVs [101] due to its high peripheral visibility, attractivity, uniqueness, and discriminability also forpeople with color vision deficiency. Besides the encirclement, the AV’s intention and reasoning are displayedin text. Comparability to the found related work (see Table 1) is difficult as the proposed visualizations provideeither the information that an object was detected and whether it is safe to overtake [108, 110]), information on adetected crash with a warning sign [15], pedestrian intention [12], or a route indication [96].
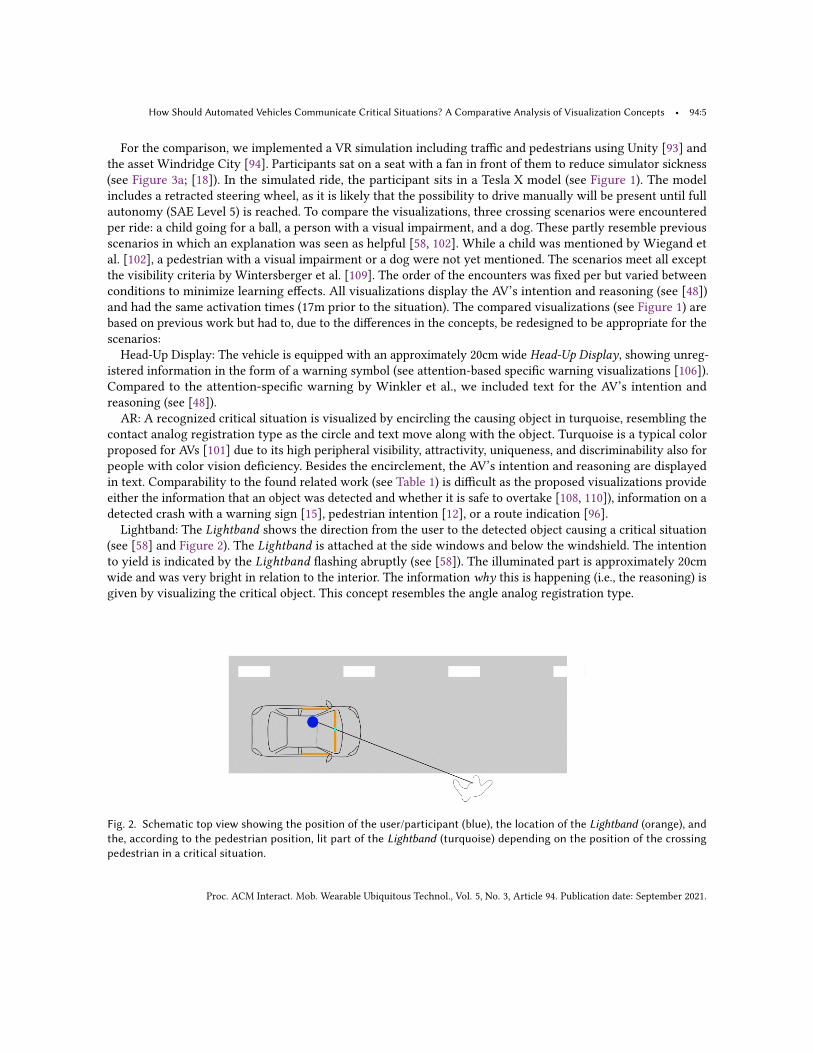
Lightband: The Lightband shows the direction from the user to the detected object causing a critical situation(see [58] and Figure 2). The Lightband is attached at the side windows and below the windshield. The intentionto yield is indicated by the Lightband flashing abruptly (see [58]). The illuminated part is approximately 20cmwide and was very bright in relation to the interior. The information why this is happening (i.e., the reasoning) isgiven by visualizing the critical object. This concept resembles the angle analog registration type.
Fig. 2. Schematic top view showing the position of the user/participant (blue), the location of the Lightband (orange), andthe, according to the pedestrian position, lit part of the Lightband (turquoise) depending on the position of the crossingpedestrian in a critical situation.
Proc. ACM Interact. Mob. Wearable Ubiquitous Technol., Vol. 5, No. 3, Article 94. Publication date: September 2021.

94:6 • Colley et al.
Priority: In this novel concept, we propose to visualize the AV’s prioritization regarding the detected objects.Via such continuous feedback, the user could continuously assess the capabilities of the AV and its priority-recognition algorithms. This was implemented as follows: In an area of r = 35 m, the AV detects every object.Depending on the object class (critical (older person, child, dog), vehicle, pedestrian, signposts) and the distance,the AV attributes different priorities to the road users (see Table 2). Here, we propose to give object in the vicinity(0 - 20m) a higher priority then further away as these objects are more likely to be relevant to the AV’s course,thus, increasing criticality. We also pose different criticalities based on the likeliness of unforeseen actions (e.g.,pedestrians change tracks more often than vehicles) and the vulnerability of the person (e.g., child and a blindperson are more vulnerable than a middle-aged person). This concept is based on the work by Kim and Canny [44].They propose to show “real-time highlighted regions of an image that causally influence the network’s output(steering control)” [44, p. 1]. The authors focus on technical feasibility. Recently, Colley et al. [13] also proposedsuch a continuous visualization of semantic information, i.e., showing detected objects via an AR windshield andreport no significant differences in trust or mental load compared to no visualization in an online video-basedstudy. This concept varies from the other three concepts, which can be seen as prototypes for a contact analog(AR), angle analog (Lightband), or unregistered (Head-Up Display) visualization. These only are visible when acritical situation is encountered. In the Priority visualization, however, the simulated AV’s attention (or priority)is constantly visible above a certain threshold. Additionally, in a critical situation, the same text is provided as inthe other concepts.
Table 2. Implementation details for the Priority visualization showing the priorities determined by the object and the distanceto the AV. Below the threshold of 5, the objects were not visualized (n.v.) to reduce visual clutter and omit cognitive overload.
Object 0 - 20 m 21 - 45 m
Critical 10 (red) 8 (orange)Pedestrians 8 6 (yellow)Vehicles 6 4 (light green, n.v.)Signposts 4 2 (light blue, n.v.)
We excluded a Head-Down Display (i.e., a dashboard visualization) as these were already shown to be inferiorcompared to a Head-Up Display in terms of performance [25, 86] and preference [12, 13].
5 STUDYTo compare the concepts, we designed and conducted a within-subject study with N=20 participants. Whileprevious work already showed that including some visualization leads to increased trust [12, 108], we included aBaseline without visualization to solidify the findings of previous work further and establish these findings in the(novel: blind person, dog) scenarios. The study apparatus is shown in Figure 3a. We used a fan to reduce motionsickness. The study was guided by the research question:
What impact does the visualization in automated vehicles in critical situations have on (1) perceivedsafety, (2) mental workload, (3) usability, (4) trust, (5) perceived intelligence, (6) attributed intention ofdevelopers, and (7) capability assessment?
5.1 ProcedureEach participant experienced five conditions, a Baseline with no visualization of the critical situation and fourconcepts: Head-Up Display, AR, Lightband-, and Priority-based.
Proc. ACM Interact. Mob. Wearable Ubiquitous Technol., Vol. 5, No. 3, Article 94. Publication date: September 2021.

How Should Automated Vehicles Communicate Critical Situations? A Comparative Analysis of Visualization Concepts • 94:7
(a) Study setup: (1) one of the two Vivebase stations, (2) HTC Vive Pro, & (3) fan.
(b) Positions of critical situations on the route of the AV. The orange lines showthe places where the children, the blue lines show where the dog, and at thegreen lines, the blind person crosses the road. The yellow line shows the routeof the AV.
Fig. 3. The study setup and the positions of critical situations in Windridge City.
Each participant was first briefly introduced to the study, signed the consent form, and filled out a demographicquestionnaire. The five conditions were then presented in counterbalanced order. The participants’ task waspresented as follows:
You will drive through a city in a Virtual Reality (VR) environment in a highly automated vehicle. Thevehicle takes over the lateral and longitudinal control (braking, acceleration, steering). The vehicle triesto detect critical situations and visualize them. You will be shown different ways of visualizing in criticalsituations. You are supposed to follow them attentively and judge them afterwards.
Every concept was explained using texts before experiencing them. These were:
• Baseline: During this ride, there is no visualization when critical situations occur.• Head-Up Display: While driving, the vehicle communicates on a small area of the windshield as soon as acritical situation has been detected. This is symbolized by a warning triangle. At the same time, the vehicle’sintention and the reason for it are communicated.
• Lightband: A lightband is located below the windshield on the driver and passenger side. As soon as the car isin the vicinity of a critical situation, the lightband lights up in the direction of the critical situation. Braking isindicated by flashing of the lightband.
• AR: The highly automated vehicle indicates via augmented reality (i.e., directly in the scene) when a criticalsituation occurs. A turquoise border is placed around the critical situations and the intention of the vehicle andthe reasoning behind it is stated.
• Priority: The highly automated vehicle now has an augmented reality display. Depending on the priority,critical objects (e.g., pedestrians and cars) are colored. The priority for an object is determined by how highthe attention of the highly automated vehicle is for the object. There are priorities from 1 to 10 (10 being thehighest), each priority is given its own color. Objects with priority 10 have the color red, objects with priority 5have the color yellow (with intermediate levels). Objects with lower priority are not displayed. The priority of
Proc. ACM Interact. Mob. Wearable Ubiquitous Technol., Vol. 5, No. 3, Article 94. Publication date: September 2021.

94:8 • Colley et al.
objects also depends on their distance from the vehicle. The intention of the vehicle and the reason for it aregiven.
Therefore, participants were aware that the vehicle detected critical situations in all conditions and werevisualized in all but the Baseline and were only observing the system and not supposed to take over control at anypoint. The situations’ occurrence was altered per condition to avoid learning effects (see Figure 3b). Participantssat in the simulated vehicle for approximately 3 min per condition and then answered the questionnaires describedbelow on a separate laptop. Finally, participants gave general feedback. On average, a session lasted 60 min.Participants were compensated with e 10. The hygiene concept regarding COVID-19 for studies (ventilation,disinfection, wearing masks) involving human subjects of our university was applied.
5.2 MeasurementsMeasurements regarding visualization concepts vary per publication. However, we chose measurements such astrust and cognitive load that are often used (for example, see [12, 58]).
After each condition, the following scales were administered: for cognitive load, the subscale mental workloadusing the raw NASA-TLX [29] on a 20-point scale was used. Other subscales were omitted due to their limitedrelevance, for example, Physical Demand as participants did not have to control the vehicle. The system usabilityscale (SUS) [10] was used to assess usability, for trust in automation, the German version of the Trust in Automationscale of Jian et al. [40] developed by Kraus et al. [51] was used. For acceptance, the van der Laan acceptancescale [95], for perceived safety, the four 7-point semantic differentials[19], and for perceived intelligence, theWarner and Sugerman’s intellectual evaluation scale [99], a proposed measurement for robots [6], was used.The attributed intention of developers was measured with the Intention of Developers subscale of the Trust inAutomation subscale by Körber [49]. This subscale uses two 5-point Likert scale items (“The developers aretrustworthy.” and “The developers take my well-being seriously.”).Additionally, participants were asked with self-developed single items on 6-point Likert scales how they
subjectively assessed the longitudinal and lateral guidance of the AV. Objectively, these were exactly the samein every condition. Participants were also asked up to which distance critical situations are recognized (correctanswer: 17 m) and whether the concept indicated in time that a critical situation existed (1 - totally disagree to 7 -totally agree). Furthermore, participants were asked whether the concept helped to comprehend the intentionof the AV (“The concept has helped to correctly assess the intention of the vehicle”; 1 - totally disagree to 7 -totally agree) and whether they would have rather taken control or let the AV in control (“Would you rather havetaken control or have the automated vehicle remain in control in these critical situations?”; 1 - Me to 7 - AV ).Participants did not, however, have any control over the vehicle nor did it differ in any of the conditions. Finally,we asked participants after each trial: In what order did the critical situations occur? to check whether participantspaid attention to the automated drive.
After all five conditions, participants rated their preferences regarding the concepts from greatest (ranking = 1)to lowest (ranking = 5). Open questions regarding feedback and improvement proposals were also administered.Participants rated their immersion using the Immersion subscale of the Technology Usage Inventory (TUI) [50]. Theusefulness and necessity of each concept and, in general, a visualization (“I think visualization is useful/necessary)in critical situations”) were measured using single-item ratings on 7-point Likert scales.
5.3 ParticipantsThe computed required sample size via an a-priori power analysis using G*Power [21] was computed. To achievea power of .85 with an alpha level of .05, 20 participants should result in an anticipated medium effect size(0.27 [24]) in a within-factors repeated measures ANOVA.
Proc. ACM Interact. Mob. Wearable Ubiquitous Technol., Vol. 5, No. 3, Article 94. Publication date: September 2021.

How Should Automated Vehicles Communicate Critical Situations? A Comparative Analysis of Visualization Concepts • 94:9
Therefore, N=20 participants (10 female, 10 male) participated in the experiment. They were on averageM=32.05(SD=13.59) years old. All participants hold a valid driving license. Ten are students, eight employees, one isself-employed, and one stated that none of the options mentioned before nor job-seeking applies. On 5-pointLikert scales (1=strongly disagree, 5=strongly agree), participants reported interest in AVs (M=3.85, SD=.99) andbelieved such an AV would ease their lives (M=3.75, SD=1.07). The participants slightly believed AVs to becomereality by 2030 (10 years from today;M=3.75, SD=1.21). The Propensity to Trust subscale of the Trust in Automationquestionnaire [49] was administered once before and once after all conditions. Propensity to Trust was relativelylow (M=2.82, SD=.81) prior to the experiment. A Wilcoxon signed-rank test revealed that, after the simulation, thevalues for Propensity to Trust did not significantly change (M=2.82, SD=.70). Participants rated their Immersion ina range from 11 to 28, with a mean of M=19.30 (SD=4.62; min possible is 4, the max possible 28). We excluded noparticipants from the analysis since none reported very low immersion (i.e., <7).
6 RESULTSWe used Friedman’s or repeated measures ANOVAs to compare the four concepts and the Baseline depending onthe data’s nature [88]. For post-hoc tests, we used Bonferroni corrections. We used Version 4.0.5 of R with allpackages up-to-date as of May 2021. RStudio Version 1.4.1103 was used. For the figures, we used the packageggstatsplot [76] which includes statistical details such as the used test and the effect size. Therefore, we refrainfrom rewriting these in text.
6.1 Perceived Safety and Mental Workload
mmean = 4.34
mmean = 6.21
mmean = 5.79 mmean = 5.76
mmean = 6.19
pBonferroni-corrected = 0.0000161 pBonferroni-corrected = 0.005
pBonferroni-corrected = 0.000422 pBonferroni-corrected = 0.001
2
4
6
8
Baseline HUD Lightband Priority AR
Per
ceiv
ed S
afet
y
cFriedman2 (4) = 24.22, p = 7.23e-05, WKendall = 0.24, CI95% [0.13, 0.45], npairs = 20
Pairwise test: Durbin-Conover test; Comparisons shown: only significant
(a) Results of perceived safety [19].
mmean = 5.35
mmean = 3.85 mmean = 3.50
mmean = 6.80
mmean = 4.00
pBonferroni-corrected = 0.009
5
10
15
20
Baseline HUD Lightband Priority AR
Men
tal W
ork
load
cFriedman2 (4) = 13.62, p = 0.009, WKendall = 0.13, CI95% [0.07, 0.31], npairs = 20
Pairwise test: Durbin-Conover test; Comparisons shown: only significant
(b) Results of mental workload [29].
Fig. 4. Results for perceived safety and mental workload.
A Friedman’s ANOVA with post-hoc tests revealed a significant effect of concept (see Figure 4). Participantsrated the perceived safety significantly lower in the Baseline compared to all other concepts (see Figure 4a).Regarding the mental workload subscale of the NASA-TLX, a Friedman’s ANOVA with post-hoc tests revealedthat the Head-Up Display resulted in the lowest mental workload, significantly lower compared to the Priorityconcept (see Figure 4b).
Proc. ACM Interact. Mob. Wearable Ubiquitous Technol., Vol. 5, No. 3, Article 94. Publication date: September 2021.

94:10 • Colley et al.
6.2 Usability and Trust in Automation
mmean = 3.80
mmean = 5.44 mmean = 5.48 mmean = 5.41
mmean = 5.69
pBonferroni-corrected = 0.002 pBonferroni-corrected = 0.005
pBonferroni-corrected = 0.013 pBonferroni-corrected = 0.000409
2
4
6
8
Baseline HUD Lightband Priority AR
Tru
st
cFriedman2 (4) = 19.35, p = 0.001, WKendall = 0.21, CI95% [0.09, 0.43], npairs = 20
Pairwise test: Durbin-Conover test; Comparisons shown: only significant
(a) Results of trust [51].
mmean = 69.75
mmean = 88.00
mmean = 84.00
mmean = 75.00
mmean = 84.88
pBonferroni-corrected = 0.02 pBonferroni-corrected = 0.003
40
60
80
100
Baseline HUD Lightband Priority AR
SU
S S
core
cFriedman2 (4) = 14.76, p = 0.005, WKendall = 0.18, CI95% [0.09, 0.37], npairs = 20
Pairwise test: Durbin-Conover test; Comparisons shown: only significant
(b) Results of the SUS [10].
Fig. 5. Results for trust and the SUS.
A Friedman’s ANOVA with post-hoc tests showed a significant effect of concept on trust (see Figure 5a)and usability (see Figure 5b). Trust was significantly higher with any of the visualizations compared to theBaseline. Usability for the Head-Up Display, the Lightband, and the AR concept was categorized as excellent(above 80.3 [84]). However, usability was only significantly higher for the Head-Up Display and the AR conceptcompared to the Baseline.
6.3 Perceived Intelligence and Intention of DevelopersFriedman’s ANOVAs found a significant effect concerning the concept for perceived intelligence (see Figure 6a)and intention of developers (see Figure 6b). The AV was rated significantly worse in the Baseline with respect toperceived intelligence and intention of developers compared to all other concepts.
6.4 Capability AssessmentRegarding lateral control, a Friedman’s ANOVA with post-hoc tests showed that the AR concept was ratedsignificantly higher than the Baseline (see Figure 7a). For longitudinal control, a Friedman’s ANOVA with post-hoc tests showed that the AR and the Head-Up Display concept were rated significantly higher than the Baseline(see Figure 7b).
All concepts except the Lightband were assessed as being able to perceive critical situations significantly earliercompared to the Baseline (see Figure 8a). However, while the concepts were activated 17m before the actualsituation (see Figure 8a dashed orange line), participants believed that the AV was less capable in perceivingthese situations (mean values are below 17m). Regarding being able to understand the intention of the AV, theresults showed significant differences for the concepts (see Figure 8b). This intention comprehensibility of theAV was rated significantly worse for the Baseline, confirming our expectations. The Lightband was also ratedsignificantly worse compared to the other concepts (AR, Head-Up Display, Priority; see Figure 8b). No significantdifferences between AR, Head-Up Display, and Priority were found.
Proc. ACM Interact. Mob. Wearable Ubiquitous Technol., Vol. 5, No. 3, Article 94. Publication date: September 2021.

How Should Automated Vehicles Communicate Critical Situations? A Comparative Analysis of Visualization Concepts • 94:11
mmean = 4.34
mmean = 5.88 mmean = 5.92 mmean = 5.93 mmean = 6.04
pBonferroni-corrected = 0.0000561 pBonferroni-corrected = 0.001
pBonferroni-corrected = 0.000261 pBonferroni-corrected = 0.00000379
2
4
6
8
Baseline HUD Lightband Priority AR
Per
ceiv
ed In
telli
gen
ce
cFriedman2 (4) = 26.91, p = 2.08e-05, WKendall = 0.26, CI95% [0.13, 0.45], npairs = 20
Pairwise test: Durbin-Conover test; Comparisons shown: only significant
(a) Results of perceived intelligence [99].
mmean = 3.30
mmean = 4.62
mmean = 4.40 mmean = 4.45 mmean = 4.62
pBonferroni-corrected = 0.0000175 pBonferroni-corrected = 0.001
pBonferroni-corrected = 0.001 pBonferroni-corrected = 0.00000901
2
4
6
Baseline HUD Lightband Priority AR
Inte
nti
on
of
Dev
elo
per
s
cFriedman2 (4) = 26.67, p = 2.32e-05, WKendall = 0.17, CI95% [0.08, 0.33], npairs = 20
Pairwise test: Durbin-Conover test; Comparisons shown: only significant
(b) Results of intention of developers [49].
Fig. 6. Results for perceived intelligence and intention of developers.
mmean = 4.00
mmean = 4.60 mmean = 4.55 mmean = 4.40
mmean = 4.65
pBonferroni-corrected = 0.027
2
4
6
Baseline HUD Lightband Priority AR
Lat
eral
Co
ntr
ol
cFriedman2 (4) = 10.51, p = 0.033, WKendall = 0.08, CI95% [0.03, 0.20], npairs = 20
Pairwise test: Durbin-Conover test; Comparisons shown: only significant
(a) Results for lateral control.
mmean = 4.05
mmean = 4.90 mmean = 4.80
mmean = 4.60
mmean = 5.00
pBonferroni-corrected = 0.03 pBonferroni-corrected = 0.003
2
3
4
5
6
Baseline HUD Lightband Priority AR
Lo
ng
itu
din
al C
on
tro
l
cFriedman2 (4) = 14.87, p = 0.005, WKendall = 0.11, CI95% [0.05, 0.29], npairs = 20
Pairwise test: Durbin-Conover test; Comparisons shown: only significant
(b) Results for longitudinal control.
Fig. 7. Results for lateral and longitudinal control.
We asked participants whether they wanted to control the vehicle in critical situations themselves. A Friedman’sANOVA with post-hoc tests found that with any concept, the willingness to let the AV be in control in criticalsituations was significantly higher than in the Baseline (see Figure 9a). The timeliness of the communicationwas rated high (Lightband: M=5.45, SD=1.54; AR: M=5.80, SD=1.74; Head-Up Display: M=5.95, SD=1.57; Priority:M=6.00, SD=1.34; see Figure 9b). A Friedman’s ANOVA with post-hoc tests found no difference between theconcepts. As the question was targeted towards the concept, the significant differences compared to the Baselineare irrelevant.
Proc. ACM Interact. Mob. Wearable Ubiquitous Technol., Vol. 5, No. 3, Article 94. Publication date: September 2021.

94:12 • Colley et al.
mmean = 4.50
mmean = 9.45
mmean = 7.10
mmean = 8.97 mmean = 9.40
pBonferroni-corrected = 0.032 pBonferroni-corrected = 0.018
pBonferroni-corrected = 0.008
0
10
20
30
Baseline HUD Lightband Priority AR
Per
cep
tio
n D
etec
tio
n (
m)
cFriedman2 (4) = 14.39, p = 0.006, WKendall = 0.12, CI95% [0.02, 0.32], npairs = 20
Pairwise test: Durbin-Conover test; Comparisons shown: only significant
(a) Results for critical situation perception. The dashed orangeline represents the actual distance for the visualization.
mmean = 2.10
mmean = 6.20
mmean = 5.35
mmean = 6.10 mmean = 6.15
pBonferroni-corrected = 0.0000000000787
pBonferroni-corrected = 0.001
pBonferroni-corrected = 0.000000000664
pBonferroni-corrected = 0.000000000946
pBonferroni-corrected = 0.003
pBonferroni-corrected = 0.014
pBonferroni-corrected = 0.018
2.5
5.0
7.5
Baseline HUD Lightband Priority AR
Inte
nti
on
co
mp
reh
ensi
bili
ty
cFriedman2 (4) = 44.15, p = 5.98e-09, WKendall = 0.45, CI95% [0.30, 0.62], npairs = 20
Pairwise test: Durbin-Conover test; Comparisons shown: only significant
(b) Results for intention comprehensibility.
Fig. 8. Results for situation perception and intention comprehensibility.
mmean = 3.25
mmean = 4.85 mmean = 4.65
mmean = 5.05 mmean = 5.15
pBonferroni-corrected = 0.000107
pBonferroni-corrected = 0.01
pBonferroni-corrected = 0.0000245
pBonferroni-corrected = 0.0000073
2
4
6
8
Baseline HUD Lightband Priority AR
Me
¬C
on
tro
l®A
V
cFriedman2 (4) = 27.26, p = 1.76e-05, WKendall = 0.21, CI95% [0.10, 0.39], npairs = 20
Pairwise test: Durbin-Conover test; Comparisons shown: only significant
(a) Results for control distribution.
mmean = 1.80
mmean = 5.95
mmean = 5.45
mmean = 6.00 mmean = 5.80
pBonferroni-corrected = 0.000000000023
pBonferroni-corrected = 0.00000213
pBonferroni-corrected = 0.00000000323
pBonferroni-corrected = 0.000000000095
2
4
6
8
Baseline HUD Lightband Priority AR
Tim
elin
ess
cFriedman2 (4) = 44.32, p = 5.52e-09, WKendall = 0.46, CI95% [0.36, 0.60], npairs = 20
Pairwise test: Durbin-Conover test; Comparisons shown: only significant
(b) Results for timeliness of visualization.
Fig. 9. Results for control distribution (oneself vs. AV) and timeliness.
6.5 Acceptance and Concept PreferencesA repeated measures ANOVA with post-hoc tests showed a significant difference in the usefulness (see Figure 10a)and a Friedman’s ANOVA with post-hoc tests showed a significant difference in the satisfaction (see Figure 10b)between the Baseline and all other concepts.The Head-Up Display concept received rankings indicating the highest preference, i.e., the lowest mean
(see Figure 11). The Baseline was rated significantly worse than all other concepts, followed by Priority andLightband, without significant difference between them. The AR concept had the second-highest preference and
Proc. ACM Interact. Mob. Wearable Ubiquitous Technol., Vol. 5, No. 3, Article 94. Publication date: September 2021.

How Should Automated Vehicles Communicate Critical Situations? A Comparative Analysis of Visualization Concepts • 94:13
mmean = -0.53
mmean = 0.99 mmean = 0.84 mmean = 0.88 mmean = 0.95
pBonferroni-corrected = 0.007 pBonferroni-corrected = 0.001
pBonferroni-corrected = 0.007 pBonferroni-corrected = 0.004
-2
-1
0
1
2
3
Baseline HUD Lightband Priority AR
Use
fuln
ess
FFisher(2.86,40.03) = 11.59, p = 1.73e-05, hp2 = 0.45, CI95% [0.24, 0.59], npairs = 15
Pairwise test: Student's t-test; Comparisons shown: only significant
(a) Results of usefulness [95].
mmean = -0.28
mmean = 0.83 mmean = 0.82 mmean = 0.72
mmean = 0.85
pBonferroni-corrected = 0.001 pBonferroni-corrected = 0.001
pBonferroni-corrected = 0.024 pBonferroni-corrected = 0.002
-2
-1
0
1
2
3
Baseline HUD Lightband Priority AR
Sat
isfa
ctio
n
cFriedman2 (4) = 18.80, p = 0.001, WKendall = 0.27, CI95% [0.15, 0.47], npairs = 15
Pairwise test: Durbin-Conover test; Comparisons shown: only significant
(b) Results of satisfaction [95].
Fig. 10. Subscales of the acceptance scale [95]. 15 datasets were used as one measurement missed for the first five participants.
mmean = 4.80
mmean = 1.80
mmean = 2.10
mmean = 2.95
mmean = 3.35
pBonferroni-corrected = 0.004
pBonferroni-corrected = 0.000000000138
pBonferroni-corrected = 0.00000000000281
pBonferroni-corrected = 0.0000061
pBonferroni-corrected = 0.001
pBonferroni-corrected = 0.011
2
4
6
Baseline HUD AR Lightband Priority
Ran
k
cFriedman2 (4) = 44.92, p = 4.13e-09, WKendall = 0.56, CI95% [0.49, 0.70], npairs = 20
Pairwise test: Durbin-Conover test; Comparisons shown: only significant
Fig. 11. Preferences for the concepts (lower is better).
was rated as significantly better than the Priority concept. The Head-Up Display had the highest preference andwas rated as significantly better than all the other concepts except for the AR.
Proc. ACM Interact. Mob. Wearable Ubiquitous Technol., Vol. 5, No. 3, Article 94. Publication date: September 2021.

94:14 • Colley et al.
6.6 Reasonability and NecessityParticipants were asked about their agreement towards the reasonability and necessity for each concept, avisualization in general, and the communication of the AV’s intention and the explanation on 7-point Likertscales (1=Totally disagree to 7=Totally agree; see Table 3).
Table 3. Assessments of necessity and reasonability for concepts and general visualization. Additionally, the visualization ofintention and explanation were rated.
Variable Min q1 x̃ x̄ q3 Max sd IQRLightband reasonable 1 2.75 5 4.70 6.25 7 2.03 3.50Lightband necessary 1 2.00 5 4.25 6.00 7 1.94 4.00Head-Up Display reasonable 3 6.00 7 6.25 7.00 7 1.16 1.00Head-Up Display necessary 2 5.00 6 5.65 7.00 7 1.50 2.00AR reasonable 2 5.00 6 5.90 7.00 7 1.29 2.00AR necessary 1 5.00 6 5.70 7.00 7 1.53 2.00Priority reasonable 1 2.00 4.50 4.05 6.00 7 2.09 4.00Priority necessary 1 2.00 4.00 3.95 5.00 7 1.90 3.00visualization reasonable 4 7.00 7 6.70 7.00 7 0.80 0.00visualization necessary 3 5.75 6 6.05 7.00 7 1.15 1.25intention reasonable 1 4.75 6 5.40 7.00 7 2.06 2.25intention necessary 1 3.75 6 5.00 7.00 7 2.32 3.25explanation reasonable 1 3.00 5 4.85 7.00 7 2.16 4.00explanation necessary 1 2.00 5 4.25 5.25 7 2.05 3.25
Participants rated the Head-Up Display as most reasonable (M=6.25, SD=1.16). The AR (M=5.70, SD=1.53) and theHead-Up Display (M=5.65, SD=1.50) were the concepts that were rated most necessary. The Priority was rated boththe least reasonable (M=4.05, SD=2.09) and the least necessary (M=3.95, SD=1.90). Friedman’s ANOVAs showedsignificant differences in the reasonability scores (𝜒2 (3)=15.18, p=.0017) and the necessity scores (𝜒2 (3)=19.58,p<.001). Post-hoc tests showed that the Lightband and the Priority were rated significantly less reasonable thanthe Head-Up Display. The Lightband was also rated significantly less necessary than the Head-Up Display. Overall,a visualization was rated as highly reasonable (M=6.70, SD=.80) and necessary (M=6.05, SD=1.15; see Table 3).
6.7 Situation RelevanceAfter the study, we asked participants how critical they perceived the situations. Participants also ranked thesituations according to the perceived criticality (1 = highest criticality). While participants rated all situationsas highly critical (dog: M=6.60, child: M=6.80, blind person: M=6.85), a Friedman’s ANOVA found a significantdifference in the ranking (𝜒2 (2)=16.90, p<.001) there was a clear ranking of the criticality: children (M=1.35),then blind person (M=2.00), and least critical, the dog (M=2.65). Post-hoc tests showed all these differences to besignificant.
6.8 Open FeedbackNo participant stated that such a communication/visualization is unnecessary, on the contrary, for example [P3]stated that “actually I just found the system without visualization bad because you can’t get any informationfrom the car. I expect this from a car that drives itself!” [P7] stated that “without visualization important /necessary information is missing” despite not actually being involved in the driving task. Regarding improvementproposals, three participants wanted an acoustic signal accompanying the visualization. Some participants wantedto combine two systems. [P3] and [P8] wanted to combine Head-Up Display and Lightband, [P13] AR and Head-Up
Proc. ACM Interact. Mob. Wearable Ubiquitous Technol., Vol. 5, No. 3, Article 94. Publication date: September 2021.

How Should Automated Vehicles Communicate Critical Situations? A Comparative Analysis of Visualization Concepts • 94:15
Display. [P20] stated that “Several systems should be offered as an option that everyone can individually adjustaccording to their trust in the system. For example, the system may initially be able to take away the skepticismof drivers, but once the skepticism has been taken away and one trusts the vehicle completely, the option can beset down to the lightband. This means that after building up trust, the system may become annoying and shouldbe able to be adjusted down in intensity.” This is interesting as not the information content but the intensity is therelevant factor for this participant claiming that the information is still relevant but visualization should be lessintense in later stages of using the AV. Some participants also suggested to visualize more situations and objectssuch as objects affecting the trajectory ([P5]), all pedestrians crossing the road ([P2] and [P12]), or braking andturning ([P7]).
7 DISCUSSIONOverall, all concepts (except the Baseline) had high trust, acceptance, perceived intelligence, and perceived safetyratings. This confirms previous work that showed that transparent systems [16, 48] and AR systems [12, 32, 108]lead to increased trust, acceptance, and perceived safety. Usability was only assessed as significantly higher inthe Head-Up Display and the AR concept compared to the Baseline (see Figure 5b). The Lightband concept evokedhigher mental workload than the Head-Up Display (significantly) and the Baseline as well as led as the onlyconcept not to earlier critical situation perception compared to the Baseline. Participants rated the visualizationof critical situations as highly necessary and reasonable. However, participants did not show great variety in theirassessments between the four concepts (Head-Up Display, AR, Priority, Lightband). Therefore, we reflect on thegeneral necessity and the relevance of the visualization. Finally, we discuss practical implications for future AVs.
7.1 Necessity of Critical Situation VisualizationThe data shows that a visualization, in general, was rated as highly reasonable (see Table 3), and all visualizationswere preferred over no visualization. Additionally, almost all measurements indicate the superiority of havingcommunication in critical situations (except mental workload, which was higher for Priority but low for allother concepts; see Figure 4b). Regarding explainable automation requirements in the context of AVs, our criticalsituations cover some of the themes presented by Wintersberger et al. [109]. As the pedestrians and the dogimpact the trajectory, visualizing these enhances predictability of AV’s actions. These road users are moving (seeobject characteristics [109]) across the street (see spatial properties [109]) and belong to very vulnerable groups (seeregulations [109]). Their visibility, however, is rather high. Nevertheless, our experiment supports the findingsof Wintersberger et al. [109] in that these properties are relevant for explainable automation. Therefore, in linewith previous work[12, 16, 32, 48, 108], we conclude that visualizations of the detection and the intention plusexplanation in critical situations are necessary.
In line with work by Wiegand et al. [102], participants indicated that they did not want to take over control ofthe vehicle in the presence of an explaining visualization (see Figure 9a). Therefore, presenting such informationhelps to avoid post-automation effects (see also [97, 98]).
7.2 Relevance of Visualization TypeAs shown in Table 1, numerous works used different types of visualizations to aid drivers (e.g., [46, 69, 78, 80]) andto increase trust in AVs (e.g., [58]). While we categorized these by the technology-independent registration type,different technologies were also used or simulated. Löcken et al. [58, 60] used ambient light via LED strips whileothers used AR windshields [12, 56, 108]. Today, Head-Up Display become prevalent in vehicles. These couldalso be used in an autonomous context to provide relevant information. Therefore, we compared this plethora ofvisualization concepts for critical situations (child, a person with a visual impairment, or dog crossing). While all
Proc. ACM Interact. Mob. Wearable Ubiquitous Technol., Vol. 5, No. 3, Article 94. Publication date: September 2021.

94:16 • Colley et al.
concepts (besides the Lightband concept) performed consistently better than the Baseline, there were only veryfew significant differences between the concepts.Intention comprehensibility (see Figure 8b) was significantly worse for the Lightband concept compared to
the other visualizations. AR also lead to perceived higher perceived lateral and longitudinal control comparedto the Baseline, which the other visualizations did not (see Figure 7). Also, the SUS showed that only Head-UpDisplay and AR (see Figure 5b) were rated significantly better than theBaseline in terms of usability. We alsofound significant differences for mental workload (AR significantly lower compared to Priority; see Figure 4b) andfor intention comprehensibility (Lightband lower than all other concepts; see Figure 8b). Preferences, however,showed that participants favored the Head-Up Display or the AR concept. The discrepancy between dependentmeasurements and preference indicates that the employed performance metrics are not that relevant for personalpreference. As only a few differences were found, we conclude that all concepts provide clear benefits to a user,with the Lightband concept being the most complicated to understand but also, from a technical standpoint, theeasiest implementable.
While lateral and longitudinal control for the AV were the same in all conditions, we found that the Baseline wasrated significantly worse than the AR concept for lateral (see Figure 7a) and significantly worse than the Head-UpDisplay and the AR (see Figure 7b) for longitudinal control. A visualization also led to a significantly higheracceptance of letting the AV in control (see Figure 9a). Together with a significantly better attributed criticalsituation perception (see Figure 8a) and significantly higher perceived intelligence and intention of developers(see Figure 8), we constitute that the Halo effect is at work here. The Halo effect is a cognitive bias that leads topositive impressions of system attributes based on other (unrelated) positive impressions. Our work contrastswith the work presented by Colley et al. [12]. In their work, different concepts visualizing pedestrians’ intentionslead to no significant differences for lateral and longitudinal control.
7.3 Relevance of ScenarioWith the study design, we measured the dependent variables after all three scenarios were encountered pervisualization. Therefore, the study design did not allow us to explore differences between the scenarios. Thechild scenario resembles scenario 9 in the work of Wiegand et al. [102]. However, the other scenarios werenot accounted for and provide two additional scenarios in which an explanation seems necessary. Wiegand etal. [102] proposed other scenarios in which an explanation could be necessary or wanted. Most of these includeunexpected behavior by the AV, only scenarios 2, 8, and 9 include a pedestrian. In some of our scenarios, morepedestrians were present than the one performing the critical behavior. We found that Head-Up Display andAR were rated almost equally regarding their preference. However, in scenarios with even more pedestrians, acontact analog, i.e., the AR concept, could be beneficial as the relevant object for the AV’s behavior is clearlyhighlighted.
7.4 On the Need of Comparative Studies and Baseline SelectionThis work presents a comparative study regarding visualization concepts for the communication of AVs withpassengers. These were derived from the literature (Lightband, AR, Head-Up Display) and included one novelconcept (Priority). The results show that in several often used dependent variables (trust, control, perceivedintelligence, usability, mental workload), there is little difference between the conditions but significant differencesto the Baseline. Therefore, the question arises whether the right dependent variables are currently used in researchon the visualization in critical systems or whether the measurements are sensitive enough to assess the differencesbetween the concepts as participants showed a strong preference towards Head-Up Display and AR concepts.The reasons for this could be manifold, including personal preference or familiarity (with Head-Up Display, forexample). As most studies only compared the developed concept (and variations of it) with a baseline without
Proc. ACM Interact. Mob. Wearable Ubiquitous Technol., Vol. 5, No. 3, Article 94. Publication date: September 2021.

How Should Automated Vehicles Communicate Critical Situations? A Comparative Analysis of Visualization Concepts • 94:17
any visualization, and as we showed that all concepts were mostly rated higher compared to the Baseline, westrongly argue that future work must include other proposed concepts more in their studies. It is obvious that thisincreases the number of conditions, however, we propose to at least choose a baseline that is not without anyvisualization but is actually the best-rated concept in literature. We conclude that more comparative studies arenecessary to account for the numerous visualization concepts proposed.
7.5 Practical Implications and Design RecommendationsPrevious work in social psychology showed that people prefer simple [62], general [62], and coherent (withprior knowledge) [91] explanations. In the domain of automated driving, Koo et al. [48] demonstrated thatproviding why information led to highest trust. While the authors mentioned that additionally presenting howinformation could lead to cognitive overload [48], we included this information to increase system transparency.We argue that in the context of AVs, cognitive overload is only a problem with higher mental workload as the AVcompletely takes over the primary driving task. Our results indicate that providing the intention of the vehicle(how information) was assessed as even more reasonable (M=5.40, SD=2.06) than providing the explanation (whyinformation; M=4.85, SD=2.16; see Table 3).
Previous work discussed AR windshield displays’ feasibility, especially highlighting the areas depth perception,tracking, registration, lighting, background, and color blending [25]. While the AR approach is more techno-logically advanced, already today, the Head-Up Display or Lightband approaches are feasible or even alreadypresent. Therefore, we argue that for automated rides that could be feasible in some scenarios, this technologyshould be used. In the future, with fully AVs (SAE Level 5), our data suggests that visualizing the intent and anexplanation in a critical situation is reasonable and necessary, at least in the introductory phase. With our data,we highlight that no technologically advanced visualization (e.g., AR) is necessary for this visualization. As it isunclear when such AR technology is available, the already available Head-Up Display seems to be an appropriatevisualization technique. Open feedback also indicated that information needs of AV users will likely change overtime. Therefore, the design of such information visualization should not be static over the course of usage by anindividual but should incorporate knowledge about the user’s experience with AVs. One possible combinationalready feasible would be Head-Up Display and afterward Lightband.
While some work suggests that it should be configurable which situations are highlighted [60], we believe thata standardized approach is beneficial as rides with multiple passengers should not lead to confusion for some ofthem.
8 LIMITATIONSRegarding the classification of prior work, we employed a semi-systematic approach due to the vastness ofrelevant keywords. Therefore, some relevant literature could be missing in the classification. Nevertheless, weincluded all relevant work which other current work (e.g., [58, 102, 109]) base their publications on. As a VRsimulation was used, transferability to the real world is limited. While we provided an immersive scenario, thevection of the vehicle could not be simulated with our setup. Also, participants potentially did not perceive risksin the critical situations due to the VR. Lastly, the AR and Priority portrayed futuristic technology which couldnot be available at the entry phase of AVs. Regarding attendance, a limited number of participants took part(N=20). Only visual concepts for critical situation communication were used. While this modality is unobtrusiveand, therefore, potentially highly acceptable, from our study, it is unclear whether other modalities (e.g., audition,tactition, olfaction [107], thermoception) would perform better. Also, only three situations were used. A multitudeof situations is possible (see [58, 102]) and it is unclear whether our findings hold for these other situations.However, we chose situations which can not be overcome by technology alone, therefore, provide evidence for aset of situations imaginable even in the distant future. The AV detected critical situations 17 m before the stopping
Proc. ACM Interact. Mob. Wearable Ubiquitous Technol., Vol. 5, No. 3, Article 94. Publication date: September 2021.

94:18 • Colley et al.
point (see Figure 8a). While this was necessary to ensure comparability, this is likely not possible in a real-worldscenario. While Waymo claims to “identify [...] stop signs greater than 500 meters away” [39], detecting criticalsituations is more difficult as these can occur instantaneously and often moving objects are involved. The findingsare also limited as for dependent measurements, only subjective ratings were used.
9 CONCLUSION AND FUTURE WORKIn conclusion, we classified prior work in manual and automated driving regarding the proposed registrationtype of information via a backward and forward search. A representative for each of the three registrationtype contact analog, angle analog, and unregistered was implemented, and we additionally proposed a novelpriority-based concept. These were compared in a controlled experiment in VR (N=20) together with a Baseline.The results showed that the ratings between concepts were close together and only few significant differenceswere found. However, almost all concepts were rated significantly better in most dependent measures comparedto the Baseline. We conclude that more comparative studies are necessary and reflect on the chosen dependentvariables. Future work must, therefore, deeply consider their choice of baseline and compare their solutions toexisting ones. Additionally, the potential difference in needs of novice and experienced users of AVs should beexplored.
ACKNOWLEDGMENTSThe authors thank all study participants. This work was conducted within the project ’Interaction betweenautomated vehicles and vulnerable road users’ (Intuitiver) funded by the Ministry of Science, Research and Artsof the State of Baden-Württemberg.
REFERENCES[1] Lotfi Abdi, Faten Ben Abdallah, and Aref Meddeb. 2015. In-vehicle augmented reality traffic information system: a new type of
communication between driver and vehicle. Procedia Computer Science 73 (2015), 242–249.[2] Lotfi Abdi and Aref Meddeb. 2018. Driver information system: a combination of augmented reality, deep learning and vehicular Ad-hoc
networks. Multimedia Tools and Applications 77, 12 (2018), 14673–14703.[3] Continental AG. 2013. Continental Mobility Study 2013. https://www.continental.com/resource/blob/7380/
6cddc571cd3d3b5cacd279fe0d1a00c1/mobistud-2013-dl-data.pdf. [Online; accessed: 07-DECEMBER-2019].[4] Patrícia RJA Alves, Joel Gonçalves, Rosaldo JF Rossetti, Eugénio C Oliveira, and Cristina Olaverri-Monreal. 2013. Forward collision
warning systems using heads-up displays: Testing usability of two new metaphors. In 2013 IEEE Intelligent Vehicles SymposiumWorkshops (IV Workshops). IEEE, IEEE, New York, NY, USA, 1–6.
[5] Karlin Bark, Cuong Tran, Kikuo Fujimura, and Victor Ng-Thow-Hing. 2014. Personal Navi: Benefits of an Augmented RealityNavigational Aid Using a See-Thru 3D Volumetric HUD. In Proceedings of the 6th International Conference on Automotive User Interfacesand Interactive Vehicular Applications (Seattle, WA, USA) (AutomotiveUI ’14). Association for Computing Machinery, New York, NY,USA, 1–8. https://doi.org/10.1145/2667317.2667329
[6] Christoph Bartneck, Dana Kulić, Elizabeth Croft, and Susana Zoghbi. 2009. Measurement instruments for the anthropomorphism,animacy, likeability, perceived intelligence, and perceived safety of robots. International Journal of Social Robotics 1, 1 (2009), 71–81.https://doi.org/10.1007/s12369-008-0001-3
[7] Kassandra Bauerfeind, Julia Drüke, Lennart Bendewald, and Martin Baumann. 2018. When does the driver benefit from AR-informationin a navigation task compared to a Head-Up Display? Results of a driving simulator study.
[8] U Bergmeier and Christian Lange. 2008. Acceptance of Augmented Reality for driver assistance information.[9] Shadan Sadeghian Borojeni, Lewis Chuang, Wilko Heuten, and Susanne Boll. 2016. Assisting Drivers with Ambient Take-Over
Requests in Highly Automated Driving. In Proceedings of the 8th International Conference on Automotive User Interfaces and InteractiveVehicular Applications (Ann Arbor, MI, USA) (Automotive’UI 16). Association for Computing Machinery, New York, NY, USA, 237–244.https://doi.org/10.1145/3003715.3005409
[10] John Brooke et al. 1996. SUS-A quick and dirty usability scale. Usability evaluation in industry 189, 194 (1996), 4–7.[11] Kar-Hai Chu, Robert Brewer, and Sam Joseph. 2008. Traffic and navigation support through an automobile heads up display (a-HUD).[12] Mark Colley, Christian Bräuner, Mirjam Lanzer, Marcel Walch, Martin Baumann, and Enrico Rukzio. 2020. Effect of Visualization
of Pedestrian Intention Recognition on Trust and Cognitive Load. In 12th International Conference on Automotive User Interfaces and
Proc. ACM Interact. Mob. Wearable Ubiquitous Technol., Vol. 5, No. 3, Article 94. Publication date: September 2021.

How Should Automated Vehicles Communicate Critical Situations? A Comparative Analysis of Visualization Concepts • 94:19
Interactive Vehicular Applications (Virtual Event, DC, USA) (AutomotiveUI ’20). ACM, Association for Computing Machinery, New York,NY, USA, 181–191. https://doi.org/10.1145/3409120.3410648
[13] Mark Colley, Benjamin Eder, Jan Ole Rixen, and Enrico Rukzio. 2021. Effects of Semantic Segmentation Visualization on Trust, SituationAwareness, and Cognitive Load in Highly Automated Vehicles. In Proceedings of the 2021 CHI Conference on Human Factors in ComputingSystems (CHI ’21). Association for Computing Machinery, New York, NY, USA. https://doi.org/10.1145/3411764.3445351
[14] Daniel Damböck, Thomas Weißgerber, Martin Kienle, and Klaus Bengler. 2012. Evaluation of a contact analog head-up display forhighly automated driving. In 4th International Conference on Applied Human Factors and Ergonomics. Citeseer, CRC Press, San FranciscoCA, USA, 6011 – 6020.
[15] Henrik Detjen, Stefan Geisler, and Stefan Schneegass. 2020. “Help, Accident Ahead!”: Using Mixed Reality Environments in AutomatedVehicles to Support Occupants After Passive Accident Experiences. In 12th International Conference on Automotive User Interfaces andInteractive Vehicular Applications (Virtual Event, DC, USA) (AutomotiveUI ’20). Association for Computing Machinery, New York, NY,USA, 58–61. https://doi.org/10.1145/3409251.3411723
[16] Na Du, Jacob Haspiel, Qiaoning Zhang, Dawn Tilbury, Anuj K. Pradhan, X. Jessie Yang, and Lionel P. Robert. 2019. Look who’s talkingnow: Implications of AV’s explanations on driver’s trust, AV preference, anxiety and mental workload. Transportation Research Part C:Emerging Technologies 104 (2019), 428–442. https://doi.org/10.1016/j.trc.2019.05.025 ID: 271729.
[17] Marc Dziennus, Johann Kelsch, and Anna Schieben. 2016. Ambient light based interaction concept for an integrative driver assistancesystem–a driving simulator study. , 171–182 pages.
[18] Joep Eijkemans. 2019. Motion sickness in a Virtual Reality cycling simulation. http://essay.utwente.nl/78690/[19] Stefanie M. Faas, Andrea C. Kao, and Martin Baumann. 2020. A Longitudinal Video Study on Communicating Status and Intent for Self-
Driving Vehicle – Pedestrian Interaction. In Proceedings of the 2020 CHI Conference on Human Factors in Computing Systems (Honolulu,HI, USA) (CHI ’20). Association for Computing Machinery, New York, NY, USA, 1–14. https://doi.org/10.1145/3313831.3376484
[20] Daniel J Fagnant and Kara Kockelman. 2015. Preparing a nation for autonomous vehicles: opportunities, barriers and policy recom-mendations. Transportation Research Part A: Policy and Practice 77 (2015), 167–181.
[21] Franz Faul, Edgar Erdfelder, Axel Buchner, and Albert-Georg Lang. 2009. Statistical power analyses using G* Power 3.1: Tests forcorrelation and regression analyses. Behavior research methods 41, 4 (2009), 1149–1160.
[22] Yannick Forster, Johannes Kraus, Sophie Feinauer, and Martin Baumann. 2018. Calibration of Trust Expectancies in ConditionallyAutomated Driving by Brand, Reliability Information and Introductionary Videos: An Online Study. In Proceedings of the 10thInternational Conference on Automotive User Interfaces and Interactive Vehicular Applications (Toronto, ON, Canada) (AutomotiveUI ’18).Association for Computing Machinery, New York, NY, USA, 118–128. https://doi.org/10.1145/3239060.3239070
[23] Anna-Katharina Frison, Philipp Wintersberger, Andreas Riener, Clemens Schartmüller, Linda Ng Boyle, Erika Miller, and KlemensWeigl. 2019. In UX We Trust: Investigation of Aesthetics and Usability of Driver-Vehicle Interfaces and Their Impact on the Perceptionof Automated Driving. In Proceedings of the 2019 CHI Conference on Human Factors in Computing Systems (Glasgow, Scotland Uk) (CHI’19). Association for Computing Machinery, New York, NY, USA, 1–13. https://doi.org/10.1145/3290605.3300374
[24] David C. Funder and Daniel J. Ozer. 2019. Evaluating Effect Size in Psychological Research: Sense and Nonsense. Ad-vances in Methods and Practices in Psychological Science 2, 2 (2019), 156–168. https://doi.org/10.1177/2515245919847202arXiv:https://doi.org/10.1177/2515245919847202
[25] J. L. Gabbard, G. M. Fitch, and H. Kim. 2014. Behind the Glass: Driver Challenges and Opportunities for AR Automotive Applications.Proc. IEEE 102, 2 (2014), 124–136.
[26] Joseph L. Gabbard, Missie Smith, Kyle Tanous, Hyungil Kim, and Bryan Jonas. 2019. AR DriveSim: An Immersive Driving Simulator forAugmented Reality Head-Up Display Research. Frontiers in Robotics and AI 6 (2019), 98. https://doi.org/10.3389/frobt.2019.00098
[27] Paul George, Indira Thouvenin, Vincent Fremont, and Véronique Cherfaoui. 2012. DAARIA: Driver assistance by augmented reality forintelligent automobile. In 2012 IEEE Intelligent Vehicles Symposium. IEEE, IEEE, New York, NY, USA, 1043–1048.
[28] Renate Haeuslschmid, Bastian Pfleging, and Florian Alt. 2016. A Design Space to Support the Development of Windshield Applicationsfor the Car. In Proceedings of the 2016 CHI Conference on Human Factors in Computing Systems (San Jose, California, USA) (CHI ’16).Association for Computing Machinery, New York, NY, USA, 5076–5091. https://doi.org/10.1145/2858036.2858336
[29] Sandra G Hart and Lowell E Staveland. 1988. Development of NASA-TLX (Task Load Index): Results of empirical and theoreticalresearch. In Advances in psychology. Vol. 52. Elsevier, Amsterdam, The Netherlands, 139–183.
[30] Renate Häuslschmid, Sven Osterwald, Marcus Lang, and Andreas Butz. 2015. Augmenting the Driver’s Viewwith Peripheral Informationon a Windshield Display. In Proceedings of the 20th International Conference on Intelligent User Interfaces (Atlanta, Georgia, USA) (IUI’15). Association for Computing Machinery, New York, NY, USA, 311–321. https://doi.org/10.1145/2678025.2701393
[31] Renate Häuslschmid, Donghao Ren, Florian Alt, Andreas Butz, and Tobias Höllerer. 2019. Personalizing content presentation on large3d head-up displays. PRESENCE: Virtual and Augmented Reality 27, 1 (2019), 80–106.
[32] Renate Häuslschmid, Max von Bülow, Bastian Pfleging, and Andreas Butz. 2017. Supporting Trust in Autonomous Driving. InProceedings of the 22nd International Conference on Intelligent User Interfaces (Limassol, Cyprus) (IUI ’17). Association for ComputingMachinery, New York, NY, USA, 319–329. https://doi.org/10.1145/3025171.3025198
Proc. ACM Interact. Mob. Wearable Ubiquitous Technol., Vol. 5, No. 3, Article 94. Publication date: September 2021.

94:20 • Colley et al.
[33] Philipp Hock, Johannes Kraus, Marcel Walch, Nina Lang, and Martin Baumann. 2016. Elaborating Feedback Strategies for MaintainingAutomation in Highly Automated Driving. In Proceedings of the 8th International Conference on Automotive User Interfaces and InteractiveVehicular Applications (Ann Arbor, MI, USA) (Automotive’UI 16). Association for Computing Machinery, New York, NY, USA, 105–112.https://doi.org/10.1145/3003715.3005414
[34] Kevin Anthony Hoff and Masooda Bashir. 2015. Trust in automation: Integrating empirical evidence on factors that influence trust.Human factors 57, 3 (2015), 407–434.
[35] Amin Hosseini, Daniel Bacara, and Markus Lienkamp. 2014. A system design for automotive augmented reality using stereo nightvision. In 2014 IEEE Intelligent Vehicles Symposium Proceedings. IEEE, IEEE, New York, NY, USA, 127–133.
[36] Xiaojun Hu, Ronald Rousseau, and Jin Chen. 2011. On the definition of forward and backward citation generations. Journal ofInformetrics 5, 1 (2011), 27–36.
[37] Yoonsook Hwang, Byoung-Jun Park, and Kyong-Ho Kim. 2016. Effects of Augmented-Reality Head-up Display System Use on RiskPerception and Psychological Changes of Drivers. ETRI Journal 38, 4 (2016), 757–766.
[38] A Cecile JW Janssens, Marta Gwinn, J Elaine Brockman, Kimberley Powell, and Michael Goodman. 2020. Novel citation-based searchmethod for scientific literature: a validation study. BMC medical research methodology 20, 1 (2020), 25.
[39] Satish Jeyachandran. 2020. Introducing the 5th-generation Waymo Driver: Informed by experience, designed for scale, engineeredto tackle more environments. https://blog.waymo.com/2020/03/introducing-5th-generation-waymo-driver.html [Online; accessed24-MARCH-2020].
[40] Jiun-Yin Jian, Ann M Bisantz, and Colin G Drury. 2000. Foundations for an empirically determined scale of trust in automated systems.International Journal of Cognitive Ergonomics 4, 1 (2000), 53–71.
[41] Richie Jose, Gun A. Lee, and Mark Billinghurst. 2016. A Comparative Study of Simulated Augmented Reality Displays for VehicleNavigation. In Proceedings of the 28th Australian Conference on Computer-Human Interaction (Launceston, Tasmania, Australia) (OzCHI’16). Association for Computing Machinery, New York, NY, USA, 40–48. https://doi.org/10.1145/3010915.3010918
[42] Takaya Kawamata, Itaru Kitahara, Yoshinari Kameda, and Yuichi Ohta. 2013. Poster: Lifted road map view on windshield display. In2013 IEEE Symposium on 3D User Interfaces (3DUI). IEEE, IEEE, New York, NY, USA, 139–140.
[43] Juela Kazazi, Susann Winkler, and Mark Vollrath. 2015. Accident prevention through visual warnings: how to design warnings inhead-up display for older and younger drivers. In 2015 IEEE 18th International Conference on Intelligent Transportation Systems. IEEE,IEEE, New York, NY, USA, 1028–1034.
[44] Jinkyu Kim and John Canny. 2017. Interpretable Learning for Self-Driving Cars by Visualizing Causal Attention. In The IEEE InternationalConference on Computer Vision (ICCV). IEEE, New York, NY, USA, 2961–2969. https://doi.org/10.1109/ICCV.2017.320
[45] Naeun Kim, Kwangmin Jeong, Minyoung Yang, Yejeon Oh, and Jinwoo Kim. 2017. "Are You Ready to Take-over?": An ExploratoryStudy on Visual Assistance to Enhance Driver Vigilance. In Proceedings of the 2017 CHI Conference Extended Abstracts on Human Factorsin Computing Systems (Denver, Colorado, USA) (CHI EA ’17). Association for Computing Machinery, New York, NY, USA, 1771–1778.https://doi.org/10.1145/3027063.3053155
[46] SeungJun Kim and Anind K. Dey. 2009. Simulated Augmented Reality Windshield Display as a Cognitive Mapping Aid for Elder DriverNavigation. In Proceedings of the SIGCHI Conference on Human Factors in Computing Systems (Boston, MA, USA) (CHI ’09). Associationfor Computing Machinery, New York, NY, USA, 133–142. https://doi.org/10.1145/1518701.1518724
[47] Kazuhiro Kojima, Akihiko Sato, Fumihiro Taya, Yoshinari Kameda, and Yuichi Ohta. 2005. NaviView: visual assistance by virtual mirrorsat blind intersection. In Proceedings. 2005 IEEE Intelligent Transportation Systems, 2005. IEEE, IEEE, New York, NY, USA, 592–597.
[48] Jeamin Koo, Jungsuk Kwac, Wendy Ju, Martin Steinert, Larry Leifer, and Clifford Nass. 2015. Why did my car just do that? Explainingsemi-autonomous driving actions to improve driver understanding, trust, and performance. International Journal on Interactive Designand Manufacturing (IJIDeM) 9, 4 (2015), 269–275.
[49] Moritz Körber. 2019. Theoretical Considerations and Development of a Questionnaire to Measure Trust in Automation. In Proceedingsof the 20th Congress of the International Ergonomics Association (IEA 2018), Sebastiano Bagnara, Riccardo Tartaglia, Sara Albolino,Thomas Alexander, and Yushi Fujita (Eds.). Springer International Publishing, Cham, 13–30.
[50] Oswald Kothgassner, A Felnhofer, N Hauk, E Kastenhofer, J Gomm, and I Krysprin-Exner. 2013. Technology Usage Inventory. https://www.ffg.at/sites/default/files/allgemeine_downloads/thematische%20programme/programmdokumente/tui_manual.pdf. Manual.Wien: ICARUS 17, 04 (2013), 90. [Online; accessed: 05-JULY-2020].
[51] Johannes Kraus, David Scholz, Dina Stiegemeier, and Martin Baumann. 0. The More You Know: Trust Dynamics and Calibration inHighly Automated Driving and the Effects of Take-Overs, System Malfunction, and System Transparency. Human Factors 0, 0 (0),0018720819853686. https://doi.org/10.1177/0018720819853686 arXiv:https://doi.org/10.1177/0018720819853686 PMID: 31233695.
[52] Alexander Kunze, Stephen J. Summerskill, Russell Marshall, and Ashleigh J. Filtness. 2018. Augmented Reality Displays for Communi-cating Uncertainty Information in Automated Driving. In Proceedings of the 10th International Conference on Automotive User Interfacesand Interactive Vehicular Applications (Toronto, ON, Canada) (AutomotiveUI ’18). Association for Computing Machinery, New York, NY,USA, 164–175. https://doi.org/10.1145/3239060.3239074
Proc. ACM Interact. Mob. Wearable Ubiquitous Technol., Vol. 5, No. 3, Article 94. Publication date: September 2021.

How Should Automated Vehicles Communicate Critical Situations? A Comparative Analysis of Visualization Concepts • 94:21
[53] Alexander Kunze, Stephen J. Summerskill, Russell Marshall, and Ashleigh J. Filtness. 2019. Conveying Uncertainties Using PeripheralAwareness Displays in the Context of Automated Driving. In Proceedings of the 11th International Conference on Automotive UserInterfaces and Interactive Vehicular Applications (Utrecht, Netherlands) (AutomotiveUI ’19). Association for Computing Machinery, NewYork, NY, USA, 329–341. https://doi.org/10.1145/3342197.3344537
[54] Sui Kurihashi, Yutaka Matsuno, and Kenji Tanaka. 2014. Evaluation of a mutual assistance system from both the recipient and assistersides. In 2014 Proceedings of the SICE Annual Conference (SICE). IEEE, IEEE, New York, NY, USA, 1702–1707.
[55] Miltos Kyriakidis, Riender Happee, and Joost CF de Winter. 2015. Public opinion on automated driving: Results of an internationalquestionnaire among 5000 respondents. Transportation research part F: traffic psychology and behaviour 32 (2015), 127–140.
[56] Patrick Lindemann, Tae-Young Lee, and Gerhard Rigoll. 2018. Catch my drift: Elevating situation awareness for highly automateddriving with an explanatory windshield display user interface. Multimodal Technologies and Interaction 2, 4 (2018), 71.
[57] Patrick Lindemann, Niklas Müller, and Gerhard Rigolll. 2019. Exploring the Use of Augmented Reality Interfaces for Driver Assistancein Short-Notice Takeovers. In 2019 IEEE Intelligent Vehicles Symposium (IV). IEEE, IEEE, New York, NY, USA, 804–809.
[58] Andreas Löcken, Anna-Katharina Frison, Vanessa Fahn, Dominik Kreppold, Maximilian Götz, and Andreas Riener. 2020. IncreasingUser Experience and Trust in Automated Vehicles via an Ambient Light Display. In 22nd International Conference on Human-ComputerInteraction with Mobile Devices and Services (Oldenburg, Germany) (MobileHCI ’20). Association for Computing Machinery, New York,NY, USA, Article 38, 10 pages. https://doi.org/10.1145/3379503.3403567
[59] Andreas Löcken, Wilko Heuten, and Susanne Boll. 2015. Supporting Lane Change Decisions with Ambient Light. In Proceedings ofthe 7th International Conference on Automotive User Interfaces and Interactive Vehicular Applications (Nottingham, United Kingdom)(AutomotiveUI ’15). Association for Computing Machinery, New York, NY, USA, 204–211. https://doi.org/10.1145/2799250.2799259
[60] Andreas Löcken, Wilko Heuten, and Susanne Boll. 2016. AutoAmbiCar: Using Ambient Light to Inform Drivers About Intentions ofTheir Automated Cars. In Adjunct Proceedings of the 8th International Conference on Automotive User Interfaces and Interactive VehicularApplications (Ann Arbor, MI, USA) (AutomotiveUI ’16 Adjunct). Association for Computing Machinery, New York, NY, USA, 57–62.https://doi.org/10.1145/3004323.3004329
[61] Andreas Löcken, Heiko Müller, Wilko Heuten, and Susanne Boll. 2015. An experiment on ambient light patterns to support lanechange decisions. In 2015 IEEE Intelligent Vehicles Symposium (IV). IEEE, IEEE, New York, NY, USA, 505–510.
[62] Tania Lombrozo. 2007. Simplicity and probability in causal explanation. Cognitive psychology 55, 3 (2007), 232–257.[63] Lutz Lorenz, Philipp Kerschbaum, and Josef Schumann. 2014. Designing take over scenarios for automated driving: How does augmented
reality support the driver to get back into the loop?, In Proceedings of the Human Factors and Ergonomics Society Annual Meeting.Proceedings of the Human Factors and Ergonomics Society Annual Meeting 58, 1, 1681–1685. https://doi.org/10.1177/1541931214581351arXiv:https://doi.org/10.1177/1541931214581351
[64] Franz Mader. 2004. Entwurf und Integration eines kamerabasierten Trackingsystems fr ein Flugzeugcockpit zur Darstellung fortschrittlicherFlugfhrungsinformationen in einem Head-Mounted Display. Ph.D. Dissertation. Diplomarbeit, Fakultät für Informatik, TechnischeUniversität München.
[65] Andrii Matviienko, Andreas Löcken, Abdallah El Ali, Wilko Heuten, and Susanne Boll. 2016. NaviLight: Investigating Ambient LightDisplays for Turn-by-Turn Navigation in Cars. In Proceedings of the 18th International Conference on Human-Computer Interaction withMobile Devices and Services (Florence, Italy) (MobileHCI ’16). Association for Computing Machinery, New York, NY, USA, 283–294.https://doi.org/10.1145/2935334.2935359
[66] Zeljko Medenica, Andrew L. Kun, Tim Paek, and Oskar Palinko. 2011. Augmented Reality vs. Street Views: A Driving Simulator StudyComparing Two Emerging Navigation Aids. In Proceedings of the 13th International Conference on Human Computer Interaction withMobile Devices and Services (Stockholm, Sweden) (MobileHCI ’11). Association for Computing Machinery, New York, NY, USA, 265–274.https://doi.org/10.1145/2037373.2037414
[67] Toru Miyamoto, Itaru Kitahara, Yoshinari Kameda, and Yuichi Ohta. 2006. Floating Virtual Mirrors: Visualization of the Scene Behind aVehicle. In Advances in Artificial Reality and Tele-Existence, Zhigeng Pan, Adrian Cheok, Michael Haller, Rynson W. H. Lau, Hideo Saito,and Ronghua Liang (Eds.). Springer Berlin Heidelberg, Berlin, Heidelberg, 302–313.
[68] Bonnie M Muir and Neville Moray. 1996. Trust in automation. Part II. Experimental studies of trust and human intervention in aprocess control simulation. Ergonomics 39, 3 (1996), 429–460.
[69] Wolfgang Narzt, Gustav Pomberger, Alois Ferscha, Dieter Kolb, M Reiner, Jan Wieghardt, H Horst, Christopher Lindinger, et al. 2003.Pervasive information acquisition for mobile AR-navigation systems. In null. IEEE, IEEE, New York, NY, USA, 13.
[70] Victor Ng-Thow-Hing, Karlin Bark, Lee Beckwith, Cuong Tran, Rishabh Bhandari, and Srinath Sridhar. 2013. User-centered perspectivesfor automotive augmented reality. In IEEE International Symposium on Mixed and Augmented Reality. IEEE, New York, NY, USA, 13–22.
[71] NTSB. 2017. NTSB/HAR-17/02 PB2017-102600. Technical Report. National Transportation Safety Board.[72] Raja Parasuraman and Victor Riley. 1997. Humans and automation: Use, misuse, disuse, abuse. Human factors 39, 2 (1997), 230–253.[73] Byoung-Jun Park, Jeong-Woo Lee, Changrak Yoon, and Kyong-Ho Kim. 2015. Augmented reality and representation in vehicle for safe
driving at night. In 2015 International Conference on Information and Communication Technology Convergence (ICTC). IEEE, IEEE, NewYork, NY, USA, 1261–1263.
Proc. ACM Interact. Mob. Wearable Ubiquitous Technol., Vol. 5, No. 3, Article 94. Publication date: September 2021.
94:22 • Colley et al.
[74] Hye Sun Park, Min Woo Park, Kwang Hee Won, Kyong-Ho Kim, and Soon Ki Jung. 2013. In-Vehicle AR-HUD Systemto Provide Driving-Safety Information. ETRI Journal 35, 6 (2013), 1038–1047. https://doi.org/10.4218/etrij.13.2013.0041arXiv:https://onlinelibrary.wiley.com/doi/pdf/10.4218/etrij.13.2013.0041
[75] Min Woo Park and Soon Ki Jung. 2014. A projector-based full windshield HUD simulator to evaluate the visualization methods. In 2014Sixth International Conference on Ubiquitous and Future Networks (ICUFN). IEEE, IEEE, New York, NY, USA, 509–510.
[76] Indrajeet Patil. 2021. Visualizations with statistical details: The ’ggstatsplot’ approach. Journal of Open Source Software 6, 61 (2021),3167. https://doi.org/10.21105/joss.03167
[77] Simone Pettigrew, Zenobia Talati, and Richard Norman. 2018. The health benefits of autonomous vehicles: Public awareness andreceptivity in Australia. Australian and New Zealand journal of public health 42, 5 (2018), 480–483.
[78] Lisa Pfannmueller, Martina Kramer, Bernhard Senner, and Klaus Bengler. 2015. A comparison of display concepts for a navigationsystem in an automotive contact analog head-up display. Procedia Manufacturing 3 (2015), 2722–2729.
[79] Bastian Pfleging, Maurice Rang, and Nora Broy. 2016. Investigating User Needs for Non-Driving-Related Activities during AutomatedDriving. In Proceedings of the 15th International Conference on Mobile and Ubiquitous Multimedia (Rovaniemi, Finland) (MUM ’16).Association for Computing Machinery, New York, NY, USA, 91–99. https://doi.org/10.1145/3012709.3012735
[80] Marina Plavšic, Markus Duschl, Marcus Tönnis, Heiner Bubb, and Gudrun Klinker. 2009. Ergonomic design and evaluation of augmentedreality based cautionary warnings for driving assistance in urban environments. , 10 pages.
[81] T. Poitschke, M. Ablassmeier, G. Rigoll, S. Bardins, S. Kohlbecher, and E. Schneider. 2008. Contact-Analog Information Representation inan Automotive Head-up Display. In Proceedings of the 2008 Symposium on Eye Tracking Research and Applications (Savannah, Georgia)(ETRA ’08). Association for Computing Machinery, New York, NY, USA, 119–122. https://doi.org/10.1145/1344471.1344502
[82] Akihiko Sato, Itaru Kitahara, Yoshinari Kameda, and Yuichi Ohta. 2006. Visual navigation system on windshield head-up display. InProc. 13th World Congress on Intelligent Transport Systems, CD-ROM. Intelligent Transport Systems (ITS), Intelligent Transport Systems(ITS), London, UK, 8 pages.
[83] Jens Sauerbrey. 2004. MAN Abbiegeassistent: Ein System zur Unfallvermeidung beim Rechtsabbiegen von Lkw.[84] Jeff Sauro. 2011. Measuring usability with the system usability scale (SUS).[85] Michael Simon, Elke Hausner, Susan F Klaus, and Nancy E Dunton. 2010. Identifying nurse staffing research in Medline: development
and testing of empirically derived search strategies with the PubMed interface. BMC medical research methodology 10, 1 (2010), 76.[86] Missie Smith, Joseph L. Gabbard, and Christian Conley. 2016. Head-Up vs. Head-Down Displays: Examining Traditional Methods of
Display Assessment While Driving. In Proceedings of the 8th International Conference on Automotive User Interfaces and InteractiveVehicular Applications (Ann Arbor, MI, USA) (Automotive’UI 16). Association for Computing Machinery, New York, NY, USA, 185–192.https://doi.org/10.1145/3003715.3005419
[87] Alessandro Soro, Andry Rakotonirainy, Ronald Schroeter, and Sabine Wollstädter. 2014. Using Augmented Video to Test In-Car UserExperiences of Context Analog HUDs. In Adjunct Proceedings of the 6th International Conference on Automotive User Interfaces andInteractive Vehicular Applications (Seattle, WA, USA) (AutomotiveUI ’14). Association for Computing Machinery, New York, NY, USA,1–6. https://doi.org/10.1145/2667239.2667302
[88] Laerd statistics. 2016. Mixed ANOVA using SPSS Statistics. https://statistics.laerd.com/spss-tutorials/mixed-anova-using-spss-statistics.php. [Online; Accessed: 12-SEPTEMBER-2019].
[89] Krittiya Tangmanee and Sakol Teeravarunyou. 2012. Effects of guided arrows on head-up display towards the vehicle windshield. In2012 Southeast Asian Network of Ergonomics Societies Conference (SEANES). IEEE, IEEE, New York, NY, USA, 1–6.
[90] Fumihiro Taya, Yoshinari Kameda, and Yuichi Ohta. 2005. Naviview: Virtual slope visualization of blind area at an intersection. ,8 pages.
[91] Paul Thagard. 1989. Explanatory coherence. Behavioral and brain sciences 12, 3 (1989), 435–502.[92] Marcus Tonnis and Gudrun Klinker. 2006. Effective control of a car driver’s attention for visual and acoustic guidance towards the
direction of imminent dangers. In 2006 IEEE/ACM International Symposium on Mixed and Augmented Reality. IEEE, IEEE, New York, NY,USA, 13–22.
[93] Unity Technologies. 2019. Unity. Unity Technologies. https://unity.com/[94] Unity Technologies. 2019. Windridge City. Unity Technologies. https://assetstore.unity.com/packages/3d/environments/roadways/
windridge-city-132222[95] Jinke D Van Der Laan, Adriaan Heino, and Dick De Waard. 1997. A simple procedure for the assessment of acceptance of advanced
transport telematics. Transportation Research Part C: Emerging Technologies 5, 1 (1997), 1–10.[96] Tamara von Sawitzky, Philipp Wintersberger, Andreas Riener, and Joseph L. Gabbard. 2019. Increasing Trust in Fully Automated
Driving: Route Indication on an Augmented Reality Head-up Display. In Proceedings of the 8th ACM International Symposium onPervasive Displays (Palermo, Italy) (PerDis ’19). Association for Computing Machinery, New York, NY, USA, Article 6, 7 pages.https://doi.org/10.1145/3321335.3324947
[97] Marcel Walch, Mark Colley, and Michael Weber. 2019. CooperationCaptcha: On-The-Fly Object Labeling for Highly AutomatedVehicles. In Extended Abstracts of the 2019 CHI Conference on Human Factors in Computing Systems (Glasgow, Scotland Uk) (CHI EA ’19).
Proc. ACM Interact. Mob. Wearable Ubiquitous Technol., Vol. 5, No. 3, Article 94. Publication date: September 2021.

How Should Automated Vehicles Communicate Critical Situations? A Comparative Analysis of Visualization Concepts • 94:23
Association for Computing Machinery, New York, NY, USA, 1–6. https://doi.org/10.1145/3290607.3313022[98] Marcel Walch, Marcel Woide, Kristin Mühl, Martin Baumann, and Michael Weber. 2019. Cooperative Overtaking: Overcoming
Automated Vehicles’ Obstructed Sensor Range via Driver Help. In Proceedings of the 11th International Conference on Automotive UserInterfaces and Interactive Vehicular Applications (Utrecht, Netherlands) (AutomotiveUI ’19). Association for Computing Machinery, NewYork, NY, USA, 144–155. https://doi.org/10.1145/3342197.3344531
[99] Rebecca M Warner and David B Sugarman. 1986. Attributions of personality based on physical appearance, speech, and handwriting.Journal of personality and social psychology 50, 4 (1986), 792.
[100] Florian Weidner and Wolfgang Broll. 2019. Smart S3D TOR: Intelligent Warnings on Large Stereoscopic 3D Dashboards duringTake-Overs. In Proceedings of the 8th ACM International Symposium on Pervasive Displays (Palermo, Italy) (PerDis ’19). Association forComputing Machinery, New York, NY, USA, Article 5, 7 pages. https://doi.org/10.1145/3321335.3324937
[101] Annette Werner. 2019. New colours for autonomous driving: An evaluation of chromaticities for the external lighting equipment ofautonomous vehicles.
[102] Gesa Wiegand, Malin Eiband, Maximilian Haubelt, and Heinrich Hussmann. 2020. “I’d like an Explanation for That!”ExploringReactions to Unexpected Autonomous Driving. In 22nd International Conference on Human-Computer Interaction with Mobile Devicesand Services (Oldenburg, Germany) (MobileHCI ’20). Association for Computing Machinery, New York, NY, USA, Article 36, 11 pages.https://doi.org/10.1145/3379503.3403554
[103] Gesa Wiegand, Christian Mai, Kai Holländer, and Heinrich Hussmann. 2019. InCarAR: A Design Space Towards 3D AugmentedReality Applications in Vehicles. In Proceedings of the 11th International Conference on Automotive User Interfaces and InteractiveVehicular Applications (Utrecht, Netherlands) (AutomotiveUI ’19). Association for Computing Machinery, New York, NY, USA, 1–13.https://doi.org/10.1145/3342197.3344539
[104] Christian A Wiesner, Mike Ruf, Demet Sirim, and Gudrun Klinker. 2017. 3D-FRC: Depiction of the future road course in the Head-Up-Display. In 2017 IEEE International Symposium on Mixed and Augmented Reality (ISMAR). IEEE, IEEE, New York, NY, USA, 136–143.
[105] Marc Wilbrink, Anna Schieben, and Michael Oehl. 2020. Reflecting the Automated Vehicle’s Perception and Intention: Light-BasedInteraction Approaches for on-Board HMI in Highly Automated Vehicles. In Proceedings of the 25th International Conference onIntelligent User Interfaces Companion (Cagliari, Italy) (IUI ’20). Association for Computing Machinery, New York, NY, USA, 105–107.https://doi.org/10.1145/3379336.3381502
[106] Susann Winkler, Juela Kazazi, and Mark Vollrath. 2015. Distractive or Supportive–How Warnings in the Head-up Display AffectDrivers’ Gaze and Driving Behavior. In 2015 IEEE 18th International Conference on Intelligent Transportation Systems. IEEE, IEEE, NewYork, NY, USA, 1035–1040. https://doi.org/10.1109/ITSC.2015.172
[107] Philipp Wintersberger, Dmitrijs Dmitrenko, Clemens Schartmüller, Anna-Katharina Frison, Emanuela Maggioni, Marianna Obrist, andAndreas Riener. 2019. S(C)ENTINEL: Monitoring Automated Vehicles with Olfactory Reliability Displays. In Proceedings of the 24thInternational Conference on Intelligent User Interfaces (Marina del Ray, California) (IUI ’19). Association for Computing Machinery, NewYork, NY, USA, 538–546. https://doi.org/10.1145/3301275.3302332
[108] Philipp Wintersberger, Anna-Katharina Frison, Andreas Riener, and Tamara von Sawitzky. 2019. Fostering User Acceptance and Trustin Fully Automated Vehicles: Evaluating the Potential of Augmented Reality. PRESENCE: Virtual and Augmented Reality 27, 1 (2019),46–62. https://doi.org/10.1162/pres_a_00320 arXiv:https://doi.org/10.1162/pres_a_00320
[109] Philipp Wintersberger, Hannah Nicklas, Thomas Martlbauer, Stephan Hammer, and Andreas Riener. 2020. Explainable Automation:Personalized and Adaptive UIs to Foster Trust and Understanding of Driving Automation Systems. In 12th International Conferenceon Automotive User Interfaces and Interactive Vehicular Applications (Virtual Event, DC, USA) (AutomotiveUI ’20). Association forComputing Machinery, New York, NY, USA, 252–261. https://doi.org/10.1145/3409120.3410659
[110] Philipp Wintersberger, Tamara von Sawitzky, Anna-Katharina Frison, and Andreas Riener. 2017. Traffic Augmentation as a Means toIncrease Trust in Automated Driving Systems. In Proceedings of the 12th Biannual Conference on Italian SIGCHI Chapter (Cagliari, Italy)(CHItaly ’17). Association for Computing Machinery, New York, NY, USA, Article 17, 7 pages. https://doi.org/10.1145/3125571.3125600
[111] Bo Yang, Tatsuya Obana, Zheng Wang, Tsutomu Kaizuka, Toshiyuki Sugimachi, Toshiaki Sakurai, Tetsuo Maki, and Kimihiko Nakano.2020. Evaluations of Different Human Machine Interfaces for Presenting Right-Turn Timing at Intersections. , 12 pages.
[112] Changrak Yoon, Kyongho Kim, Hye Sun Park, Min Woo Park, and Soon Ki Jung. 2014. Development of augmented forward collisionwarning system for Head-Up Display. In 17th International IEEE Conference on Intelligent Transportation Systems (ITSC). IEEE, IEEE,New York, NY, USA, 2277–2279.
[113] Changrak Yoon and Kyong-Ho Kim. 2015. Augmented reality information registration for head-up display. In 2015 InternationalConference on Information and Communication Technology Convergence (ICTC). IEEE, IEEE, New York, NY, USA, 1135–1137.
Proc. ACM Interact. Mob. Wearable Ubiquitous Technol., Vol. 5, No. 3, Article 94. Publication date: September 2021.