how should an electric vehicle sound? user and...
TRANSCRIPT
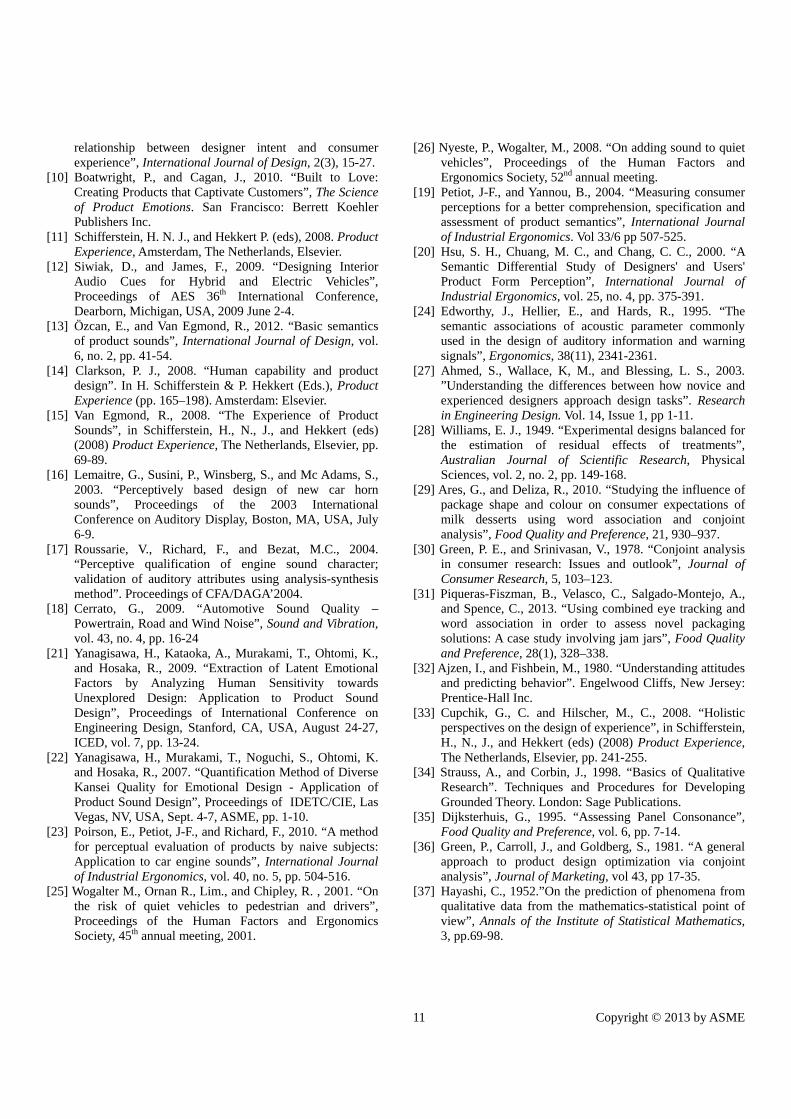
General rights Copyright and moral rights for the publications made accessible in the public portal are retained by the authors and/or other copyright owners and it is a condition of accessing publications that users recognise and abide by the legal requirements associated with these rights.
• Users may download and print one copy of any publication from the public portal for the purpose of private study or research. • You may not further distribute the material or use it for any profit-making activity or commercial gain • You may freely distribute the URL identifying the publication in the public portal
If you believe that this document breaches copyright please contact us providing details, and we will remove access to the work immediately and investigate your claim.
Downloaded from orbit.dtu.dk on: Aug 18, 2018
How should an electric vehicle sound? User and expert perception
Petiot, Jean-François ; Kristensen, Bjørn G.; Maier, Anja
Published in:Proceedings of the ASME 2013 International Design Engineering Technical Conferences & Computers andInformation in Engineering Conference IDETC/CIE 2013
Publication date:2013
Link back to DTU Orbit
Citation (APA):Petiot, J-F., Kristensen, B. G., & Maier, A. (2013). How should an electric vehicle sound? User and expertperception. In Proceedings of the ASME 2013 International Design Engineering Technical Conferences &Computers and Information in Engineering Conference IDETC/CIE 2013 American Society of MechanicalEngineers.
* Corresponding author 1 Copyright © 2013 by ASME
Proceedings of the ASME 2013 International Design Engineering Technical Conferences & Computers and Information in Engineering Conference
IDETC/CIE 2013 August 4-7, 2013, Portland, Oregon, USA
DETC2013-12535
HOW SHOULD AN ELECTRIC VEHICLE SOUND? USER AND EXPERT PERCEPTION
Jean-François Petiot* Ecole Centrale de Nantes
Nantes, France Jean-Francois.Petiot @irccyn.ec-nantes.fr
Bjørn G. Kristensen Technical University of Denmark
Lyngby, Denmark [email protected]
Anja M. Maier Technical University of Denmark
Lyngby, Denmark [email protected]
ABSTRACT As electric vehicles are moving in on the automobile
market, safety relating to acoustic perception is an important issue. It is a growing concern, particularly with respect to pedestrians, cyclists or visually impaired people. This can be addressed by adding sounds to the vehicle whilst at low speed. However, adding artificial sounds to an electric vehicle begs the question as to what kind of sound is appropriate. Appropriateness concerns technical specifications and is also linked to affective reactions of recipients of such a sound. Emotional reactions to 17 artificial exterior sounds for electric vehicles were investigated in an experimental setting with a total of 40 participants, 34 novice users and six sound experts.
Word association was used to elicit emotional reactions to the different sounds. Novice users employ more character-related terms to describe the sounds, while experts use more composition-based words. Analysis of variance and conjoint analysis was used to analyze participants’ assessments of sounds according to two semantic scales (pleasantness and appropriateness). Considerable inter-individual differences in the ratings of pleasantness and appropriateness indicate a great diversity of opinion about the sounds. Novice users indicate their preference for the sound of the traditional combustion engine as a possible proposition. Whilst participants saw the necessity, there was generally little enthusiasm for adding sounds to electric vehicles. The contribution of the paper concerns the methodology to analyze the results of the experiment and implications for the design of sounds for electric vehicles.
1. INTRODUCTION Electric vehicles (EVs) and hybrid vehicles are becoming a
serious alternative to internal combustion engine cars [1]. However, due to reduced audibility, hybrid electric vehicles
have a documented twice as high incident rate than cars with an internal combustion engine [2], and as Don Norman writes: “[q]uiet is good; silence may not be” [3]. At low speed (under 50km/h) in particular, the wind and tyre/road interaction noises are not sufficient to signify the presence of an EV to road users, such as pedestrians, cyclists, or visually impaired people [4]. Regulation concerning the sounds of electric cars is still under study. Yet, several countries such as Japan and the United States of America already decided that adding artificial sounds to EVs is compulsory [5]. Whilst research has been conducted to recommend design guidance for warning sounds and external sound generation systems [6], design guidance for adding artificial exterior sounds to electric cars is still nascent.
The sonification of EVs is a complex design problem, with many constraints and stakeholders involved. Stakeholders include cyclists and pedestrians some of whom might have difficulties hearing warning sounds at low speeds, drivers who expect audio-feedback on the performance of the car, and other third parties who prefer not to be disturbed by additional sounds.
Having said this, safety is not the only goal for the design of sounds. Sounds provide opportunities for car manufacturers to brand their product through a sound signature and find loyal markets [7]. In that way, a sound may be conceptualized as a means of communication between the designer and end-users [8-9]. In the car interior, for example, the driver can infer the relative performance of the powertrain and have a better awareness of the speed of the car. Exterior sounds communicate the presence, proximity and speed of the car to other people in traffic.
Against this background, what kind of artificial exterior sound is appropriate? A sound that addresses safety concerns, informs about speed, is pleasant or at least not disturbing, and evokes the intended reaction from the users? In order to achieve

2 Copyright © 2013 by ASME
this, we need to firstly understand what affective reactions sounds evoke in novice users and how this might differ from how sound experts perceive sounds. This paper addresses this issue directly by reporting an experimental study eliciting how users and experts perceive synthesized external sounds, what they expect the sound to be like and what their concerns might be. Therefore, the main research questions of this paper read as follows: Research Question 1 (RQ1):
Should there be added sound for EVs?
Research Question 2 (RQ2): What should an EV sound like?
Research Question 3 (RQ3): How do users and sound experts perceive EV sounds? The experiment included an open word association task as
well as a rating task on a bipolar semantic scale to assess a set of different sounds with respect to appropriateness and pleasantness. The sounds used in this study are synthesized sounds designed for exterior loudspeakers simulating car sounds as they may be perceived, e.g. by pedestrians. The overall objective of this study is to support the sound designer in identifying a clear goal for the design of an appropriate and pleasant exterior sound for hybrid and electric vehicles such as an electric car.
The remainder of the paper is organized as follows. The next section discusses extant studies in literature by integrating literature from product experience, design communication, and psychoacoustics. Next, the experiment is described. It starts with a presentation of the set of sounds used, the tasks given to the participants, and the method used for the analysis of the results. Then, results from both the qualitative and quantitative analyses are presented. The concluding section provides implications for design research and design practice.
2. PRODUCT SOUND EXPERIENCE We purchase products both for what the product does for
us, for the ‘product functions’, and also for how the product makes us feel, for what one might call ‘product emotions’ [10]. We experience products through our senses, e.g. through seeing, touching, tasting, smelling, and hearing. Each interaction with the product is a touch point influencing our reasoning, emotional state, purchasing decision, preference, and expectations with respect to the product [11]. In that way, a product makes sense for us, we attribute meaning to the product. We might find a sports car powerful, fast, and feel excited when looking at it or driving it. We might associate comfort and the feeling of being at home with a family car.
When driving a car, our product experience is influenced by a number of stimuli such as visual appearance or tactile sensation. In addition, sound is an important part of the driving experience [12]. This includes internal sounds in a vehicle to provide auditory feedback, for example, on whether the engine is running ensuring and increasing the driver confidence that everything is working normally. It also includes external sounds when locking the car or alarm sounds when someone is trying
to break into the car. Specific sounds have to be integrated into the whole soundscape. In the driving context, listening to the radio adds sound to the already present noises from the road and tires. Other passengers, conversations, mobile phone conversations can each add distraction. There may easily be an overabundance of sounds, quickly leading to a too high cognitive load for the user of a car and to ‘audio fatigue’.
Product Sound Design (PSD) is an emerging and important topic within product development [13]. Sound has an immediate, direct link to both the rational and emotional parts of our brain and can trigger vivid recollections of past experiences, helping us remember intricate details associated with events [12]. The sense of hearing also allows for speech perception and understanding, which in turn forms the basis of our ability to communicate with others [14].
In our daily life, we are confronted with the sounds of industrial products. Physical products have both consequential sounds that are the result of moving parts, airflow etc. and intentional sounds that are added or altered to enhance the experience of the product [15]. Consequential sounds refer to the sounds that are electrically or manually produced as a consequence of a function, e.g. a hairdryer producing engine sounds when turned on. Intentional sounds are sounds that are deliberately designed and added to a product by designers, many of which are digitally synthesized sounds [13]. For example, cars producing a warning beep when the seat belt is not fastened whilst the car is in driving mode. In this study, we are concerned with intentionally created sounds for EVs.
Car companies are developing sounds for electric cars. Experts at Jaguar Range Rover, for example, have conducted an initial study to develop appropriate warning sounds for a luxury vehicle using an exterior sound simulator [1]. Engineers at Nissan have developed an Approaching Vehicle Sound for Pedestrians (VSP), providing auditory cues when driving at low speed forward or when reversing. Sound with modulation or rhythmic structure stands out in ambient noise more than sound without modulation [5]. The car industry developed objective metrics used for the design of different sub-systems in a vehicle such as air conditioning, the engine, and horns [16-17]. These psychoacoustic metrics for the acoustics of cars are also relevant for electric vehicles, in particular for the road and wind noise contribution [18].
In addition to technical specifications such as a mapping between the sound and the state it is meant to represent, to design appropriate and pleasant sounds, designers need to understand how users experience product sounds. Despite proposals from car-makers concerning the sonification of EVs, few studies are concerned with the perception of these sounds by users [4]. Most of the times, people use those auditory ‘cues’ unconsciously [15]. How do we then elicit users’ perceptions?
Whilst designers and design researchers have studied underlying processes of product semantics such as on product form perception [11] [19] [20], product sound perception is still nascent. Previous studies on the perceived qualities of different sounds have, for instance, been measured by the use of Kansei words [21-22]. These were word pairs such as hard-soft, dull-

3 Copyright © 2013 by ASME
clear, silent-noisy. A similar approach was made based on a pre-selected number of sound-characterizing words [23]. Semantic associations of synthesized sounds such as warning signals have been elicited [24], focusing on acoustic parameters. Recent work examined the basic semantics of consequential product sounds to explain meaningful associations of the auditory property of products [13].
With respect to users’ preferences towards external vehicle sounds, in their study with a panel of 380 people, Wogalter et al. [25] identify the ‘traditional engine’ as the predominant response to what type of sound is most appropriate. Similarly, Nyeste et al. [26] conducted a preference study on a set of potential sounds for EVs with the semantic differential method and showed that the ‘traditional sound’ of a combustion engine is the most acceptable.
There have been studies on novices and expert designers on how they approach design tasks [27], yet, an assessment of the emotional reaction to or psychoacoustic experience with intentional product sound for the exterior of electric vehicles is still under-explored. We argue here that the distinction between novices and expert users is important in that it allows us to elicit design criteria both for pleasant and also for technically appropriate sounds for electric vehicles.
3. MATERIALS AND METHODS For the purpose of exploring the perception of sounds for
EVs, we carried out an experiment with a set of 17 sounds and in total 40 participants between 21 and 67 years of age (average age of ca. 35), all of whom reported normal hearing. Two groups of subjects were considered: a group of novice users (denoted ‘novices’ as they have no
particular expertise in acoustics and sound design). They constitute the User group (number of subjects Nu=34), and
a group of experts in sound design (professional sound designers and acoustics experts). They constitute the Expert group (number of subjects Ne=6). As we are aware of the imbalance of the amount of
participants in each group, the use of statistics to generalize the conclusions would be doubtful. Nevertheless, we consider the descriptive analysis of the results as interesting in that it uncovers differences between the groups.
3.1 Description of the sound design In total, 17 different experimental sounds were created for
this study by the first author. The sounds were synthesized using the mathematical modeling software Matlab and the additive synthesis technique. In order to generate different but plausible sounds for an electric car, after an analysis of current sounds of different carmakers [4] and personal propositions, four main components of the sound were considered. The components are also named design factors in this paper. Component C1 ‘A thermic Motor Sound’.
This component synthesizes the first harmonics of a
classical 4-stroke internal combustion engine (H0.5, H1, H1.5, H2, H4, H6).
Component C2 ‘A Harmonic Sound’. This component synthesizes different musical ‘notes’ that constitute a chord (chord with 2, 3, or 4 notes),
Component C3 ‘A Noise Sound’. This component synthesizes a filtered noise,
Component C4: ‘Amplitude Modulation’. This last component is an amplitude modulation of the first three components that may create more complexity and small ‘temporal events’ in the sound. The final sound is the sum of these four components. 17
different sounds were designed. Their composition according to the different components (C1 motor: yes/no – C2 musical chord: no/consonant/dissonant – C3 noise sound: broad/narrow – C4 modulation: yes/no) is given in Annex A.
Since it is out of the scope of this paper to describe all the parameters of the synthesizer (there are more than 70 independent parameters to define a sound), we can mention that all the frequencies and amplitudes of the components are adjustable, to create credible and very different sounds. This sound is not constant but ‘played’ by a control parameter of the car: the speed. To make the sound evolve with the speed of the car, we choose to adjust the frequencies and the amplitudes of the different components according to the speed.
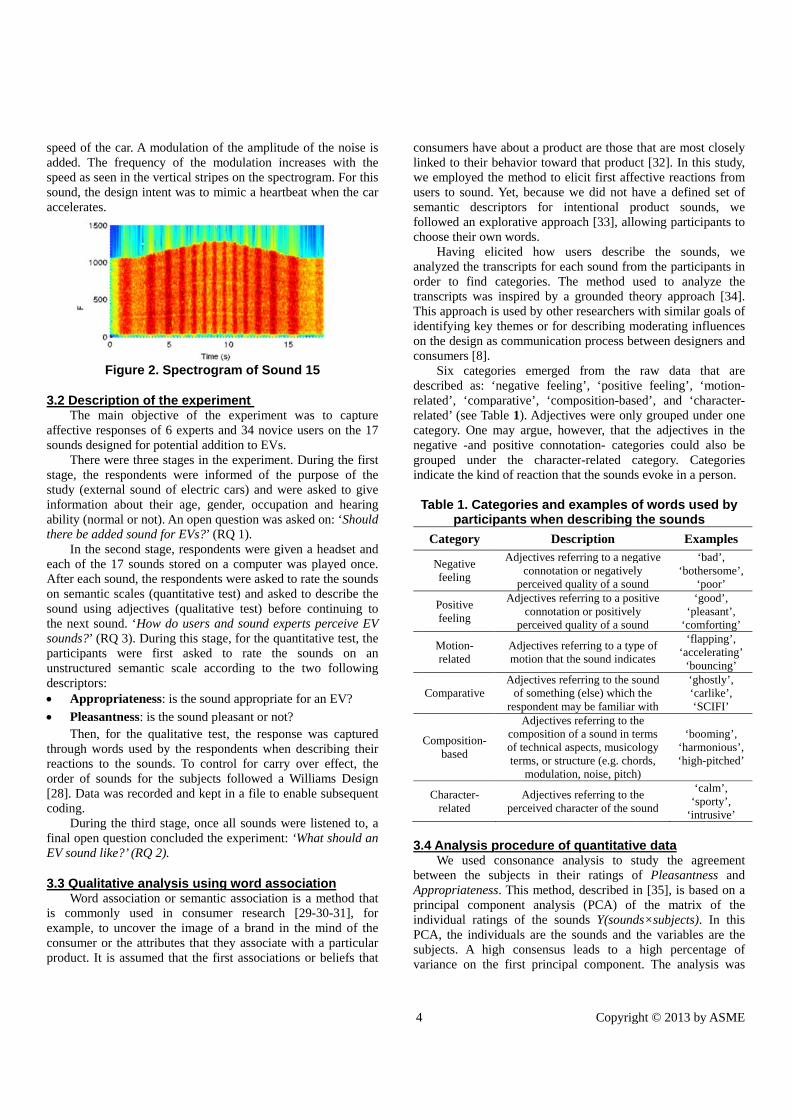
To simulate the movement of the car for the tests, we defined a pattern of speed similar for all the sounds (duration T=18s). This included four phases of driving: idling, acceleration, constant speed (typically: 50km/h), deceleration and idling (Figure 1).
Figure 1: Speed pattern of cars for sound evaluation
Mapping the speed of the car with the parameters of the
sound (frequencies and amplitudes of the components) makes the sounds evolve and ‘simulates’ the movement of the car. Analogous to an internal combustion engine, for this mapping, the rule used is that the frequencies of the components increase, when the speed increases. This pattern creates realistic conditions to facilitate the perception of speed, acceleration or deceleration.
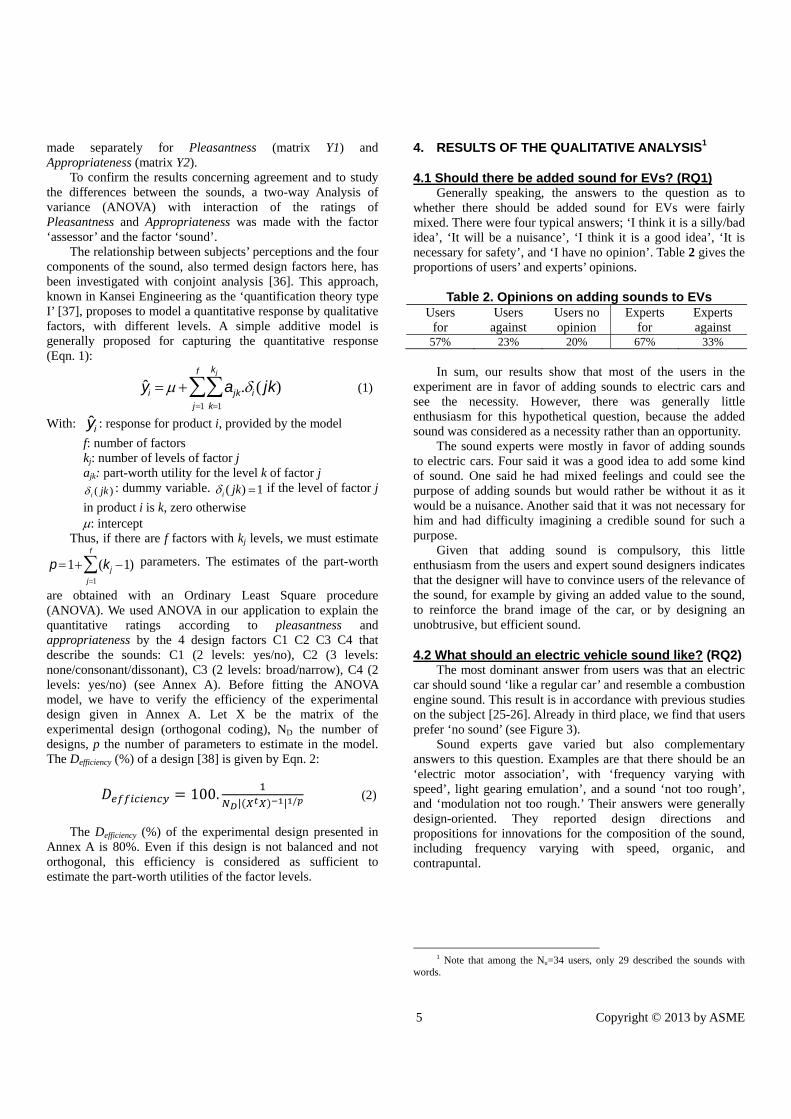
An example of the spectrogram of the sound S15 is given in Figure 2. The sound is made of a broadband noise (50-1000Hz), the frequency range of which increases with the
0 2 4 6 8 10 12 14 16 180
10
20
30
40
50
60
Time (sec)
V(k
m/h
)
Evolution of the speed
speedaddespeedsounaccel
3.2 DT
affecsoun
Tstagestudyinforabilitthere
Ieach Afteron sesounthe nsounpartiunstrdescr A
PT
throureactorder[28].codin
Dfinal EV s
3.3 QW
is cexamconsuprodu
d of the car. Aed. The frequd as seen in th
nd, the design lerates.
Figure
Description The main ob
ctive responsends designed foThere were the, the respondy (external sormation aboutty (normal or ne be added souIn the second of the 17 sou
r each sound, emantic scales
nd using adjecnext sound. ‘Hds?’ (RQ 3). Dcipants wereructured semariptors: Appropriaten
Pleasantness:Then, for theugh words usetions to the sr of sounds f Data was recng. During the thopen question
ound like?’ (R
Qualitative aWord associatommonly us
mple, to uncovumer or the auct. It is assu
A modulation uency of the he vertical stripintent was to
e 2. Spectrog
of the expebjective of ths of 6 expertsor potential adhree stages in dents were inund of electrit their age, gnot). An open
und for EVs?’ stage, respon
unds stored onthe respondens (quantitativectives (qualitaHow do users During this stae first askedantic scale ac
ness: is the sou
: is the sound pe qualitative ted by the respounds. To co
for the subjeccorded and kep
ird stage, oncn concluded th
RQ 2).
analysis usition or semaned in consuver the imageattributes that umed that the
of the amplitumodulation inpes on the spemimic a heart
gram of Sou
riment he experimens and 34 novicddition to EVsthe experimen
nformed of thic cars) and wgender, occupn question was
(RQ 1). ndents were gin a computer
nts were askede test) and askative test) befand sound ex
age, for the qud to rate theccording to t
und appropria
pleasant or notest, the respopondents whe
ontrol for carrcts followed apt in a file to
ce all sounds whe experiment
ng word assntic associationumer researche of a brand ithey associatefirst associati
ude of the noincreases withectrogram. Fortbeat when th
und 15
nt was to capce users on th
s. nt. During thehe purpose ofwere asked to ation and heaasked on: ‘Sh
iven a headsetwas played o
d to rate the soked to describfore continuinxperts perceiveuantitative teste sounds onthe two follow
ate for an EV?
ot? onse was capten describing ry over effecta Williams Deenable subseq
were listened t: ‘What shoul
sociation n is a methodh [29-30-31],n the mind oe with a particons or beliefs
4
ise is h the r this e car
pture he 17
e first f the give
aring hould
t and once. ounds e the
ng to e EV t, the n an wing
tured their
t, the esign quent
to, a ld an
d that , for f the cular s that
colinweussefoch
anortraThideonco
derelrelcanegrind
T
C
3.
beApprindPCsuva
onsumers havenked to their be employed thsers to sound. mantic descrllowed an exp
hoose their owHaving eli
nalyzed the trarder to find anscripts was his approach ientifying key
n the design asonsumers [8].
Six categoescribed as: ‘lated’, ‘complated’ (see Tab
ategory. One megative -and prouped underdicate the kind
Table 1. Cateparticip
Category
Negative feeling
Positive feeling
Motion- related
Comparative
Composition-based
Character-related
4 Analysis pWe used c
etween the suppropriatenessrincipal compdividual ratinCA, the indiviubjects. A higariance on the
e about a prodbehavior towahe method to
Yet, because riptors for iplorative appro
wn words. icited how
anscripts for ecategories. Tinspired by a
s used by othethemes or for
s communicat
ories emergednegative feel
parative’, ‘comble 1). Adjectmay argue, hopositive connr the characd of reaction t
egories and pants when
DeAdjectives re
connotatiperceived
Adjectives reconnotat
perceived
Adjectives rmotion that
Adjectives reof somethin
respondent mAdjective
compositionof technical terms, or str
modulati
Adjectiveperceived ch
procedure oconsonance aubjects in ths. This metho
ponent analysngs of the soiduals are thegh consensuse first princip
Copyrig
duct are those ard that producelicit first affewe did not h
intentional poach [33], allo
users describeach sound froThe method ua grounded ther researchers r describing mion process be
d from the ling’, ‘positivmposition-bastives were onlowever, that t
notation- categcter-related cthat the sounds
examples odescribing
escription eferring to a negion or negativelquality of a soueferring to a posion or positivelyquality of a sou
referring to a typthe sound indic
eferring to the sng (else) which may be familiar es referring to thn of a sound in teaspects, musicoructure (e.g. choion, noise, pitch
es referring to thharacter of the so
of quantitativanalysis to sheir ratings od, described i
sis (PCA) ofounds Y(sounde sounds and leads to a
pal componen
ght © 2013 by
that are most ct [32]. In thisective reactionhave a definedproduct soundowing particip
be the soundom the participused to analyheory approacwith similar g
moderating infetween design
raw data thve feeling’, ‘msed’, and ‘chay grouped undthe adjectivesgories could acategory. Cats evoke in a pe
of words usethe sounds
Examgative ly und
‘b‘bothe
‘psitive y
und
‘go‘plea
‘comf
pe of cates
‘flap‘accel
‘bousound
the with
‘gho‘car‘SC
he erms
ology ords, h)
‘boo‘harm‘high-p
he ound
‘ca‘spo
‘intr
ve data tudy the agr
of Pleasantnein [35], is basf the matrix ds×subjects). the variables high percent
nt. The analys
y ASME
closely s study, ns from d set of ds, we pants to
ds, we pants in yze the ch [34]. goals of fluences ners and
hat are motion-aracter-der one s in the also be tegories erson.
ed by
mples bad’, ersome’, oor’ ood’, asant’, forting’ pping’, lerating’ uncing’ ostly’, rlike’, CIFI’
ming’, onious’, pitched’
alm’, orty’, rusive’
reement ess and ed on a of the In this are the
tage of sis was
5 Copyright © 2013 by ASME
made separately for Pleasantness (matrix Y1) and Appropriateness (matrix Y2).
To confirm the results concerning agreement and to study the differences between the sounds, a two-way Analysis of variance (ANOVA) with interaction of the ratings of Pleasantness and Appropriateness was made with the factor ‘assessor’ and the factor ‘sound’.
The relationship between subjects’ perceptions and the four components of the sound, also termed design factors here, has been investigated with conjoint analysis [36]. This approach, known in Kansei Engineering as the ‘quantification theory type I’ [37], proposes to model a quantitative response by qualitative factors, with different levels. A simple additive model is generally proposed for capturing the quantitative response (Eqn. 1):
yi ajk.i ( jk)k1
kj
j1
f
(1)
With: yi : response for product i, provided by the model
f: number of factors kj: number of levels of factor j ajk: part-worth utility for the level k of factor j )( jki : dummy variable. 1)( jki if the level of factor j
in product i is k, zero otherwise : intercept
Thus, if there are f factors with kj levels, we must estimate
p1 (kj 1)j1
f
parameters. The estimates of the part-worth
are obtained with an Ordinary Least Square procedure (ANOVA). We used ANOVA in our application to explain the quantitative ratings according to pleasantness and appropriateness by the 4 design factors C1 C2 C3 C4 that describe the sounds: C1 (2 levels: yes/no), C2 (3 levels: none/consonant/dissonant), C3 (2 levels: broad/narrow), C4 (2 levels: yes/no) (see Annex A). Before fitting the ANOVA model, we have to verify the efficiency of the experimental design given in Annex A. Let X be the matrix of the experimental design (orthogonal coding), ND the number of designs, p the number of parameters to estimate in the model. The Defficiency (%) of a design [38] is given by Eqn. 2:
100.| | / (2)
The Defficiency (%) of the experimental design presented in
Annex A is 80%. Even if this design is not balanced and not orthogonal, this efficiency is considered as sufficient to estimate the part-worth utilities of the factor levels.
4. RESULTS OF THE QUALITATIVE ANALYSIS1
4.1 Should there be added sound for EVs? (RQ1) Generally speaking, the answers to the question as to
whether there should be added sound for EVs were fairly mixed. There were four typical answers; ‘I think it is a silly/bad idea’, ‘It will be a nuisance’, ‘I think it is a good idea’, ‘It is necessary for safety’, and ‘I have no opinion’. Table 2 gives the proportions of users’ and experts’ opinions.
Table 2. Opinions on adding sounds to EVs Users
for Users
against Users no opinion
Experts for
Experts against
57% 23% 20% 67% 33%
In sum, our results show that most of the users in the experiment are in favor of adding sounds to electric cars and see the necessity. However, there was generally little enthusiasm for this hypothetical question, because the added sound was considered as a necessity rather than an opportunity.
The sound experts were mostly in favor of adding sounds to electric cars. Four said it was a good idea to add some kind of sound. One said he had mixed feelings and could see the purpose of adding sounds but would rather be without it as it would be a nuisance. Another said that it was not necessary for him and had difficulty imagining a credible sound for such a purpose.
Given that adding sound is compulsory, this little enthusiasm from the users and expert sound designers indicates that the designer will have to convince users of the relevance of the sound, for example by giving an added value to the sound, to reinforce the brand image of the car, or by designing an unobtrusive, but efficient sound.
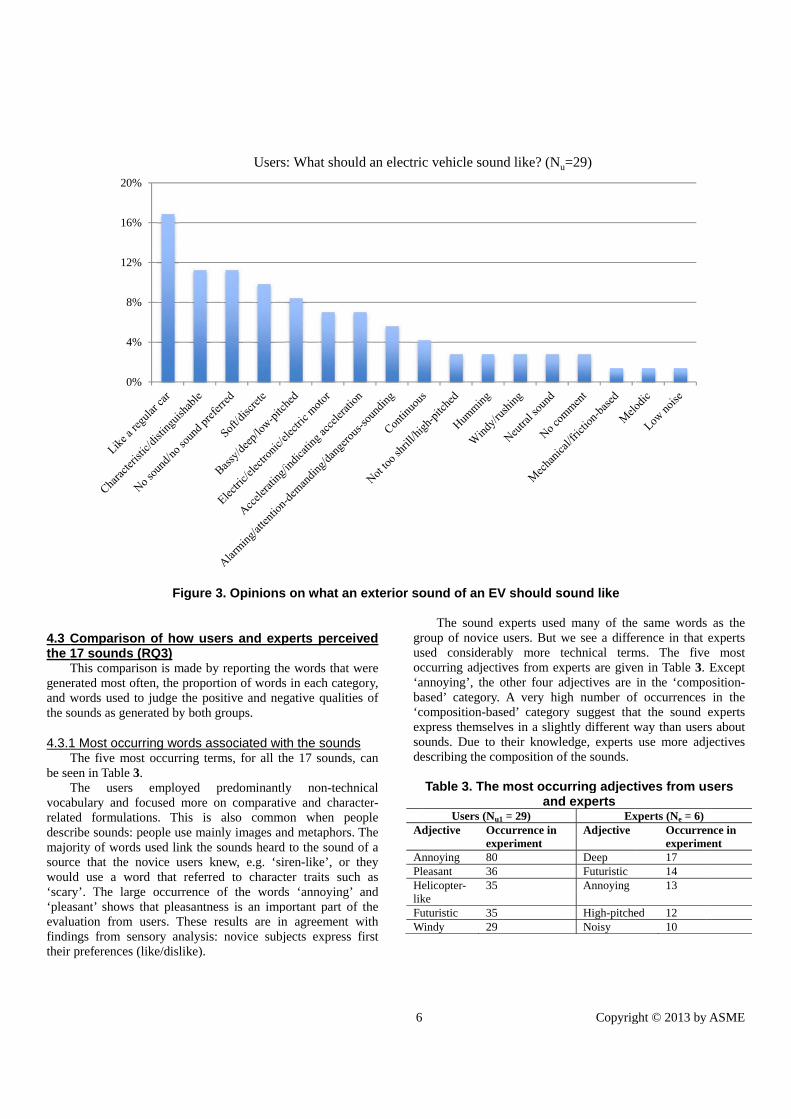
4.2 What should an electric vehicle sound like? (RQ2) The most dominant answer from users was that an electric
car should sound ‘like a regular car’ and resemble a combustion engine sound. This result is in accordance with previous studies on the subject [25-26]. Already in third place, we find that users prefer ‘no sound’ (see Figure 3).
Sound experts gave varied but also complementary answers to this question. Examples are that there should be an ‘electric motor association’, with ‘frequency varying with speed’, light gearing emulation’, and a sound ‘not too rough’, and ‘modulation not too rough.’ Their answers were generally design-oriented. They reported design directions and propositions for innovations for the composition of the sound, including frequency varying with speed, organic, and contrapuntal.
1 Note that among the Nu=34 users, only 29 described the sounds with
words.
4.3 Cthe 1
Tgeneand wthe s
4.3.1T
be seT
vocarelatedescrmajosourcwoul‘scar‘pleaevalufinditheir
Comparison17 sounds (This comparis
erated most oftwords used toounds as gene
1 Most occurThe five mosteen in Table 3.The users
abulary and foed formulatioribe sounds: p
ority of words ce that the nld use a worry’. The largeasant’ shows tuation from uings from senpreferences (l
0%
4%
8%
12%
16%
20%
Figure
n of how usRQ3) son is made b
ften, the propoo judge the poerated by both
rring words at occurring te.
employed ocused more ons. This is people use mai
used link thenovice users krd that referre occurrence that pleasantnusers. These nsory analysislike/dislike).
%
%
%
%
%
%
3. Opinions
sers and exp
by reporting thortion of wordsositive and negroups.
associated wierms, for all th
predominantlon comparati
also comminly images an
e sounds heardknew, e.g. ‘sired to charac
of the wordness is an imp
results are ins: novice subj
Users
s on what an
perts perce
he words that s in each categ
egative qualitie
th the soundhe 17 sounds,
ly non-techive and chara
mon when pend metaphors.d to the soundiren-like’, or ter traits suc
ds ‘annoying’ portant part on agreement jects express
s: What shou
6
n exterior so
ived
were gory, es of
ds , can
hnical acter-eople . The
d of a they
ch as and
f the with first
grusoc‘anba‘coexsode
Ad
AnPleHelikFuW
uld an electric
ound of an E
The sound roup of novicesed consideraccurring adjecnnoying’, the
ased’ categoryomposition-ba
xpress themselounds. Due toescribing the c
Table 3. The
Users (Ndjective O
exnnoying 80easant 36elicopter- ke
35
uturistic 35Windy 29
c vehicle sou
EV should so
experts usede users. But wably more tetives from expother four ad
y. A very higased’ categorylves in a sligh
o their knowlecomposition of
e most occuand
u1 = 29) Occurrence in xperiment 0 6 5
5 9
und like? (Nu
Copyrig
ound like
d many of thewe see a diffeechnical termperts are givedjectives are gh number ofy suggest thahtly different wedge, experts f the sounds.
urring adject experts
ExAdjective
Deep Futuristic Annoying
High-pitcheNoisy
=29)
ght © 2013 by
e same wordserence in thatms. The fiveen in Table 3. in the ‘compof occurrencesat the sound way than useruse more adj
tives from u
xperts (Ne = 6)Occurreexperim17 14 13
ed 12 10
y ASME
s as the experts
e most Except
osition-in the
experts rs about jectives
sers
ence in ent
4.3.2A
codeestimadjecrelatifor e
Fig
Ecategvery the rgrouprelateusersexpethe tinstin
4.3.3I
wereor th
Tab
PositElectrWindyHummLow/dbassy AccelTraditMotorlike FuturiHelicolike
0%
10%
20%
30%
40%
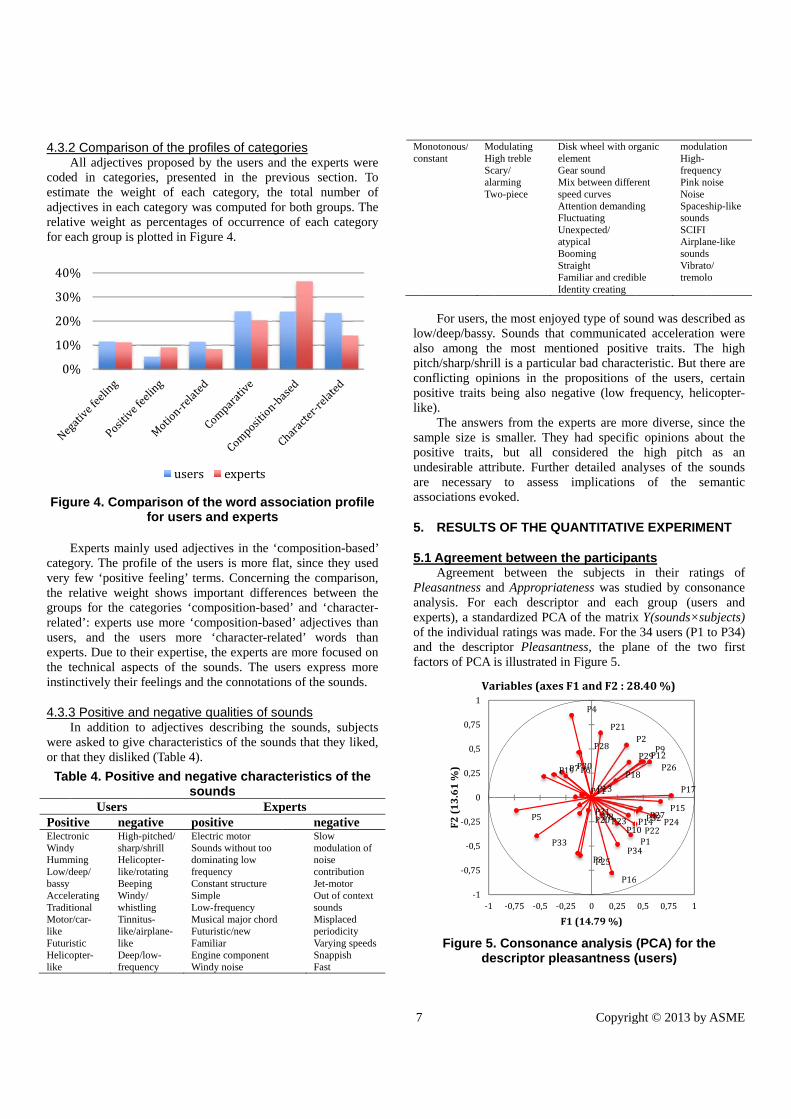
2 ComparisoAll adjectives
ed in categormate the weigctives in each ive weight as ach group is p
ure 4. Comp
Experts mainlgory. The prof
few ‘positiverelative weighps for the cated’: experts us, and the uerts. Due to thetechnical aspenctively their f
3 Positive anIn addition to
e asked to givehat they dislike
ble 4. Positiv
Users tive negaronic y ming deep/
erating tional r/car-
istic opter-
High-sharp/Helicolike/roBeepiWindywhistlTinnitlike/ailike Deep/freque
%
%
%
%
%
n of the profis proposed by ies, presentedght of each category was percentages
plotted in Figu
parison of thfor users a
ly used adjectfile of the usee feeling’ termht shows imptegories ‘com
use more ‘comusers more eir expertise, tects of the sofeelings and th
nd negative qo adjectives de characteristied (Table 4).
ve and negasou
ative posi-pitched/ /shrill opter-otating ing y/ ling tus-irplane-
/low-ency
ElectSoundomifrequConsSimpLow-MusiFuturFamiEnginWind
users
iles of catego the users andd in the prevcategory, the computed forof occurrence
ure 4.
he word assoand experts tives in the ‘cers is more flams. Concerninportant differemposition-basemposition-base‘character-relathe experts areounds. The ushe connotation
ualities of sodescribing thecs of the soun
ative characnds
Expitive tric motor nds without too inating low uency stant structure ple -frequency ical major chord ristic/new iliar ne component dy noise
experts
ories d the experts vious section total number both groups.e of each cate
ociation pro
composition-baat, since they
ng the comparences betweened’ and ‘charaed’ adjectives ated’ wordse more focusesers express mns of the sound
ounds e sounds, subnds that they l
teristics of t
perts negativSlow modulationoise contributiJet-motorOut of consounds MisplacedperiodicitVarying spSnappishFast
7
were n. To er of . The egory
ofile
ased’ used
rison, n the acter-
than than
ed on more ds.
bjects iked,
the
ve
on of
ion r ntext
d ty peeds
Mocon
lowalspitcopolik
sapounaras
5.
5.
Planexofanfac
onotonous/nstant
MoHiScalaTw
For users, tw/deep/bassy.so among thtch/sharp/shril
onflicting opinositive traits bke).
The answerample size is ositive traits, ndesirable attre necessary sociations evo
RESULTS
1 AgreemenAgreement
leasantness annalysis. For xperts), a standf the individuand the descripctors of PCA i
Figure 5.de
‐1
‐0,75
‐0,5
‐0,25
0
0,25
0,5
0,75
1
‐1
F2(13.61%)
Va
odulating igh treble cary/ arming wo-piece
DelGMspAFlUatBoStFaId
the most enjoy. Sounds that he most menll is a particulnions in the pbeing also neg
rs from the exsmaller. They
but all conribute. Further
to assess oked.
S OF THE QU
nt between tbetween th
nd Appropriateach descriptdardized PCAal ratings was mptor Pleasantis illustrated in
. Consonancescriptor ple
P1
P5
P33
‐0,75 ‐0,5 ‐0,
F
ariables(axes
Copyrig
isk wheel with orlement
Gear sound Mix between differpeed curves
Attention demandinluctuating
Unexpected/ typical ooming traight amiliar and credibdentity creating
yed type of soucommunicate
ntioned positilar bad charactpropositions ogative (low fr
xperts are moy had specificnsidered the r detailed anaimplications
UANTITATIV
the participahe subjects iteness was stutor and each
A of the matrixmade. For thetness, the plan Figure 5.
ce analysis easantness (
P1
P11
P16
P23
P3P3
P4
P7
P8
P119
P20
P21
P28
P30
P31
P6
P13
P25
3
,25 0 0,25
F1(14.79%)
F1andF2:28
ght © 2013 by
rganic
rent
ng
ble
modulHigh-frequePink nNoiseSpacessoundsSCIFIAirplasoundsVibrattremol
und was descred acceleratiove traits. Thteristic. But thof the users, requency, heli
ore diverse, sic opinions ab
high pitch alyses of the
of the se
E EXPERIM
ants in their ratinudied by consh group (usex Y(sounds×sue 34 users (P1 ane of the tw
(PCA) for th(users)
P110
6
P17
P24P32
34
P2P9P12
P14
P15
8
P22
P26
P27
P29
0,5 0,75 1
8.40%)
y ASME
lation
ency noise
ship-like s
ane-like s o/ lo
ribed as on were he high here are
certain icopter-
ince the bout the
as an sounds
emantic
ENT
ngs of sonance ers and ubjects) to P34)
wo first
he
R
weak(28.4The also disag(ANOdescreffecof ththe insign consnaturand odimesensodiffe
5.2 E
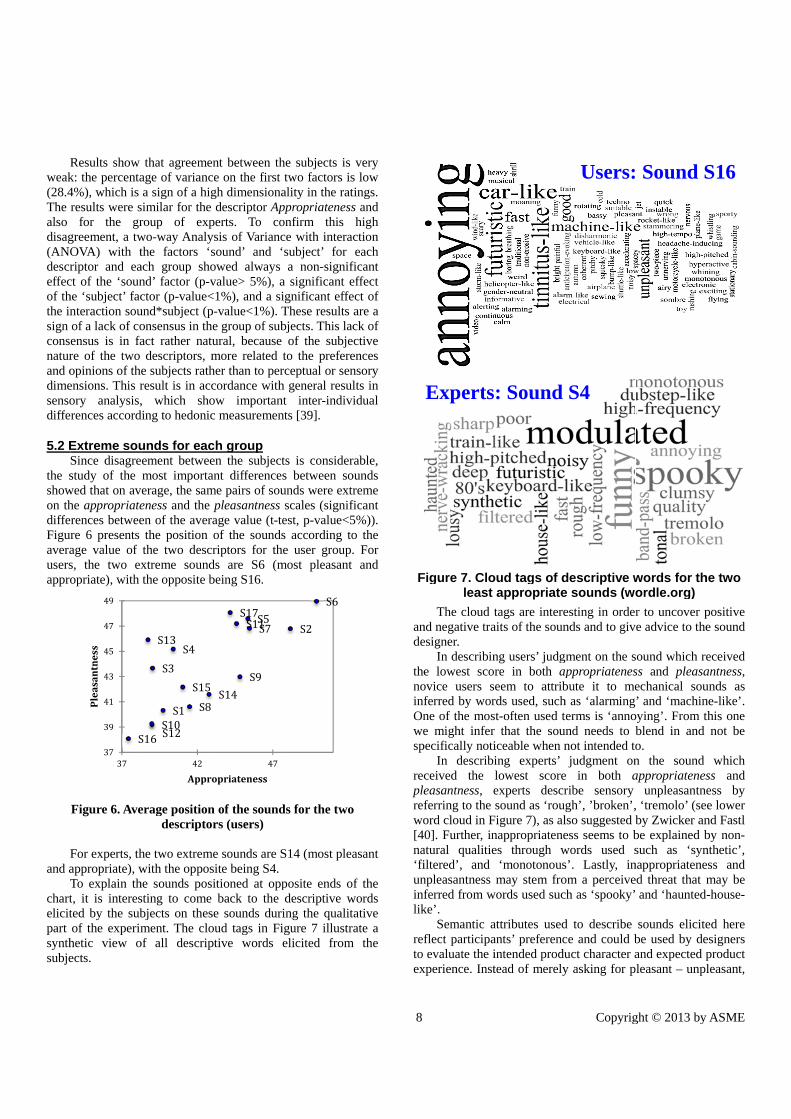
the sshowon thdiffeFiguraverausersappro
F
and aT
chartelicitpart synthsubje
Results show k: the percenta4%), which is results were s
for the grgreement, a twOVA) with triptor and eact of the ‘sounhe ‘subject’ facnteraction souof a lack of coensus is in fare of the two opinions of theensions. This rory analysis,rences accord
Extreme souSince disagrestudy of the
wed that on avhe appropriaterences betweere 6 presents age value of s, the two exopriate), with
Figure 6. Ave
For experts, thappropriate), wTo explain tht, it is interested by the subof the experim
hetic view oects.
S37
39
41
43
45
47
49
37
Pleasantness
that agreemeage of varianca sign of a hig
similar for the roup of expwo-way Analythe factors ‘sach group shond’ factor (p-vctor (p-value<und*subject (ponsensus in thact rather natdescriptors, m
e subjects rathresult is in acc, which sho
ding to hedonic
unds for eacement betweemost importaerage, the sameness and the en of the averthe position the two descxtreme soundthe opposite b
erage positiondescripto
he two extremwith the opposhe sounds possting to come bjects on thesment. The clo
of all descrip
S1
S3
S4
S8
S10S12
S13
S15
S16
42
Appro
ent between thce on the first gh dimensionadescriptor Ap
perts. To coysis of Variancsound’ and ‘owed always value> 5%), a<1%), and a sip-value<1%). The group of subtural, because more related her than to percordance withow importanc measuremen
ch group en the subjectant differencesme pairs of sou
pleasantness rage value (t-teof the sounds
criptors for thds are S6 (mbeing S16.
n of the soundors (users)
me sounds are Ssite being S4. sitioned at opp back to the
se sounds durioud tags in Fiptive words
S5S7
S9
S11
S14
S17
47
opriateness
he subjects is two factors is
ality in the ratppropriatenessonfirm this ce with interacsubject’ fora non-signif
a significant eignificant effeThese results bjects. This lac
of the subjeto the prefererceptual or senh general resulnt inter-indivints [39].
ts is considers between sounds were extrscales (signifest, p-value<5s according to
he user group.most pleasant
ds for the two
S14 (most plea
posite ends odescriptive wing the qualitigure 7 illustrelicited from
S2
S6
8
very s low tings. s and high ction each
ficant effect ect of are a ck of ctive
ences nsory lts in idual
rable, ounds reme
ficant 5%)). o the . For
and
o
asant
f the words tative ate a
m the
F
ande
thenoinOnwesp
recplerewo[4na‘fiuninlik
reto ex
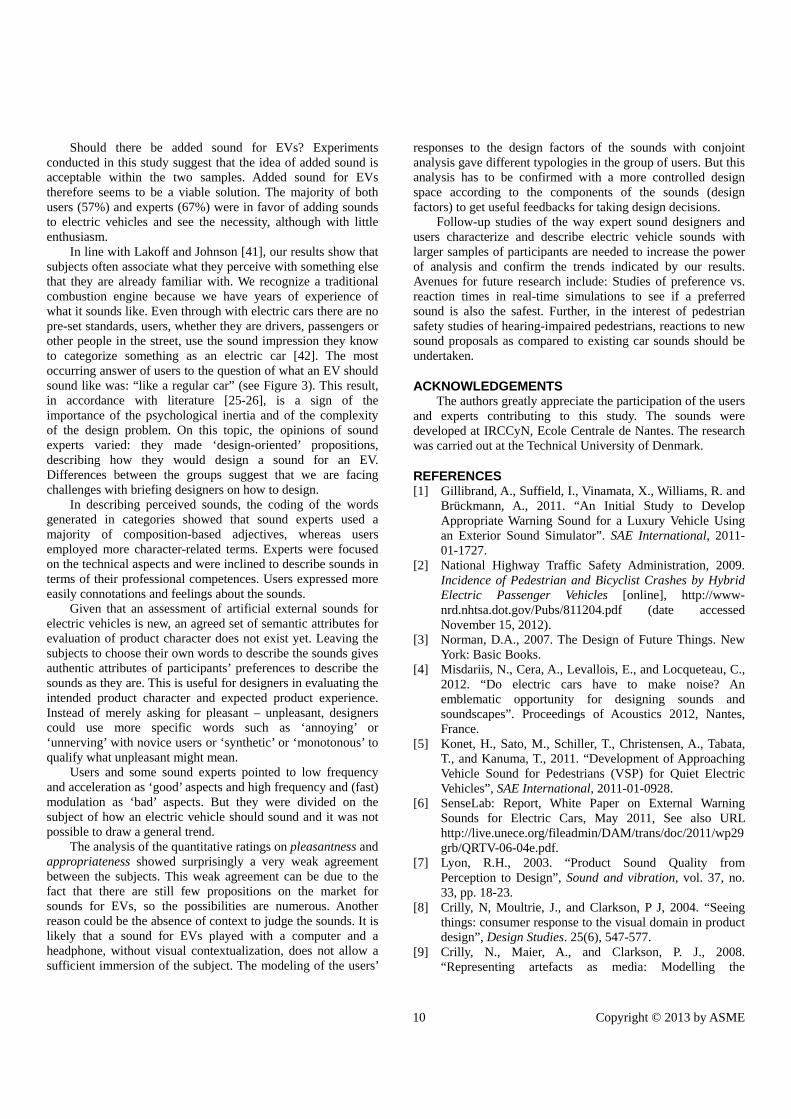
Figure 7. Cloleast
The cloud tnd negative traesigner.
In describine lowest sco
ovice users sferred by worne of the mose might infer
pecifically notiIn describi
ceived the easantness, eferring to the ord cloud in F0]. Further, in
atural qualitieiltered’, and npleasantness ferred from wke’.
Semantic aflect participaevaluate the i
xperience. Inst
Experts
oud tags of dappropriate
tags are intereaits of the soun
ng users’ judgre in both apeem to attrib
rds used, suchst-often used tr that the souiceable when ning experts’ lowest scoreexperts descrsound as ‘rou
Figure 7), as alnappropriatenees through w
‘monotonousmay stem fro
words used suc
attributes usedants’ preferencintended produtead of merely
: Sound
Copyrig
descriptive we sounds (wo
esting in ordernds and to giv
gment on the sappropriatenesbute it to meh as ‘alarmingterms is ‘annound needs to bnot intended tojudgment on
e in both aribe sensory gh’, ’broken’,lso suggested bess seems to bwords used ss’. Lastly, inom a perceivech as ‘spooky’
d to describe ce and could buct character ay asking for p
Users:
S4
ght © 2013 by
words for thordle.org)
r to uncover pe advice to the
sound which ress and pleasaechanical sou’ and ‘machin
oying’. From tblend in and o. n the sound appropriatenes
unpleasantne, ‘tremolo’ (seby Zwicker anbe explained bsuch as ‘syn
nappropriateneed threat that m
and ‘haunted
sounds elicitebe used by deand expected pleasant – unpl
Sound S
y ASME
he two
positive e sound
eceived antness, unds as ne-like’. this one
not be
which ss and ess by e lower nd Fastl by non-nthetic’, ess and may be -house-
ed here esigners product leasant,
S16

9 Copyright © 2013 by ASME
designers could use more specific words such as ‘annoying’ or ‘unnerving’ with novice users or ‘synthetic’ or ‘monotonous’ with experts to qualify what unpleasant might mean.
5.3 Relationship between quantitative assessments and design factors of the sounds
We used conjoint analysis to explain the quantitative ratings according to pleasantness and appropriateness by the four design factors C1-C4 that describe the sounds. For the whole group of subjects (users or experts) and for the two descriptors pleasantness and appropriateness, results of the ANOVA model with four factors (C1, C2, C3, and C4) show that none of these factors had a significant effect (p-value>5%) on the response: the factors are unable to explain the differences between the ratings. This is not surprising, because of the considerable disagreement between the subjects in their ratings.
To explain the differences between the ratings of the sounds and to get more homogeneous subgroups, a partitioning of the group of subjects is necessary. Because of the small size of the experts group (6 individuals), we decided not to partition this group and focused our analysis on the group of users only. In order to provide a partition of the users and to define subgroups who are homogeneous in their ratings of the sounds, a hierarchical ascendant classification (HAC) was done on matrix Y(sounds×subjects) for the descriptors pleasantness and appropriateness. In the HAC, we used Euclidian distance and Ward’s criterion as the linkage rule. Three subgroups of users (G1, G2, G3 for pleasantness, G4, G5, G6 for appropriateness) were considered, according to the variance criterion (highest variance jump in the dendrogram). For each of these subgroups, a conjoint analysis model was fitted on the data with the four qualitative factors (C1, C2, C3, C4). The results of the conjoint analysis for each subgroup are given in Table 5. The part-worth utilities of the factor levels for the significant factors indicate if a level reinforces the response (positive value) or inhibits the response (negative value). The values of the part-worth for the not-significant components are not reported because they are considered as not relevant to explain the variance of the ratings. Table 5. Results of the conjoint analysis model for the
subgroups of users Pleasantness Y1
factor p-value Part-worth utilities
G1
C1 n.s. / / C2 n.s. / / C3 0.8% Broad = -9.4 Narrow = +9.4 C4 n.s. / /
G2
C1 3.5% Yes = +3.5 No = -3.5 C2 n.s. / / C3 n.s. / / C4 n.s. / /
G3
C1 0.3% Yes = -9.3 No = +9.3 C2 n.s. / / C3 n.s. / / C4 3.4% Yes = -6.4 No = +6.4
Appropriateness Y2 factor p-value Part-worth utilities
G4
C1 1.7% Yes = +2.5 No = -2.5
C2 n.s. / / / C3 n.s. / / / C4 0.9% Yes = -4 No = +4
G5
C1 4.4% Yes = -5.3 No = +5.3
C2 n.s. / / / C3 n.s. / / / C4 n.s. / / /
G6
C1 n.s. / / / C2 3.4% Consonant =
-4 Dissonant =-2
None = +6
C3 n.s. / / / C4 n.s. / / /
For pleasantness, the results of the conjoint analysis
exhibit three typical behaviors. The group G1 considers a ‘narrow band noise’ (+9.4) as most ‘pleasant’ rather than a ‘broad band noise’. G2 and G3 are opposite: G2 is attracted by the presence of a sound of an internal combustion engine (+3.5), whereas G3 considers a sound without an internal combustion engine (+9.3) as most pleasant. Also, G3 does not appreciate modulation in the sound (+6.4 for the level ‘No’).
For appropriateness, G4 and G5 are rather opposite. For G5, a sound with an internal combustion engine component is more appropriate, whereas G4 prefers the opposite, and is furthermore interested by the presence of modulation in the sound (+5.3). Group G6 finds the absence of musical chords more appropriate (+6).
These results show a great diversity in the opinion about the sounds proposed and that no feature of the sound is mainly rejected or approved. This leaves a lot of degrees of freedom for the designer when designing sound and shows that a great variety of sounds can be candidates for the EV.
6. CONCLUSIONS AND IMPLICATIONS In this paper, we explored the affective reaction of 34
novice users and six sound experts to 17 synthesized external sounds for electric cars. A qualitative analysis of words used when describing sounds and a quantitative analysis of the assessment according to pleasantness and appropriateness was conducted.
The main contributions of this paper concern the methodology used to analyze the qualitative and quantitative results, the differences in the perceptions of sounds between novice users and experts, and also recommendations concerning the design of sounds.
A majority of participants stated that it is a good idea or necessary to add sounds to electric cars. Most were already familiar with the safety issue from the media or quickly understood during the beginning of the experiment. There was, understandably, more enthusiasm or curiosity among the sound experts than there was among users.
10 Copyright © 2013 by ASME
Should there be added sound for EVs? Experiments conducted in this study suggest that the idea of added sound is acceptable within the two samples. Added sound for EVs therefore seems to be a viable solution. The majority of both users (57%) and experts (67%) were in favor of adding sounds to electric vehicles and see the necessity, although with little enthusiasm.
In line with Lakoff and Johnson [41], our results show that subjects often associate what they perceive with something else that they are already familiar with. We recognize a traditional combustion engine because we have years of experience of what it sounds like. Even through with electric cars there are no pre-set standards, users, whether they are drivers, passengers or other people in the street, use the sound impression they know to categorize something as an electric car [42]. The most occurring answer of users to the question of what an EV should sound like was: “like a regular car” (see Figure 3). This result, in accordance with literature [25-26], is a sign of the importance of the psychological inertia and of the complexity of the design problem. On this topic, the opinions of sound experts varied: they made ‘design-oriented’ propositions, describing how they would design a sound for an EV. Differences between the groups suggest that we are facing challenges with briefing designers on how to design.
In describing perceived sounds, the coding of the words generated in categories showed that sound experts used a majority of composition-based adjectives, whereas users employed more character-related terms. Experts were focused on the technical aspects and were inclined to describe sounds in terms of their professional competences. Users expressed more easily connotations and feelings about the sounds.
Given that an assessment of artificial external sounds for electric vehicles is new, an agreed set of semantic attributes for evaluation of product character does not exist yet. Leaving the subjects to choose their own words to describe the sounds gives authentic attributes of participants’ preferences to describe the sounds as they are. This is useful for designers in evaluating the intended product character and expected product experience. Instead of merely asking for pleasant – unpleasant, designers could use more specific words such as ‘annoying’ or ‘unnerving’ with novice users or ‘synthetic’ or ‘monotonous’ to qualify what unpleasant might mean.
Users and some sound experts pointed to low frequency and acceleration as ‘good’ aspects and high frequency and (fast) modulation as ‘bad’ aspects. But they were divided on the subject of how an electric vehicle should sound and it was not possible to draw a general trend.
The analysis of the quantitative ratings on pleasantness and appropriateness showed surprisingly a very weak agreement between the subjects. This weak agreement can be due to the fact that there are still few propositions on the market for sounds for EVs, so the possibilities are numerous. Another reason could be the absence of context to judge the sounds. It is likely that a sound for EVs played with a computer and a headphone, without visual contextualization, does not allow a sufficient immersion of the subject. The modeling of the users’
responses to the design factors of the sounds with conjoint analysis gave different typologies in the group of users. But this analysis has to be confirmed with a more controlled design space according to the components of the sounds (design factors) to get useful feedbacks for taking design decisions.
Follow-up studies of the way expert sound designers and users characterize and describe electric vehicle sounds with larger samples of participants are needed to increase the power of analysis and confirm the trends indicated by our results. Avenues for future research include: Studies of preference vs. reaction times in real-time simulations to see if a preferred sound is also the safest. Further, in the interest of pedestrian safety studies of hearing-impaired pedestrians, reactions to new sound proposals as compared to existing car sounds should be undertaken.
ACKNOWLEDGEMENTS The authors greatly appreciate the participation of the users
and experts contributing to this study. The sounds were developed at IRCCyN, Ecole Centrale de Nantes. The research was carried out at the Technical University of Denmark.
REFERENCES [1] Gillibrand, A., Suffield, I., Vinamata, X., Williams, R. and
Brückmann, A., 2011. “An Initial Study to Develop Appropriate Warning Sound for a Luxury Vehicle Using an Exterior Sound Simulator”. SAE International, 2011-01-1727.
[2] National Highway Traffic Safety Administration, 2009. Incidence of Pedestrian and Bicyclist Crashes by Hybrid Electric Passenger Vehicles [online], http://www-nrd.nhtsa.dot.gov/Pubs/811204.pdf (date accessed November 15, 2012).
[3] Norman, D.A., 2007. The Design of Future Things. New York: Basic Books.
[4] Misdariis, N., Cera, A., Levallois, E., and Locqueteau, C., 2012. “Do electric cars have to make noise? An emblematic opportunity for designing sounds and soundscapes”. Proceedings of Acoustics 2012, Nantes, France.
[5] Konet, H., Sato, M., Schiller, T., Christensen, A., Tabata, T., and Kanuma, T., 2011. “Development of Approaching Vehicle Sound for Pedestrians (VSP) for Quiet Electric Vehicles”, SAE International, 2011-01-0928.
[6] SenseLab: Report, White Paper on External Warning Sounds for Electric Cars, May 2011, See also URL http://live.unece.org/fileadmin/DAM/trans/doc/2011/wp29grb/QRTV-06-04e.pdf.
[7] Lyon, R.H., 2003. “Product Sound Quality from Perception to Design”, Sound and vibration, vol. 37, no. 33, pp. 18-23.
[8] Crilly, N, Moultrie, J., and Clarkson, P J, 2004. “Seeing things: consumer response to the visual domain in product design”, Design Studies. 25(6), 547-577.
[9] Crilly, N., Maier, A., and Clarkson, P. J., 2008. “Representing artefacts as media: Modelling the
11 Copyright © 2013 by ASME
relationship between designer intent and consumer experience”, International Journal of Design, 2(3), 15-27.
[10] Boatwright, P., and Cagan, J., 2010. “Built to Love: Creating Products that Captivate Customers”, The Science of Product Emotions. San Francisco: Berrett Koehler Publishers Inc.
[11] Schifferstein, H. N. J., and Hekkert P. (eds), 2008. Product Experience, Amsterdam, The Netherlands, Elsevier.
[12] Siwiak, D., and James, F., 2009. “Designing Interior Audio Cues for Hybrid and Electric Vehicles”, Proceedings of AES 36th International Conference, Dearborn, Michigan, USA, 2009 June 2-4.
[13] Özcan, E., and Van Egmond, R., 2012. “Basic semantics of product sounds”, International Journal of Design, vol. 6, no. 2, pp. 41-54.
[14] Clarkson, P. J., 2008. “Human capability and product design”. In H. Schifferstein & P. Hekkert (Eds.), Product Experience (pp. 165–198). Amsterdam: Elsevier.
[15] Van Egmond, R., 2008. “The Experience of Product Sounds”, in Schifferstein, H., N., J., and Hekkert (eds) (2008) Product Experience, The Netherlands, Elsevier, pp. 69-89.
[16] Lemaitre, G., Susini, P., Winsberg, S., and Mc Adams, S., 2003. “Perceptively based design of new car horn sounds”, Proceedings of the 2003 International Conference on Auditory Display, Boston, MA, USA, July 6-9.
[17] Roussarie, V., Richard, F., and Bezat, M.C., 2004. “Perceptive qualification of engine sound character; validation of auditory attributes using analysis-synthesis method”. Proceedings of CFA/DAGA’2004.
[18] Cerrato, G., 2009. “Automotive Sound Quality – Powertrain, Road and Wind Noise”, Sound and Vibration, vol. 43, no. 4, pp. 16-24
[21] Yanagisawa, H., Kataoka, A., Murakami, T., Ohtomi, K., and Hosaka, R., 2009. “Extraction of Latent Emotional Factors by Analyzing Human Sensitivity towards Unexplored Design: Application to Product Sound Design”, Proceedings of International Conference on Engineering Design, Stanford, CA, USA, August 24-27, ICED, vol. 7, pp. 13-24.
[22] Yanagisawa, H., Murakami, T., Noguchi, S., Ohtomi, K. and Hosaka, R., 2007. “Quantification Method of Diverse Kansei Quality for Emotional Design - Application of Product Sound Design”, Proceedings of IDETC/CIE, Las Vegas, NV, USA, Sept. 4-7, ASME, pp. 1-10.
[23] Poirson, E., Petiot, J-F., and Richard, F., 2010. “A method for perceptual evaluation of products by naive subjects: Application to car engine sounds”, International Journal of Industrial Ergonomics, vol. 40, no. 5, pp. 504-516.
[25] Wogalter M., Ornan R., Lim., and Chipley, R. , 2001. “On the risk of quiet vehicles to pedestrian and drivers”, Proceedings of the Human Factors and Ergonomics Society, 45th annual meeting, 2001.
[26] Nyeste, P., Wogalter, M., 2008. “On adding sound to quiet vehicles”, Proceedings of the Human Factors and Ergonomics Society, 52nd annual meeting.
[19] Petiot, J-F., and Yannou, B., 2004. “Measuring consumer perceptions for a better comprehension, specification and assessment of product semantics”, International Journal of Industrial Ergonomics. Vol 33/6 pp 507-525.
[20] Hsu, S. H., Chuang, M. C., and Chang, C. C., 2000. “A Semantic Differential Study of Designers' and Users' Product Form Perception”, International Journal of Industrial Ergonomics, vol. 25, no. 4, pp. 375-391.
[24] Edworthy, J., Hellier, E., and Hards, R., 1995. “The semantic associations of acoustic parameter commonly used in the design of auditory information and warning signals”, Ergonomics, 38(11), 2341-2361.
[27] Ahmed, S., Wallace, K, M., and Blessing, L. S., 2003. ”Understanding the differences between how novice and experienced designers approach design tasks”. Research in Engineering Design. Vol. 14, Issue 1, pp 1-11.
[28] Williams, E. J., 1949. “Experimental designs balanced for the estimation of residual effects of treatments”, Australian Journal of Scientific Research, Physical Sciences, vol. 2, no. 2, pp. 149-168.
[29] Ares, G., and Deliza, R., 2010. “Studying the influence of package shape and colour on consumer expectations of milk desserts using word association and conjoint analysis”, Food Quality and Preference, 21, 930–937.
[30] Green, P. E., and Srinivasan, V., 1978. “Conjoint analysis in consumer research: Issues and outlook”, Journal of Consumer Research, 5, 103–123.
[31] Piqueras-Fiszman, B., Velasco, C., Salgado-Montejo, A., and Spence, C., 2013. “Using combined eye tracking and word association in order to assess novel packaging solutions: A case study involving jam jars”, Food Quality and Preference, 28(1), 328–338.
[32] Ajzen, I., and Fishbein, M., 1980. “Understanding attitudes and predicting behavior”. Engelwood Cliffs, New Jersey: Prentice-Hall Inc.
[33] Cupchik, G., C. and Hilscher, M., C., 2008. “Holistic perspectives on the design of experience”, in Schifferstein, H., N., J., and Hekkert (eds) (2008) Product Experience, The Netherlands, Elsevier, pp. 241-255.
[34] Strauss, A., and Corbin, J., 1998. “Basics of Qualitative Research”. Techniques and Procedures for Developing Grounded Theory. London: Sage Publications.
[35] Dijksterhuis, G., 1995. “Assessing Panel Consonance”, Food Quality and Preference, vol. 6, pp. 7-14.
[36] Green, P., Carroll, J., and Goldberg, S., 1981. “A general approach to product design optimization via conjoint analysis”, Journal of Marketing, vol 43, pp 17-35.
[37] Hayashi, C., 1952.”On the prediction of phenomena from qualitative data from the mathematics-statistical point of view”, Annals of the Institute of Statistical Mathematics, 3, pp.69-98.

12 Copyright © 2013 by ASME
[38] Kuhfeld, W., 1997. “Efficient Experimental Designs Using Computerized Searches”, Sawtooth Software Conference Proceedings.
[39] Koster, E.P., Couronne, T., Léon, F., Lévy, C., and Marcelino, A.S., 2002. “Repeatability in hedonic sensory measurement: a conceptual exploration”. Food Quality and Preference 14, 165-176.
[40] Zwicker, E., and Fastl., H., 1990. “Psychoacoustics: Facts and models”. Berlin, Germany: Springer.
[41] Lakoff, G., and Johnson, M., 1980. Metaphors We Live By, Chicago, IL, Chicago University Press.
[42] Smith, E. E., and Medin, D. L., 1981. Categories and concepts, Cambridge, MA, Harvard University Press.
ANNEX A
DESCRIPTION OF THE 17 SYNTHESIZED SOUNDS
Sound Component C1 Motor component
Component C2 harmonic
component (chord)
Component C3 Noise
component
Component C4 Modulation component
S1 yes (present) dissonant broad yes S2 yes none (absent) broad no S3 yes none broad yes S4 no (absent) consonant narrow yes S5 yes dissonant narrow no S6 yes dissonant narrow yes S7 no none broad no S8 no none broad yes S9 no consonant broad no
S10 yes none broad yes S11 no none broad yes S12 no dissonant broad no S13 no dissonant broad yes S14 yes none broad yes S15 no none broad yes S16 yes consonant narrow no S17 yes consonant narrow no