how search engines work 2
TRANSCRIPT

Report Series Published by SRI International
Research collaborators:
University of Massachusetts, Dartmouth; Virginia Polytechnic Institute and State University; The University of Texas at Austin; and the Charles A. Dana Center at the University of Texas at Austin
Scaling Up SimCalc Project
Jennifer Knudsen
Technical Report 07 June 2010
Design and Development of Curriculum Units and Professional Development

SRI InternationalCenter for Technology in Learning333 Ravenswood AvenueMenlo Park, CA 94025-3493650.859.2000
Authorization to reproduce this publication in whole or in part is granted. While permission to reprint this publication is not necessary, the citation should be: Knudsen, J. (2010) Design and Development of Curriculum Units and Professional Development (SimCalc Technical Report 07). Menlo Park, CA: SRI International.
Design and Development of Curriculum Units and Professional Development
Prepared by:
Jennifer Knudsen, SRI International
Acknowledgments
This report is based on work supported by the National Science Foundation under Grant No. 0437861. Any opinions, findings, and conclusions or recommendations expressed in this report are those of the authors and do not necessarily reflect the views of the National Science Foundation.
We thank J., Roschelle, N. Shechtman, G. Estrella, G. Haertel, K. Rafanan, P. Vahey, S. Carriere, L. Gallagher, H. Javitz, T. Lara-Meloy, M. Robidoux, S. Empson, S. Hull, L. Hedges, S. Goldman, H. Becker, J. Sowder, G. Harel, P. Callahan, F. Sloane, B. Fishman, K. Maier, J. Earle, R. Schorr, and B. McNemar for their contributions to this research. We thank the participating teachers and Texas Educational Service Center leaders from regions 1, 6, 9, 10, 11, 13, 17 and 18; this project could not have happened without them. We thank and remember Jim Kaput, who pioneered SimCalc as part of his commitment to democratizing mathematics education.
4 © 2010 SRI International — Design and Development of Curriculum Units and Professional Development
Design and Development of Curriculum Units and Professional Development
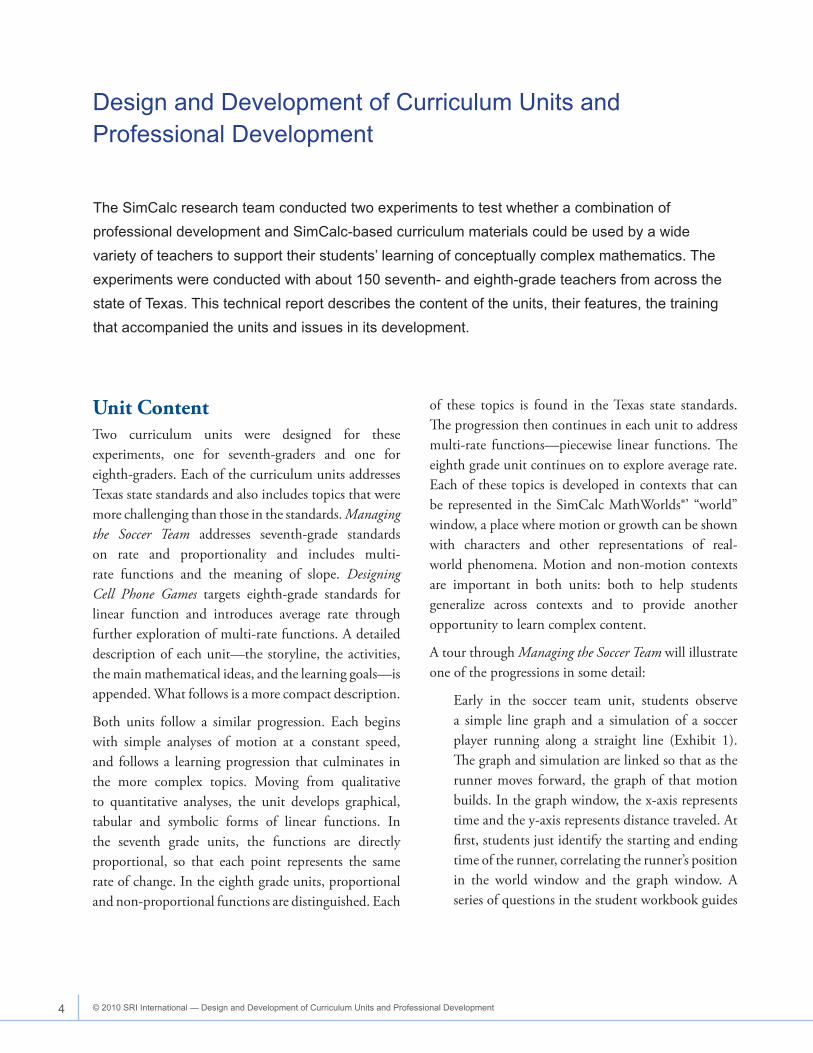
The SimCalc research team conducted two experiments to test whether a combination of professional development and SimCalc-based curriculum materials could be used by a wide variety of teachers to support their students’ learning of conceptually complex mathematics. The experiments were conducted with about 150 seventh- and eighth-grade teachers from across the state of Texas. This technical report describes the content of the units, their features, the training that accompanied the units and issues in its development.
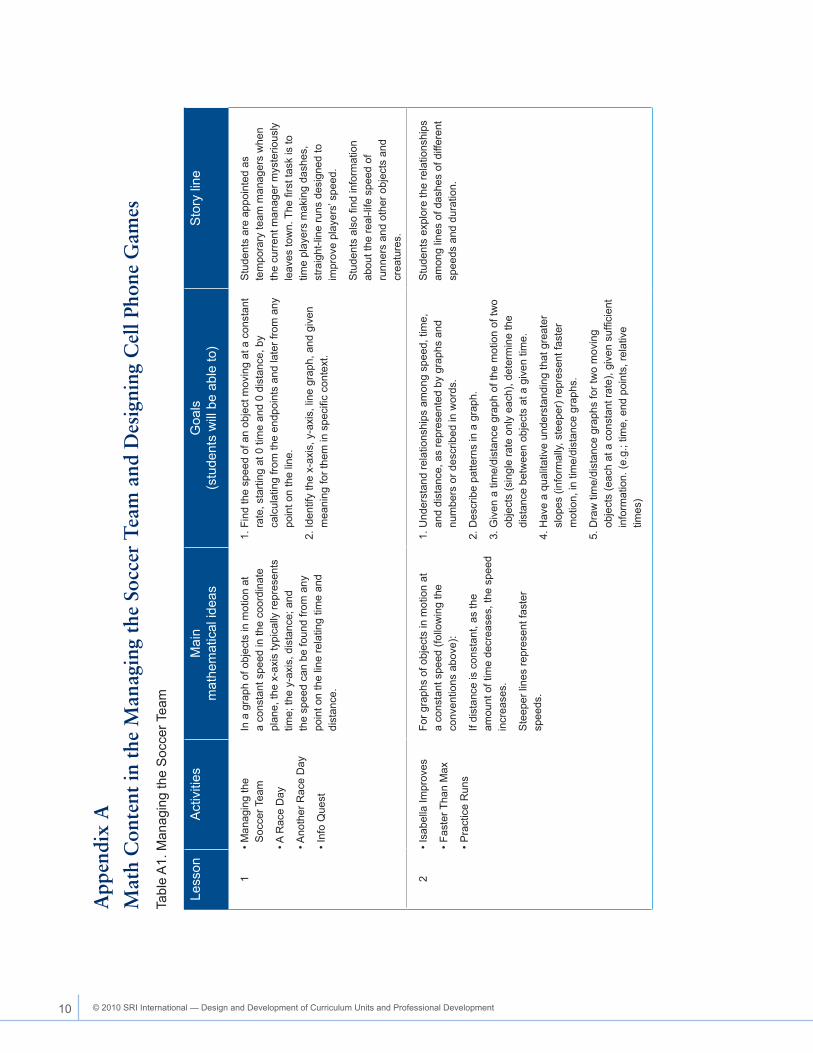
Unit ContentTwo curriculum units were designed for these experiments, one for seventh-graders and one for eighth-graders. Each of the curriculum units addresses Texas state standards and also includes topics that were more challenging than those in the standards. Managing the Soccer Team addresses seventh-grade standards on rate and proportionality and includes multi-rate functions and the meaning of slope. Designing Cell Phone Games targets eighth-grade standards for linear function and introduces average rate through further exploration of multi-rate functions. A detailed description of each unit—the storyline, the activities, the main mathematical ideas, and the learning goals—is appended. What follows is a more compact description.
Both units follow a similar progression. Each begins with simple analyses of motion at a constant speed, and follows a learning progression that culminates in the more complex topics. Moving from qualitative to quantitative analyses, the unit develops graphical, tabular and symbolic forms of linear functions. In the seventh grade units, the functions are directly proportional, so that each point represents the same rate of change. In the eighth grade units, proportional and non-proportional functions are distinguished. Each
of these topics is found in the Texas state standards. The progression then continues in each unit to address multi-rate functions—piecewise linear functions. The eighth grade unit continues on to explore average rate. Each of these topics is developed in contexts that can be represented in the SimCalc MathWorlds®’ “world” window, a place where motion or growth can be shown with characters and other representations of real-world phenomena. Motion and non-motion contexts are important in both units: both to help students generalize across contexts and to provide another opportunity to learn complex content.
A tour through Managing the Soccer Team will illustrate one of the progressions in some detail:
Early in the soccer team unit, students observe a simple line graph and a simulation of a soccer player running along a straight line (Exhibit 1). The graph and simulation are linked so that as the runner moves forward, the graph of that motion builds. In the graph window, the x-axis represents time and the y-axis represents distance traveled. At first, students just identify the starting and ending time of the runner, correlating the runner’s position in the world window and the graph window. A series of questions in the student workbook guides

5 Technical Report 07 June 2010
students from this initial interpretation of the graph to the understanding that the entire line represents the speed of the runner, the ratio of distance to time.
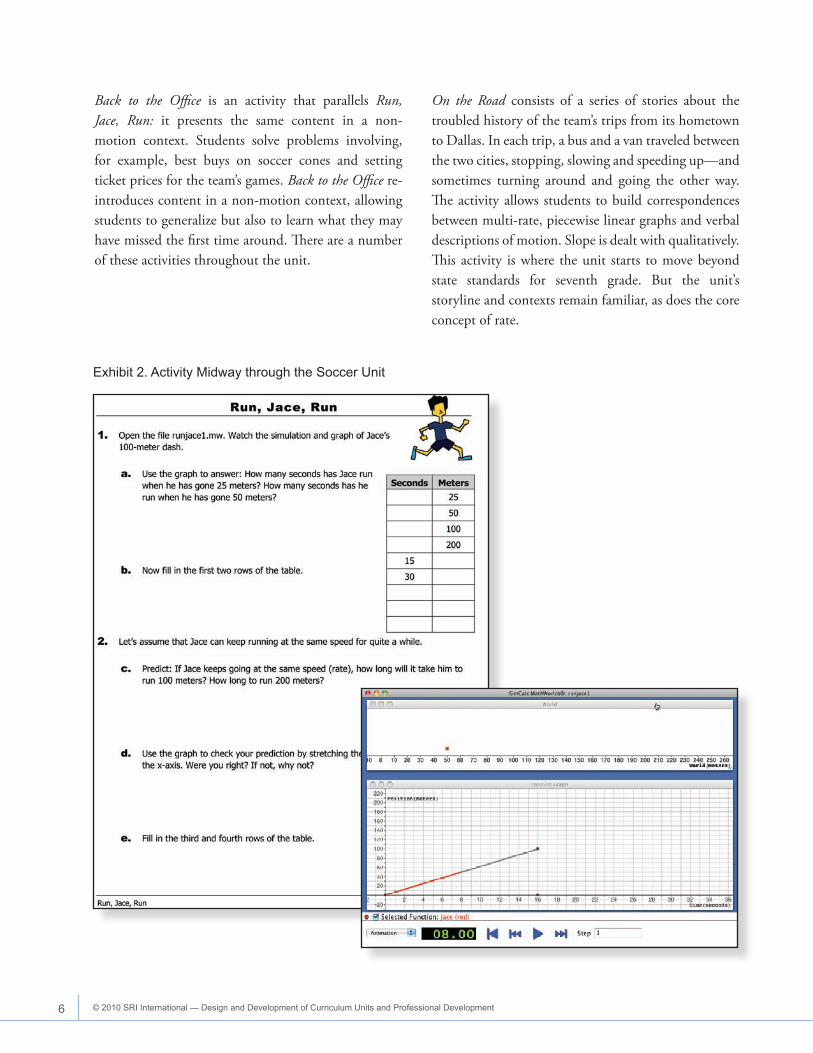
In the middle of the unit, Run, Jace, Run introduces symbolic algebraic notation to represent the same type
of motion (Exhibit 2). Students express the relationship between time and distance first in a graph, then in a table, then in words, and finally in an equation. Both table and language representations of motion enable students to write the equation of the line. Through more activities, students develop facility in connecting representations and translating from one to another.
Exhibit 1. Activity from Early in the Unit
6 © 2010 SRI International — Design and Development of Curriculum Units and Professional Development
Back to the Office is an activity that parallels Run, Jace, Run: it presents the same content in a non-motion context. Students solve problems involving, for example, best buys on soccer cones and setting ticket prices for the team’s games. Back to the Office re-introduces content in a non-motion context, allowing students to generalize but also to learn what they may have missed the first time around. There are a number of these activities throughout the unit.
On the Road consists of a series of stories about the troubled history of the team’s trips from its hometown to Dallas. In each trip, a bus and a van traveled between the two cities, stopping, slowing and speeding up—and sometimes turning around and going the other way. The activity allows students to build correspondences between multi-rate, piecewise linear graphs and verbal descriptions of motion. Slope is dealt with qualitatively. This activity is where the unit starts to move beyond state standards for seventh grade. But the unit’s storyline and contexts remain familiar, as does the core concept of rate.
Exhibit 2. Activity Midway through the Soccer Unit

7 Technical Report 07 June 2010
Unit FeaturesIn addition to detailing the mathematics learning progression, the unit designers used a set of features to support teachers and students in their use of the unit.
Both the teacher notes and the student materials were designed to be helpful to teachers in planning and implementing each unit. Teachers who might never open their teacher notes could instead use the student workbook as a kind of default guide or lesson plan. Important questions for the class to consider are written into the student book—in fact, every important question that the developers could think of was treated this way. On the other hand, the workbook is not a prescriptive script—teachers were free to write their
own lesson plans, augmenting or highlighting different parts of the student workbook. A third option was to use the teachers’ notes to adapt premade day-by-day lesson plans. These plans provided extra questions to ask students, and included sample student responses. A suggested pacing chart helped teachers plan for how to complete the unit in whatever amount of time they might have—with the recommended time being 10 days.
Other features of the units were designed to help students directly. SimCalc MathWorlds® software allows animated versions of objects and people in motion in contexts. The theme of each unit provides continuity across these contexts and the storyline provides detail that the software could not capture.
Exhibit 3. Activity from Second Half of Unit

8 © 2010 SRI International — Design and Development of Curriculum Units and Professional Development
Realistic numbers are used so that students could check speeds, prices and other rates against their knowledge of how expensive uniforms are or how fast people run. The text uses simple sentence structure and consistent vocabulary, never going beyond a fifth-grade reading level, in order to accommodate those with low-level reading skills and those just learning to read English in making sense of the context and the math. To help guide and organize students’ work, the workbook uses graphical conventions to indicate various kinds of activities and content. For example, definitions appeared inside boxes on the page, as did other critical content information. The amount of white space left after a question indicated the type and length of an expected answer. Simple graphics served as implicit indices for the activities. Even the fact that the workbook contained all the student activities physically bound together provided another organizational aid to students. The workbooks contained as much color as the budget would allow, appealing to media-savvy students who are used to plentiful use of color.
Professional DevelopmentThe seventh-grade and eighth-grade experiments used two different professional development (PD) models. The first was designed to best ensure that the researchers’ and developers’ intentions were reflected in the PD and therefore reached teachers. The second was designed to be better aligned with professional development practices in Texas. The workshops offered in the PD were less than a week long, about as much as could be expected from teachers for training in teaching a replacement unit.
For Managing the Soccer Team, the goals of the 5 days of training were to
• Provide teachers with a mental image of the unit as a whole, as well as direct experience with most activities.
• Improve teachers’ content knowledge, both in terms of the mathematics in the unit—going deeper—and the mathematics that might come after the unit—going farther.
• Allow teachers to develop comfort with the software
• Model teaching strategies consistent with a SimCalc approach.
• Show how the unit fit in with local customs and addressed state standards.
The workshop had three parts. In the first part, a well-known local expert in math professional development led the teachers in transitioning from a view of proportionality as a/b = c/d—a relationship among four numbers—to a broader view of proportionality as a linear function of the form y = kx—relating an infinite number of pairs of numbers. This understanding was key to considering rate and proportionality in the SimCalc context, where functions are the primary object of study. Additionally, this transition was advocated by influential state education groups; materials similar to theirs were used in the workshops. For the next two days, a member of the SRI team led teachers through the Managing the Soccer Team unit, using their workbooks and the software. The leader modeled a small set of SimCalc strategies such as “predict, check, explain,” in which teachers were encouraged to predict what would happen in SimCalc MathWorlds® simulations before running them and then explain the differences between what they predicted and what actually happened. To boost teachers’ comfort with the software, the leader gave demonstrations and encouraged teachers to play with the software, as well as use it in the unit activities. In the third part of the workshop, teachers used additional activities and the software to explore calculus concepts, learning about the relationship between graphs of velocity and speed. Teachers learned this more advanced mathematics core to SimCalc, both so that they could understand where the mathematics in the soccer unit could lead and so that they could experience new content, in the same way that Managing the Soccer Team is likely to be for their students.
The eighth grade experiment used a two-tiered system of training—a “train the trainers” approach. The same pair of professional developers led a 2-day training for local professional development experts, who then delivered a 3-day training session for teachers in the

9 Technical Report 07 June 2010
regions of Texas that they served. These local experts were provided with curriculum, teacher notes and presentation slides. They were asked to do a training much like that described for the second two parts of the seventh-grade study.
Balancing ConstraintsEvery curriculum is designed within constraints—which might be about the people, the resources or the politics in a given situation. Designing the Scaling Up SimCalc units was no different—but with the added constraint of the experimental setting in which the materials were used.
Designing for the experiment and for other constraints was a balancing act. The units, of course, needed to well represent the SimCalc approach to teaching and learning—that is what the experiments were designed to test. Typically, SimCalc is used to help young students, middle through high school, learn the fundamental ideas of calculus by providing real-life interpretations for differentiation and integration (hence the same SimCalc). But these topics were more advanced that those in the middle school mathematics standards in Texas, where the experiments took place. The teachers, administrators and policymakers associated with the experiment wanted to ensure that materials used by thousands of students would address the most important topics in their standards. Finding a balance between typical SimCalc topics and state standards-based content resulted in the content described in this report. By inching past the standards, with multi-rate functions, we managed to stay within the comfort zone of local education leaders as well as many teachers, while still pushing into the “precalculus” territory of SimCalc.
Another part of the experimental design was recruiting a wide variety of teachers in terms of background, experience, pedagogical style, and mathematics knowledge. In designing the teacher supports described, this wide variety was considered. The materials needed to meet the needs of teachers who struggled with
the math, without over-constraining teachers with advanced content knowledge. The teachers with advanced content knowledge, though, might be still developing pedagogical skills, and so both the skillful questioner and the teacher struggling to keep order in class needed to be supported. Finally, other work had revealed that many of today’s teachers do little written planning before delivering their lessons. So the training included time and structure to help teachers do that planning, an important part of teaching particularly for novice teachers.
Pedagogy is often embedded in curriculum and made explicit during training. Traditionally, SimCalc materials presented fairly complex and open-ended problem situations in which students could gradually develop mathematical insights. This was not the commonly endorsed pedagogy at the time, and not many teachers would have had exposure to such methods. So the experiment’s units were more highly structured than customary SimCalc materials, and the PD leaders did not push teachers to adopt wholly new practices.
ConclusionThis report described several aspects of the curriculum and professional development used in two scaling up experiments. Paper materials and software served to guide students in an exploration of real-world contexts and associated mathematics representations, focusing on rate, proportionality, and linear function. Developers of the unit took into account not only the mathematics that could be learned using a SimCalc approach, but also state standards that were essential to address. Teachers were supported in their classroom use of the materials through a set of teacher notes and professional development that focused on teachers’ mathematics learning and effective implementation of the unit. The developers took into consideration then-current state standards and assessments in their curriculum and PD design.
10 © 2010 SRI International — Design and Development of Curriculum Units and Professional Development 11 Technical Report 07 June 2010
App
endi
x A
Mat
h C
onte
nt in
the
Man
agin
g th
e So
ccer
Tea
m a
nd D
esig
ning
Cel
l Pho
ne G
ames
Tabl
e A
1. M
anag
ing
the
Soc
cer T
eam
Less
onA
ctiv
ities
Mai
n
mat
hem
atic
al id
eas
Goa
ls
(stu
dent
s w
ill b
e ab
le to
)S
tory
line
1• M
anag
ing
the
Soc
cer T
eam
• A R
ace
Day
• Ano
ther
Rac
e D
ay
• Inf
o Q
uest
In a
gra
ph o
f obj
ects
in m
otio
n at
a
cons
tant
spe
ed in
the
coor
dina
te
plan
e, th
e x-
axis
typi
cally
repr
esen
ts
time;
the
y-ax
is, d
ista
nce;
and
th
e sp
eed
can
be fo
und
from
any
po
int o
n th
e lin
e re
latin
g tim
e an
d di
stan
ce.
1. F
ind
the
spee
d of
an
obje
ct m
ovin
g at
a c
onst
ant
rate
, sta
rting
at 0
tim
e an
d 0
dist
ance
, by
calc
ulat
ing
from
the
endp
oint
s an
d la
ter f
rom
any
po
int o
n th
e lin
e.
2. Id
entif
y th
e x-
axis
, y-a
xis,
line
gra
ph, a
nd g
iven
m
eani
ng fo
r the
m in
spe
cific
con
text
.
Stu
dent
s ar
e ap
poin
ted
as
tem
pora
ry te
am m
anag
ers
whe
n th
e cu
rren
t man
ager
mys
terio
usly
le
aves
tow
n. T
he fi
rst t
ask
is to
tim
e pl
ayer
s m
akin
g da
shes
, st
raig
ht-li
ne ru
ns d
esig
ned
to
impr
ove
play
ers’
spe
ed.
Stu
dent
s al
so fi
nd in
form
atio
n ab
out t
he re
al-li
fe s
peed
of
runn
ers
and
othe
r obj
ects
and
cr
eatu
res.
2• I
sabe
lla Im
prov
es
• Fas
ter T
han
Max
• Pra
ctic
e R
uns
For g
raph
s of
obj
ects
in m
otio
n at
a
cons
tant
spe
ed (f
ollo
win
g th
e co
nven
tions
abo
ve):
If di
stan
ce is
con
stan
t, as
the
amou
nt o
f tim
e de
crea
ses,
the
spee
d in
crea
ses.
Ste
eper
line
s re
pres
ent f
aste
r sp
eeds
.
1. U
nder
stan
d re
latio
nshi
ps a
mon
g sp
eed,
tim
e,
and
dist
ance
, as
repr
esen
ted
by g
raph
s an
d nu
mbe
rs o
r des
crib
ed in
wor
ds.
2. D
escr
ibe
patte
rns
in a
gra
ph.
3. G
iven
a ti
me/
dist
ance
gra
ph o
f the
mot
ion
of tw
o ob
ject
s (s
ingl
e ra
te o
nly
each
), de
term
ine
the
dist
ance
bet
wee
n ob
ject
s at
a g
iven
tim
e.
4. H
ave
a qu
alita
tive
unde
rsta
ndin
g th
at g
reat
er
slop
es (i
nfor
mal
ly, s
teep
er) r
epre
sent
fast
er
mot
ion,
in ti
me/
dist
ance
gra
phs.
5. D
raw
tim
e/di
stan
ce g
raph
s fo
r tw
o m
ovin
g ob
ject
s (e
ach
at a
con
stan
t rat
e), g
iven
suf
ficie
nt
info
rmat
ion.
(e.g
.; tim
e, e
nd p
oint
s, re
lativ
e tim
es)
Stu
dent
s ex
plor
e th
e re
latio
nshi
ps
amon
g lin
es o
f das
hes
of d
iffer
ent
spee
ds a
nd d
urat
ion.
10 © 2010 SRI International — Design and Development of Curriculum Units and Professional Development 11 Technical Report 07 June 2010
Less
onA
ctiv
ities
Mai
n
mat
hem
atic
al id
eas
Goa
ls
(stu
dent
s w
ill b
e ab
le to
)S
tory
line
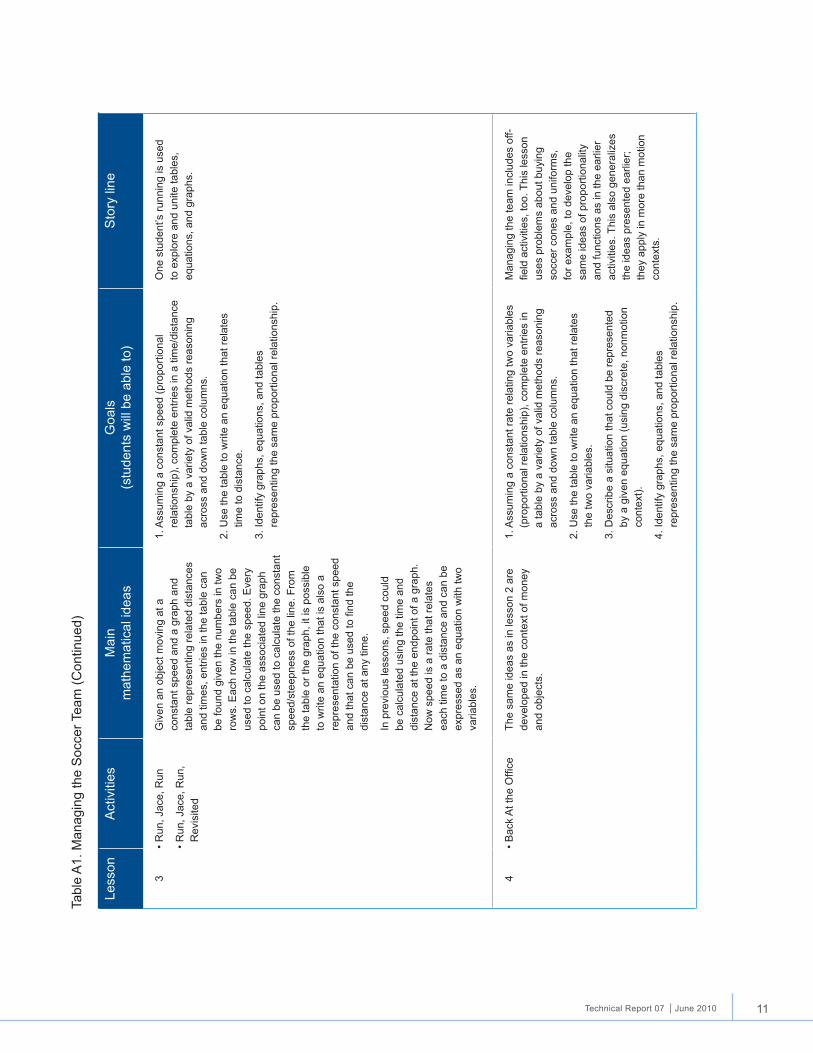
3• R
un, J
ace,
Run
• Run
, Jac
e, R
un,
Rev
isite
d
Giv
en a
n ob
ject
mov
ing
at a
co
nsta
nt s
peed
and
a g
raph
and
ta
ble
repr
esen
ting
rela
ted
dist
ance
s an
d tim
es, e
ntrie
s in
the
tabl
e ca
n be
foun
d gi
ven
the
num
bers
in tw
o ro
ws.
Eac
h ro
w in
the
tabl
e ca
n be
us
ed to
cal
cula
te th
e sp
eed.
Eve
ry
poin
t on
the
asso
ciat
ed li
ne g
raph
ca
n be
use
d to
cal
cula
te th
e co
nsta
nt
spee
d/st
eepn
ess
of th
e lin
e. F
rom
th
e ta
ble
or th
e gr
aph,
it is
pos
sibl
e to
writ
e an
equ
atio
n th
at is
als
o a
repr
esen
tatio
n of
the
cons
tant
spe
ed
and
that
can
be
used
to fi
nd th
e di
stan
ce a
t any
tim
e.
In p
revi
ous
less
ons,
spe
ed c
ould
be
cal
cula
ted
usin
g th
e tim
e an
d di
stan
ce a
t the
end
poin
t of a
gra
ph.
Now
spe
ed is
a ra
te th
at re
late
s ea
ch ti
me
to a
dis
tanc
e an
d ca
n be
ex
pres
sed
as a
n eq
uatio
n w
ith tw
o va
riabl
es.
1. A
ssum
ing
a co
nsta
nt s
peed
(pro
porti
onal
re
latio
nshi
p), c
ompl
ete
entri
es in
a ti
me/
dist
ance
ta
ble
by a
var
iety
of v
alid
met
hods
reas
onin
g ac
ross
and
dow
n ta
ble
colu
mns
.
2. U
se th
e ta
ble
to w
rite
an e
quat
ion
that
rela
tes
time
to d
ista
nce.
3. Id
entif
y gr
aphs
, equ
atio
ns, a
nd ta
bles
re
pres
entin
g th
e sa
me
prop
ortio
nal r
elat
ions
hip.
One
stu
dent
’s ru
nnin
g is
use
d to
exp
lore
and
uni
te ta
bles
, eq
uatio
ns, a
nd g
raph
s.
4• B
ack
At t
he O
ffice
The
sam
e id
eas
as in
less
on 2
are
de
velo
ped
in th
e co
ntex
t of m
oney
an
d ob
ject
s.
1. A
ssum
ing
a co
nsta
nt ra
te re
latin
g tw
o va
riabl
es
(pro
porti
onal
rela
tions
hip)
, com
plet
e en
tries
in
a ta
ble
by a
var
iety
of v
alid
met
hods
reas
onin
g ac
ross
and
dow
n ta
ble
colu
mns
.
2. U
se th
e ta
ble
to w
rite
an e
quat
ion
that
rela
tes
the
two
varia
bles
.
3. D
escr
ibe
a si
tuat
ion
that
cou
ld b
e re
pres
ente
d by
a g
iven
equ
atio
n (u
sing
dis
cret
e, n
onm
otio
n co
ntex
t).
4. Id
entif
y gr
aphs
, equ
atio
ns, a
nd ta
bles
re
pres
entin
g th
e sa
me
prop
ortio
nal r
elat
ions
hip.
Man
agin
g th
e te
am in
clud
es o
ff-fie
ld a
ctiv
ities
, too
. Thi
s le
sson
us
es p
robl
ems
abou
t buy
ing
socc
er c
ones
and
uni
form
s,
for e
xam
ple,
to d
evel
op th
e sa
me
idea
s of
pro
porti
onal
ity
and
func
tions
as
in th
e ea
rlier
ac
tiviti
es. T
his
also
gen
eral
izes
th
e id
eas
pres
ente
d ea
rlier
; th
ey a
pply
in m
ore
than
mot
ion
cont
exts
.
Tabl
e A
1. M
anag
ing
the
Soc
cer T
eam
(Con
tinue
d)

12 © 2010 SRI International — Design and Development of Curriculum Units and Professional Development 13 Technical Report 07 June 2010
Less
onA
ctiv
ities
Mai
n
mat
hem
atic
al id
eas
Goa
ls
(stu
dent
s w
ill b
e ab
le to
)S
tory
line
5• S
lope
and
Rat
eTh
e de
finiti
ons
of ra
te, u
nit r
ate,
an
d sl
ope
can
be c
onne
cted
to
the
prev
ious
con
text
s an
d re
pres
enta
tions
. A tr
aditi
onal
way
to
cal
cula
te s
lope
is b
y cr
eatin
g tri
angl
es b
ased
on
rise/
run
as re
late
d to
a li
ne g
raph
.
1. U
nder
stan
d an
d us
e de
finiti
on o
f uni
t rat
e.
2. C
onne
ct u
nit r
ate
to s
lope
. Und
erst
and
slop
e as
a n
umer
ical
des
crip
tion
of th
e re
latio
nshi
p be
twee
n an
y tw
o po
ints
on
a lin
e.
This
act
ivity
is a
pur
e m
athe
mat
ics
time-
out t
o gi
ve m
athe
mat
ical
vo
cabu
lary
for t
he c
once
pts
expl
ored
mor
e in
form
ally
ear
lier.
6• O
n th
e R
oad
• Roa
d Tr
ips
Gra
phs
with
con
nect
ed li
ne
segm
ents
at d
iffer
ent s
lope
s ca
n re
pres
ent a
n ob
ject
mov
ing
at
diffe
rent
spe
eds
(with
x-a
xis
as ti
me,
y
as d
ista
nce)
• Pos
itive
slo
pe re
pres
ents
mov
ing
ahea
d (in
the
posi
tive
dire
ctio
n.)
• Neg
ativ
e sl
ope
repr
esen
ts
mov
ing
back
war
d (in
the
nega
tive
dire
ctio
n.)
• Whe
n th
e sl
ope
is 0
, the
re
pres
ente
d ob
ject
is n
ot m
ovin
g.
• The
leng
th o
f the
0 s
lope
line
se
gmen
t giv
es th
e pe
riod
of ti
me
the
obje
ct is
sta
ndin
g st
ill.
1. In
terp
ret g
raph
s re
pres
entin
g m
ovin
g ob
ject
s w
ith tw
o or
mor
e ra
tes;
giv
e co
ntex
tual
sto
ry
asso
ciat
ed w
ith e
ach
grap
h. G
iven
sto
ry, c
reat
e gr
aph.
2. M
ake
thes
e co
nnec
tions
/ int
erpr
etat
ions
:
• P
ositi
ve s
lope
mea
ns m
ovin
g ah
ead.
• N
egat
ive
slop
e m
eans
goi
ng b
ack.
• 0
slo
pe m
eans
sta
ndin
g st
ill.
• T
he le
ngth
of t
he 0
slo
pe li
ne in
dica
tes
how
long
st
andi
ng s
till.
The
team
has
a m
yste
rious
ly
bad
hist
ory
of m
akin
g tri
ps to
th
e st
ate
cham
pion
ship
s. T
he
trips
are
take
n w
ith b
oth
a bu
s an
d a
van.
Stu
dent
s ex
plor
e an
d cr
eate
sto
ries
that
mat
ch g
raph
s re
pres
entin
g th
ese
trips
.
7• G
raph
s an
d M
otio
nN
o ne
w m
athe
mat
ics
cont
ent
This
act
ivity
pro
vide
s pr
actic
e in
m
otio
n co
ntex
ts, i
nclu
ding
sin
gle-
an
d m
ultip
le-r
ate
mot
ions
and
th
e co
ordi
natio
n of
gra
phs
and
narr
ativ
es. I
t als
o he
lps
stud
ents
le
arn
to in
terp
ret “
on s
ight
” cer
tain
ty
pica
l mul
tirat
e lin
ear g
raph
s.
Rec
ogni
ze ty
pica
l gra
ph s
hape
s fo
r:
• Sta
ndin
g st
ill
• Goi
ng o
ne ra
te, t
hen
goin
g at
a fa
ster
rate
for t
he
sam
e am
ount
of t
ime
• Goi
ng o
ne ra
te, t
hen
goin
g at
a s
low
er ra
te fo
r the
sa
me
amou
nt o
f tim
e
• Goi
ng fo
rwar
d an
d th
en b
ackw
ard
at th
e sa
me
rate
Tabl
e A
1. M
anag
ing
the
Soc
cer T
eam
(Con
tinue
d)
12 © 2010 SRI International — Design and Development of Curriculum Units and Professional Development 13 Technical Report 07 June 2010
Less
onA
ctiv
ities
Mai
n
mat
hem
atic
al id
eas
Goa
ls
(stu
dent
s w
ill b
e ab
le to
)S
tory
line
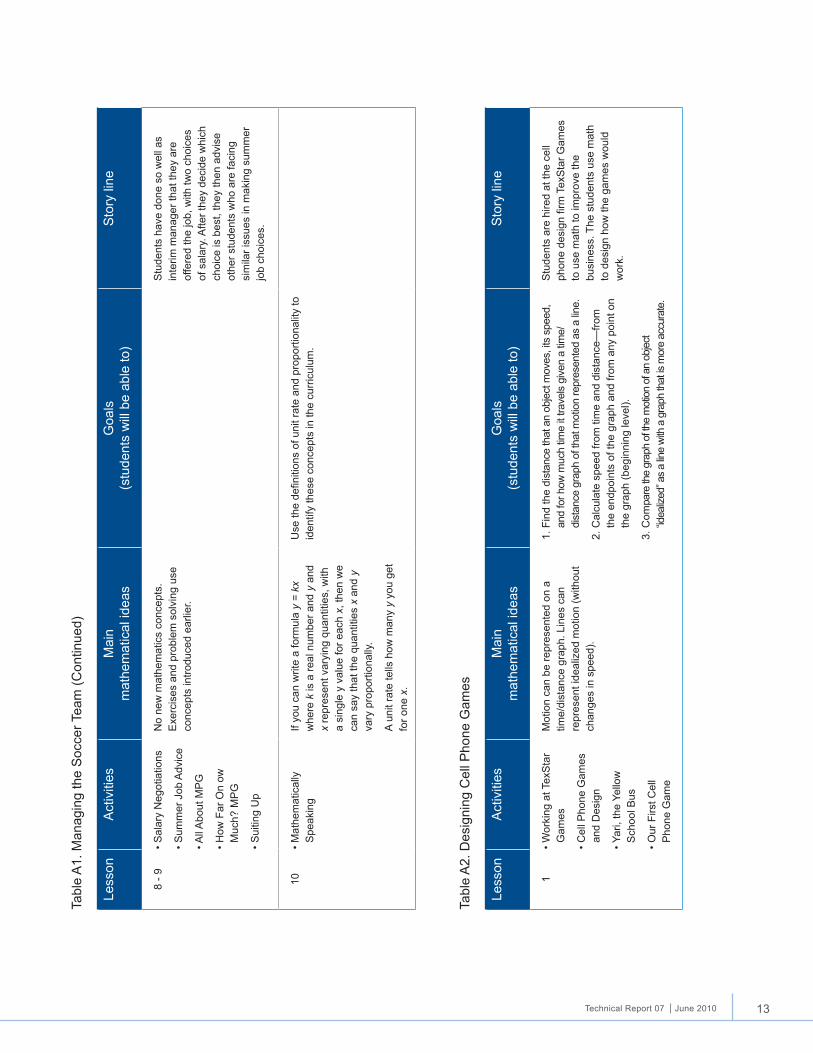
8 - 9
• Sal
ary
Neg
otia
tions
• Sum
mer
Job
Adv
ice
• All
Abo
ut M
PG
• How
Far
On
ow
Muc
h? M
PG
• Sui
ting
Up
No
new
mat
hem
atic
s co
ncep
ts.
Exe
rcis
es a
nd p
robl
em s
olvi
ng u
se
conc
epts
intro
duce
d ea
rlier
.
Stu
dent
s ha
ve d
one
so w
ell a
s in
terim
man
ager
that
they
are
of
fere
d th
e jo
b, w
ith tw
o ch
oice
s of
sal
ary.
Afte
r the
y de
cide
whi
ch
choi
ce is
bes
t, th
ey th
en a
dvis
e ot
her s
tude
nts
who
are
faci
ng
sim
ilar i
ssue
s in
mak
ing
sum
mer
jo
b ch
oice
s.
10• M
athe
mat
ical
ly
Spe
akin
gIf
you
can
writ
e a
form
ula
y =
kx
whe
re k
is a
real
num
ber a
nd y
and
x
repr
esen
t var
ying
qua
ntiti
es, w
ith
a si
ngle
y v
alue
for e
ach
x, th
en w
e ca
n sa
y th
at th
e qu
antit
ies
x an
d y
vary
pro
porti
onal
ly.
A un
it ra
te te
lls h
ow m
any
y yo
u ge
t fo
r one
x.
Use
the
defin
ition
s of
uni
t rat
e an
d pr
opor
tiona
lity
to
iden
tify
thes
e co
ncep
ts in
the
curr
icul
um.
Tabl
e A
1. M
anag
ing
the
Soc
cer T
eam
(Con
tinue
d)
Less
onA
ctiv
ities
Mai
n
mat
hem
atic
al id
eas
Goa
ls
(stu
dent
s w
ill b
e ab
le to
)S
tory
line
1• W
orki
ng a
t Tex
Sta
r G
ames
• Cel
l Pho
ne G
ames
an
d D
esig
n
• Yar
i, th
e Ye
llow
S
choo
l Bus
• Our
Firs
t Cel
l P
hone
Gam
e
Mot
ion
can
be re
pres
ente
d on
a
time/
dist
ance
gra
ph. L
ines
can
re
pres
ent i
deal
ized
mot
ion
(with
out
chan
ges
in s
peed
).
1. F
ind
the
dist
ance
that
an
obje
ct m
oves
, its
spe
ed,
and
for h
ow m
uch
time
it tra
vels
giv
en a
tim
e/di
stan
ce g
raph
of t
hat m
otio
n re
pres
ente
d as
a lin
e.
2. C
alcu
late
spe
ed fr
om ti
me
and
dist
ance
—fro
m
the
endp
oint
s of
the
grap
h an
d fro
m a
ny p
oint
on
the
grap
h (b
egin
ning
leve
l).
3. C
ompa
re th
e gr
aph
of th
e m
otio
n of
an
obje
ct
“idea
lized
” as
a lin
e w
ith a
gra
ph th
at is
mor
e ac
cura
te.
Stu
dent
s ar
e hi
red
at th
e ce
ll ph
one
desi
gn fi
rm T
exS
tar G
ames
to
use
mat
h to
impr
ove
the
busi
ness
. The
stu
dent
s us
e m
ath
to d
esig
n ho
w th
e ga
mes
wou
ld
wor
k.
Tabl
e A
2. D
esig
ning
Cel
l Pho
ne G
ames
14 © 2010 SRI International — Design and Development of Curriculum Units and Professional Development 15 Technical Report 07 June 2010
Less
onA
ctiv
ities
Mai
n
mat
hem
atic
al id
eas
Goa
ls
(stu
dent
s w
ill b
e ab
le to
)S
tory
line
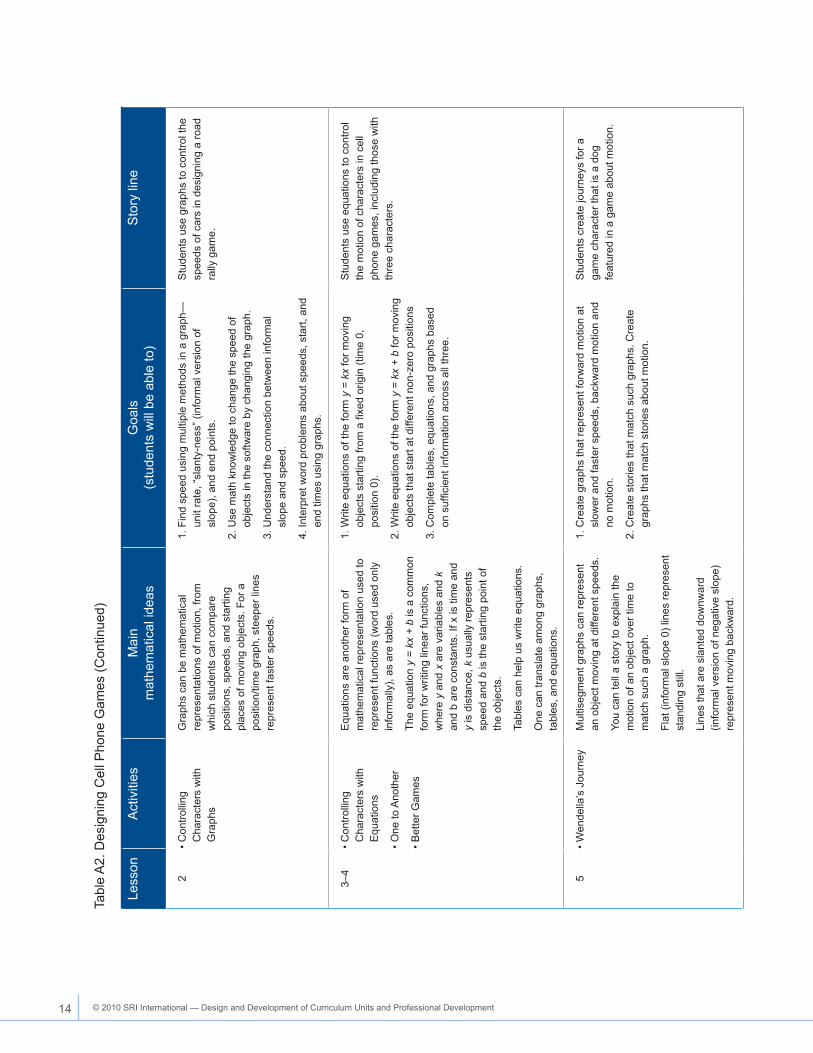
2• C
ontro
lling
C
hara
cter
s w
ith
Gra
phs
Gra
phs
can
be m
athe
mat
ical
re
pres
enta
tions
of m
otio
n, fr
om
whi
ch s
tude
nts
can
com
pare
po
sitio
ns, s
peed
s, a
nd s
tarti
ng
plac
es o
f mov
ing
obje
cts.
For
a
posi
tion/
time
grap
h, s
teep
er li
nes
repr
esen
t fas
ter s
peed
s.
1. F
ind
spee
d us
ing
mul
tiple
met
hods
in a
gra
ph—
unit
rate
, “sl
anty
-nes
s” (i
nfor
mal
ver
sion
of
slop
e), a
nd e
nd p
oint
s.
2. U
se m
ath
know
ledg
e to
cha
nge
the
spee
d of
ob
ject
s in
the
softw
are
by c
hang
ing
the
grap
h.
3. U
nder
stan
d th
e co
nnec
tion
betw
een
info
rmal
sl
ope
and
spee
d.
4. In
terp
ret w
ord
prob
lem
s ab
out s
peed
s, s
tart,
and
en
d tim
es u
sing
gra
phs.
Stu
dent
s us
e gr
aphs
to c
ontro
l the
sp
eeds
of c
ars
in d
esig
ning
a ro
ad
rally
gam
e.
3–4
• Con
trolli
ng
Cha
ract
ers
with
E
quat
ions
• One
to A
noth
er
• Bet
ter G
ames
Equ
atio
ns a
re a
noth
er fo
rm o
f m
athe
mat
ical
repr
esen
tatio
n us
ed to
re
pres
ent f
unct
ions
(wor
d us
ed o
nly
info
rmal
ly),
as a
re ta
bles
.
The
equa
tion
y =
kx +
b is
a c
omm
on
form
for w
ritin
g lin
ear f
unct
ions
, w
here
y a
nd x
are
var
iabl
es a
nd k
an
d b
are
cons
tant
s. If
x is
tim
e an
d y
is d
ista
nce,
k u
sual
ly re
pres
ents
sp
eed
and
b is
the
star
ting
poin
t of
the
obje
cts.
Tabl
es c
an h
elp
us w
rite
equa
tions
.
One
can
tran
slat
e am
ong
grap
hs,
tabl
es, a
nd e
quat
ions
.
1. W
rite
equa
tions
of t
he fo
rm y
= k
x fo
r mov
ing
obje
cts
star
ting
from
a fi
xed
orig
in (t
ime
0,
posi
tion
0).
2. W
rite
equa
tions
of t
he fo
rm y
= k
x +
b fo
r mov
ing
obje
cts
that
sta
rt at
diff
eren
t non
-zer
o po
sitio
ns
3. C
ompl
ete
tabl
es, e
quat
ions
, and
gra
phs
base
d on
suf
ficie
nt in
form
atio
n ac
ross
all
thre
e.
Stu
dent
s us
e eq
uatio
ns to
con
trol
the
mot
ion
of c
hara
cter
s in
cel
l ph
one
gam
es, i
nclu
ding
thos
e w
ith
thre
e ch
arac
ters
.
5• W
ende
lla’s
Jou
rney
Mul
tiseg
men
t gra
phs
can
repr
esen
t an
obj
ect m
ovin
g at
diff
eren
t spe
eds.
You
can
tell
a st
ory
to e
xpla
in th
e m
otio
n of
an
obje
ct o
ver t
ime
to
mat
ch s
uch
a gr
aph.
Flat
(inf
orm
al s
lope
0) l
ines
repr
esen
t st
andi
ng s
till.
Line
s th
at a
re s
lant
ed d
ownw
ard
(info
rmal
ver
sion
of n
egat
ive
slop
e)
repr
esen
t mov
ing
back
war
d.
1. C
reat
e gr
aphs
that
repr
esen
t for
war
d m
otio
n at
sl
ower
and
fast
er s
peed
s, b
ackw
ard
mot
ion
and
no m
otio
n.
2. C
reat
e st
orie
s th
at m
atch
suc
h gr
aphs
. Cre
ate
grap
hs th
at m
atch
sto
ries
abou
t mot
ion.
Stu
dent
s cr
eate
jour
neys
for a
ga
me
char
acte
r tha
t is
a do
g fe
atur
ed in
a g
ame
abou
t mot
ion.
Tabl
e A
2. D
esig
ning
Cel
l Pho
ne G
ames
(Con
tinue
d)
14 © 2010 SRI International — Design and Development of Curriculum Units and Professional Development 15 Technical Report 07 June 2010
Less
onA
ctiv
ities
Mai
n
mat
hem
atic
al id
eas
Goa
ls
(stu
dent
s w
ill b
e ab
le to
)S
tory
line
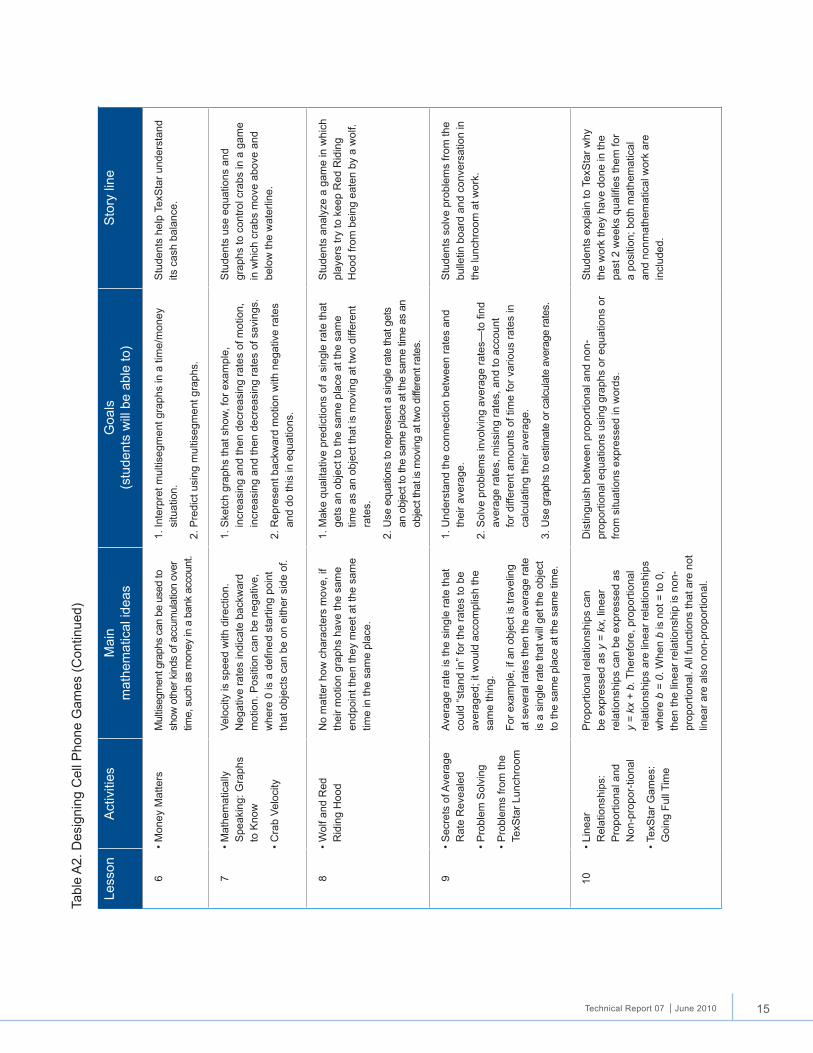
6• M
oney
Mat
ters
Mul
tiseg
men
t gra
phs
can
be u
sed
to
show
oth
er k
inds
of a
ccum
ulat
ion
over
tim
e, s
uch
as m
oney
in a
ban
k ac
coun
t.
1. In
terp
ret m
ultis
egm
ent g
raph
s in
a ti
me/
mon
ey
situ
atio
n.
2. P
redi
ct u
sing
mul
tiseg
men
t gra
phs.
Stu
dent
s he
lp T
exS
tar u
nder
stan
d its
cas
h ba
lanc
e.
7• M
athe
mat
ical
ly
Spe
akin
g: G
raph
s to
Kno
w
• Cra
b Ve
loci
ty
Velo
city
is s
peed
with
dire
ctio
n.
Neg
ativ
e ra
tes
indi
cate
bac
kwar
d m
otio
n. P
ositi
on c
an b
e ne
gativ
e,
whe
re 0
is a
defi
ned
star
ting
poin
t th
at o
bjec
ts c
an b
e on
eith
er s
ide
of.
1. S
ketc
h gr
aphs
that
sho
w, f
or e
xam
ple,
in
crea
sing
and
then
dec
reas
ing
rate
s of
mot
ion,
in
crea
sing
and
then
dec
reas
ing
rate
s of
sav
ings
.
2. R
epre
sent
bac
kwar
d m
otio
n w
ith n
egat
ive
rate
s an
d do
this
in e
quat
ions
.
Stu
dent
s us
e eq
uatio
ns a
nd
grap
hs to
con
trol c
rabs
in a
gam
e in
whi
ch c
rabs
mov
e ab
ove
and
belo
w th
e w
ater
line.
8• W
olf a
nd R
ed
Rid
ing
Hoo
dN
o m
atte
r how
cha
ract
ers
mov
e, if
th
eir m
otio
n gr
aphs
hav
e th
e sa
me
endp
oint
then
they
mee
t at t
he s
ame
time
in th
e sa
me
plac
e.
1. M
ake
qual
itativ
e pr
edic
tions
of a
sin
gle
rate
that
ge
ts a
n ob
ject
to th
e sa
me
plac
e at
the
sam
e tim
e as
an
obje
ct th
at is
mov
ing
at tw
o di
ffere
nt
rate
s.
2. U
se e
quat
ions
to re
pres
ent a
sin
gle
rate
that
get
s an
obj
ect t
o th
e sa
me
plac
e at
the
sam
e tim
e as
an
obje
ct th
at is
mov
ing
at tw
o di
ffere
nt ra
tes.
Stu
dent
s an
alyz
e a
gam
e in
whi
ch
play
ers
try to
kee
p R
ed R
idin
g H
ood
from
bei
ng e
aten
by
a w
olf.
9• S
ecre
ts o
f Ave
rage
R
ate
Rev
eale
d
• Pro
blem
Sol
ving
• Pro
blem
s fro
m th
e Te
xSta
r Lun
chro
om
Aver
age
rate
is th
e si
ngle
rate
that
co
uld
“sta
nd in
” for
the
rate
s to
be
aver
aged
; it w
ould
acc
ompl
ish
the
sam
e th
ing.
For e
xam
ple,
if a
n ob
ject
is tr
avel
ing
at s
ever
al ra
tes
then
the
aver
age
rate
is
a s
ingl
e ra
te th
at w
ill ge
t the
obj
ect
to th
e sa
me
plac
e at
the
sam
e tim
e.
1. U
nder
stan
d th
e co
nnec
tion
betw
een
rate
s an
d th
eir a
vera
ge.
2. S
olve
pro
blem
s in
volv
ing
aver
age
rate
s—to
find
av
erag
e ra
tes,
mis
sing
rate
s, a
nd to
acc
ount
fo
r diff
eren
t am
ount
s of
tim
e fo
r var
ious
rate
s in
ca
lcul
atin
g th
eir a
vera
ge.
3. U
se g
raph
s to
est
imat
e or
cal
cula
te a
vera
ge ra
tes.
Stu
dent
s so
lve
prob
lem
s fro
m th
e bu
lletin
boa
rd a
nd c
onve
rsat
ion
in
the
lunc
hroo
m a
t wor
k.
10• L
inea
r R
elat
ions
hips
: P
ropo
rtion
al a
nd
Non
-pro
por-
tiona
l
• Tex
Sta
r Gam
es:
Goi
ng F
ull T
ime
Pro
porti
onal
rela
tions
hips
can
be
exp
ress
ed a
s y
= kx
, lin
ear
rela
tions
hips
can
be
expr
esse
d as
y
= kx
+ b
. The
refo
re, p
ropo
rtion
al
rela
tions
hips
are
line
ar re
latio
nshi
ps
whe
re b
= 0
. Whe
n b
is n
ot =
to 0
, th
en th
e lin
ear r
elat
ions
hip
is n
on-
prop
ortio
nal.
All
func
tions
that
are
not
lin
ear a
re a
lso
non-
prop
ortio
nal.
Dis
tingu
ish
betw
een
prop
ortio
nal a
nd n
on-
prop
ortio
nal e
quat
ions
usi
ng g
raph
s or
equ
atio
ns o
r fro
m s
ituat
ions
exp
ress
ed in
wor
ds.
Stu
dent
s ex
plai
n to
Tex
Sta
r why
th
e w
ork
they
hav
e do
ne in
the
past
2 w
eeks
qua
lifies
them
for
a po
sitio
n; b
oth
mat
hem
atic
al
and
nonm
athe
mat
ical
wor
k ar
e in
clud
ed.
Tabl
e A
2. D
esig
ning
Cel
l Pho
ne G
ames
(Con
tinue
d)
Sponsor: The National Science Foundation, Grant REC - 0437861
Prime Grantee: SRI International. Center for Technology in Learning
Subgrantees: Virginia Polytechnic Institute and State University; University of Massachusetts, Dartmouth; The University of Texas at Austin; and The Charles A. Dana Center at The University of Texas at Austin
SRI InternationalCenter for Technology in Learning333 Ravenswood AvenueMenlo Park, CA 94025-3493650.859.2000
www.ctl.sri.comwww.math.sri.com